ams briefing on capital hill 4-25-2011
DESCRIPTION
For more information, see: http://www.ametsoc.org/atmospolicy/climatebriefing/TRANSCRIPT

Extreme Heat, Crop Yields, and the Poten6al Effects of Climate Change
on World Food Prices
Michael J. Roberts North Carolina State University
AMS Climate Briefing Series Washington, DC March 25, 211

Three Things
1. Some sta6s6cs about agriculture.
2. Basic economics of commodity prices.
3. How climate change could affect US crop yields.

One
A few sta6s6cs about agricultural produc6on

Four Key Crops (About 75% of world caloric base)

The United States Produc6on
39% of corn 38% soybeans 9% of wheat 2% of rice
Larger shares of world exports

US caloric share is about 23%
World fluctua6ons shadow US fluctua6ons

Produc6vity growth
Yield/Acre
Land Area

Dr. Norman E. Borlaug March 25, 1914 – September 12, 2009
“Dr. Norman Borlaug's remarkable life6me efforts to feed millions of less fortunate around the world will con6nue to inspire all those concerned with hunger and malnutri6on. His legacy includes billions of lives saved from the misery of starva6on and the educa6on of thousands of scien6sts worldwide who carry on his work today.”
hcp://www.normanborlaug.org/

Crop yields worldwide

Two
Basic Economics of Food Commodity Prices

Prices have trended down
Prices fluctua6ons propor6onately much larger than quan6ty fluctua6ons
Prices fluctuate together

Un6l Recently…

Factors Affec6ng Current Prices
• Accelera6ng demand growth – Popula6on – Higher incomes (in some places) drive meat demand
5-‐10 grain calories needed for 1 calorie of meat
• Ethanol: 40% of US corn crop • Weather shocks
• Produc6vity growth slowing down? • Small quan6ty shocks cause big price shocks

Supply and Demand Prices are sensi6ve to quan66es
Quan6ty
Price
Demand
Supply
Q
P Demand is steep because staples are 6ny share of retail price
Supply is steep due to limited amount of arable land

Supply and Demand Prices are sensi6ve to quan66es
Quan6ty
Price
Demand
Supply
Q0 Q1
P0
P1 Steep supply and demand curves are what make prices more vola6le than quan66es

Supply and Demand Prices are sensi6ve to quan66es
Quan6ty
Price
Demand
Supply
Q1 Q0
P0
P1 Steep supply and demand curves are what make prices more vola6le than quan66es

Bad yields can be good for farmers Prices are sensi6ve to quan66es
Quan6ty
Price
Demand
Supply
Q1 Q0
P0
P1 Bad weather shijs supply inward
Revenue with good weather

Bad yields can be good for farmers Prices are sensi6ve to quan66es
Quan6ty
Price
Demand
Supply
Q1 Q0
P0
P1
Revenue with bad weather
Bad weather shijs supply inward

Evidence for Price Sensi6vity
October 2010
USDA revises corn harvest forecast down by 4%
Corn prices go up 8% on same day
“Corn price in biggest surge since 1973 on fears of new food crisis” -‐-‐ Financial Times, Oct 11, 2011

Evidence for Price Sensi6vity
USDA harvest forecasts, 1994-‐2010
Unusual downward revision leads to price spike
Bushels/Acre
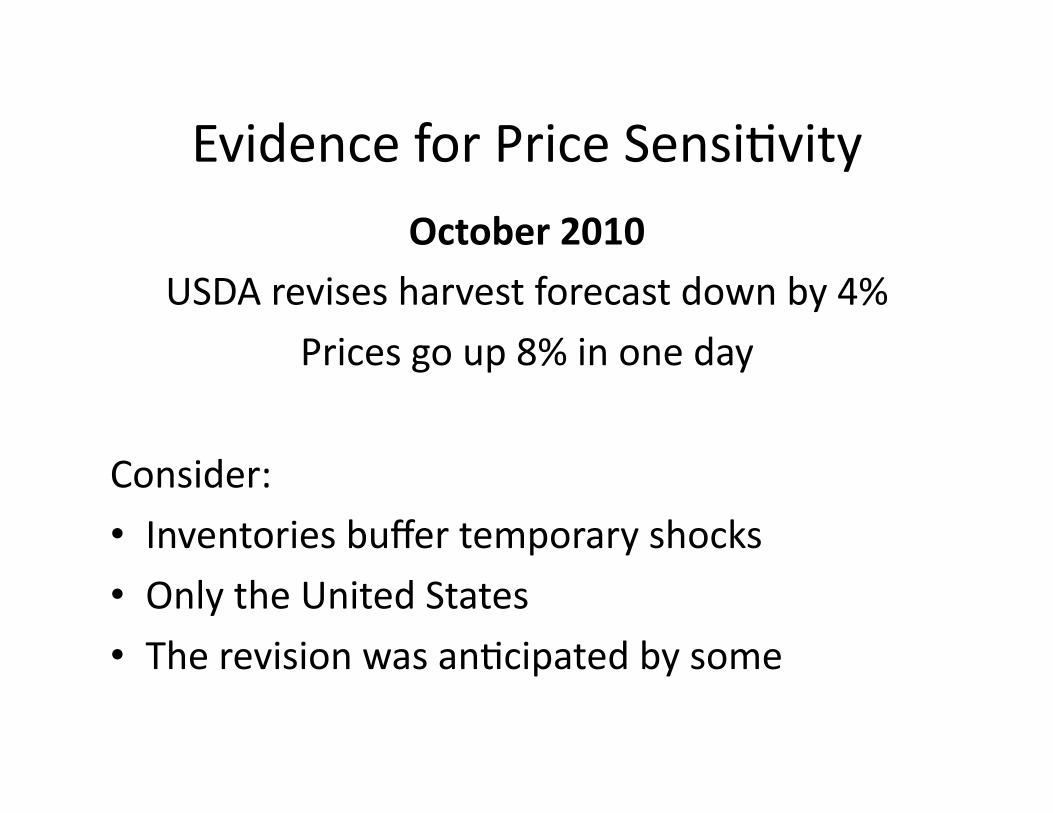
Evidence for Price Sensi6vity October 2010
USDA revises harvest forecast down by 4%
Prices go up 8% in one day
Consider:
• Inventories buffer temporary shocks
• Only the United States • The revision was an6cipated by some

Three
Poten6al Impacts of Climate Change on US Agriculture

How will climate change affect US agricultural produc6on?
Early projec6ons • Mostly op6mis6c, mainly due to a large posi6ve influence of CO2 fer6liza6on.
• Also, longer growing seasons in northern regions.
• Modest damages were projected from excess heat in southern regions.
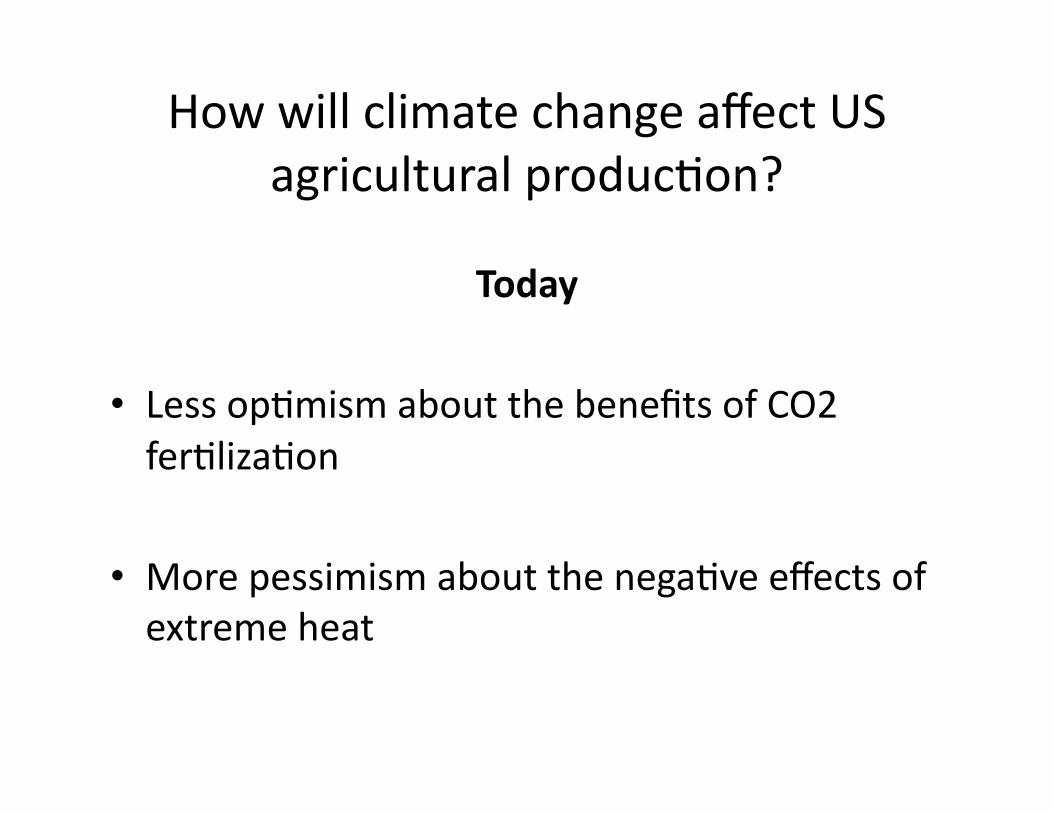
How will climate change affect US agricultural produc6on?
Today
• Less op6mism about the benefits of CO2 fer6liza6on
• More pessimism about the nega6ve effects of extreme heat

Extremes Macer Most
• Not too cold • Not too hot • Not too wet • Not too dry
How will climate change affect the frequency of extremes?

Extremes Macer Most
0 10 20 30 40 50
0.00
0.01
0.02
0.03
0.04
0.05
Temperature (C)
Rel
ativ
e Fe
quen
cyThreshold
Frequency ofExtreme Event

Extremes Macer Most
0 10 20 30 40 50
0.00
0.01
0.02
0.03
0.04
0.05
Temperature (C)
Rel
ativ
e Fe
quen
cy
Threshold
Frequency ofExtreme Event
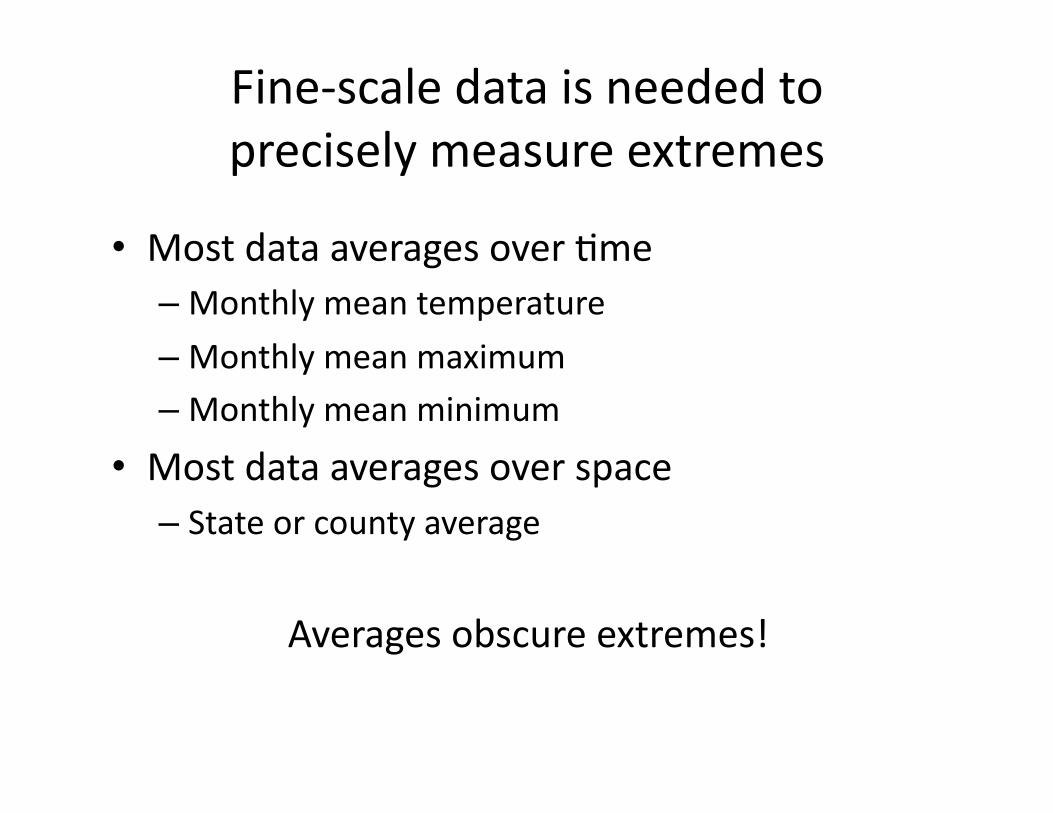
Fine-‐scale data is needed to precisely measure extremes
• Most data averages over 6me – Monthly mean temperature
– Monthly mean maximum – Monthly mean minimum
• Most data averages over space – State or county average
Averages obscure extremes!

Data Construc6on Pieces: – All individual weather sta6ons from NOAA on a daily 6me scale.
– Clean data by culling sta6ons that move or have too many missing observa6ons
– PRISM data (Oregon State University) gives monthly data on on a 2.5 arcmin scale (~4km) grid.
– We combine these two source to obtain daily weather on a 4km grid.
– Approximate 6me at each degree in each day in the loca6ons where crops are actually grown
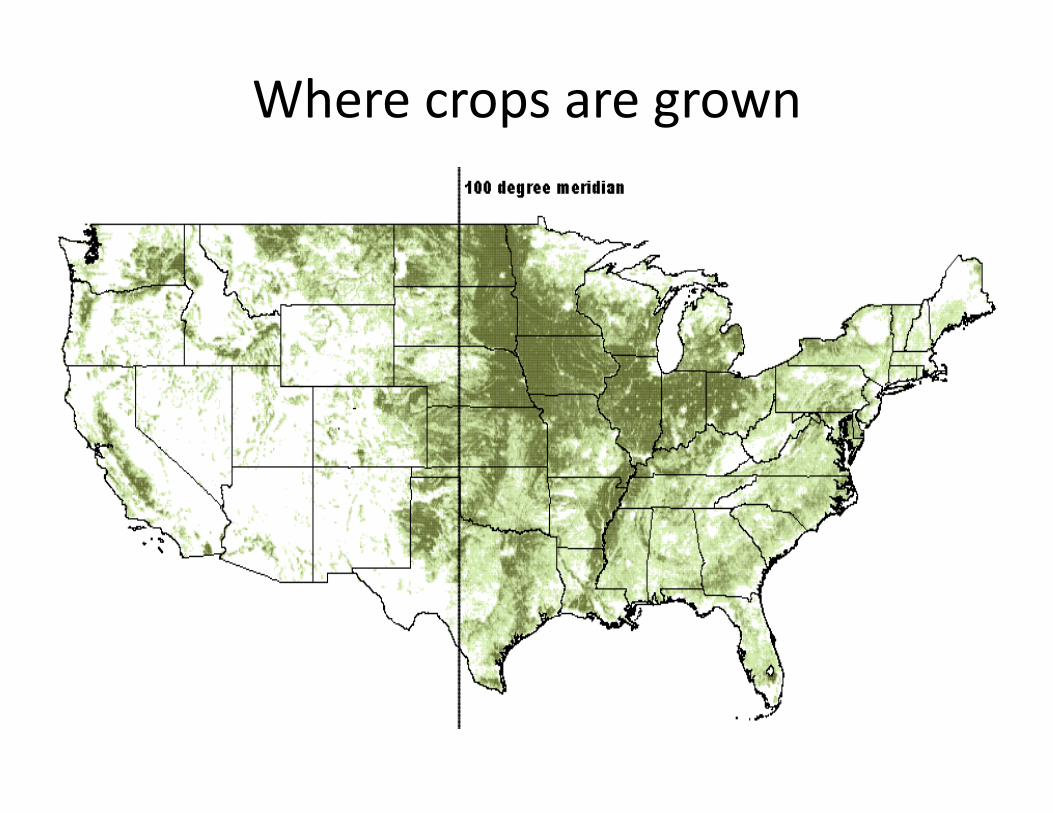
Where crops are grown

Extremes Macer Most
Degree Days > 29C
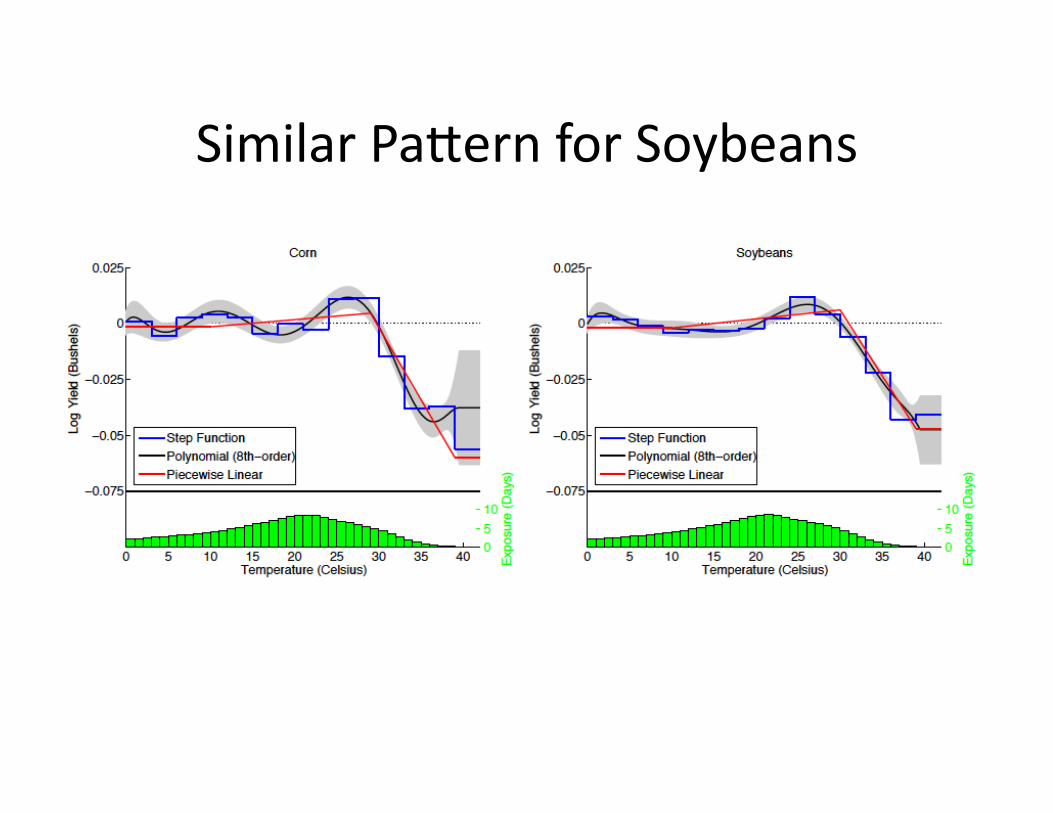
Similar Pacern for Soybeans

And for Cocon

Becer Predic6ons
New models Old models

Indiana Extreme Heat, 1901-‐2005
Predicted Increase 2070-‐2099—slow warming scenario

Crop sensi6vity to extreme heat appears to be declining

2020-‐2049 Impacts, holding growing areas & CO2 fixed
Different CO2 emissions scenarios

2070-‐2099 Impacts, holding growing areas areas & CO2 fixed

Why do US Impacts Macer ?
• The US is the world’s largest producer and exporter of staple agricultural commodi6es
• Impacts here would have a big influence on world prices
• For 2 billion people living on $2/day or less, it’s a big deal
• Big price increases could quickly make agriculture a larger share of GDP, and a benefit to US farmers