an agenda for jobs - amazon s3
TRANSCRIPT

2019ANNUAL PROGRESS
REPORT
IMPLEMENTATION OF THE MEDIUM-TERM NATIONAL
DEVELOPMENT AGENDA
AN AGENDA FOR JOBS: CREATING PROSPERITY AND EQUAL OPPORTUNITY FOR ALL (2018-2021)
National Development Planning Commission
National DevelopmentPlanning Commission
REPUBLIC OF GHANA

ii
iii
ContentsExecutive Summary.................................................................................................................................................xii
Chapter 1.................................................................................................................................................................1Introduction................................................................................................................................................................11.0. Background........................................................................................................................................................11.1. Objectives...........................................................................................................................................................11.2. Preparation Process..........................................................................................................................................11.3 Data Availability, Quality And Related Matters...................................................................................................21.4 Overview..............................................................................................................................................................21.5 The Potential Impact Of Covid-19......................................................................................................................31.6 Arrangements Of The Chapters.........................................................................................................................4
Chapter 2..................................................................................................................................................................5Implementation of The Medium-Term National Development Policy Framework.................................................52.1 Economic Development...................................................................................................................................52.1.1 Introduction ......................................................................................................................................................52.1.2 Progress Of Implementation...........................................................................................................................62.1.2.1 Strong and Resilient Economy....................................................................................................................62.1.2.2 Industrial Transformation............................................................................................................................112.1.2.3 Private Sector Development......................................................................................................................122.1.2.4 Agriculture and Rural Development...........................................................................................................122.1.2.5 Fisheries and Aquaculture Development..................................................................................................122.1.2.6 Tourism and Creative Arts Development...................................................................................................132.1.3 Key Challenges And Policy Recommendations..........................................................................................132.2 Social Development ......................................................................................................................................142.2.1 Introduction ....................................................................................................................................................142.2.2 Progress Of Implementation..........................................................................................................................142.2.2.1 Education and Training...............................................................................................................................142.2.2.2 Health and Health Services........................................................................................................................152.2.2.3 Disability, Morbidity, and Mortality..............................................................................................................152.2.2.4 HIV, AIDS and STIs ...................................................................................................................................162.2.2.5 Food and Nutrition Security........................................................................................................................162.2.2.6 Population Management............................................................................................................................172.2.2.7 Water and Environmental Sanitation.........................................................................................................172.2.2.8 Poverty and Inequality.................................................................................................................................182.2.2.9 Child and Family Welfare...........................................................................................................................182.2.2.10 Support for the Aged................................................................................................................................192.2.2.11 Gender Equality........................................................................................................................................202.2.2.12 Social Protection ......................................................................................................................................202.2.2.13 Disability and Development.....................................................................................................................202.2.2.14 Employment and Decent Work...............................................................................................................202.2.2.15 Youth Development..................................................................................................................................212.2.2.16 Sports and Recreation ............................................................................................................................212.2.3 Key Challenges And Policy Recommendations..........................................................................................22
2.3 Environment, Infrastructure And Human Settlements............................................................................232.3.1 Introduction ....................................................................................................................................................232.3.2 Progress Of Implementation.........................................................................................................................232.3.2.1 Forest..........................................................................................................................................................232.3.2.2 Water Resources Management ..............................................................................................................23

iv
2.3.2.3 Environment ..............................................................................................................................................242.3.2.4 Minerals Extraction....................................................................................................................................242.3.2.5 Disaster Management...............................................................................................................................242.3.2.6 Transportation: air, rail, water and road...................................................................................................252.3.2.7 Science, Technology and Innovation.......................................................................................................262.3.2.8 Energy and Petroleum..............................................................................................................................262.3.2.9 Human Settlements Development and Housing....................................................................................262.3.2.10 Land Administration and Management...................................................................................................272.3.2.11 Zongos and Inner Cities Development....................................................................................................272.3.3 Key Challenges And Policy Recommendations...........................................................................................27
2.4 Governance, Corruption And Public Accountability................................................................................282.4.1 Introduction ....................................................................................................................................................282.4.2 Progress Of Implementation.........................................................................................................................292.4.2.1 Deepening Democratic Governance........................................................................................................292.4.2.2 Accelerating and Sustaining Decentralisation ..........................................................................................292.4.2.3 Enhancing Public Accountability................................................................................................................292.4.2.5 Human Security and Public Safety............................................................................................................302.4.2.6 Corruption and Economic Crimes.............................................................................................................302.4.2.7 Law and Order............................................................................................................................................312.4.2.8 Civil Society and Civic Engagement..........................................................................................................312.4.2.9 Development Communication...................................................................................................................312.4.2.10 Culture for National Development...........................................................................................................312.4.3 Key Challenges And Policy Recommendations..........................................................................................32
2.5 Ghana’s Role In International Affairs..........................................................................................................322.5.1 Introduction ....................................................................................................................................................322.5.2 Progress Of Implementation.........................................................................................................................322.5.2.1 Extent of penetration of Ghanaian products in foreign markets..............................................................322.5.2.2 Degree of implementation of the Representation of the People Amendment Act, 2006 (Act 699).......332.5.2.3 Turn-around time for processing biometric passports..............................................................................332.5.2.4 Level of contribution of Ghana’s peacekeeping efforts ............................................................................332.5.2.5 Number of Ghanaians occupying positions in International Organisations............................................342.5.3 Key Challenges And Policy Recommendations..........................................................................................34
2.6 Linking The 2019 Budget To The Implementation Of The Policy Framework.....................................342.6.1 Introduction ....................................................................................................................................................342.6.2 Sector Allocation And Expenditure...............................................................................................................342.6.2.3 Flagship Programmes and Projects (FPPs).............................................................................................352.6.3 Poverty Reduction Spending In 2019..........................................................................................................372.6.4 Key Challenges And Policy Recommendations..........................................................................................38
2.7 Implementing the MTNDPF at the district level.........................................................................................382.7.1 Introduction ....................................................................................................................................................382.7.2 Progress Of Implementation.........................................................................................................................392.7.2.1 Financing District Level Development.......................................................................................................392.7.2.2 Expenditure of Metropolitan, Municipal and District Assemblies.............................................................392.7.2.3 Human Resource Status of MMDAs.........................................................................................................402.7.2.5 Selected Poverty-Reduction Programmes...............................................................................................412.7.2.6 Assessment of District Outcomes.............................................................................................................442.7.3 Key Challenges And Policy Recommendations..........................................................................................49

v
Chapter 3................................................................................................................................................................50Conclusions ............................................................................................................................................................50Appendices............................................................................................................................................................52Appendix I: Economic Development......................................................................................................................52Appendix A2.6: Summary Of Performance Of Key Economic Development Indicators ...................................55

vi

vii
LIST OF TABLES AND FIGURESTABLES
Table 2.1: Real Sector Growth Rates (%), 2017-20................................................................................................7
Table 2.2: Agriculture Subsector Growth Rates, 2017-2019 (%)...........................................................................7
Table 2.3: Industry Subsector Growth Rates, 2011-2019 (%)...............................................................................8
Table 2.4: Services Subsector Growth Rates, 2017-2019* (%).............................................................................8
Table 2.5: Summary of Central Government Operations for 2019.......................................................................10
Table 2.6: Summary of Central Government Budget Balance and Financing for 2019......................................11
Table 2.7: Trade Balance, 2017-2019......................................................................................................................11
Table 2.8: Estimates of Fish Landings (of all Fleets), 2017-2019.........................................................................12
Table 2.9: Performance of Key Sector Indicators..................................................................................................13
Table 2.10: Key challenges and recommendations for Economic Development...............................................13
Table 2.11: Net Enrolment rate, 2016/17-2017/18.................................................................................................14
Table 2.12: Proficiency rate (%)..............................................................................................................................15
Table 2.13: Dimensional Deprivation Rates of Children 0-17 years by Area of Residence and Regional Profiles, (%)..............................................................................................................................................19
Table 2.14: Key challenges and recommendations for Social Development......................................................22
Table 2.15: Key challenges and recommendations for Environment, Infrastructure and Human Settlements................................................................................................................................................28
Table 2.16: Key challenges and recommendations for Governance, Corruption and Public Accountability............................................................................................................................................................32
Table 2.17: Key challenges and recommendations for Ghana’s Role in International Affairs............................34
Table 2.18: FPPs by Development dimensions.....................................................................................................36
Table 2.19: Ranking of Top Five Priorities of Government per Budget and Expenditure....................................37
Table 2.20: 2019 Budget Allocation towards SGD1 (No Poverty) for MDAs/MMDAs (in GH¢ million).............38
Table 2.21: Key challenges and recommendations for Ghana’s Role in International Affairs............................38
Table 2.22: Revenue of MMDAs by Sources, 2017-2019....................................................................................39
Table 2.23: Summary of Expenditure of Metropolitan, Municipal and District Assemblies (MMDAs) in 2019.....................................................................................................................................................39
Table 2.24: Staff strength of MMDAs in 2019........................................................................................................40
Table 2.25: Regional distribution of NHIS subscribers by region in 2019............................................................40
Table 2.26: Capitation Grant Disbursement, 2018/2019 Academic Year ............................................................41
Table 2.27: Key challenges and recommendations for Implementing the MTNDPF at the District Level..........48
FIGURES
Figure 2.1: Sectoral Contribution to GDP, 2017-2019 (%)......................................................................................8
Figure 2.2: Energy Consumption by Industry, 2017 - 2019...................................................................................11
Figure 2.3: Number of Functional CHPS Zones....................................................................................................15
Figure 2.4: Institutional Maternal Mortality Ratio (iMMR), per 100,000 live births...............................................15
Figure 2.5: Proportion of children 0-17 years who are deprived in the eight poverty dimensions, (%).............18

viii
Figure 2.6: Water Quality Index (%)..........................................................................................................................24
Figure 2.7: Passenger traffic & Freight movement by air, 2017-2019....................................................................25
Figure 2.8: Number of Road Crashes, Fatalities and Serous Injuries, 2017-2019................................................26
Figure 2.9: STI adoption and commercialisation, 2017-2019..................................................................................26
Figure 2.10: Distribution and Transmission Losses, 2017-2019.............................................................................27
Figure 2.11: Number of people directly impacted through slums/zongo upgrading interventions under the Zongo Development Fund.........................................................................................................................................28
Figure 2.12: Budgetary allocation to IGIs, 2018&2019............................................................................................30
Figure 2.13: MMDA share of total revenue, 2017-2019 (%)...................................................................................30
Figure 2.14: Sectorial allocation and expenditure, GHc..........................................................................................35
Figure 2.15: Government Budget and Actual Expenditure of FPPs by Development Dimensions....................37
Figure 2.16: Proportion of AAPs implementation in 2019, (%)...............................................................................40
Figure 2.17: Number of LEAP beneficiaries per regional, 2019.............................................................................43
Figure 2.18: Gender distribution of Job creation by Planting for Food and Jobs Initiative....................................44
Figure 2.19: Number of Operational Health Facilities per Region, 2019...............................................................47

ix
LIST OF ACRONYMS AND ABBREVIATIONS
1D1F One District One FactoryAAP Annual Action PlanADB Agricultural Development Bank ADR Alternative Dispute ResolutionAfCFTA African Continental Free Trade Area AGI Association of Ghana IndustriesAIB Accident Investigation BureauAIDS AcquiredImmunodeficiency
SyndromeAMISOM African Union Mission in Somalia ANS Air Navigation ServicesAPRs Annual Progress ReportsART Antiretroviral TherapyASA Africa Sankofa Account AU African UnionBOG Bank of GhanaBOP Business Operating Permit BRT Bus Rapid Transit CHPS Community-based Health Planning
and Services CHRAJ Commission for Human Rights and
Administrative JusticeCLASS Complimentary Livelihood Asset
Support Scheme CMMP Capital Market Master Plan COP Conference of the Parties CPESDP Coordinated Programme of Economic
and Social Development PoliciesCPI Corruption Perception IndexCRP Clean Rivers ProgrammeCSOs Civil Society Organisations DACF District Assemblies Common FundDDF District Development Facility DOVVSU Domestic Violence and Victims
Support Unit DPCU District Planning Coordinating UnitDPs Development PartnersDTT Digital Terrestrial TelevisionEC Electoral CommissionECF Extended Credit FacilityECG Electricity Company of GhanaECOWAS Economic Commission of West
African StatesECTIB Economic Trade and Investment
BureauEOCO EconomicandOrganisedCrimeOfficeEPCC Economic Policy Coordinating
Committee ESRP Energy Sector Recovery Programme
EXIM Export Import Bank FAO Food and Agriculture OrganizationFOBs Forward Operating BasesFPPs Flagship Programmes and ProjectsFSO ForeignServiceOfficersGACC Ghana Civil Aviation AuthorityGAF Ghana Armed ForcesGAT Ghana Amalgamated Trust GBP British Pound SterlingGCB Ghana Commercial BankGCI Global Competitiveness IndexGCX Ghana Commodity Exchange GDP Gross Domestic Product GEPA Ghana Export Promotion AuthorityGES Ghana Education ServiceGFA Ghana Football AssociationGFZB Ghana Free Zones Board GHG Greenhouse GasGIR Gross International Reserves GIRSAL Ghana Incentive-based Risk Sharing
System for Agricultural LendingGLSS Ghana Living Standards SurveyGNCCI Ghana National Chamber of
Commerce and Industry GNFS Ghana National Fire ServiceGoG Government of GhanaGRIC Ghana Innovation and Research
Commercialization CentreGS Ghana StandardGSFP Ghana School Feeding ProgrammeGSS Ghana Statistical ServicesGWh Gigawatt hoursHIV HumanImmunodeficiencyVirusHR Human ResourceHRMIS Human Resource Management
Information System ICT Information and Communications
Technology IGF Internally Generated Funds IMCIM Inter-Ministerial Committee on Illegal
MiningIMF International Monetary FundiMMR Institutional maternal mortality ratio IPEP Infrastructure for Poverty Eradication
Programme ISKVD Infectious Spleen and Kidney Virus
Disease IUU Illegal, Unreported and UnregulatedJHS Junior High SchoolKm Kilometre

x
Ktoe Kilotonnes of oil Equivalent LD Labour DepartmentLEAP Livelihood Empowerment Against
Poverty LI Legislative Instrument MASLOC MicrofinanceandSmallLoansCentreMDAs Ministries, Departments and AgenciesMDSI Ministry of Special Development
InitiativeMELR Ministry of Employment and Labour
RelationsMFI MicrofinanceInstitutesMICE Meeting, Incentive, Conference, &
Exhibition MINURSO United Nations Mission for the
Referendum in Western Sahara MINUSCA United Nations Multidimensional
Integrated Stabilisation Mission in the Central African Republic MINUSMA United Nations Multidimensional
Integrated Stabilisation Mission in Mali
MLGRD Ministry of Local Government and Rural Development
MMDAs Metropolitan, Municipal and District Assemblies
MMTL Metro Mass Transit LimitedMoE Ministry of EducationMoF Ministry of FinanceMoFA Ministry of Food and AgricultureMoFAD Ministry of Fisheries and Aquaculture
DevelopmentMoFARI Ministry of Foreign Affairs and
Regional IntegrationMONUSCO Mission de l’Organisation des
Nations Unies pour la stabilisation en République démocratique du Congo MOT Ministry of TransportMoTI Ministry of Trade and Industry MPC Monetary Policy CommitteeMPI Multidimensional Poverty Index MPR Monetary Policy RateMTCO2e Metric Tons of Carbon Dioxide
EquivalentMTN Mobile Telephone NetworkMTNDPF Medium-Term National Development
Policy Framework MW MegawattsNABCO Nation Builders Corp NABTEX National Board for Technical
Examination NACAP National Anti-Corruption Action Plan
NADMO National Disaster Management Organisation
NBSSI National Board for Small Scale Industries
NCCE National Commission for Civic Education
NCPD National Council for Person’s with Disability
NDCs Nationally Determined Contributions NDPC National Development Planning
CommissionNEIP National Entrepreneurship and
Innovation Programme NER Net Enrolment Rate NHIS National Health Insurance SchemeNHMF National Housing and Mortgage Fund NHMS National Housing and Mortgage
SchemeNIR Net International Reserves NLC National Labour Commission NMC National Media CommissionNPL Non-performing Loans NPRA National Pensions Regulatory
Authority NRSA National Road Safety AuthorityNTC National Tripartite Committee OHLGS OfficeoftheHeadofLocal
Government ServiceOmniBSIC OmniBSIC Bank Ghana Limited OPD Out-patient Department OVT Operation Vanguard TaskforcePAC Public Accounts CommitteePACSTI Presidential Advisory Council on
Science, Technology and InnovationPBL Prudential Bank Limited PEF Private Enterprises Foundation PFJ Planting for Food & JobsPLHIV People Living with Human
ImmunodeficiencyVirusPSRRP Public Sector Reform for Results
ProjectPSRS Public Sector Reform SecretariatPURC Public Utilities Regulatory
CommissionPWDs Persons with Disabilities R&D Research and Development REITs Real Estate Investment Trusts REP RuralElectrificationProjectRFA Regional Football Association ROPAA Representation of the People
Amendment ActS&Ls Savings and Loans Companies SDFs Spatial Development Frameworks

xi
SDGs Sustainable Development GoalsSDIs Specialised Deposit-Taking Institutions SEC Securities and Exchange CommissionSHS Senior High SchoolSIGA State Interests and Governance Authority SME Small and Medium EnterprisesSOWC State of the World’s ChildrenSPs Structure PlansSPV Special Purpose VehicleSTI Science, Technology and InnovationSTIs Sexually Transmitted InfectionsTDC Tema Development CorporationTOR Terms of ReferenceTVET Technical and Vocational Education and Training UG University of GhanaUMB Universal Merchant Bank UN United NationsUNAMID United Nations African Union Mission in Darfur, Sudan UNDOF United Nations Disengagement Observer Force UNFCCC United Nations Framework Convention on Climate Change UNICEF United Nations Children’s FundUNIFIL United Nations Interim Force in Lebanon UNISFA United Nations Interim Security Force for Abyei UNMISS United Nations Mission in South Sudan USD United States DollarVRA Volta River AuthorityWAPP West Africa Power PoolYDI Youth Development Index YLSTI Youth Leadership and Skills Training Institute

xii
Executive Summary
IntroductionThe 2019 national APR assessed the progress of implementation of the medium-term national development policy framework. The assessment was based on five development dimensions – economic; social; environment, infrastructure and human settlements; governance, corruption and public accountability; and Ghana’s role in international affairs. Linking the 2019 Budget to the implementation of the policy framework and implementing the MTNDPF at the district level was also assessed. This report shares the outcomes of the assessment together with the identified challenges and proffers policy recommendations.
Economic dimension
The overall goal for the dimension was to build a prosperous society. This was achieved through broad objectives across six focus areas. The programmes and activities undertaken in 2019 under these areas led to significant achievement in inflation rate; decrease in the ratio of non-performing loans; rise in tourist arrivals and gains in tourism receipts; and average increase in productivity of selected staple crops.
The Ghana cedi underperformed against the three major currencies as the GDP growth targets were missed. There was inadequate financing for SMEs due to fiscal constraints within the private sector as a result of contractions in market coverage, long term finance, high cost of accessing capital and low innovation capacity. Also, there was inadequate private investment in agribusiness; proliferation of illegal and unregulated fishing methods; poor storage and transportation systems; low transfer and uptake of research findings by stakeholders; and untimely release of planting materials and certified seeds.
Key policy recommendations include the expediting of processes for establishing a National Development Financial Institution (Development Bank) that will provide long term loans at affordable rates to businesses and industry; liaising with external financing institutions to provide subsidized financing for identifiable groups and SMEs to accelerate the industrial transformation and create employment, especially for the youth; and promote the development of commodity value chains to boost investments, and support innovation and adoption of improved local fishery production for domestic consumption and exports.
Social dimension
The goal of the social dimension was to create opportunities for all Ghanaians. This was achieved through broad objectives across 14 focus areas. The accomplishments under this dimension include improvements in total enrolment at all levels of education, increased net enrolment at Senior High School (SHS) and transition rates from junior to senior high schools. The nurse-to-population ratio exceeded the sector target. The share of remittances in Gross Domestic Product (GDP) witnessed an increase of 31.7 percent over the previous year. There was also an improvement in the coverage of the Livelihood Empowerment Against Poverty (LEAP) programme with the establishment of 3,111 new LEAP communities across all the 260 districts.
Despite the recorded achievements, there were some challenges including declining net enrolment at the kindergarten, primary and JHS levels; poor diets and high micronutrient deficiencies; inadequate access to basic water and sanitation services; high incidence of multidimensional poverty; and continued limited representation of women in politics and public life.
The key policy recommendations proposed under the social dimension include instituting measures to improve net enrolment and educational outcomes; prioritising health promotion, especially on the importance of diets and its implications on morbidity and mortality; enhancing investments in the provision of adequate basic water and sanitation services; and expediting the passage of the Affirmative Action (Gender Equality) Bill and ensuring its full implementation.

xiii
Environment, infrastructure and human settlements
The goal of the dimension was to safeguard the natural environment and ensure a resilient built environment. This was achieved through broad objectives across 20 focus areas. The achievements for this dimension include the creation of 83,000 jobs under the forest plantation programme; the approval of the Digital Terrestrial Television (DTT) policy and Energy Sector Recovery Programme (ESRP) and; the enactment of the National Road Safety Authority (NRSA) Act, 2019 (Act 993), Ghana Integrated Iron and Steel Development Corporation Act, 2019 (Act 988) and Biosafety (Management of Biotechnology) Regulations, 2019 (L.I. 2383).
However, some challenges were observed in this dimension, including ineffective regulatory regime within the railway sector; limited financial viability of the energy sector; inadequate housing units and abandoned uncompleted affordable housing projects; absence of a national carrier to support the hub vision; low priority of Spatial Planning (Structure and Local Plans); and Illegal mining and pollution of water bodies.
Key policy recommendations under this dimension include Intensifying measures to stop illegal small-scale mining (galamsey) in collaboration with communities and traditional authorities; fully implementing the Energy Sector Recovery Programme; intensifying efforts to establish a home-based carrier while sustaining upgrades and development activities at airports; accelerating the recruitment of skilled physical planners to help develop and implement spatial plans (Structure and local plans) at the sub-national level to reduce haphazard development; and integrating government guarantees into incentive measures to attract private sector investments in the housing sector.
Governance, corruption and public accountability
The goal for this dimension was to maintain a stable, united and safe country. This was achieved through broad objectives across 11 focus areas. Some observable achievements were: passage of 13 Bills into law; enactment of 15 Legislative Instruments; ratification of 16 International Agreements; improvements in Police officer to citizen ratio and Fire officer to citizen ratio; and recovery of GH¢862,696.52 from implementation of 139 recommendations of the Public Accounts Committee.
Some key challenges identified included: inadequate resources for some independent governance institutions (IGIs); increase in crime; congestion in prisons; limited engagement with citizenry on development efforts; and delays in implementation of PAC recommendations.
Key policy recommendations proposed under this dimension include increasing financial resource allocation and timely release of funds to IGIs; strengthening coordination and monitoring of the implementation of National Anti-Corruption Action Plan (NACAP); improving police visibility across the country; adopting non-custodial sentencing as a measure to decongest prisons; and promoting the utilization of existing platforms to enhance development communication at all levels.
Ghana’s role in international affairs
The overall goal of this dimension was to strengthen Ghana’s role in international affairs. This was achieved through four broad objectives. Some remarkable achievements recorded include the reappointment of His Excellency President Nana Addo Dankwa Akuffo-Addo as Co-Chair of the Eminent Group of Advocates for the SDGs; mainstreaming of the SDGs and Africa Union’s Agenda 2063 into the planning and budgeting processes; the visit by the President of the 73rd United Nations General Assembly, H. E María Fernanda Espinosa Garcés to help strengthen multilateral relations; and the visit of His Excellency President Nana Addo Dankwa Akuffo-Addo to Barbados, resulting in the request for supply of 375 Ghanaian nurses to boost healthcare delivery in that country.
However, some notable challenges were encountered during 2019. These were inadequate trade fair facilities and delay in implementation of ROPAA.

xiv
Key policy recommendations include expediting the redevelopment of the Trade Fair Centre to help make Ghana a trade hub as the country hosts the AfCFTA Secretariat; and expediting actions on the technical and administrative modalities for the implementation of the ROPAA roadmap.
Linking the 2019 budget to the implementation of the policy framework
This section assessed the linkage between the 2019 budgetary allocations and the priorities of the MTNDPF, 2018-2021. It further examined expenditure on government’s 18 flagship programmes and projects, the distribution of discretionary expenditure, the alignment of 2019 spending priorities with the thematic areas of the MTNDPF and an analysis of the budgetary allocation to Sustainable Development Goal 1 (SDG 1). The report recommended an increase in budgetary allocation and expenditure on critical infrastructure to accelerate growth and economic transformation, and for government to ensure fiscal discipline in the implementation of the flagship projects and programmes.
Implementing the MTNDPF at the District Level
This section assessed the progress made in implementing the MTNDPF at the district level. It analyses the income and expenditure of Metropolitan, Municipal and District Assemblies (MMDAs) for plan implementation, monitoring and evaluation. It also assesses the staff strength of the MMDAs to carry out their mandates. The section concludes with a performance review of selected poverty-reduction interventions and the twenty core district indicators.
There was an increase in Internally Generated Funds and District Development Facility 1 by 13 percent and 54 percent respectively over the 2018 period. Besides, the 1D1F initiative provided direct and indirect jobs, thereby improving the well-being of Ghanaians at the local level. Moreover, Ahanta West and Accra Metropolitan Assembly were the only districts in 2019 that achieved the minimum staffing requirement per the Office of the Head of Local Government Service (OHLGS) staffing norms. Nevertheless, a high percentage of Annual Action Plans were implemented2 in 2019, with MMDAs in Greater Accra region implementing, on average, a higher proportion of their annual action plans.
The key challenges identified were low internally generated funds collection by MMDAs; inadequate staff at the regional and district level; limited regional coverage of operational 1D1F initiatives; and inability of MMDAs to complete the implementation of their annual action plans.
Key policy recommendations include: enhancing the human resource capacity at the regional and district levels; facilitating the expansion and completion of 1D1F initiatives to provide employment opportunities at the districts level; passage of the Local Government and Municipal Finances Bill to enable MMDAs diversify their sources of funding; and strengthening inter-sectorial collaboration among the Ministry of Local Government and Rural Development, Office of the Head of Local Government Service, the Ministry of Finance, and NDPC to address administrative and operational challenges of DPCU and RPCUs.
1 DDF-one of the funding mechanisms of projects and programmes at the district level. It is a discretionary funding in-centive by government to MMDAs which comply with the rules, legal regulations and policies in the performance of their mandate. Compliance is confirmed through an assessment conducted on yearly basis using the District Performance Assessment Tool (DPAT).
2 The total number of activities carried out (completed or ongoing) as a percentage of planned activities in the annual action plans.

1
Chapter 1Introduction1.0. Background Article 36, clause 5 of the 1992 Constitution of the Republic of Ghana enjoins every President to “within two years after assuming office, present to Parliament a coordinated programme of economic and social development policies, including agricultural and industrial programmes at all levels and in all the regions of Ghana.”
In fulfilment of this constitutional injunction, the President in 2017, published the Coordinated Programme of Economic and Social Development Policies (CPESDP), 2017 – 20124 dubbed “An Agenda for Jobs: Creating Prosperity and Equal Opportunity for All”. The vision of this Coordinated Programme is to create:
“an optimistic, self-confident and prosperous nation, through the creative exploitation of our human and natural resource, and operating within a democratic, open and fair society in which mutual trust and economic opportunities exist for all.”
The Coordinated Programme formed the basis for the preparation of a detailed medium-term national development policy framework (MTNDPF), to be implemented over the period 2018-2021. Ministries, Departments and Agencies (MDAs), as well as, Metropolitan, Municipal and District Assemblies (MMDAs) have prepared their respective medium-term development plans based on the MTNDPF, which inform annual national budgets. The MTNDPF also serves as the reference document that informs citizens, as well as the international community of the government priorities and the enabling environment to be provided by Government.
In line with its mandate under Article 87, clause 2e of the 1992 Constitution, to monitor, evaluate and coordinate development policies, programmes and projects, the National Development Planning Commission (NDPC) has been preparing Annual Progress Reports (APRs) on the implementation of the MTNDPFs since 2002. The APRs track the progress of implementation of the MTNDPFs toward an agreed set of targets, identify key challenges and provide policy recommendations. The 2019 version of the Annual Progress Report (APR) is the eighteenth in the series and provides the mid-term status of the implementation of the current MTNDPF.
1.1. ObjectivesThe report provides an assessment of the progress of implementation of policies and strategies outlined in the MTNDPF. The principal objectives of the 2019 APR are to:
i. Track progress in key performance indicators of national development; ii. Assess the level of achievement of targets set in the Medium-Term National Development Agenda;
andiii. Provide recommendations to accelerate the implementation of the Medium-Term National
Development Agenda, 2018 to 2021.
1.2. Preparation Process
The 2019 APR was prepared in a participatory manner using the Cross-Sectoral Planning Groups (CSPGs3), to allow for inputs from multiple stakeholders and ensure broad ownership of the report. The entire process was coordinated by NDPC in accordance with Section 1 of the National Development Planning (System) Act, 1994 (Act 480).
3 CSPGs are multi-stakeholder groups comprising representatives from the public sector, private sector, civil society organisations, and academia among others.

2
The 2019 APR process commenced with an inception meeting at NDPC in March 2019 during which the results framework for the MTNDPF was discussed together with data requirements and data collection instruments. Working with the Regional Coordination Councils (RCCs), MMDAs were assisted to prepare their respective APRs. The APRs of MDAs and MMDAs provided data and information for the preparation of the national APR. Where there were data gaps, staff of the Commission made follow-up visits. Based on the review of MDA and MMDA APRs, draft reports were prepared for each development dimension. The draft reports were shared for stakeholder validation meeting at NDPC in June 2019. Comments from the stakeholder validation meeting were incorporated into a revised draft report. Experts on the thematic committees of the Commission reviewed the draft report. Comments from the experts were incorporated into a revised draft report, which was submitted to the Commission for approval.
1.3 Data Availability, Quality And Related MattersThe preparation of the 2019 APR has been hampered by inadequate access to quality, reliable and timely data from MDAs and MMDAs. Despite this, the Commission complemented data received from MDAs and MMDAs with information from other reputable local and international sources.
Specific challenges encountered during the preparation of the report include:
i. Lack of data on a number of indicators;
ii. Inconsistencies in data collected from the MDAs and MMDAs for the same variables for the same period;
iii. Delays by MDAs and MMDAs in providing requisite data;
iv. Inadequate technical and financial resources to conduct monitoring and evaluation activities at all levels and/or to undertake regular and systematic studies; and
v. Different reporting formats and cycles by requesting authorities continue to exist, particularly at the MDA and MMDA levels. This makes harmonization of data and alignment to other government processes difficult.
1.4 Overview
The end of 2019 marked the mid-point of the Implementation of the Agenda for Jobs Policy Framework, 2018-2021. The implementation of the framework has achieved some noticeable results. with the creation of an estimated 3.6 million jobs between 2017 and 2019 in the public and formal private sectors. The economy is robust with real GDP growth rate averaging 6.97 percent between 2017 and 2019. Key macroeconomic indicators, including budget deficit, inflation and interest rates are trending downwards, and for the first time in over a decade, trade balance recorded surpluses between 2017 - 2019, leading to an improved balance of payment position. Reforms in the banking sector has resulted in a significant reduction in the Non-Performing Loans (NPL) ratio of banks.
Under the digitizing Ghana initiative, an integrated e-immigration system, e-procurement, e-parliament, e-justice, e-cabinet, National Digital and Property Addressing System (NDPAS), National Identification System, Paperless system of the country’s ports, and the payment systems interoperability have been introduced. The payment systems interoperability alone has improved financial inclusion.
Through the planting for food and jobs (PFJ) initiative, over 600,000 farmers have been provided with subsidized and improved seeds and fertilizers. This resulted in increased productivity of major crops including maize, rice and soya bean, and over a 56.6 percent increase in exports of foodstuff to neighbouring countries between 2016 and 2019.
The Nations Builders Corp has also provided transient employment for over 100, 000 unemployed graduates, who are now engaged in essential services in the areas of health, education, agriculture, technology, governance and revenue mobilization and collection.

3
On the social front, there has been a general improvement in access to education and completion rates, especially at the Senior High School level. Gender parity has also been achieved at the basic education level. The introduction of the government’s Free Senior High School flagship initiative in 2017/2018 academic year provided opportunity for 90,000 additional students to gain admission into Senior High School. This number increased to 181,000 during the 2018/2019 academic year. Medical emergency service has been revamped and every district now has at least one modern and well-equipped ambulance and Emergency Medical Technicians. In addition, informal sector workers are now able to contribute to Tier 3 of Ghana’s Pension scheme through the Provident Fund and other private pension schemes.
There has been an improvement in the ambient water quality of major water bodies, owed largely to the joint military and police task force under Operation Vanguard to combat the operation of illegal small-scale miners. Under the Forest Plantation Strategy (2017-2040), government has provided opportunities for over 100, 000 young people to be employed nationwide between 2017 and 2019. Government improved upon the railway network and refurbished coaches, resulting in an increase in passenger rail traffic. Over 1,300 communities have been connected to the national grid under the Rural Electrification Programme. The Zongo Development Fund has since 2018 supported interventions in the areas of education, water and sanitation, drainage, roads, recreational facilities, street lights, and local economic development that have directly and indirectly impacted the lives of about 63,000 persons in the Zongo Communities.
On the governance front, Government continued to institute measures to ensure that corruption and economic crime are rendered unattractive. In 2018, Government enacted a law to establish the Office of the Special Prosecutor with a sole responsibility of fighting corruption among public office holders. Also, the Freedom to Information Bill was passed into law more than 20 years since the first draft was prepared. The law seeks to operationalise the constitutional right to information by the public, and some private institutions, subject to exemptions that are necessary and consistent to safeguarding the public interest in a democratic state.
Despite these achievements, a number of challenges persist that require attention. The Cedi continues to be unstable in comparison to the three major currencies (USD, GBP and Euro). The private sector and MSMEs continue to be challenged by access to credit. There is limited application of technology in the agriculture value chain, especially among small holder farmers and there is proliferation of illegal, unregulated and unreported fishing methods.
On the social front, the education sector continues to be bedeviled with school infrastructure challenges, and low numeracy and literacy proficiency for children at the primary level. A large proportion of the youth remain unemployed. Adolescent health issues, with particular emphasis on sexually transmitted infections (STIs), HIV/AIDS, abortion, and teenage pregnancy, persist.
The issue of illegal small-scale mining (galamsey), flooding and resultant deaths, haphazard development in urban and peri-urban areas, open defecation and sanitation conditions generally remain a challenge.
On the governance front, there are challenges with persistent lack of funds for effective implementation especially for the Independent Governance Institutions, perceived corruption, and a proliferation of chieftaincy disputes.
1.5 The potential impact of covid-19
Actions taken by governments and businesses in response to the COVID-19 pandemic have far reaching implications for the implementations of the MTNDP. Government revenue for 2020 is projected and experience a shortfall of GHc13.7 billion, with expenditure increasing by about GHc11.7 billion predominantly in response to the health emergency and the resulting socio-economic ramifications. Restrictions to cross-border trade and some economic activities is projected to reduce economic growth to 0.9 percent with a contraction likely, should things get worse. Some planned activities for 2020 are likely to be put on hold or scaled down as resources become stretched and priorities are revised in light of the evolving pandemic. Most development

4
targets for 2020 are therefore unlikely to be achieved, thus putting at risk the prospects of fully achieving the medium-term objectives of the MTNDPF.
A number of relief packages have been put in place to ameliorate the COVID-19 induced hardships brought on households and businesses, as well as stimulate the economy. Among the packages are the extension of free water supply and electricity supply for those on the lifeline tariff till September 2020; nearly fifty percent reduction in Communication Service Tax, and the launch of a GH¢600 million Coronavirus Alleviation Programme (CAP) business support scheme intended to support small and medium-scale enterprises (SMEs).
Government has also put together the Ghana COVID-19 Alleviation and Revitalisation of Enterprises Support (Ghana CARES) programme to stabilize and boost economic recovery and transformation within three-and-half years. Plans are also underway to establish a Guarantee Scheme of up to GH¢2.0 billion to enable businesses to borrow from banks at more affordable rates and at longer tenor to enable them make necessary adjustments and thereby retain jobs. The scheme will also enable businesses in sectors where COVID-19 has revealed opportunities (e.g. food import-substitution, pharmaceuticals, textiles and garments) to take advantage by accessing finance to enable them to expand their operations to meet domestic demand and for export.
1.6 Arrangements of the Chapters
The 2019 APR has three chapters. Chapter One provides the background and the process adopted in preparing the report. The second chapter presents the progress of implementation of the MTNDPF under seven sections; namely:
i. Economic Development; ii. Social Development;iii. Environment, Infrastructure and Human Settlement;iv. Governance, Corruption and Public Accountability;v. Ghana’s Role in International Affairs;
vi. Linking the 2019 national budget to the implementation of the policy framework; andvii. Implementing the MTNDPF at the district level.
Each section outlines their respective policy objectives, assesses the progress of implementation based on a set of indicators and pre-determined targets, and highlights the significant achievements and challenges. Also included in each section are policy recommendations based on identified weaknesses that hindered the achievement of targets. The third chapter presents the general conclusions drawn from the report findings and preparation process and provides a set of recommendations. Additional data on the indicators under the focus areas are included in the appendices.

5
Chapter 2Implementation Of The Medium-Term National Development Policy Framework
2.1 Economic Development
2.1.1 Introduction
This section highlights the performance of key economic development indicators in the MTNDPF, 2018-2021. The assessment focuses on analysis of the performance of agreed indicators and their targets for the period between 2018 and 2019. The overall goal is to build a prosperous society, to be achieved through the following broad objectives across six focus areas:
i) Strong and Resilient Economy: promote economic growth and employment; enhance monetary discipline and financial stability; ensure financial inclusion; ensure improved fiscal performance and sustainability; and promote international trade and investment.
ii) Industrial Transformation: ensure energy availability and reliability; enhance production and supply of quality raw materials; improve research and development (R&D), and financing for industrial development; ensure improved skills development for industry; and pursue flagship industrial development initiatives.
iii) Private Sector Development: enhance business-enabling environment; improve business financing; support entrepreneurs and small and medium enterprises (SME) development; enhance domestic trade; formalise the informal economy; ensure consumer protection; and promote good corporate governance.
iv) Agriculture and Rural Development: promote a demand-driven approach to agricultural development; ensure improved public investment; improve production efficiency and yield; improve post harvest management; enhance the application of science, technology and innovation; promote agriculture as a viable business among the youth; and promote livestock and poultry development for food security and income generation.
v) Fisheries and Aquaculture Development: ensure sustainable development and management of aquaculture; and ensure sustainable development and management of aquatic fisheries resources.
vi) Tourism and Creative Arts Development: diversify and expand the tourism industry for economic development; and develop a competitive creative arts industry.
Significant Achievements Significant achievements observed in 2019 include:
1. Inflation performed better than target;2. Significant decrease in the ratio of non-performing loans in the banking sector; 3. General increase in the average productivity of selected staple crops; and4. Increase in tourist arrivals and gains in tourism receipts.

6
2.1.2 PROGRESS OF IMPLEMENTATION
2.1.2.1 Strong and Resilient Economy
The objective of government’s medium-term economic policy framework was to build a robust and buoyant economy to spur per capita GDP from US$1,515.6 in 2016 to a minimum of $2,500 by 2020; and further increase to at least US$2,700 by 2021. The attainment of these projections was predicated on an annual average GDP growth rate of, at least, 7.2 percent over the medium term. Consistent with achieving these growth objectives, the government set the following initial macroeconomic targets in the 2019 annual budget:
i) The overall Real GDP growth rate of 7.6 percent; ii) The non-oil Real GDP growth rate of 6.2 percent; iii) The end-period inflation rate of 8.0 percent; iv) Overall fiscal deficit of 4.2 percent of GDP; v) Primary balance (surplus) of 1.2 percent of GDP; and vi) Gross international reserves of at least 3.5 months of imports cover.
Four of the above key indicators were revised during the 2019 mid-year budget review. The overall GDP growth rate was revised downwards to 7.0 percent, non-oil real GDP growth was also revised to 5.9, and the primary balance was revised to 1.1 percent of GDP while the overall deficit was revised upwards to 4.5 percent of GDP. The main factors that underpinned the revisions were:
i) The Ghana Cedi (GH¢) underperformed in the first quarter of 2019 against the three major trading currencies (USD, GBP and Euro);
ii) The deficit target of 2.9 percent of GDP, for the first half of 2019, was exceeded by 0.1 percent due to shortfalls in revenue and grants;
iii) Energy sector IPPs payments emerged which were not programmed in the 2019 budget; and
iv) Targets for crude oil and gas volumes were not realised.
Real Gross Domestic Product Growth Rates
The economy recorded overall real GDP growth rate of 6.5 percent for 2019 compared to 6.3 percent in 2018. However, it underperformed the 8.1 percent growth rate recorded in 2017 (see Table 2.1). On the contrary, non-oil sector real GDP growth declined to 5.8 percent in 2019 from 6.5 percent in 2018, but outperformed 2017 growth rate of 4.6 percent. The main driver of overall GDP growth was the Services sector which recorded a growth of 7.6 percent, outperforming both 2018 and 2017 and the 2019 target of 5.4 percent. In 2019, the overall GDP growth fell short of the average annual GDP growth of 7.2 percent anticipated in the Coordinated Programme.
Table 2.1: Real Sector Growth Rates (%), 2017-2019
Indicators 2017 Baseline 2018 Status 2019 Budget Target 2019
(Provision-al)
Progress Towards Target
Real GDP (%)
- Agriculture
- Industry
- Services
6.1
15.7
3.3
4.8
10.6
2.7
6.4
8.8
5.4
4.6
6.4
7.6
Target not achieved
Target not achieved
Target exceeded
Overall GDP Growth Rate (incl. Oil) 8.1 6.3 7.0 6.5 Target not achieved
Non-Oil GDP Growth Rate 4.6 6.5 5.9 5.8 Target not achieved
Source: GSS, 2020

7
Sources of GDP GrowthAgriculture Sector: The sector grew by 4.6 percent in 2019 compared to 4.8 percent in 2018 and 6.1 percent in 2017. This growth was below the 2019 target of 6.4 percent and the projected medium term annual average growth rate of at least 5 percent. The drivers of growth in the sector, in 2019, were crops and livestock subsectors, which grew by 5.3 percent and 5.4 percent respectively, while the fishing subsector grew by 1.7 percent. The Forestry and Logging subsector, however, contracted by 1.7 percent (see Table 2.2).
Table 2.2: Agriculture Subsector Growth Rates, 2017-2019 (%)
Indicators 2017 Baseline 2018 Status 2019 Target 2019 (Provisional) Progress Towards Target
AGRICULTURE 6.1 4.8 6.4 4.6 Target not achieved
Crops 7.2 5.8 7.1 5.3 Target not achieved
o/w Cocoa 9.2 3.7 5.4 5.4 Target achieved
Livestock 5.7 5.4 5.7 5.4 Target not achieved
Forestry and Logging 3.4 2.4 3.5 -1.7 Declined
Fishing -1.4 -6.8 3.3 1.7 Target not achieved
Source: GSS, 2020
Industry Sector: The sector grew by 6.4 percent in 2019 compared to 10.6 percent and 15.7 percent recorded in 2018 and 2017 respectively. It also fell short of its budget target of 8.8 percent (see Table 2.3). The performance of the sector was driven by the mining and quarrying subsector with 12.6 percent growth, of which oil and gas, though fell short of target, grew by 15.1 percent in 2019. Further, manufacturing and electricity grew by 6.3 percent and 6.0 percent, respectively. However, water and sewerage, and construction subsectors each contracted by 4.4 percent.
Table 2.3: Industry Subsector Growth Rates, 2011-2019 (%)
2017 Baseline 2018 Status 2019 Target2019
(Provisional)
Progress Towards Target
INDUSTRY 15.7 10.6 8.8 6.4 Target not achieved
Mining and Quarrying 30.8 23.3 13.1 12.6 Target not achieved
o/w Oil & Gas 80.3 3.6 20.1 15.1 Target not achieved
Manufacturing 9.5 4.1 6.7 6.3 Target not achieved
Electricity 19.4 5.5 7.1 6.0 Target not achieved
Water and Sewerage 6.1 -3.6 3.5 -4.4 Declined
Construction
5.1
1.1
4.1
-4.4
Declined
Source: GSS, 2020
Services Sector: The services sector growth of 7.6 percent outperformed the 2019 target of 5.4 percent and growth recorded for both 2017 (3.3%) and 2018 (2.7%), as shown in Table 2.4. The main drivers of growth were information and communication, real estate, health and social works, and education,

8
with annual growth rates of 46.5 percent, 19.9 percent, 10.4 percent and 9.4 percent respectively. The financial and insurance subsector recovered from contractions of 17.7 percent and 8.2 percent in 2017 and 2018 respectively to record a growth of 1.6 percent in 2019 slightly missing the 2019 target of 1.7 percent.
Table 2.4: Services Subsector Growth Rates, 2017-2019* (%)
2017 Base-line 2018 Status 2019 Target 2019* Provi-
sionalProgress Towards Target
SERVICES 3.3 2.7 5.4 7.6 Target exceeded
Trade; Repair of Vehicles, Household Goods 8.2 2.8 5.1 3.7 Target not achieved
Hotels and Restaurants 7.6 3.2 4.7 6.0 Target exceeded
Transport and Storage 8.9 1.1 3.7 4.3 Target exceeded
Information and communication 4.2 13.1 4.6 46.5 Target exceeded
Financial and Insurance Activities -17.7 -8.2 1.7 1.6 Target not achieved
Real Estate 3.8 -6.5 2.6 19.9 Target exceeded
Professional, Administrative & Support Ser-vice activities 2.9 0.3 2.5 5.1 Target exceeded
Public Administration & Defence; Social Security 4.2 4.3 5.7 3.7 Target not achieved
Education 6.3 3.9 4.5 9.4 Target exceeded
Health and Social Work 14.1 22.6 21.2 10.4 Target not achieved
Other Service Activities 5.3 3.1 6.1 2.6 Target not achieved
Source: GSS, 2020
Structure of the Economy
Although the medium-term projections for 2021 point towards a 53.7 percent contribution from the Services sector; 28.1 percent from the Industry sector; and 18.2 percent from the Agriculture sector, the structure remains unchanged over the past three years, as shown in Figure 2.1. The Services, Industry and Agriculture contributed an average of 46.5 percent, 33.6 percent and 19.8 percent, respectively, for the past three years. As at 2019, Services remained the largest sector contributing 47.2 percent of GDP compared to 34.2 percent by Industry and 18.5 percent by Agriculture (see Figure 2.1).
Monetary and Financial Performance
Inflation: Under the CPESDP (2017-2024), government projected an average inflation per annum of not more than 10 percent to support its medium-term per capita income target. Rebased headline inflation declined from 9.4 percent in December 2018 to 7.9 percent in December 2019. The reduction in inflation in 2019 shows muted effects of both food and non-food inflation, at 7.2 percent and 8.5 percent, respectively, coupled with the return to relative stability in the exchange rates in the fourth quarter following the unwinding of the significant levels of depreciation seen in the first quarter of the year.
Figure 2.1: Sectoral Contribution to GDP, 2017-2019 (%)
Source: GSS, 2020

9
Interest rates: The Monetary Policy Committee (MPC) reduced the Monetary Policy Rate (MPR) by 100 basis points to 16.0 percent in January 2019, and maintained it throughout the year to ensure that policy stance remained tight to contain inflationary pressures. Money market rates, measured by the benchmark 91-day Treasury bill rate inched up to 14.7 percent in December 2019 from 14.6 percent in December 2018. Average lending rates, compiled from the banking sector, however, declined to 23.6 percent in December 2019, from 23.9 percent in December 2018.
Private Sector Credit: According to the Bank of Ghana Credit Conditions Survey conducted in December 2019, there was a net easing in overall credit stance to enterprises. Banking sector data indicated that new advances to the sector recorded an annual increase of 27.3 percent in 2019. The significant increase in the private sector credit was as a result of the recapitalisation exercise and banking sector clean up undertaken by the Bank of Ghana. Annual growth in private sector credit for 2019 increased to 18.3 percent from 10.6 percent in 2018. Total liquidity increased significantly by 21.6 percent in 2019. This compares favourably to the 15.4 percent recorded as at the end of 2018.
Non-Performing Loans: The Non-Performing Loans (NPL) ratio in the banking sector was 13.9 percent as at end December 2019. This is a marked improvement compared to 18.2 percent in 2018 and 21.6 percent in 2017. This was largely as a result of reforms in the banking sector.
Banking Sector ReformsAs part of the banking sector reforms, the Bank of Ghana (BoG) increased the minimum paid up capital to GH¢400 million by the end of December 2018. At the end of the recapitalisation exercise, through injection of new capital, capitalization of profits, mergers and support from the Ghana Amalgamated Trust (GAT), 23 out of 36 banks met the requirements. This intervention protected over 7,000 jobs, and ensured that nine indigenous banks are in operation. About GH¢ 4.6 billion in depositor’s funds have also been saved.
Fiscal Policy Performance
Provisional data for 2019 indicates that the fiscal deficit arising from Government’s operations was 4.8 percent of GDP, on cash basis. This compares adversely to the revised deficit target of 4.5 percent for 2019 and 3.9 percent recorded in 2018, as shown in Table 2.5. The higher-than programmed fiscal deficit resulted from underperformance in revenue, which fell short of target by 10.1 percent, higher than the 6.6 percent reduction in expenditure. The primary balance recorded a surplus, for the third consecutive year, equivalent to GH¢3.0 billion (0.9% of GDP) in 2019.
Table 2.5: Summary of Central Government Operations for 2019
Indicators
(GH₵ billion)
2018 2019
Prov. Outturn
Budget Bud-get***
Proj. Outlook
Prov. Outturn
Dev (GH₵)
Dev (%) y/y (%) Exec Rate (%)
Total Revenue & Grants (GH₵ billion) 47.6 58.9 58.9 54.6 53.0 -5.9 -10.1 11.2 89.9
% of GDP 15.8 17.0 17.0 15.8 15.3
Total Exp. (incl. Arrears clear-ance)
(GH₵ billion)59.3 73.4 74.6 70.9 69.7 -4.9 -6.6 17.5 93.4
% of GDP 19.7 21.2 21.6 20.5 20.1
Budget Balance (GH₵ billion) -11.7 -14.5 -15.7 -16.4 -16.7 -1.0 6.4 43.3 106.4
% of GDP -3.9 -4.2 -4.5 -4.7 -4.8
Primary Balance (GH₵ billion) 4.1 4.1 3.9 3.2 3.0 -0.9 -22.0 -27.0 78.0
% of GDP 1.4 1.2 1.1 0.9 0.8
Source: MoF, 2020

10
*** This refers to 2019 revised budgetRevenue Performance: Total Revenue and Grants amounted to GH¢52.9 billion (15.3% of GDP) in 2019. The outturn represents a per annum growth of 11.2 percent (see Table A2.2, in the Appendix 1). Tax Revenue amounted to GH¢42.3 billion (12.2% of GDP) in 2019 against the revised target of GH¢45.6 billion (13.2% of GDP) and 2018 outturn of GH¢37.8 billion (12.6% of GDP).
Oil revenue amounted to GH¢4.9 billion (1.4% of GDP) at the end of 2019 against the revised target of GH¢5.7 billion (1.6% of GDP). This compares with the 2018 outturn of GH¢4.5 billion (1.5% of GDP), as shown in Table A2.2, Appendix 1. Non-oil tax revenue amounted to GH¢42.6 billion (12.3% of GDP) in 2019 outperforming 2018 by 19.0 percent but fell short of the revised 2019 target of GH¢45.1 billion (13.0% of GDP). Project and programme grants for 2019 amounted to GH¢1.0 billion (0.3% of GDP), against a target of GH¢1.1 billion (0.3% of GDP), but marginally falling short of the 2018 outturn of GH¢1.1 billion (0.4% of GDP). The shortfall in grants was mainly due to the non-disbursement of programme grants amounting to GH¢57.7 million.
Expenditure Performance: Total expenditure (including arrears clearance & discrepancy) was below target by 6.6 percent in 2019, resulting in expenditure execution rate of 93.4 percent compared to revenue mobilized of 89.9 percent. Overall, total expenditure amounted to GH¢69.7 billion (20.0% of GDP) compared to the revised target of GH¢74.6 billion (21.6% of GDP), see Table A2.3, Appendix 1. The outturn represents an annual growth of 17.5 percent over the 2018 outturn of GH¢59.3 billion (19.7% of GDP).
With regards to the key components of expenditure, compensation of employees amounted to GH¢22.0 billion (6.4% of GDP) against the revised target of GH¢22.8 billion (6.6% of GDP) in 2019, the corresponding outturn for 2018 was GH¢19.6 billion (6.5% of GDP). Interest payment was the only expenditure item which exceeded target and amounted to GH¢19.8 billion (5.7% of GDP) against the revised 2019 target of GH¢19.6 billion (5.7% of GDP) and 2018 outturn of GH¢15.8 billion (5.3% of GDP). Grants to other government units amounted to GH¢11.4 billion (3.3% of GDP) against the target of GH¢14.0 billion (4.1% of GDP) in 2019, as shown in Table A2.2, Appendix 1.
Overall Budget Balance and Financing Operations: Provisional data on government fiscal operations shows an overall deficit, on cash basis, of GH¢16.7 billion (4.8% of GDP) against the revised target of GH¢15.7 billion (4.5% of GDP) for 2019 and the 2018 outturn of 3.9 percent of GDP. The higher-than programmed deficit was financed mainly from domestic sources, which amounted to GH¢11.9 billion (3.4% of GDP), while foreign financing amounted to GH¢4.8 billion (1.4% of GDP), as shown in Table 2.6.
Table 2.6: Summary of Central Government Budget Balance and Financing for 2019
Indicators 2018 2019
Prov. Out-turn
Budget Revised Budget
Proj. Outlook
Prov. Outturn
Dev (GH₵)
Dev (%) y/y (%)
Exec Rate (%)
Total Financing (GH₵ billion) 11.7 14.5 15.7 16.4 16.7 -32.4 6.4 -243.3 -106.4
% of GDP 3.9 4.2 4.5 4.7 4.8
Foreign Financing (GH₵ billion) 2.7 9.7 8.2 6.2 4.8 -3.4 -41.3 77.6 58.7
% of GDP 0.9 2.8 2.4 1.8 1.4
Domestic Financing (GH₵ billion) 8.9 4.8 7.5 10.2 11.9 4.4 59.0 32.9 159.0
% of GDP 3.0 1.4 2.2 2.9 3.4
Nominal GDP 300.6 344.5 345.9 345.9 1.0
Source: MoF, 2020

11
External Sector Performance
Exchange rate: The Ghana cedi depreciated by 12.9 percent against the US dollar in 2019, compared with 8.4 percent depreciation in 2018. Against the British pound and Euro, the Ghana cedi depreciated by 15.7 and 11.2 percent respectively in 2019, compared with 3.3 and 3.9 percent respectively in 2018.
International trade: The current account balance for 2019 recorded a deficit of US$1.7 billion (2.5% of GDP), compared to a deficit of US$2.0 billion (3.1% of GDP) in 2018. This improvement was driven mainly by the surplus of US$2.3 billion recorded in the trade balance.
Trade balance: The trade balance for 2019 recorded a surplus of US$2.3 billion (3.4% of GDP), compared to a surplus of US$1.8 billion (2.8% of GDP) in 2018. As shown in Table 2.6, the total value of exports increased by 4.6 percent, from US$14.9 billion in 2018 to US$15.6 billion in 2019. The outturn resulted from a bigger increase in export receipts compared to a marginal increase in the merchandised imports. Total imports increased by 1.5 percent, from US$13.1 billion in 2018 to US$13.3 billion in 2019. At more than US$2.1 billion in 2019, the oil and gas imports constituted the largest outflow in external trade.
International reserves: Net International Reserves (NIR) was estimated at US$5.2 billion at the end of 2019 compared to US$3.8 billion in 2018. This improvement was due to the relative stability in the external sector. Gross International Reserves (GIR), at the end of 2019, was estimated at US$8.4 billion, providing an import cover of 4.0 months for imports of goods and services, compared to 3.6 months of import cover for 2018.
2.1.2.2 Industrial Transformation
Energy supplied to the Ghanaian economy in 2019 increased by 2.3 percent from 10,800.3 Kilotonnes of oil Equivalent (Ktoe) in 2018 to 11,052.8 Ktoe in 2019, achieving the energy demand by the industries for the year 2019. Petroleum products (including natural gas use in industry), biomass (firewood and charcoal) and electricity constituted 47.6 percent, 37.4 percent and 15 percent of final energy consumed in 2019 respectively. With an annual increase of 4.3 percent energy supplied to the economy, the industrial sector consumed 1,066.6 Ktoe (13.0 percent) of total final energy consumed in 2019, representing an increase of 2.8 percent over energy consumption in 2018. The industrial consumption of energy fluctuated between 2009 and 2014; stabilised briefly afterwards and began to trend upwards from 2015 to 2019 (See Figure 2.2). In 2019, the industry sector consumed 4,242 GWh of electricity higher than 3,749 GWh consumption in 2018. The consumption in 2019 represents 30.4 percent share of the total final electricity consumption in the country.
Table 2.7: Trade Balance, 2017-2019
Indicator 2017 2018 2019
A c t u a l (US$ m)
A c t u a l (US$ m)
Project-ed (US$ m)
Provisional (US$ m)
% Change
Merchandise Exports (f.o.b ) 13,835 14,943 15,372 15,634 4.6
Merchandise Imports (f.o.b.) -12,648 -13,134 -13,207 -13,336 1.5
Trade Balance 1,187 1,809 2,165 2,298 27.1
Source: BoG, 2020
Figure 2.2: Energy Consumption by Industry, 2017 - 2019
Source: Energy Commission, 2020

12
2.1.2.3 Private Sector Development
Ghana’s overall rank in the Global Competitive Index declined from 106th out of 140 countries in 2018 to 111th out of 141 countries in 2019. Likewise, the ranking on the World Bank’s ease of doing business assessment of 190 countries showed a decline from 114th in 2018 to 118th in 2019. Even though there was a general fall in the ease of doing business ranking, the year witnessed improvements in the climate for doing business in certain areas including protecting the minority investors, resolving financial sector insolvency, enhancing electricity availability and reduction of power outages, and import processes at the port through the implementation of the paperless customs clearance processing system.
2.1.2.4 Agriculture and Rural Development
On average, the productivity of major staple crops (maize, rice, yam, etc.) increased between 2018 and 2019. The increase in average national productivity was attributed to improved extension delivery, supply of improved seeds and fertilizer to farmers under the planting for food and jobs (PFJ)4 and Modernizing Agriculture in Ghana (MAG) initiatives. However, yields for cocoyam, plantain, cowpea and soya bean declined in 2019 (see Table A2.4, Appendix 1). Coffee, shea nut, yam products, exotic vegetables and pawpaw increased in the value of exports over the previous year, while cashew, maize, pineapple and mango declined in export value.
2.1.2.5 Fisheries and Aquaculture Development
The programmes implemented in 2019 focused on combatting illegal, unreported and unregulated (IUU) fishing activities, implementation of closed season for all fleets and enhancing the productive capacities of small and medium scale fish farmers through training. The implementation of the above programmes, among others, contributed to the increase in annual fish supplies over the review period, as shown in Table 2.8.
Table 2.8: Estimates of Fish Landings (of all Fleets), 2017-2019
Indicators 2017 Baseline 2018 Actual 2019 Budget Target
2019
Provisional
Progress Towards Target
Total Fish Supply (mt): 358,362.64 333,611.72 370,704.45 339,997.53 Target not achieved
- Marine 342,427.00 302,431.50 302,255.30 332,146.00 Target achieved
- Inland Capture fisheries 76,753.66 73,627.80 90,052.46 81,250.00 Target not achieved
- Aquaculture 57,405.31 76,620.00 105,253.12 52,350.02 Target not achieved
- Total domestic production 476,585.97 452,679.30 497,560.88 465,700.08 Target not achieved
- Import 197,063.45 192,689.55 179,957.44 190,617.15 Target not achieved
-Export 78,840.122 73,621.97 53,101.01 64,914.6 Target not achieved
Source: MoFAD, 2020
The total volume of fish catch increased from 452,679.30 metric tons in 2018 to 465,700.08 metric tons in 2019; representing an increase of 3.0 percent. However, this fell short of the 2019 target of 497,957.4 metric tons. The marine sub-sector continued its dominance in the fishing industry, compared to inland capture and aquaculture. The least contributor to total fish production was aquaculture with a total of 52,350.02 metric tons; representing 11.2 percent of the total landings. The performance of aquaculture fell short of the projected target for 2019 due to the spread of Infectious Spleen and Kidney Virus Disease (ISKVD) that affected a large number of small- and large-scale fish farms along the Volta Lake leading to high fish mortality and loss of investments.
4 https://mofa.gov.gh/site/publications/research-reports/317-planting-for-food-job-operational-performance

13
2.1.2.6 Tourism and Creative Arts Development
Government implemented a number of programmes, including the celebration of the Year of Return in 2019, Tourism Product Development Programme and Culture, Creative Arts and Heritage Management Programme as part of the broader agenda of transforming the country into a major Meeting, Incentive, Conference, and Exhibition (MICE) destination, as well as expanding the sector, through investment, innovation, pursuit of service excellence and meaningful partnerships. This has resulted in an increased in the number of tourist arrivals from 956,375 in 2018 to 1,130,307 in 2019 and gains in tourism receipt from US$2,589.85 million in 2018 to US$3,312.93 million (see Table 2.9).
Table 2.9: Performance of Key Sector Indicators
Key National Indicators 2017 Baseline 2018 Target 2018 Outturn 2019 Target 2019 Outturn
Tourist arrivals 980,141 1,614,717 956,375 1,760,223.3 1,130,307
Change in tourism receipts (US$, mil) 10.1% (US$1,856.5)
5.1% (US$1,951.2)
43.52%
(US$2,589.85)
10% (US$3,325.04)
27.92% (3,312.93)
No. of domestic tourists (42 sites) 502,539 577,273 527,362 569,559 554,719
Revenue accrued from fees (GH¢, mil) 1,647.8 1,731.8 1,731.8 3,716.7 2,336.2
Employment (Direct and Indirect) 487,000 506,000 543,000 526,000 602,425
Accommodation (No. of hotel rooms) 3,347 3,539 3,454 3,842 4,131
Number of jobs in the Creative Arts Indus-try
1,148,072 1,262,879 1,204,560 1,389,167 1,358,152
Number of Jobs in the Film and Music In-dustry
38,288 40,203 40,110 43,017 42,213
Source: Ministry of Tourism, Arts and Culture, 2020
2.1.3 Key Challenges And Policy Recommendations
The section outlines key challenges and proffers recommendations.
Table 2.10: Key challenges and recommendations for Economic Development
No Challenges RecommendationsObserved underperformance of selected macroeconomic indicators including exchange rate of the Ghana Cedi against the three major trading currencies; missed GDP growth targets as well as considerable non-performing loans and insolvency in the banking sector.
Implement economic policies and programmes geared toward achieving set targets to attain stable macroeconomic fundamentals and reduce the costs associated with uncertainties, as well as improve upon Ghana’s external sector.
Inadequate financing for SMEs and the private sector in general, especially with respect to the cost and tenure of loans, as well as access to appropriate innovation.
Formulate policies that attract and retain FDIs
Liaise with external financing institutions, like the IFC, KfW, DFID, USAID etc, who provide subsidized financing for identifiable groups and SMEs to accelerate the industrial transformation and create employment, especially for the youth.
Expedite the processes of establishing a National Development Financial Institution (Development Bank) that will provide long term loans at affordable rates to businesses and industry.
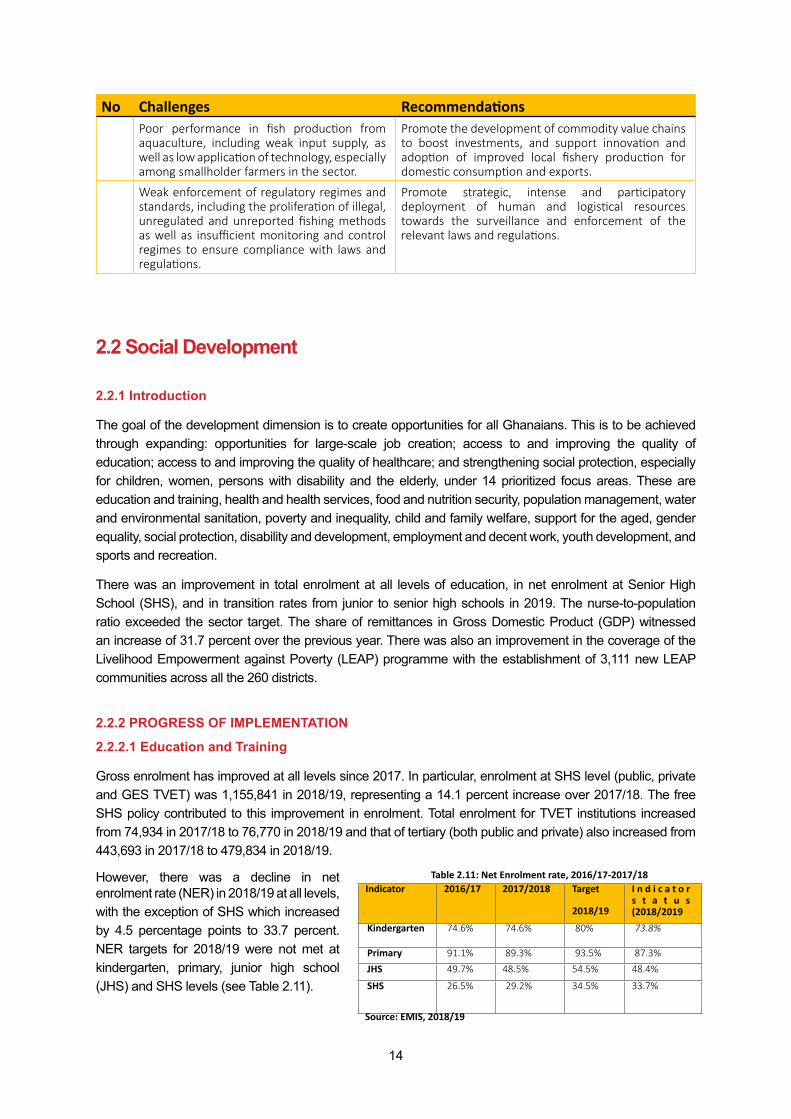
14
No Challenges RecommendationsPoor performance in fish production from aquaculture, including weak input supply, as well as low application of technology, especially among smallholder farmers in the sector.
Promote the development of commodity value chains to boost investments, and support innovation and adoption of improved local fishery production for domestic consumption and exports.
Weak enforcement of regulatory regimes and standards, including the proliferation of illegal, unregulated and unreported fishing methods as well as insufficient monitoring and control regimes to ensure compliance with laws and regulations.
Promote strategic, intense and participatory deployment of human and logistical resources towards the surveillance and enforcement of the relevant laws and regulations.
2.2 Social Development
2.2.1 Introduction
The goal of the development dimension is to create opportunities for all Ghanaians. This is to be achieved through expanding: opportunities for large-scale job creation; access to and improving the quality of education; access to and improving the quality of healthcare; and strengthening social protection, especially for children, women, persons with disability and the elderly, under 14 prioritized focus areas. These are education and training, health and health services, food and nutrition security, population management, water and environmental sanitation, poverty and inequality, child and family welfare, support for the aged, gender equality, social protection, disability and development, employment and decent work, youth development, and sports and recreation.
There was an improvement in total enrolment at all levels of education, in net enrolment at Senior High School (SHS), and in transition rates from junior to senior high schools in 2019. The nurse-to-population ratio exceeded the sector target. The share of remittances in Gross Domestic Product (GDP) witnessed an increase of 31.7 percent over the previous year. There was also an improvement in the coverage of the Livelihood Empowerment against Poverty (LEAP) programme with the establishment of 3,111 new LEAP communities across all the 260 districts.
2.2.2 PROGRESS OF IMPLEMENTATION
2.2.2.1 Education and Training
Gross enrolment has improved at all levels since 2017. In particular, enrolment at SHS level (public, private and GES TVET) was 1,155,841 in 2018/19, representing a 14.1 percent increase over 2017/18. The free SHS policy contributed to this improvement in enrolment. Total enrolment for TVET institutions increased from 74,934 in 2017/18 to 76,770 in 2018/19 and that of tertiary (both public and private) also increased from 443,693 in 2017/18 to 479,834 in 2018/19.
However, there was a decline in net enrolment rate (NER) in 2018/19 at all levels, with the exception of SHS which increased by 4.5 percentage points to 33.7 percent. NER targets for 2018/19 were not met at kindergarten, primary, junior high school (JHS) and SHS levels (see Table 2.11).
Table 2.11: Net Enrolment rate, 2016/17-2017/18Indicator 2016/17 2017/2018 Target
2018/19
I n d i c a t o r s t a t u s (2018/2019
Kindergarten 74.6% 74.6% 80% 73.8%
Primary 91.1% 89.3% 93.5% 87.3%JHS 49.7% 48.5% 54.5% 48.4%
SHS 26.5% 29.2% 34.5% 33.7%
Source: EMIS, 2018/19

15
Transition rate from JHS to SHS increased from 75 percent in 2017/18 to 91.6 percent in 2018/19, exceeding the target of 80 percent. Completion rate at primary level has mostly exceeded 100 percent. In 2018/19 completion rate was 102.4 percent. Completion rate at primary level tends to be higher for girls than boys. Generally, completion rate decreases up the educational ladder with marked gender disparities in favour of boys. In 2018/19 the completion rate at JHS increased to 79.1 percent, up from 78.8 percent in 2017/18. Completion rate for girls was 78.8 percent as compared to 79.4 percent for boys. At the SHS level, the completion rate improved from 52.5 percent in 2017/18 to 55.9 percent in 2018/19, with 57.2 and 54.6 percent respectively for boys and girls, indicating a relatively higher drop-out rate for girls.
Gender parity has been achieved at the kindergarten, primary and JHS levels since 2014, however challenges persist at the secondary and tertiary levels. In both 2016/17 and 2017/18, gender parity at SHS was 0.98, but declined to 0.95 in 2018/19. At tertiary level, gender parity increased from 0.64 in 2016/17 to 0.73 in both 2017/18 and 2018/19.
Proficiency in literacy and numeracy remains a major challenge for Ghana. In 2017/18, about 62.8 percent of children in primary 4 (P4) lacked minimum proficiency in literacy while 78 percent lacked minimum proficiency in numeracy (See Table 2.12). The situation was similar for primary 6 (P6). The pass rate for BECE improved from 76.4 percent for 2016/2017 academic year to 76.8 percent in 2017/2018.
2.2.2.2 Health and Health Services
In 2019, the population with valid National Health Insurance Scheme (NHIS) cards was 40 percent, an increase from 35.7 percent in 2018. However, the percent of NHIS card holders classified in the exempt category decreased from 68.0 percent in 2018 to 61.0 percent in 2019. Per capita out-patient department (OPD) attendance, dropped from 1.05 in 2018 to 1.02 in 2019, missing the sector target of 1.08. Doctor-to-population ratio improved from 1:7,196 in 2018 to 1:6,897 in 2019, missing the sector target of 1:6,800. Nurse-to-population ratio also improved from 1:839 in 2018 to 1:539 in 2019, exceeding the sector target of 1:700.
The number of functional Community-based Health Planning and Services (CHPS) zones increased from 5,267 (that is, 76.5% of demarcated CHPS zones) in 2018, to 5,509 (78.5%) in 2019 (see Figure 2.3). This however fell below the sector target of 5,977 (82%). In 2019, 307 new ambulances were procured to augment the available fleet which had declined from 130 in 2017 to 25 in 2018. The proportion of functional service centres was 19.7 percent in 2019. A total of 490 Emergency Medical Technicians (EMTs) were trained and deployed as basic EMTs during the year.
2.2.2.3 Disability, Morbidity, and Mortality
Institutional maternal mortality ratio (iMMR) declined from 128.6 per 100,000 live births in 2018 to 122.2 in 2019 (see Figure 2.4), while stillbirths decreased from 13.9 per 1,000 live births in 2018 to 12.2 in 2019.
The proportion of children immunised with Penta 3, which controls and averts five life-threatening diseases (Diphtheria, Pertussis, Tetanus, Hepatitis B and Hib
Table 2.12: Proficiency rate (%)2016/17 Target 2017/18
English P4 28.4 30.1 37.2
Maths P4 22.1 27.0 22.0
English P6 39.0 49.0 37.9
Maths P6 10.9 13.3 24.9
Source: EMIS, 2018/19
Figure 2.3: Number of Functional CHPS Zones
Source: MoH, 2020
Figure 2.4: Institutional Maternal Mortality Ratio(IMMR), per 100,000 live births
Source: MoH, 2020

16
meningitis), dropped from 95.5 percent in 2018 to 91.1 percent in 2019. Nearly 1 in every 10 children are therefore not receiving this critical vaccine. A decade after Ghana was declared polio-free, 18 cases of the polio virus were recorded in 2019, indicating a weakness in the coverage of polio vaccination.
The malaria case fatality rate dropped from 0.27 percent in 2018 to 0.1 percent in 2019. Similarly, the risk of a child under five years dying from malaria reduced from 0.16 percent in 2018 to 0.11 percent in 2019, exceeding the medium-term target of 0.14 percent.
2.2.2.4 HIV, AIDS and STIs
In 2019, HIV prevalence was 1.7 percent of the population, 0.03 percentage points higher than in 2018, and missing the 2019 target of 1.62 percent. The percentage of PLHIV who have received ART combination therapy increased from 33.5 percent in 2018 to 44.9 percent in 2019.
2.2.2.5 Food and Nutrition Security
Malnutrition contributes to about one-third of deaths in children under-five years in Ghana. Over the last two decades, Ghana has witnessed a considerable decline in all major malnutrition indicators, but their prevalence still remains unacceptably high. The rate of stunting was reported to be 18 percent in 2017/18. At the same time, 13 percent of children under-five were identified as being “chronically and acutely malnourished” (underweight). The proportion of children who are wasted was 7 percent in 2017/18.
Recent data indicate that anaemia among children aged 6-59 months has declined from 65.7 percent in 2014 to 35 percent in 2017, with severe and moderate cases accounting for 0.7 percent and 17 percent respectively. The most affected groups are the 12-23 months’ age-group (46.1%), males (38.4%), rural dwellers (42.1%), and those in the northern belt (53.2%). Anaemia prevalence in non-pregnant women was 21.7 percent, compared to 42 percent of pregnant women, the latter meeting WHO’s classification of a severe public health problem. Pregnant women who live in rural areas (42.5%), the Southern Belt (50.8%) and the 20-39 age group had a higher prevalence of anaemia. Anaemia in non-pregnant women was, however, most prevalent among the 15-19 age group (26.4%), rural dwellers (21.8%), Northern Belt (27.6%) and women who never attended school (24.3%).
Nationally, only 1.5 percent of non-pregnant women experience Vitamin A deficiency
Those between 25-29 years’ experience the highest incidence (4.7 %), followed by rural dwellers (1.9%). Nearly two-thirds of pregnant women (63.9%) did not take Vitamin A capsules after their last delivery, while only 50 percent of children under-five received Vitamin A supplementation
Available data also shows that up to 64 percent of households consume iodised salt.
Non-communicable diseases, which include cancer, cardiovascular disease, chronic respiratory diseases, and diabetes, are responsible for 43 percent of all deaths and account for up to 94,000 preventable deaths in Ghana each year.
According to the FAO (2016) up to 66 percent of Ghanaian’s dietary energy is from cereals, roots and tubers, as compared to 51 percent globally. Only 24 percent of Ghanaian children aged 6-23 months had a minimum diet diversity in 2018, below the West African and global averages of 25 and 29 percent respectively. Similarly, only 43 percent of children aged 6-23 months had an acceptable meal frequency, while 13 percent had a minimum acceptable diet. Over half (51%) of children (6-23 months) consumed no vegetable or fruit. Ghana was ranked 59th in the 2019 Global Hunger Index, the best ranked country in sub-Saharan Africa, with a score of 14.0 an improvement from the 2010 score of 18.3. This indicates that there are moderate levels of hunger in Ghana.

17
2.2.2.6 Population Management
Ghana’s population was estimated at 30.8 million in 2019. With the current population growth rate of 2.5 percent, the country’s population of 24.6 million in 2010 is expected to double by 2042. This exceeded the target of 2.2 percent set in the National Population Policy. The average household size for Ghana, according to the GLSS7 report, is 3.8, with 3.5 for urban and 4.4 for rural. The average household size is higher in the Northern (5.8) and Upper East (5.2) regions, but lower in the Ashanti (3.2) and Greater Accra (3.4) regions.
In 2019, the Births and Deaths Registry recorded 80.4 percent of the estimated 879,483 births and 16.6 percent of the estimated 307,955 deaths. The National Identification Authority registered about 3.6 million citizens, and 13,500 foreign residents under the Foreign Identification Management System in 2019, which covered six out of the sixteen regions.
As part of the efforts to harness the demographic dividend, the National Development Planning Commission is leading the development of a Youth Development Index (YDI). The YDI process was initiated in 2019 to measure the progress of youth development and empowerment in areas such as education, health and wellbeing, employment and economic opportunity, political and civic participation. A technical working group has been constituted to oversee the development of the Index.
The urban population was 50.9 percent in 2010 and estimated at 57.2 percent in 2019
with variations across regions. Greater Accra Region had the highest rate of 91 percent, with the Upper West Region recording the lowest at 16 percent. Urbanisation presents opportunities for economic growth, improved productivity, employment and increased demand for goods and services. However, it also puts immense pressure on both the built and natural environment, resulting in congestion, formation and expansion of slums and urban sprawl.
The inflow of remittances helps to mitigate both individual and family vulnerabilities to economic risks and contributes directly and indirectly to national development. The share of remittances to GDP increased from 4.1 percent of GDP in 2018 to 5.4 percent in 2019.
2.2.2.7 Water and Environmental Sanitation
Access to safe and reliable water supply services
The proportion of the population with access to basic drinking water sources at the national level was 61.8 percent in 2019. This was a decline from the 2018 figure of 67.51 percent and a deviation from the target of 70.0 percent set for the year under review. The proportion of urban dwellers with access to safe drinking water also declined from 70.1 percent in 2018 to 61.3 percent. Rural dwellers with access to safe drinking water increased from 62.1 percent in 2018 to 62.3 percent in 2019.
Access to improved and reliable environmental sanitation services The percentage of population with access to improved liquid waste management increased from 15 percent in 2018 to 21 percent in 2019, exceeding the target of 18 percent set for the year. Similarly, 21 percent of communities were considered open defecation-free in 2019, compared to 16 percent in 2018.
Efficient and sustainable waste management.
The percentage of solid waste collected and properly disposed of in sanitary landfills in the five major cities Accra, Tema, Kumasi, Takoradi, and Tamale remained at 80 percent in 2019 just as was recorded in 2018.
State of the Food Insecurity reportUNICEF_SOWC_2019Measurements of hunger are based on data on undernourishment, child wasting, child stunting and child mortality, each reflecting deficiency in calories as well as in micronutrients. A score of 0 indicates no hunger while 100 points to extreme hunger. : K. von Grebmer, J. Bernstein, R. Mukerji, F. Patterson, M. Wiemers, R. Ní Chéilleachair, C. Foley, S. Gitter, K. Ekstrom, and H. Fritschel. 2019. 2019 Global Hunger Index: The Challenge of Hunger and Climate Change. Bonn: Welthungerhilfe; and Dublin: Concern Worldwide National Population Council, Ghana RAPID 2017 National Population Council, Ghana RAPID, 2017

18
Percentage of population whose liquid waste (faecal matter) were safely disposed on site or properly collected, transported and treated off site improved from 7 percent in 2018 to 19 percent in 2019.
2.2.2.8 Poverty and Inequality
Data from GSS indicates a fall in monetary poverty from 24.2 percent in 2012/13 to 23.4 percent in 2016/17 and in multidimensional poverty from 55 percent in 2011 to 45.6 percent in 2016/2017. In spite of these gains, spatial disparities persist, with monetary and multidimensional poverty being higher for rural (39.5 percent and 64.6 percent respectively) than urban (7.8 percent and 27.0 percent respectively) in 2016/17. About 19.3 percent of the population are both monetary and multidimensionally poor.
The incidence of multidimensional poverty was highest in the Northern region (80.8%), followed by Upper East (68.0%) and Upper West (65.5%) in 2016/17, while Greater Accra, Ashanti and Eastern regions registered the least incidence of 22.5 percent, 31.1 percent and 44.0 percent respectively in the same period. Lack of access to basic sanitation services, health insurance coverage and education were the major contributors to multidimensional poverty.
2.2.2.9 Child and Family Welfare
Almost one-third (28.2 percent) of all children live in monetary poverty with around 1 in every 10 living in extreme poverty in 2016/17. The Multi-Dimensional Child Poverty in Ghana study (NDPC, 2020) also estimated that in 2017/18,
Data is based on systems of CWSA and GWCL.Ghana´s National Multidimensional Poverty Index (MPI) has three dimensions–health, education, and living standards–and 12 indicators (cooking oil, water, assets, housing, overcrowding, electricity, toilet; school attendance, school attainment, school lag; and nutrition and health insurance
about 7 in every 10 children (73.4 percent) were multi-dimensionally poor, experiencing deprivations in at least three poverty dimensions. Figure 2.5 presents the proportion of children 0-17 years who are deprived in eight poverty dimensions.
The highest rates of deprivation were in sanitation, housing, learning and development and child protection. Children who were deprived in these dimensions lived in households that did not have access to improved sanitation and hygiene facilities, were overcrowded, and lacked access to electricity. Some of the children lacked access to books, playthings, early childhood education or interaction with older members of the household (children under 5 years). Some children were also exposed to negligent care and violent discipline, and physical abuse as punishment or correction for wrongful behaviour. Children under 5 years of age and those in rural and poor households experienced the most deprivations. The Upper West, Northern and Upper East regions recorded the highest rates of multi-dimensionally poor children. Table 2.13 presents the dimensional deprivation rates of children 0-17 years by area of residence and regional profiles.
Source: NDPC, 2019
Figure 2.5: Proportion of children 0-17 years who are deprived in the eight poverty dimensions, (%)

19
Table 2.13: Dimensional Deprivation Rates of Children 0-17 years by Area of Residence and Regional Profiles, (%)
Profile Nutrition Health Learning and
Development
Child
Protection
Water Sanitation Housing ICT
Rural 39.7 63.9 62 70.2 65.9 86.3 68.4 21.4
Urban 37.4 61 53 54.8 35.8 79.7 53.9 7.81
Upper West 35.1 56.1 68.8 61.8 52.6 86.4 71 43.1
Upper East 39.7 43.6 59 63.2 68 95 83.2 25.1
Northern 39.8 58.6 64.9 73.5 78.8 93.2 66.3 32.9
Brong Ahafo 35.2 49.9 59.4 68.7 55.4 83.7 68.8 18.1
Ashanti 38.3 60.2 56.3 57.9 34 80.2 60.7 10
Eastern 39.3 61.8 53.4 66.7 58.2 72.9 58.3 14.2
Volta 41.6 67.1 70.3 69.4 79 88.9 61.2 17
Greater Accra 38 71.5 51.6 52.6 33.4 80.8 51 6.27
Central 36 74.2 52 62.4 48.5 87 63.7 9.93
Western 42.6 69.3 58.4 64.5 56.6 80.8 59.7 11.2
Source: NDPC, 2019
In 2019, the Domestic Violence and Victims Support Unit (DOVVSU) recorded cases of child abuse offenses including defilement and attempted defilement (1,297), exposure of child to danger (72), early child marriage (4), child stealing (43), and 3,731 cases of child non-maintenance. The Ministry of Gender, Children and Social Protection (MoGCSP) also recorded 200 cases of child trafficking. There was an improvement in the vigilance of child trafficking, with the introduction of monitoring structures, an increase in rescue operations, and the provision of trauma care and support to child victims.
The Ghana Living Standards Survey Round 7 (GLSS 7) reported that 12.6 percent of children 5 to 14 years were in the labour force in 2016/2017. Of the total number of children in the labour force, 88.6 percent of them were employed in some form of economic activity (working children). There were more children in rural areas (90.5%) than in urban areas (80.9%), and more male children (91.7%) than female children (85.2%) engaged in some form of economic activity. The majority of the working children were engaged by the agriculture, forestry and fishing, and wholesale and retail trade sectors.
A mapping and scoping exercise of female head porters (kayayei) in urban market centres in the Greater Accra, Ashanti and Brong Ahafo regions in Ghana, conducted by MoGCSP in 2018, estimated the total number of kayayei at 47,517. Of the sampled kayayei, 6 percent were aged 15 years and below, with the lowest recorded age being 8 years. The mapping revealed that kayayei face many challenges, including: long hours of work (70.25% work 11 to 14 hours a day); poor accommodation (53.8% sleep in shared rented kiosks/metal containers); difficulty in accessing healthcare (26.9%); high cost of orthodox healthcare (12.05%); and exposure to sexual and gender-based violence, including rape, abortion, and teenage pregnancy (about 4.62% had their first child before age 15 and 42.9% from ages 15 to 18).
2.2.2.10 Support for the AgedPension payments and safety nets such as free subscription to the National Health Insurance Scheme (NHIS) and Livelihood Empowerment Against Poverty (LEAP) benefits are among the main sources of support for the aged. The National Pensions Regulatory Authority (NPRA) reported that 215,852 persons aged 60 years and above (which constitutes about 11% of the 2019 projected population of persons 60 years and above) received regular pension payments from SSNIT in 2019.5 The MoGCSP reported that the number of LEAP beneficiaries 60 years and above was 213,091.
5 Other groups of persons aged 60 years and above receive pension payments from the Controller and Accountant General’s Depart-ment.

20
2.2.2.11 Gender Equality
About 32.1 percent of public positions were held by women in 2019, which was below the target of 47.5 percent. The draft Affirmative Action (Gender Equality) Bill is before Cabinet for consideration and approval. When the Bill is passed, it will provide, among others, a legal basis for increasing women’s participation and representation in political and public life. During the year, the MoGCSP carried out various exercises to create awareness on domestic violence/sexual and gender-based violence and human trafficking, and trained various officers to provide support to survivors.
Public microfinance and business support schemes such as the Microfinance and Small Loans Centre (MASLOC) and the National Board for Small Scale Industries (NBSSI) are required to facilitate women’s access to credit. In 2019, NBSSI reported that about 55.9 percent of recipients of the loans it facilitated for Micro, Small and Medium Enterprises (MSMEs) were females. These female beneficiaries, however, received less than half (45.9%) of the total loans amount granted. The Board also provided various business development services to MSMEs to help increase their operating efficiency and growth. Females constituted about 61.2 percent of beneficiaries of the services provided, which included training, advisory, counselling and extension services, and provision of information.
2.2.2.12 Social Protection
The total number of households that received LEAP payments in 2019 was 322,200, which fell below the target of 350,000 but above the 2018 figure of 213,043. The government established 3,111 new LEAP communities in all the 260 districts in 2019 to reduce travel time of beneficiaries. The Complimentary Livelihood Asset Support Scheme (CLASS), a component of the Ghana Productive Safety Net Project, was developed with productive and financial inclusion measures to provide sustainable income earning opportunities for beneficiaries.
As of 2019, a total of 29 informal sector pension schemes had been established. In addition, informal sector workers are now able to contribute to Tier 3 of Ghana’s pension scheme through the Provident Fund and other private pension schemes. The number of informal workers contributing towards their pensions increased from 148,000 in 2017 to 173,000 in 2019.
2.2.2.13 Disability and Development
The National Council for Persons with Disability (NCPD) reported that District Assemblies were complying with the directive to disburse 3 percent of DACF to Persons with Disabilities (PWDs) in 2019. The Council built the capacity of sixteen (16) District Assemblies in Greater Accra in reporting on the management and disbursement of the common fund for PWDs. Also, stakeholders were trained on the Ghana Accessibility Standards on the Built Environment and the Draft Bill on the Amendments to the Disability Act, 2006 (Act 715) and the accompanying draft Legislative Instrument were completed for parliamentary engagement.
2.2.2.14 Employment and Decent Work
Labour Productivity Data from World Development Indicators point to overall decrease in labour productivity growth from 3.9 percent in 2017 to 3.0 percent in 2018 for Ghana. Growth in labour productivity was reported to be 7.8 percent and 7.4 percent respectively in 2017 and 2018 for agriculture; 6.1 percent and 2.7 percent for industry; and -2.2 percent and -1.0 percent for services.
Decent WorkThe creation of decent jobs is assessed along three dimensions. The fourth dimension which relates to Social Protection has been discussed above as a focus area.
Standards and Fundamental Principles and Rights at Work: The National Labour Commission (NLC),

21
Labour Department (LD) and National Tripartite Committee (NTC) continue to enforce the provisions of the Labour Act, 2003 (Act 651) and related policies and regulations on the rights of workers including freedom of association, collective bargaining and equal treatment. Despite progress towards gender equality at work, data from GSS in 2012/13, 2015 and 2016/17 indicate that women are largely underrepresented in wage employment and highly skilled occupations. In an attempt to ensure full protection of workers from occupational hazards, the draft National Occupational Safety and Health Policy and Bill has been resubmitted to Cabinet for approval.
Employment creation: The Agenda for Jobs recognises that despite Ghana being a lower-middle income country and among the fastest growing economies in the world, its economic growth has not generated enough employment opportunities to absorb the teeming youthful population (15-35 years), which constitutes about 34.2 per cent of the current population. The country’s labour market is dominated by the informal sector and vulnerable employment (accounting for 71.3 percent and 66.2 percent of total workers respectively in 2016/17). There is substantial labour under-utilization resulting mainly from high underemployment (21.4% of workers) and unemployment (8.4%). Furthermore, a large number of workers are involved in excessive working hours, with about 39.6 percent of all workers working more than 40 hours per week.
The government continues to address the present condition through its policies and interventions6 on job creation. Data from the Ministry of Employment and Labour Relations indicates that the total number of jobs created by Ministries, Departments and Agencies (MDAs), government interventions and the formal private sector initially decreased from 1,273,681 in 2017 to 1,087,749 in 2018, before increasing to 1,214,950 in 2019. Of these, job creation by the MDAs decreased from 242,461 in 2017 to 174,282 in 2018, but increased to 361,963 in 2019, while that of government interventions increased from 763,281 in 2017 to 913,467 in 2018 but declined to 852,987 in 2019.
Social dialogue: The National Labour Commission, Labour Department and the National Tripartite Committee, as well as the various Trade Unions and Employers Associations across the country seek to promote social dialogue, particularly in rights at work, conditions of employment, settlement of industrial disputes and determination of minimum wage. The MELR through the National Tripartite Committee reported an increase in the proportion of settled industrial disputes from 83.7 percent in 2017 to 92.0 percent in 2018 and 95.0 percent in 2019. The National Daily Minimum Wage and the Base Pay increased by 10 percent each in 2019 over the 2018 figure of GH₵9.68 and GH₵8.27 respectively.
2.2.2.15 Youth DevelopmentYouth who were provided with employable skills decreased from 70,356 in 2017/18 to 55,056 in 2018/2019, compared to the target of 100,000. In 2019, a total of 1,597 deprived and out of school youth were provided with leadership and skills training. In addition, the National Youth Authority, in partnership with MTN Ghana Foundation, provided skills training for 330 youth, including persons with disabilities in the age bracket of 16-24. A training programme for the development of mobile applications was also organised for 300 young people at the Afienya Youth Leadership and Skills Training Institute (YLSTI). Ten youth resource centres were constructed in 10 regions to provide the youth with spaces for engagement. The National Entrepreneurship and Innovation Programme (NEIP), in 2019, installed 75 greenhouse domes at the Dawhenya irrigation site in the Greater Accra Region to modernise agriculture and make it attractive to the youth.
2.2.2.16 Sports and Recreation
There was partial rehabilitation of the Aliu Mahama Sports Stadium in Tamale and the second phase rehabilitation of the Accra Sports Stadium. The Ministry of Youth and Sports also started construction of sports facilities at Abiriw in the Okere district in the Eastern Region. The sector increased the number
6 Such as “planting for food and jobs”, NABCO, Outgrowers Value Chain Fund (OVCF), National Entrepreneurship and Innovation Programme (NEIP), Ghana Commercial Agriculture Project, National Identification Authority (NIA) and Ghana Agri-culture Sector Investment Programme

22
of local competitive sporting events from 85 in 2018 to 92 in 2019, exceeding the target of 90. As part of Ghana’s commitment to promote global and regional integration through sports, the Ministry of Youth and Sports facilitated participation in 54 out of 90 targeted international and sub-regional sporting events in 2019. Proceeds from international sporting events increased from GH¢303,118.52 in 2018 to GH349, 663 in 2019.
A Normalization Committee was formed in 2018 to manage football following the uncovering of malfeasance in the Ghana Football Association. The Committee completed its mandate in 2019 with the election of a new GFA President, Executive Council Members and Regional Football Association (RFA) Executives.
2.2.3 Key Challenges And Policy Recommendations
The section outlines key challenges and proffers recommendations.
Table 2.14: Key challenges and recommendations for Social Development
No Challenges RecommendationsDeclining net enrolment at the kindergarten, primary and JHS levels,
Institute measures to improve net enrolment, gender parity at higher levels of education, and educational outcomes.Persistent gender disparities at higher
levels of education, and low proficiencies in numeracy and literacy
Re-emergence of the poliovirus, limited active NHIS subscription, and increase in HIV prevalence
• Ensure sustained financing to prevent vaccine preventable diseases, HIV and malaria.
• Improve access to health services through enhanced NHIS registration and infrastructure development.
Poor diets and high micronutrient deficiencies Prioritise health promotion especially on the importance of diets and its implications on morbidity and mortality.
Unchecked urbanisation Prioritise local economic development for equitable dis-tribution of Ghana’s population.
Inadequate access to basic water and sanitation services
Increase investments in the provision of adequate basic water and sanitation services and address open defeca-tion.High prevalence of open defecation
High incidence of multidimensional poverty, particularly for the northern belt of Ghana, rural dwellers, and among children under-five
Enhance targeting of programmes to identified multi-di-mensionally poor areas and vulnerable groups.
Inadequate attention to child participation at all levels of government
Institutionalise mechanisms for child participation at all relevant levels of government and decision making.
High incidence of child abuse including violent discipline, child labour and trafficking, streetism and the Kayayei phenomenon
Improve enforcement of laws and resource mobilization towards elimination of all forms of abuse, neglect and exploitation.
No coverage of population aged 60 - 69 in the exempt category of the NHIS
Review NHIS policy on the exempt category to include population aged 60 – 69.
Limited representation of women in politics and public life
Expedite the passage of the Affirmative Action (Gender Equality) Bill and ensure its full implementation.
Slow data collection of the Ghana National Household Registry
Ensure nation-wide coverage of the Ghana National Household Registry to improve targeting of the extreme poor households with tailor-made solutions.
Slow implementation of the Ghana Accessibility Standards in the Built Environment
Mainstream provisions of the Ghana Accessibility Stan-dards on the Built Environment into Ghana’s building code and establish monitoring systems to enforce com-pliance.

23
No Challenges RecommendationsLow labour productivity growth Expedite the implementation of the National Employ-
ment Policy.High gender disparities in wage employment and skilled occupations
High levels of vulnerable employment
Weak employable skills and high unemployment among the youth
Scale up technical and vocational skills training (includ-ing entrepreneurial skills) and employment creation for the youth.
Inadequate funding for sports and recreation. Accelerate efforts to set-up the sports fund.
2.3 Environment, Infrastructure And Human Settlements
2.3.1 Introduction
The overall goal is to safeguard the natural environment and ensure a resilient built environment. In the medium-term, the focus has been on protecting the natural resources including water, minerals, lands and forests; climate change adaptation and mitigation; disasters; reducing pollution; improving transportation, and information and communication technology (ICT). In addition, it was aimed at improving energy, science, technology and innovation (STI), human settlements and housing, land administration, zongos and inner cities.
An assessment of indicator performance of the 20 focus areas revealed a below average performance with an achievement rate of 22.8 percent. This notwithstanding, there were some achievements including the creation of 83,000 jobs under the forest plantation programme, the approval of the Digital Terrestrial Television (DTT) policy and Energy Sector Recovery Programme (ESRP). The National Road Safety Authority (NRSA) Act, 2019 (Act 993), Ghana Integrated Iron and Steel Development Corporation Act, 2019 (Act 988) and Biosafety (Management of Biotechnology) Regulations, 2019 (L.I. 2383) were also enacted during the year under review.
2.3.2 PROGRESS OF IMPLEMENTATION
2.3.2.1 Forest
Government undertook various interventions in implementing the Ghana Forest Plantation Strategy (2016-2040). These included supplying and planting of 19 million seedlings, establishing 21,356 ha of forest plantation, and maintaining 50,000 ha of existing forest plantations. These, among others, resulted in a reduction of degraded areas in forest reserves from 37.4 percent in 2018 to 18.0 percent in 2019.
2.3.2.2 Water Resources Management
Under the Clean Rivers Programme, government established the Inter-Ministerial Committee on Illegal Mining (IMCIM) and Operation Vanguard Taskforce (OVT) – a joint military and police task force to combat illegal mining (popularly known as galamsey) – which has resulted in continuous improvement in the quality of major water bodies. The proportion of water bodies with
Figure 2.6: Water Quality Index (%)
Source: Water Resources Commission, 2020
52.0

24
good ambient water quality accordingly increased from 55.9 percent in 2018 to 57.8 percent in 2019 (see Figure 2.6). The south-western river system including Pra, Tano, Bia and Ankobra basins, which deteriorated due to illegal mining, has gradually improved with the water quality index rising from 49.3 in 2017 to 53.0 in 2019.
2.3.2.3 Environment
An assessment of air quality at monitoring stations along Bus Rapid Transit (BRT) routes and some residential, commercial and industrial areas in Accra revealed that the levels of suspended particulate matter (PM10) were above the minimum threshold of 70μg/m3 set in Ghana Standard GS 1236 of 2019. The levels ranged from 102µg/m3 (Achimota station) to 139µg/m3 (Amasaman station) on the Achimota-Amasaman route and 139 µg/m3 (Kasoa station) to 143 µg/m3 (First light station) on the Kasoa-First Light route, indicating poor ambient air quality with the attendant health risks. The country’s ranking on the Global Green Economy Index dropped from 78th in 2018 to 79th in 2019 out of 130 countries. However, the score remained at 46.
The number of companies complying with environmental assessment permit conditions increased from 10,030 in 2018 to 11,060 in 2019. Similarly, a positive result was achieved in the total greenhouse gas (GHG) emissions in the country with a dip from 54.5 MTCO2e in 2018 to 42.2 MTCO2e in 2019. Government implemented climate adaptation initiatives such as One Village One Dam, Climate Smart Agriculture, Coastal Protection projects and Early warning Systems. Also, government developed Pesticides Guidelines on efficacy trial evaluation; and passed the Biosafety Regulations in an effort to improve the environment.
2.3.2.4 Minerals ExtractionAnnual production of bauxite and manganese increased by 10.4 percent and 8.8 percent while gold and diamonds decreased by 5.4 percent and 68.7 percent respectively in 2019. Total employment generated by the sector increased by 0.7 percent to 1,031,571 in 2019, of which 96.9 percent were in the small-scale mining sub-sector. These were achieved through the establishment of small-scale mining and industrial minerals directorate to support the mineral diversification, the development of Community Mining Scheme to reduce illegal mining and the establishment of 13 Regional, District and Satellite Offices to facilitate monitoring and acquisition of mineral rights.
Minerals rights granted regarding mining leases, prospecting, reconnaissance, salt, quarry, clay, sand winning, small-scale gold/diamond, and mica increased from 72 in 2018 to 315 in 2019. Royalties accruing to mining communities and merchandise exports increased by 42.7 percent and 15.7 percent respectively, while corporate taxes to government declined by 51.5 percent. Foreign direct investments increased from US$ 953.2 million in 2018 to US$969.4 million in 2019.
2.3.2.5 Disaster Management
The occurrence of disasters across the country increased by 10.5 percent to 2,217 in 2019. In all 2,643 communities were affected, 834 schools damaged, 1,750.01 hectares of farmlands and 45,252 houses destroyed, and 586 persons injured. The most common disasters were floods, windstorm, rainstorms, and domestic fires. A total of 223,843 people was directly affected; out of which 11,817 people were supported by National Disaster Management Organisation (NADMO).
The number of deaths, missing persons and persons affected by disaster per 100,000 people reduced by 30.5 percent to 739 in 2019. This downward trend was as a result of strategic government interventions including the dredging of 275 drains, organisation of 4,331 educational campaigns, radio talk shows and community durbars and engagement of 993 communities in disaster risk reduction.

25
2.3.2.6 Transportation: air, rail, water and road
Both domestic and international passenger air traffic increased by 64.9 percent and 6.8 percent respectively over the period of 2018 (see Figure 2.7). This achievement was due to the expansion of route network (Takoradi-Kumasi), rescheduling of flight departure times for passenger convenience, increased demand for seats on Accra-Tamale and Accra-Kumasi routes on Africa World Airlines, the “Year of Return” activities, and increased number of passenger trips by Air Peace in March 2019. In contrast, freight traffic declined by 4.9 percent to 49,846 in 2019. The reduction is attributed, among others, to the drop in volume of exports ferried by Qatar and British Airways as a result of increasing number of passengers during the year under review, leaving behind some cargo for safety reasons.
The government continued to improve upon the railway network and refurbish coaches. Passenger rail traffic increased by 207.9 percent to 1.94 million passengers-kilometres in 2019. This was mainly as a result of improvement in patronage of the Takoradi-Sekondi via Kojokrom sub-urban railway services and the resumption of the Accra-Tema sub-urban passenger rail services. In contrast, goods traffic decreased by 20.1 percent to 35,660 tonnes in 2019. Five major and 83 minor operational train incidents were recorded in 2019 with no recorded fatalities.
The government continued to construct and rehabilitate ferry landing sites and facilities along the Volta Lake. In 2019, freight and passenger traffic increased by 11.9 percent and 4.9 percent respectively. The number of vehicles ferried increased by 14.8 percent over the target for 2019. However, a comparison with 2018 showed a decline of 35 percent. The closure of the Yapei and Buipe bridges in the Central Gonja district for renovation accounted for the 2018 performance. The vessels turnaround time for transiting through Tema and Takoradi ports dipped by 12.1 percent and 5 percent to 103.09hrs and 124.37hrs in 2019 respectively.
In 2019, government rehabilitated and maintained 35 percent of the 78,401km total road network as compared to 55 percent in 2018. The provisional estimate of road crashes in 2019 was 13,877 representing 44.2 percent increase over that of 2018 (see Figure 2.8).
Figure 2.7: Passenger traffic & Freight movement by air, 2017-2019
Source: MoAv, 2020
Figure 2.8: Number of Road Crashes, Fatalities and Serous Injuries, 2017-2019
Source: MOT, 2020Inauguration of the rehabilited Accra-Tema Line (Accra Central Railway Station)

26
2.3.2.7 Science, Technology and Innovation
Government established a Presidential Advisory Council on Science, Technology and Innovation (PACSTI); supported the adoption of research and development, operationalised the Ghana Innovation and Research Commercialisation Centre (GRIC) as well as developed crop varieties, and initiated monitoring and assessment of telecommunication masts.
Research and Development (R&D) expenditure as a percentage of GDP remained at 0.08 percent for 2018 and 2019. However, it represents 60 percent increase over expenditure in 2017. The number of research findings adopted by industry rose from 70 in 2018 to 85 in 2019. The number of technologies commercialised also increased by 16.7 percent to 35 in 2019 (see Figure 2.9).
2.3.2.8 Energy and Petroleum
The government completed and commissioned 340MW Cenpower Power project, installed 147 MW Early Power project and completed a 225 kV Bolgatanga-Ouagadougou Interconnection project, which is a component of the WAPP Inter-zonal Transmission Hub Project. The first 45kW Micro Hydropower project was also constructed, among others to increase installed capacity from 4,889MW in 2018 to 5,171.6MW in 2019. Of the installed capacity, hydropower represents 30.6 percent, thermal power and renewables represent 68.6 percent and 0.8 percent respectively. Access to electricity continued to improve as the percentage of households with access to electricity increased marginally from 81.6 percent in 2018 to 82.5 percent in 2019. The improvements could be traced to the continuous expansion of transmission and distribution lines, connection of 445 communities to the national grid under the Rural Electrification Programme, among others.
Distribution and transmission losses exceeded the PURC benchmark of 21 percent and 3.8 percent respectively (see Figure 2.10). The Energy Sector Recovery Programme (ESRP) was also developed further to restore and sustain the financial viability and health of the energy sector.
The share of contracts awarded to indigenous companies declined by 36.5 percent to 28 percent in 2019. Meanwhile, the value of the contracts offered to indigenous companies increased in nominal terms from US$59.6 million in 2018 to US$72.6 million in 2019. However, in terms of shares, it declined from 19.5 percent to 16 percent, below the target of 50 percent set out in the Petroleum (Local Content and Local Participation) Regulations, 2013 (L.I. 2204). The proportion of Ghanaians employed in the oil and gas was 91 percent, 87 percent and 99 percent for management, technical and other positions respectively. This exceeded the 2019 target of 60-70 percent for management and technical, and 92 percent for other positions.
2.3.2.9 Human Settlements Development and Housing
By the end of 2018, only eight out of 260 MMDAs had prepared their Spatial Development Frameworks (SDFs) while ten had developed Structure Plans (SPs). There were neither spatial/structure plans prepared
Figure 2.9: STI adoption and commercialisation, 2017-2019
Source: MESTI, 2020
Figure 2.10: Distribution and Transmission Losses, 2017-2019
Source: ECG/VRA/GRIDCo, 2020

27
nor additional physical planning officers recruited in 2019. However, government provided financial clearance for the recruitment of additional physical planning officers in 2019. A total of 1,348 urban housing units were developed in 2019, constituting 43.8 percent of the annual target. Government also completed the review of the National Building Regulations, 1996 (L.I. 1630).
2.3.2.10 Land Administration and Management
The government continued its decentralisation and automation of land delivery services nationwide. The turnaround time for land title registration in 2019 remained at 150 working days same as in 2018. However, the turnaround time for deeds registration improved by 10 percent to 27 working days in the deed registration regions for the same comparative periods.
2.3.2.11 Zongos and Inner Cities Development
The Zongo Development Fund, in 2019 supported interventions in the areas of education, water, sanitation, drainage, roads, recreational facilities, street lights, and local economic development that impacted 50,681 persons (See Figure 2.11). This represents 374.3 percent increase over the 12,278 persons impacted in 2018.
2.3.3 Key Challenges And Policy Recommendations
Even though the Environment, Infrastructure and Human Settlements dimension recorded some successes, some few challenges prevailed. These challenges and their respective policy recommendations are presented in table 2.15 for consideration.
Table 2.15: Key challenges and recommendations for Environment, Infrastructure and Human Settlements
No Challenges RecommendationsLimited budgetary allocation and untimely release of funds
Provide adequate and timely funding for effective functioning of key government institutions to achieve government’s aim of reducing pollution and forest degradation, improving transportation and energy infrastructure, among others.
Illegal mining and pollution of water bodies
Intensify measures to stop illegal small-scale mining (galamsey) in collaboration with communities and traditional authorities while accelerating implementation of the Community Mining Scheme.
Improve water resources knowledge for all citizens to facilitate water resources planning and decision-making.
Figure 2.11: Number of people directly impacted through slums/zongo upgrading interventions under the Zongo Development Fund
Source: Zongo Development Fund, 2020

28
No Challenges RecommendationsPoor drainage systems. Develop and implement comprehensive drainage plans
for all cities and major towns, incorporating infiltration systems, rain harvesting, storage basins and pumping stations, where required. This should be complemented by strict enforcement of building, sanitation and buffer zone by-laws.
Absence of a national carrier to support the aviation hub vision.
Intensify efforts to establish a home-based carrier while sustaining upgrades and development activities at airports to achieve the goal of making Ghana an aviation hub. Also accelerate the creation of Air Navigation Services (ANS) and establish an independent aircraft Accident Investigation Bureau (AIB).
Ineffective regulatory regime within the railway sector.
Review the Railways Act, 2008 (Act 779) to decouple the regulatory functions from the infrastructure development functions of the Ghana Railway Development Authority and attract local and foreign investors to support the development of the railway sector.
Poor road maintenance/rehabilitation culture.
Review petroleum levy and tolls which are the main sources of inflows into the road fund, to ensure sustainability of the fund.
Limited funding for research and development.
Commit adequate funding to research and development to situate STI at the centre of government agenda and ensure its adequate application. In addition, the process of establishing the National Research Fund should be expedited.
Limited financial viability of the energy sector.
Fully implement the Energy Sector Recovery Programme (ESRP).
Non enforcement of Local Content Regulation.
Strengthen the implementation of the Petroleum (Local Content and Local Participation) Regulations, 2013 (L.I. 2204).
Inadequate housing units and abandoned uncompleted affordable housing projects.
Integrate government guarantees into incentive measures to attract private sector investments in the housing sector to address the ever-increasing housing deficit. Furthermore, government should implement a housing indicator programme to collect basic housing data from sub-national to national level to help provide accurate data on housing.
Limited Physical Planning Officers and Structure Plans at the MMDAs
Accelerate the recruitment of skilled physical planners to help develop and implement spatial plans (Structure and local plans) at the sub-national level to reduce haphazard development.Poor prioritisation of Spatial Planning
(Structure and Local Plans).
Long turnaround time for land title and deeds registration.
Take urgent steps to complete outstanding digitization of land records, automation of land services delivery, and the production of base and orthophoto maps to make land administration efficient and effective.
2.4 Governance, Corruption And Public Accountability
2.4.1 Introduction
The goal of this development dimension is to maintain a stable, united and safe country. This entails: deepening democratic governance and public accountability; enhancing public sector management and service delivery; promoting the rule of law and equal access to justice; promoting the peaceful

29
coexistence of all segments of society; and ensuring public safety and security.
Key achievements in this dimension included significant improvements in Police officer to citizen ratio and Fire officer to citizen ratio; increase in number of MDAs utilising the HRMIS; and the recovery of GH¢862,696.52 from the recommendations of the Public Accounts Committee.
2.4.2 PROGRESS OF IMPLEMENTATION2.4.2.1 Deepening Democratic Governance
Government continued to implement policy interventions to deepen governance and ensure effective operation of institutions that protect citizens’ rights. Compared to 2018, all independent governance institutions assessed, recorded an increase in their budgetary allocation for 2019 except NMC and Parliament of Ghana. Percentage change in budgetary allocation to EC, CHRAJ, Judicial Service and NCCE improved from 2018 to 2019 by 105 percent, 17 percent, 29 percent and 13 percent respectively. For the year 2019, NMC was the least resourced recording a 71 percent decline of its budgetary resource (see Figure 2.12). Parliament of Ghana received a budgetary allocation of about GH₵360.1 million which represents a 21 percent decline over the 2018 figure. This notwithstanding, Parliament in 2019 was able to hold 80 Plenary Sittings; pass 13 Bills into Law; enact 15 Legislative Instruments (L.I.s), ratify 16 International Agreements, and prepare 143 Committee Reports.
2.4.2.2 Accelerating and Sustaining Decentralisation
As part of the support for the implementation of the functions transferred to the MMDAs from the national level, article 252 of the 1992 Constitution provides that not less than 5.0 percent of the total national revenue be set aside and shared among all District Assemblies. Transfer of resources from central government to MMDAs declined from 2.24 percent in 2018 to 1.89 percent in 2019. The share of MMDAs total revenue in relation to total national revenue however increased from 2.53 percent in 2018 to 2.59 percent in 2019 (see Figure 2.13).
2.4.2.3 Enhancing Public Accountability
The Public Accounts Committee (PAC) continued to pursue measures to reduce financial irregularities identified in the Auditor-General’s Report in line with the National Anti-Corruption Action Plan (NACAP). The Committee held 5 public hearings to consider the Auditor-General’s Report on the Consolidated Fund and the District Assemblies Common Fund for the years 2015 and 2016. A total of 139 recommendations of the Public Accounts Committee were implemented resulting in the recovery of an
Figure 2.12: Budgetary allocation to IGIs, 2018&2019
Source: JS, NMC, EC, NCCE, CHRAJ, Parliament, 2020
Figure 2.13: MMDA share of total revenue, 2017-2019 (%)
Source: MLGRD, 2020

30
amount of GH¢862,696.52. In 2018, 53 recommendations were implemented and resulted in a recovery of about GH¢96 million.
2.4.2.4 Public Institutional Reform and Transformation
Implementation of the Integrated Public Service Human Resource Database System
In 2019, the integrated public service-wide Human Resource Management Information System (HRMIS) was scaled up to cover four additional MDAs, namely; Foods and Drugs Authority, National Board for Technical Examination (NABTEX), Economic and Organised Crime Office (EOCO), and GRATIS Foundations. This brings the total number of MDAs on the HRMIS to sixty-four (64), comprising 10 Commissions, 7 Services, 18 Ministries, 3 Departments and 26 Agencies. These public service institutions can now update the recruitment, promotions and separations of their staff in real time as well as generate various reports on HR data.
2.4.2.5 Human Security and Public Safety
Security Personnel in Frontline duties
To maintain peace and keep law and order, the Ghana Police Service continued to grow the size of its workforce from 32,347 in 2018 to 35,027 in 2019 representing about 7.6 percent increase. Police officer to citizen ratio improved from 1:916 in 2018 to 1:864 in 2019. This however fell short of the UN recommended ratio of 1:500. The Ghana Armed Forces (GAF) recruited 257 Officer Cadets in the year under review. Net recruitment rate declined from 10.1 percent in 2018 to 4.7 percent in 2019 while attrition rate increased from 0.8 percent in 2018 to 1.9 percent in 2019.
Crime and Imprisonment
Police-recorded crime increased from 213,436 in 2018 to 224,221 in 2019. The number of drug trafficking and drug related cases also increased from 532 to 627. Prison overcrowding in Ghana also continues to persist despite a marginal decline in the overcrowding rate in prisons from 52.5 percent in 2018 to 50.8 percent in 2019.
Fire PreventionFire officer to citizen ratio increased from 1:3,695 in 2018 to 1: 3,469 in 2019. This however was below the required UN standard of 1:800. Recorded incidence of fire outbreaks increased from 4,896 in 2018 to 5,308 in 2019.
Immigration
The Ghana Immigration Service conducted 3,148 inspections at various companies, hotels, residential premises, and educational institutions, among others. These inspections resulted in the arrest of 443 foreign nationals residing in the country without the requisite permits. Out of the total number, 196 were arrested for working without work permit, representing an increase of 59.4 percent against 123 arrested in 2018.
2.4.2.6 Corruption and Economic Crimes
Ghana ranked 80th out of 180 countries on Transparency International’s (2019) Corruption Perception Index, two places down from its 2018 position. Despite the drop in rank, the country’s score remained the same at 41.
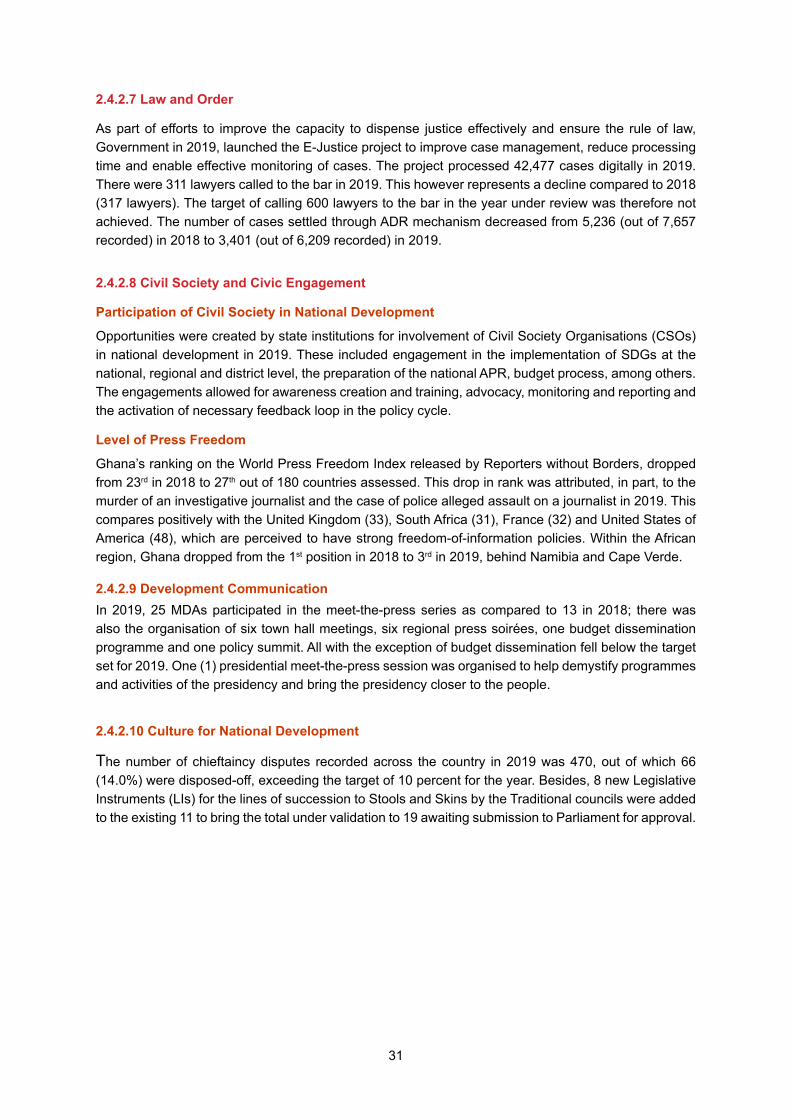
31
2.4.2.7 Law and Order
As part of efforts to improve the capacity to dispense justice effectively and ensure the rule of law, Government in 2019, launched the E-Justice project to improve case management, reduce processing time and enable effective monitoring of cases. The project processed 42,477 cases digitally in 2019. There were 311 lawyers called to the bar in 2019. This however represents a decline compared to 2018 (317 lawyers). The target of calling 600 lawyers to the bar in the year under review was therefore not achieved. The number of cases settled through ADR mechanism decreased from 5,236 (out of 7,657 recorded) in 2018 to 3,401 (out of 6,209 recorded) in 2019.
2.4.2.8 Civil Society and Civic Engagement
Participation of Civil Society in National Development
Opportunities were created by state institutions for involvement of Civil Society Organisations (CSOs) in national development in 2019. These included engagement in the implementation of SDGs at the national, regional and district level, the preparation of the national APR, budget process, among others. The engagements allowed for awareness creation and training, advocacy, monitoring and reporting and the activation of necessary feedback loop in the policy cycle.
Level of Press Freedom
Ghana’s ranking on the World Press Freedom Index released by Reporters without Borders, dropped from 23rd in 2018 to 27th out of 180 countries assessed. This drop in rank was attributed, in part, to the murder of an investigative journalist and the case of police alleged assault on a journalist in 2019. This compares positively with the United Kingdom (33), South Africa (31), France (32) and United States of America (48), which are perceived to have strong freedom-of-information policies. Within the African region, Ghana dropped from the 1st position in 2018 to 3rd in 2019, behind Namibia and Cape Verde.
2.4.2.9 Development CommunicationIn 2019, 25 MDAs participated in the meet-the-press series as compared to 13 in 2018; there was also the organisation of six town hall meetings, six regional press soirées, one budget dissemination programme and one policy summit. All with the exception of budget dissemination fell below the target set for 2019. One (1) presidential meet-the-press session was organised to help demystify programmes and activities of the presidency and bring the presidency closer to the people.
2.4.2.10 Culture for National Development
The number of chieftaincy disputes recorded across the country in 2019 was 470, out of which 66 (14.0%) were disposed-off, exceeding the target of 10 percent for the year. Besides, 8 new Legislative Instruments (LIs) for the lines of succession to Stools and Skins by the Traditional councils were added to the existing 11 to bring the total under validation to 19 awaiting submission to Parliament for approval.

32
2.4.3 KEY CHALLENGES AND POLICY RECOMMENDATIONS
The section outlines key challenges and proffers recommendations.
Table 2.16: Key challenges and recommendations for Governance, Corruption and Public Accountability
No Challenges RecommendationsInadequate resources to some independent governance institutions
Increase financial resource allocation and timely release of funds to IGIs such as NMC and Parliament.
Delay in implementation of PAC recommendations
Anti-corruption bodies such as CHRAJ, OSP, OAGMOJ should pursue implementation of PAC recommendations.
Strengthen coordination and monitoring of the implementation of NACAP
Increase in crime Improve police visibility across the country
Promote Community Policing
Congestion in Prisons Adopt non-custodial sentencing as a measure to decongest Prisons
Limited engagement with citizenry on development efforts
Promote the utilization of existing platforms to enhance development communication at all levels.
Limited codification of lines of succession to Stools and Skins by Traditional Councils
Accelerate the passage of Legislative Instruments (LIs) for the lines of succession to Stools and Skins and sensitize Traditional Authorities.
2.5 Ghana’s Role In International Affairs
2.5.1 Introduction
The overall goal of this development dimension is to strengthen Ghana’s role in international affairs. To attain this goal, the following policy objectives were pursued: promoting a globally competitive Foreign Service; enhancing Ghana’s international image and influence in international organisations; leveraging Ghana’s governance and security credentials to promote the country’s political and economic interests abroad; and integrating the Ghanaian diaspora in national development.
In May 2019, the President Nana Addo Dankwa Akuffo-Addo was reappointed as the Co-Chair of the Eminent Group of Advocates for the SDGs. The SDGs and Africa Union’s Agenda 2063 have been mainstreamed into the planning and budgeting processes of Ghana. In recognition of Ghana’s efforts at implementing the SDGs, the President of the 73rd United Nations General Assembly, H. E María Fernanda Espinosa Garcés, visited Ghana to help strengthen multilateral relations. The Ministry of Foreign Affairs and Regional Integration targeted 39 high-level visits and exceeded it by fourteen. President Nana Akuffo-Addo’s visit to Barbados resulted in the request for supply of 375 Ghanaian nurses to boost healthcare delivery.
2.5.2 PROGRESS OF IMPLEMENTATION2.5.2.1 Extent of penetration of Ghanaian products in foreign markets
The number of Ghanaian products that penetrated foreign markets in 2019 was 30, exceeding the target of 25. To facilitate the promotion of these Made-in-Ghana products, Trade Attachés in Ghana’s missions abroad were trained to assiduously push Ghanaian products unto the shelves of shopping malls globally. Trade exhibitions held in the year were 45 against a target of 30. This was an improvement on the previous year’s performance in which 20 exhibitions were held. The Government of Ghana

33
strengthened the Diaspora Office established at the Presidency to ensure effective mobilisation of Ghanaians living abroad for national development. MFARI during the year under review mobilised 35 persons in diaspora for development.
The year 2019 was declared by President Nana Akuffo-Addo as the ‘Year of Return’ which brought thousands of African Americans and Afro-Caribbeans from all over the world to Ghana to mark the 400th anniversary since the first Africans were taken to the Americas as slaves. The occasion encouraged not only people of African descent but many people from across the globe to contribute to the development of Africa. The ‘Year of Return’ afforded the country the opportunity to introduce some made-in-Ghana products such as Kente, Chocolate, Artefacts, locally manufactured fabrics, and foot wears, among others to the diasporians who visited the country.
Ghana won the bid to host the African Continental Free Trade Area (AfCFTA) Secretariat at the 12th African Union Extraordinary Summit held in Niamey, Niger. Ghana contested against Egypt, Ethiopia, Kenya, Madagascar, and Senegal to host the Secretariat of the market that covers 1.2 billion people with a combined GDP of US$ 2.5 trillion.
2.5.2.2 Degree of implementation of the Representation of the People Amendment Act, 2006 (Act 699)
Representation of the People Amendment Act (ROPAA), 2006 (Act 699) allows Ghanaians abroad to vote during general elections in Ghana. The Act was passed in 2006 but was not implemented due to a myriad of operational and administrative challenges faced by the Electoral Commission (EC). In May 2019, an eight member ROPAA committee engaged the Senegalese Electoral Commission, Ghanaian Community in Senegal, and other strategic institutions in Senegal to share ideas and solicit their views towards implementation of the law. The committee paid study visits to the United States of America, The Netherlands and other Latin American countries to familiarise with their systems in 2019.
The number of Ghanaians registered with Ghana Missions abroad increased from 1,000,000 to 3,581,545 nationals against the target of 1,300,000 in 2019. The registered Ghanaian nationals, potentially provide a credible database of Ghanaians living in the diaspora to be registered by the National Identification Authority and Electoral Commission that can help in the implementation of ROPAA. Beyond the opportunity to participate in elections, the Government of Ghana announced the establishment of African Diaspora Investment and Savings Account also known as ‘Sankofa Bond’ or the Africa Sankofa Account (ASA)7 for development.
2.5.2.3 Turn-around time for processing biometric passports
The turn-around time for processing biometric passports has improved tremendously. The MFARI has reduced the turnaround time from 15 days in 2018 to 10 days in 2019. However, this fell short of the set target of 7 days. This notwithstanding, 314,500 passports were issued in 2019 globally by MFARI, exceeding the target of 300,000. This was made possible partly through the issuance of biometric passports by 7 missions abroad.
2.5.2.4 Level of contribution of Ghana’s peacekeeping efforts
In 2019, Ghana’s security personnel were involved in 10 peacekeeping missions around the globe, as happened in the previous year. These were: United Nations Interim Force in Lebanon (UNIFIL); United Nations Organization Stabilization Mission in the Democratic Republic of Congo (MONUSCO); United Nations Mission in South Sudan (UNMISS); United Nations Multidimensional Integrated Stabilisation Mission in Mali (MINUSMA); United Nations Mission for the Referendum in Western Sahara (MINURSO);
7 A diaspora bond is a debt instrument issued by a country or potentially, a sub-sovereign entity or even a private corporation to raise financing from its overseas diaspora.

34
United Nations African Union Mission in Darfur, Sudan (UNAMID); United Nations Interim Security Force for Abyei (UNISFA); African Union Mission in Somalia (AMISOM); United Nations Disengagement Observer Force (UNDOF) and United Nations Multidimensional Integrated Stabilisation Mission in the Central African Republic (MINUSCA).
2.5.2.5 Number of Ghanaians occupying positions in International Organisations
The Government of Ghana through MFARI assisted Ghanaians to take up positions in international organisations such as ECOWAS, AU, and UN. In 2019, seven Ghanaians were assisted to occupy positions in internationals organizations as against the target of eight. In the ECOWAS and AU level
however, the number of Ghanaians elected was seven which exceeded the target of five set for 2019.
2.5.3 KEY CHALLENGES AND POLICY RECOMMENDATIONS
The section outlines key challenges and proffers recommendations.
Table 2.17: Key challenges and recommendations for Ghana’s Role in International Affairs
No Challenges RecommendationsInadequate Trade Fair facilities Expedite the redevelopment of the Trade Fair Centre to
help make Ghana a trade hub as the country hosts the AfCFTA Secretariat.
Delay in implementation of ROPAA Expedite actions on the technical and administrative modalities for the implementation of the ROPAA roadmap.
2.6 Linking The 2019 Budget To The Implementation Of The Policy Framework
2.6.1 Introduction
In accordance with section 21 (3) of the Public Financial Management Act, 2016 (Act 921), the Minister of Finance presented the 2019 budget statement and economic policy to Parliament in November 2018. The policy, dubbed Mpontuo budget, aimed at providing opportunities for growth and job creation. This section assesses the linkage between the 2019 budgetary allocations and the priorities of the MTNDPF, 2018-2021.The section also examines expenditure on government’s 18 flagship programmes and projects, the distribution of discretionary expenditure, examines the alignment of 2019 spending priorities with the thematic areas of
the MTNDPF and an analysis of the budgetary allocation to the Sustainable Development Goals (SDGs).
2.6.2 Sector Allocation And Expenditure
In 2019, total resource allocated for implementation of activities of the key sectors of the economy was GH¢ 28.4 billion. Out of this, social sector was allocated the highest of GH¢13.4 billion which represented 47.0 percent, and administration allocated GH¢ 6.6 billion (23%). In addition, public safety

35
received GH¢ 4.7 billion (representing 16.7%), infrastructure GH¢ 2.2 billion (representing 8%) and economic GH¢ 1.3 billion (representing 4.6%).
The provisional expenditures, however, show that a total of GH¢ 30.7 billion was released to implement the activities of the key sectors of government. This was more than the initial budget allocation by GH¢ 2.3 billion. From Figure 2.14, over 50 percent of the actual expenditure in 2019 went to fund activities in the social sector, exceeding allocation made by 5 percent. Similarly, public safety and economic sectors which were allocated a budget of GH¢ 4.7 billion and GH¢1.3 billion had actual disbursement of GH¢6.0 billion and GH¢2.1 billion respectively, exceeding their allocation by about 2 percent. A total budget of GH¢ 2.2 billion and GH¢ 6.6 billion was earmarked for infrastructure and general administration but actual expenditures were in amounts of GH¢1.3 billion and GH¢5.1 billion respectively. This indicates that the actual release to the infrastructure sector fell short by 4 percent of the budget, while the administration sector also fell short of the budgeted allocation by 7 percent. While it is evident from the above that government deviated in some sectors between budget allocations and actual spending, in nominal terms, actual expenditure to the infrastructure sector suffered a significant downward deviation between budget and actual of about GH¢ 966 million and GH¢ 1.4 billion for general administration sector.
Figure 2.14: Sectorial allocation and expenditure, GHc
Source: Constructed from Ministry of Finance 2020 data
2.6.2.3 Flagship Programmes and Projects (FPPs)
The 18 Flagship Programmes and Projects (FPPs) contained in the MTNDPF reflects government’s development priorities. Table 2.18 shows the list of FPPs per development dimension together with the budgetary allocation, actual payments and responsible MDAs.
Table 2.18: FPPs by Development dimensions
Development Dimensions
New Initiative 2019 Budgetary
Allocation (GH¢)
Actual Payment (GH¢)
Government Agency
Economic
MASLOC 95,000,000 80,000,000 Office of Government Machinery
One-District One Factory (1D1F) 95,000,000 53,249,804 Ministry of Trade and Industry
Planting for Food & Jobs (PFJ) 608,000,000 553,420,605 Ministry for Food and Agriculture

36
Development Dimensions
New Initiative 2019 Budgetary
Allocation (GH¢)
Actual Payment (GH¢)
Government Agency
Governance Cor-ruption and Public Accountability
Capitalization of new regions 122397213 30,202,814 Ministry of Regional Reorganisa-tion & Development
Government Communication 20,613,832 19,096,710 Ministry of Information
Nation Builders Corp (NABCO) 850,000,000 804,511,100 Office of Government Machinery
National Identification Pro-gramme
285,000,000 259,318,719 Office of Government Machinery
Environment, Infrastructure and Human Settlements
Infrastructure for Poverty Eradi-cation Programme (IPEP)
1,254,000,000 366,036,592 Ministry of Special Development Initiatives
Railway Development 95,000,000 141,794,866 Ministry of Railway Development
Roads Infrastructure 498,635,952 327,147,194 Ministry of Roads and Highways
Zongo Development Fund 72,819,401 14,467,417 Ministry of Inner-City and Zongo Development
Water and Sanitation Pro-gramme
(Partly Sinohydro)
58,869,923 17,891,128 Ministry of Water & Sanitation
Fish Landing Sites (Funded under CDB)
Ministry of Transport
Social
Nurses Training Allowance 231,200,000 256,000,000 Ministry of Health
Teacher Training Allowances 169,912,081 253772881 Ministry of Education
Free SHS 1,682,641,925 1,191,327,175 Ministry of Education
Livelihood Empowerment Against Poverty (LEAP)
168,000,000 167,098,431 Ministry of Gender, Children & Social Protection
National School Feeding Pro-gramme
362016517 503,487,353 Ministry of Gender, Children & Social Protection
TOTAL 6,769,588,094 4,950,202,104
Source: Ministry of Finance 2020
The FPPs accounted for 23.5 percent of government budget in 2019, and 16.4 percent of total expenditure. Although the government exceeded its budget by about 8.2 percent, actual expenditure on FPPs fell short of the budgetary allocation by 24.4 percent.
Based on development dimensions, FPPs under Social Development were allocated GH¢2.6bn, representing 39.2 percent of the total budget for FPPs. Environment, Infrastructure and Human Settlements and Governance, Corruption and Public Accountability were allocated GH¢1.2bn (19.2%) and GH¢1.9bn (29.7%) respectively. The FPPs under Economic development were allocated GH¢79m, representing 12 percent.
With regards to actual expenditure, GH¢2.3bn was spent on FPPs under Social Development, representing 47.1 percent of total expenditure on FPPs. Governance, Corruption and Public Accountability received 22.1 percent of FPPs total expenditure while Environment, Infrastructure and Human Settlements dimension
received 17.2 percent. The FPPs under Economic dimensions received 13.6 percent (See Figure 2.15).

37
Figure 2.15: Government Budget and Actual Expenditure of FPPs by Development Dimensions
Source: Constructed from Ministry of Finance 2020 data
In order of ranking, Social Development received the highest budget allocation. Environment, Infrastructure and Human Settlements Development received the second-highest budget allocation, while Governance, Corruption and Public Accountability and Economic followed in that order. Similarly, in terms of actual expenditure, the ranking order was as follows: Social Development; Governance, Corruption and Public Accountability; Environment, Infrastructure and Human Settlements; and Economic (See figure 2.15).
Regarding actual expenditure relative to budget, government, on average, implemented about 60 percent of its budget for FPPs. Social development, which was the top priority of government had 90.7 percent of its budget executed. Also, Governance, Corruption and Public Accountability and Economic development had 87 percent and 86 percent of their budgets released and expended respectively. Environment, Infrastructure and Human Settlements development had 43.8 percent of its budget spent.
The top five priorities of government, in terms of the budget to the individual initiatives, were as follows: Free SHS (25.30% of the total budget for FPP), IPEP (18.8 %), NABCO (12.75%), PFJ (9.12 %) and Road Infrastructure (7.48%) respectively. Based on budget execution the government prioritised Free SHS (23.64%), NABCO (15.97%), PJF (10.98%), School Feeding (9.99%) and IPEP (7.26%) as shown in Table 2.19.
Budget for Teacher Training Allowances was exceeded by 149.36 percent, Railway Development by 149.26 percent and the National School Feeding Programme also by 139.08 percent. Nurses Training Allowances overran its budget by 110.73 percent whereas LEAP exceeded its budget by 99.46 percent. Except for Railway Development, all government budget overruns were within the social development dimension.
2.6.3 Poverty Reduction Spending In 2019
About 65 percent of Government’s total budget was approved and allocated to the implementation of interventions under the 17 SDGs. Out of this, an amount of 383.6 million (0.7%) was approved
Table 2.19: Ranking of Top Five Priorities of Government per Budget and Expenditure
RankingTop Five FPPs
(Budget)Top Five FPPs (Expendi-
ture)1st Free SHS (25.3%) Free SHS (23.64%)
2nd IPEP (18.8%) NABCO (15.97%)3rd NABCO (12.75%) PJF (10.98%)4th PFJ (9.12%) School Feeding (9.99%)5th Road Infrastructure (7.48%) IPEP (7.26%)
Source: NDPC, based on data from Ministry of Finance 2020

38
specifically for the SDG 1 which focusses on ending poverty in all its forms. This amount ranked 9th in terms of size allocated to all the 17 SDGs. The GoG contributed the highest source of funding out of 5 main sources in the amount of 273.9 million (71.41%). Relatively, Development Partners’ contribution was GHS6.54 million which constitute only 1.7 percent. This demonstrates the minimal dependence on external funding for poverty reduction initiatives. The least source of funding for the SDG 1 was Internally Generated Funds (0.6%) whilst the contribution from statutory and other funds were 17.4 percent and 8.9 percent respectively.
Generally, Goal 1 has 7 main targets as indicated in Table 2.18. Aside from the total allocation to the Poverty Goal 1, the targets also demonstrated the government’s priorities in tackling the pockets of poverty. Out of the 383.6 million allocated to Goal 1, GHS194.21 million (50.6 %) was targeted at social dimensions of poverty, followed by extreme poverty (37.9%), and building resilience against disaster risks (6.9%). Table 2.20 indicates the budgetary allocations by source for SDG 1.
Table 2.20: 2019 Budget Allocation towards SGD1 (No Poverty) for MDAs/MMDAs (in GH¢ million)
SDG 1 Targets DP GOG IGF Other funds
statutory Grand Total
1.1 Extreme poverty 79.59 0.02 65.4 0.51 145.52
1.2 Reduce poverty proportion of men, wom-en and children by at least half
0.16 0.05 1.53 1.75
1.3 Social dimension 1.64 170.08 1.26 0.53 20.7 194.21
1.4 Equal rights to basic services 0.12 0.03 1.75 1.89
1.5 Build resilience of the poor and vulner-able
4.85 12.38 0.77 0.78 7.58 26.35
1.6 Mobilization of resources 0.05 0.11 0.11 0.87 1.14
1.7 Pro-poor and Gender 11.49 0.07 0.04 1.15 12.75
Total 6.54 273.92 2.3 66.75 34.1 383.61
Source: Ministry of Finance, Ghana’s 2019 SDGs Budget Report
2.6.4 Key Challenges And Policy Recommendations
The section outlines key challenges and proffers recommendations.
Table 2.21: Key challenges and recommendations for Ghana’s Role in International Affairs
No Challenges RecommendationsHigh variance between budget allocation and actual expenditure for infrastructure
Ensure adequate protection to the allocations made to the infrastructure sector to accelerate growth and economic transformation.
2.7 Implementing the MTNDPF at the district level
2.7.1 Introduction
This section assesses progress made in implementing the MTNDPF at the district and regional levels. It analyses the income and expenditure of Metropolitan, Municipal and District Assemblies (MMDAs) for plan implementation, monitoring and evaluation. It also assesses the staff strength of the MMDAs to carry out their

39
mandates. The section concludes with a performance review of selected poverty-reduction interventions and the twenty core district indicators.
There was an increase in Internally Generated Funds and District Development Facility by 13 percent and 54 percent respectively over the 2018 period. Besides, the 1D1F initiative, provided direct and indirect jobs thereby improving the wellbeing of Ghanaians at the local level. Moreover, Ahanta West and Accra Metropolitan Assembly were the only districts in 2019 that achieved the minimum staffing requirement per the Office of the Head of Local Government Service (OHLGS) staffing norms. Nevertheless, a high percentage of Annual Action Plans were implemented in 2019, with MMDAs in Greater Accra region implementing, on average, a higher proportion of their annual action plans.
2.7.2 PROGRESS OF IMPLEMENTATION
2.7.2.1 Financing District Level Development
A total of GH¢1.65 billion was realised as revenue from all sources by MMDAs in 2019 representing 13.0 percent increase over the 2018 performance. The main sources of the revenue were District Assemblies Common Fund (DACF), District Development Facility (DDF), Government Grants and Internally Generated Funds (IGF), see Table 2.22. District Assemblies’ Common Fund (DACF) transfers declined from GH¢ 484 million in 2018 to GH¢ 480 million in 2019.
DDF transfers for 2019 was GH¢ 202 million as compared to GH¢131 million in 2018. IGF was GH¢ 387 million in 2019, a 13 percent increase over 2018. It contributed 23.4 percent of the share of total revenue in 2019. The main sources of IGF in 2019 were licenses, rates, royalties, rents, fines, fees, permit, investment income, sales of tender documents and business taxes. The significant contribution of IGF to total revenue can be attributed to efforts made by the assemblies to implement their Revenue Improvement Action Plan (RIAP).
2.7.2.2 Expenditure of Metropolitan, Municipal and District Assemblies
The total expenditure by MMDAs in 2019 was GH¢1.67 billion representing an increase of 15.4 percent over 2018. Out of the total expenditure, the share of recurrent expenditure constituted 76.8 percent, while capital expenditure was 23.2 percent (See Table 2.23). MMDAs recorded a deficit of 1.2 percent in 2019.
DDF-one of the funding mechanisms of projects and programmes at the district level. It is a discretionary funding incentive by government to MMDAs which comply with the rules, legal regulations and policies in the performance of their mandate. Compliance is confirmed through an assessment conducted on yearly basis using the District Performance Assessment Tool (DPAT).
The total number of activities carried out (completed or ongoing) as a percentage of planned activities in the annual action plans.
MMDAs in the Ashanti region spent the highest share of their total revenue on recurrent expenditure (89.5%) followed by Greater Accra (76.7%), Northern (80.6%) and Oti (80.5%). Upper West region (57.3%) recorded
Table 2.22: Revenue of MMDAs by Sources, 2017-2019
Revenue Sourc-es
Amount GH¢ (million) Percentage change 2017 2018 2019 (2018 and 2019)
GOG Grants 316.96 414.77 484.22 16.7
IGF 290.55 343.28 387.89 13.0DACF* 351.95 484.82 480.00 -1.0DDF 1.85 131.38 202.83 54.4
Donor Support 115.99 55.34 76.25 37.8
Others 0.54 30.79 27.08 -12.1
Total 1,152.09 1,469.01 1,658.27 12.9
Source: MLGRD, 2020; * Office of the Administrator of District Assemblies Common Fund, 2020

40
the least share of their total revenue as recurrent expenditure. (See Figure 2.15). Regional summary of the different categories of MMDAs expenditure performance has been provided in Appendix VI.
Table 2.23: Summary of Expenditure of Metropolitan, Municipal and District Assemblies (MMDAs) in 2019
Recurrent Expenditure GH¢ (million) Capital Expenditure GH¢ (million)
Years
Compen-sation of Employees
Use of Goods & and Services
Con-sumption of Fixed Capital
Social Benefits
Other Expenses Capital Exp. (IGF)
Capital Exp. (CF&OTHERS)
2018 472.94 404.29 298.51 2.66 96.00 2.75 473.152019 540.34 433.52 223.32 4.49 307.71 20.71 368.20
Source: MLGRD, 2020
2.7.2.3 Human Resource Status of MMDAs
A total of 37,008 staff were at post in all the 260 districts in 2019. About 74.5 percent of the total staff were on government payroll while the rest were contract staff (IGF staff) of the Assemblies.
Based on the Office of the Head of Local Government Service (OHLGS) Staffing Norms, a minimum of 718 and a maximum of 1,126 personnel are required to work in each metropolitan assembly whilst 465 to 690 personnel are required to work in each municipal assembly. The district assembly requires 356 to 519 personnel to function at its minimum and maximum capacities. With the exception of Accra Metropolitan and Ahanta West Municipal Assemblies, all MMDAs do not have the minimum required staff strength. About 89.6 percent of MMDAs are critically understaffed with staff strength being less than 50 percent of the minimum required (See Table 2.24).
Annual action plans (AAP) implemented in 2019 was, on average, 75.1 percent. Greater Accra region had the highest implementation rate of 87.9 percent while Ahafo region recorded the lowest implementation rate of 53.4 percent. (See Figure 2.16).
Figure 2.16: Proportion of AAPs implementation in 2019, (%)
Sources: NDPC, 2020
Table 2.24: Staff strength of MMDAs in 2019
Type of MMDA
Coverage of Minimum Threshold
Less than 50% 50% or More TotalMetropolitan 2 4 6
Municipal 95 11 107Districts 136 12 147Total 233 27 260
Sources: MLGRD, 2020

41
2.7.2.5 Selected Poverty-Reduction Programmes
National Health Insurance Scheme
The national subscriber base recorded an annual increase of 13.8 percent to 12,290,245 in 2019. The Ashanti Region continued to lead with the highest share of members despite a decline from 18.4 percent in 2018 to 18.3 percent in 2019. Oti and Savannah regions recorded the lowest share of 1.7% and 1.9% respectively because of the relatively small size of their population. Table 2.25 provides the regional distribution of subscribers in 2019.
Table 2.25: Regional distribution of NHIS subscribers by region in 2019
Region Informal Exempt SSNIT Pension-
ers
SSNIT Contribu-
tors
Secu-rity Ser-vices
Total Sub-scription
Share of Total
Sub-scrip-tion
Regional Population
Under 18 Above 70
Indi-gents
Preg-nant
Women
Ahafo 84,108 130,517 10,720 18,485 12,185 1,147 11,217 41 268,420 2.20% 545,853
Ashanti 851,181 1,055,933 100,973 21,234 108,434 11,422 94,375 282 2,243,834 18.30% 5,924,298
Bono 235,601 314,017 28,991 44,394 21,270 3,421 27,868 9 675,571 5.50% 1,081,151
Bono East 176,234 270,042 19,647 48,903 26,144 1,806 17,362 4 560,142 4.60% 1,084,091
Central 307,282 425,288 44,250 13,256 56,207 5,604 45,983 84 897,954 7.30% 2,605,490
Eastern 500,727 620,593 76,604 21,282 55,938 10,348 68,833 7 1,354,332 11.00% 3,318,853
Greater Accra 697,589 711,078 67,508 14,724 99,432 15,365 112,689 4 1,718,389 14.00% 5,055,765
North East 55,689 127,777 9,662 34,068 14,347 307 4,008 34 245,892 2.00% 529,294
Northern 176,979 330,913 30,694 96,881 66,045 1,388 22,286 108 725,294 5.90% 2,169,651
Oti 63,031 91,582 9,896 21,255 16,194 729 7,620 - 210,307 1.70% 586,509
Savannah 60,309 104,432 8,161 40,901 18,387 396 5,798 2 238,386 1.90% 538,327
Upper East 209,104 367,689 46,550 65,592 25,460 1,635 21,780 80 737,890 6.00% 1,302,718
Upper West 144,688 216,692 18,309 74,592 19,953 1,366 16,385 7 491,992 4.00% 868,479
Volta 227,538 280,717 44,769 155,783 27,364 6,230 36,290 - 778,691 6.30% 2,180,969
Western 286,568 364,153 26,311 3,790 37,083 5,323 40,025 - 763,253 6.20% 2,002,683
Western North 131,896 192,638 10,804 9,448 22,288 1,191 11,633 - 379,898 3.10% 1,161,071
National 4,208,524 5,604,061 553,849 684,588 626,731 67,678 544,152 662 12,290,245 100 30,955,202
Percent-ages 34.20% 45.60% 4.50% 5.60% 5.10% 0.60% 4.40% 0.01%
Sources: NHIA, 2020
Capitation Grant
The capitation grant increased from GH¢9 per pupil in the 2017/2018 academic year to GH¢10 per pupil in the 2018/2019 academic year. The total number of beneficiaries also increased from 5,805,445

42
in 2017/2018 academic year to 5,807,016 in 2018/2019 academic year. Total disbursement was GH¢58,070,160.00 in 2018/2019 academic year, which represents an increase of 9.6 percent over 2017/2018 academic year. The Ashanti Region continued to record the highest enrolment (17.4%) followed by Northern (13.9%), Brong Ahafo (11.0%), and Western(10.4%) regions. The lowest enrolment was recorded in the Upper West region (4.5%).
Ghana School Feeding Programme Nationally, the programme covered about 2.9 million kindergarten and primary pupils in 2018/19 academic year, representing an annual increase of 14.5 percent. The increase was due to expansion in coverage of the programme and increase in enrolment. An amount of GH¢500 million was released to support implementation of the programme and this represents an increase of 29.8 percent over 2017/2018 academic year.
The GSFP initiative created nine thousand, five hundred and sixty-one (9,561) jobs in 2019 (See Table 2.28). The largest number of jobs were created in the Ashanti, Eastern, Northern and Upper East regions whilst the least number of jobs were created in the Western region.
Table 2.26: Capitation Grant Disbursement, 2018/2019 Academic Year (
Regions Number of Beneficiaries Amount Males Females Total GHc
Ashanti 510,205 497,823 1,008,028 10,080,280Brong Ahafo 321,781 318,068 639,849 6,398,490Central 278,512 271,450 549,962 5,499,620Eastern 288,391 279,815 568,206 5,682,060Greater Accra 244,365 241,945 486,310 4,863,100Northern 411,079 397,293 808,372 8,083,720Upper East 177,896 172,213 350,109 3,501,090Upper West 128,976 130,213 259,189 2,591,890Volta/ Oti 269,455 263,404 532,859 5,328,590Western 305,293 298,839 604,132 6,041,320Grand Total 2,935,953 2,871,063 5,807,016 58,070,160NOTE: The disbursement amount per student=GHC 10.00
Disbursement ranges from KG to JHS 3
Sources: MOE, 2020
Table 2.27: Pupils benefiting from GSFP; 2017/2018 and 2018/2019 academic yearRegion 2017/18 Share (%) 2018/19 Share (%)
Ashanti 517,138 20.15 548,463 18.66Brong-Ahafo 272,627 10.62 292,792 9.96Central 214,520 8.36 300,113 10.21Eastern 207,897 8.10 281,011 9.56Greater Accra 268,249 10.45 287,803 9.80Northern 317,661 12.38 339,593 11.55Upper West 179,930 7.01 257,059 8.74Upper East 211,637 8.25 208,942 7.11Volta 161,137 6.28 199,759 6.79Western 215,215 8.39 224,020 7.62Total 2,566,011 100 2,939,555 100
Sources: MoGCSP, 2020
Table 2.28: Regional distribution of Jobs in 2019Region GSFP
Ashanti 1,723Ahafo
934Bono
Bono East
Central 960Eastern 1,151Greater Accra 863Northern
992North EastSavannahUpper East 966Upper West 653Volta
681OtiWestern
638Western NorthTotal 9,561
Sources: MoE, 2020

43
Free Senior High School Programme
A total amount of GH¢1.1 billion was spent on the programme within the 2018/2019 academic year, benefitting 406,950 students (See Table 2.29). This however fell short of the target of 472,730 students and represents a decrease of 5.96 percent over 2017/2018 academic year. Ashanti Region remained the highest with a share of 25.31 percent of new free SHS beneficiaries, while the Upper West recorded the lowest share of 2.63 percent.
Free Mass Transit for School Children The total number of free rides provided to school children by the Metro Mass Transit Limited (MMTL) increased from 1,554 in 2018 to 5,443 in 2019. This was due to improved recording of beneficiaries in Sunyani, Bolgatanga and Ho (See Table 2.30); and the acquisition of fifty (50) new buses to revamp the programme.
One – District-One –FactoryA total of 58 new factories were operationalised in 2019, creating 56,728 (13,177-direct jobs and 43,551-indirect jobs) 8 jobs across the country as shown in Table 2.31. Analysis of the regional distribution shows that the Greater Accra Region dominates with 22 industries followed by Ashanti and Eastern regions with 12 each. However, North East, Oti, Savannah, Bono East and Western North are yet to record a factory under the 1D1F initiative either because no business promoter has expressed interest in establishing any industry or the actors in the sector are yet to approve and roll out initiatives in the affected regions. (see Table 2.31).
Livelihood Empowerment Against Poverty
The bi-monthly subsistence grant of GH¢64.00, GH¢76.00, GH¢88.00, and GH¢106 for 1, 2, 3 and more than three-member household respectively remained unchanged in 2019. The payments to beneficiaries were done in five tranches during the year, with the three regions of the north and the Volta Region (63.1%) having a greater proportion of beneficiary households in 2019. Greater Accra (3.3%) had the least beneficiary households (See figure 2.17).
8 Ministry of Trade and Industry Annual Report, 2019
Table 2.29: Free SHS Beneficiaries in 2018/2019 academic year
Region2018 2019
No. of Benefi-ciaries Share (%) No. of Benefi-
ciaries Share (%)
Ashanti 105,327 24.3 103,002 25.0%Brong Ahafo 36,427 8.4 34,516 8.48%
Central 46,772 10.8 43,446 10.68%
Eastern 66,861 15.5 63,949 15.71%
Greater Accra 39,575 9.2 35,436 8.71%
Northern 36,396 8.4 34,170 8.40%
Upper East 19,681 4.6 17,966 4.41%
Upper West 12,225 2.8 10,707 2.63%
Volta 37,774 8.7 34,278 8.42%Western 31,709 7.3 29,480 7.24%Total 432,747 100 406,950 100%
Sources: MOE, 2020
43
Table 2.29: Free SHS Benefic iaries in 2018/2019 academic year
Region 2018 2019
No. of Benefic iar ies Share (%) No. of
Benefic iar ies Share (%)
Ashanti 105,327 24.3 103,002 25.0% Brong Ahafo 36,427 8.4 34,516 8.48% Central 46,772 10.8 43,446 10.68% Eastern 66,861 15.5 63,949 15.71% Greater Accra 39,575 9.2 35,436 8.71% Northern 36,396 8.4 34,170 8.40% Upper East 19,681 4.6 17,966 4.41% Upper West 12,225 2.8 10,707 2.63% Volta 37,774 8.7 34,278 8.42% Western 31,709 7.3 29,480 7.24% Total 432,747 100 406,950 100% Sources: MOE, 2020 Table 2.30: Free Mass Trans it for School Children in some Major
Towns, 2017-‐2019 Major Towns and Cit ies
Performance 2017 2018 2019
Kumasi 0 0 0 Takoradi 0 0 0 Sunyani 1,321 332 1563 Kaneshie 0 0 0 Tamale 0 384 632 Bolgatanga 329 500 1254 Swedru 0 0 0 Laterbiokorshie 0 0 566 Tema 0 0 0 Wa 0 0 0 Koforidua 0 0 0 Ho 625 37 1009 Adenta 55 0 0 Cape Coast 0 0 0 Akim Oda 97 0 0 Project 200 (Accra) 0 301 419 Total 2,427 1,554 5,443 Source: Ministry of Transport, 2020
Table 2.28: Regional distr ibution of Jobs in 2019 Region GSFP
Ashanti 1,723 Ahafo
934 Bono
Bono East Central 960 Eastern 1,151 Greater Accra 863 Northern
992 North East Savannah Upper East 966 Upper West 653 Volta
681 Oti Western
638 Western North Total 9,561
Sources: MoE, 2020
Nationally, the programme covered about 2.9 million kindergarten and primary pupils in 2018/19 academic year, representing an annual increase of 14.5 percent. The increase was due to expansion in coverage of the programme and increase in enrolment. An amount of GH¢500 million was released to support implementation of the programme and this represents an increase of 29.8 percent over 2017/2018 academic year. The GSFP initiative created nine thousand, five hundred and sixty-‐one (9,561) jobs in 2019 (See Table 2.28). The largest number of jobs were created in the Ashanti, Eastern, Northern and Upper East regions whilst the least number of jobs were created in the Western region.
Free Senior High School Programme A total amount of GH¢1.1 billion was spent on the programme within the 2018/2019 academic year, benefitting 406,950 students (See Table 2.29). This however fell short of the target of 472,730 students and represents a decrease of 5.96 percent over 2017/2018 academic year. Ashanti Region remained the highest with a share of 25.31 percent of new free SHS beneficiaries, while the Upper West recorded the lowest share of 2.63 percent. Free Mass Transit for School Children The total number of free rides provided to school children by the Metro Mass Transit Limited (MMTL) increased from 1,554 in 2018 to 5,443 in 2019. This was due to improved recording of beneficiaries in Sunyani, Bolgatanga and Ho (See Table 2.30); and the acquisition of fifty (50) new buses to revamp the programme.
45
Table 2.31: Regional Distr ibution of 1D1F Interventions and number of jobs created in 2019
Region No. of newly created 1D1F initiatives
Number of jobs created under 1D1F
Total Direct Indirect Upper West 2 1,450 250 1,200
Upper East 0 0 0 0 Northern 2 5,790 443 5,347 North East 0 0 0 0 Savannah 0 0 0 0 Bono 3 5,634 184 5,450 Bono East 0 0 0 0 Ahafo 0 0 0 0 Ashanti 12 6,787 2,707 4,280 Eastern 12 3,366 1,885 1,481 Western 2 4,452 760 3,692 Western North 0 0 0 0 Volta 2 5,200 285 4,915 Oti 0 0 0 0 Central 2 1,404 204 1,200 Greater Accra 22 22,445 6,459 15,986 National 58 56,728 13,177 43,551 Source: Ministry of Trade and Industry, 2020
One – District-‐One –Factory A total of 58 new factories were operationalised in 2019, creating 56,728 (13,177-‐direct jobs and 43,551-‐indirect jobs) 26 jobs across the country as shown in Table 2.31. Analysis of the regional distribution shows that the Greater Accra Region dominates with 22 industries followed by Ashanti and Eastern regions with 12 each. However, North East, Oti, Savannah, Bono East and Western North are yet to record a factory under the 1D1F initiative either because no business promoter has expressed interest in establishing any industry or the actors in the sector are yet to approve and roll out initiatives in the affected regions. (see Table 2.31). Livelihood Empowerment Against Poverty The bi-‐monthly subsistence grant of GH¢64.00, GH¢76.00, GH¢88.00, and GH¢106 for 1, 2, 3 and more than three-‐member household respectively remained unchanged in 2019. The payments to beneficiaries were done in five tranches during the year, with the three regions of the north and the Volta Region (63.1%) having a greater proportion of beneficiary households in 2019. Greater Accra (3.3%) had the least beneficiary households (See figure 2.17).
Figure 2.17: Number of LEAP benefic iaries per regional, 2019
Source: MoGCSP, 2020
Planting for Food and Jobs The implementation of the Planting for Food and Jobs Initiative also continued in 2019. Beneficiary farmers were provided with inputs (planting materials in the form of seeds and fertilisers) for production. The programme in 2019 provided 746,948 people with direct and indirect jobs, with 70.5 percent being women (see Figure 2.18).
26 Ministry of Trade and Industry Annual Report, 2019
0 10,000 20,000 30,000 40,000 50,000 60,000 70,000 80,000 90,000
AshanU Brong Ahafo Central Eastern Greater Accra Northern Upper West Upper East Volta Western
Num
ber o
f hou
seho
lds
Regions

44
Figure 2.17: Number of LEAP beneficiaries per regional, 2019
Source: MoGCSP, 2020
Planting for Food and Jobs
The implementation of the Planting for Food and Jobs Initiative also continued in 2019. Beneficiary farmers were provided with inputs (planting materials in the form of seeds and fertilisers) for production. The programme in 2019 provided 746,948 people with direct and indirect jobs, with 70.5 percent being women (see Figure 2.18).
Figure 2.18: Gender distribution of Job creation by Planting for Food and Jobs Initiative
Sources: MoFA, 2020
2.7.2.6 Assessment of District Outcomes
Crime casesA total of 224,221 crime cases – murder, defilement, robbery, and rape – were reported in 2019, representing 5.1 percent increase over the 2018 cases. Greater Accra region (106,427) recorded the highest number of cases while Upper West region (2,755) recorded the least (see Table 2.32)
Communities and people affected by disaster
A total of 2,643 communities throughout the country were affected by disasters including wind or rainstorm, flood, domestic fires, bush fires, commercial fires, collapsed buildings, boat accident, and earth tremor. This represents a 21.92 percent reduction over the 2018 incidence. The Ashanti Region recorded the highest

45
incidence with 603 communities whilst Central Region was the least affected region in 2019. Table 2.32 shows the regional distribution of disaster occurrence from 2017 to 2019.
Communities with access to electricity
Efforts were made by MMDAs through the Ministry of Energy to extend electricity to several communities in 2019. A total of 445 communities were connected to the national grid under the Rural Electrification Project (REP) in 2019. The highest number of communities added to the national grid in 2019 was in the Eastern
region while no additions were made in Oti, Western North, and North East regions (See Table 2.32).
Table 2.32: Crime rate, disaster occurrence, road network and electricity coverage
Region
Number of communities affected by disaster
Reported cases of crime Recorded cases
of child trafficking1
Percentage of road
network in good
condition
Number of communities added to the national grid
2017 2018 2019 2017 2018 2019 2019 2019 2019
Western240 446 335 11,966 9,939 11,325
0 44 5Western North 0Volta 188 222 302 13,192 12,396 14,339
16 44 79Oti 0Central 203 270 167 17,057 17,493 17,370 4 46 9
Upper East 35 174 177 2,965 4,314 5,406 0 26 11
Upper West 128 363 244 2,514 2,451 2,755 4 54 19Northern
297 570 170 3,565 3,439 3,0979 55 107
North East 0Savannah 1Bono
237 262 217 10,129 11,242 10,4287 41 4
Ahafo 38Bono East 19
Ashanti 500 489 603 33,207 35,142 35,428 4 32 33
Greater Accra 37 240 202 91,527 100,941 106,427 34 36 2
Eastern 106 349 226 15,814 16,079 17,646 4 52 118
National 1,971 3,385 2,643 201,936 213,436 224,221 82 45 445
Sources: Ministry of Interior, Ministry of Gender, Children and Social Protection, Ministry of Energy, Ministry of Roads and Highways, 2020
Proportion of roads in good condition
The length of trunk road in good condition declined from 505km in 2017 to 426 in 2018, and remained the same in 2019. This was due to low funding for road maintenance activities from the Ghana Road Fund. Northern and Eastern regions have the highest proportion of trunk road network in good condition whilst the Upper West has the lowest proportion (See Table 2.32).
This excludes child abuse cases which data is not available
Recorded cases of child trafficking
Greater Accra region recorded the highest number of cases (34), representing 41.5 percent of the total child trafficking cases recorded by the Ghana Police Service in 2019. Western and Upper East regions recorded no cases of child trafficking in the same year (see Table 2.32).
Net Enrolment Rate, Gender Parity and Completion Rate
A net enrolment ratio of more than 70 percent was achieved in each region at the primary level in 2018/2019 academic year. Central region recorded the highest net enrolment ratio of 98.9 percent while the Eastern region attained the least performance of 74.5 percent. However, at the JHS level net enrolment levels were

46
below 70 percent. The highest was in Greater Accra (62.4%) while the lowest was in the Eastern region (39.1%) at the JHS level.
In terms of gender parity, all the regions achieved parity in 2019 at the primary level except for the Western and Northern regions which recorded 0.95 each. Similar achievements were observed at the JHS level. On the other hand, assessment of completion rate at both primary and JHS levels reveals that all the regions achieved completion rate of more than 65 percent in both 2017/18 and 2018/19 academic years (see Table 2.33).
Table 2.33: Net Enrolment ratio, Gender Parity Index and Completion Rate-2017-2019
Region Net Enrolment Ratio Gender Parity Index Completion Rate*
Primary JHS Primary JHS Primary JHS2018 2019 2018 2019 2018 2019 2018 2019 2018 2019 2018 2019
Western 89.3 88.6 49.2 49.2 0.95 0.95 0.93 0.95 99.6 101.5 80.1 78.1Central 100.7 98.9 57.1 57.5 1.03 1.03 1.04 1.06 118.2 121.9 93.8 94.3G r e a t e r Accra
86.3 91.2 57.8 62.4 1.01 1.00 0.99 1.00 105.7 114.2 90.4 94.4
Volta 87.8 82.6 43.1 43.1 1.04 1.02 1.0 1.03 92.4 94.5 68.1 69.2Eastern 77.5 74.5 39.4 39.1 1.00 1.00 1.01 1.03 84.8 86.9 66.9 67.4Ashanti 84.2 84.4 50.4 49.7 1.01 1.01 0.99 1.01 93.7 95.8 84.4 83.6Brong-Ahafo 91.2 85.6 44.4 43.1 1.01 0.99 0.95 0.97 96.3 98.0 75.9 75.9Northern 92.7 89.4 45.5 43.3 0.95 0.95 0.93 0.95 103.5 104.7 68.5 68.4Upper East 98.0 92.6 44.0 42.1 1.05 1.05 1.16 1.19 115.9 116.0 75.6 74.6Upper West 103.8 95.9 45.3 45.1 1.09 1.10 1.14 1.14 105.6 106.2 64.4 66.8
Source: MoE, 2020 * Completion rate Ratio of the total number of pupils/students enrolled in the last grade of a given level of education (Primary 6, JHS 3, SHS 3), regardless of age, expressed as a percentage of the total population of the theoretical entrance age to the last grade of that level of education
Proportion of the population with valid NHIS Card
Less than half of the population in each region has been enrolled onto the NHIS as of 2019, except for Bono (62%), Bono East (52%), Upper East (57%) and Upper West (57%) regions. Western North and Northern regions enrolled just 33 percent each of their total population onto the programme (see Table
2.34).
Table 2.34: Health, Water and Sanitation
Region Proportion of the population with valid NHIS Card (%)
I n s t i t u t i o n a l Maternal mortality ratio
(per 100,000 live births)
Institutional under five Malaria Case Fatality Rate
population with access to basic drinking water sources (%)
Proportion of the population with access to improved sanitation (%)
Rural Urban
Western 38 106.1 0.09 59.54 76.25 20.0Western North 33 34.9 0.07
Central 34 105.2 0.07 64.2 59.04 19.0Greater Accra 34 139.7 0.19 64.2 59.04 25.0
Volta 36 131.6 0.19 64.4 31.15 14.0Oti 36 54.9 0.11Eastern 41 139.1 0.11 56.45 30.74 30.0Ashanti 38 155.8 0.05 58.25 64.28 23.0
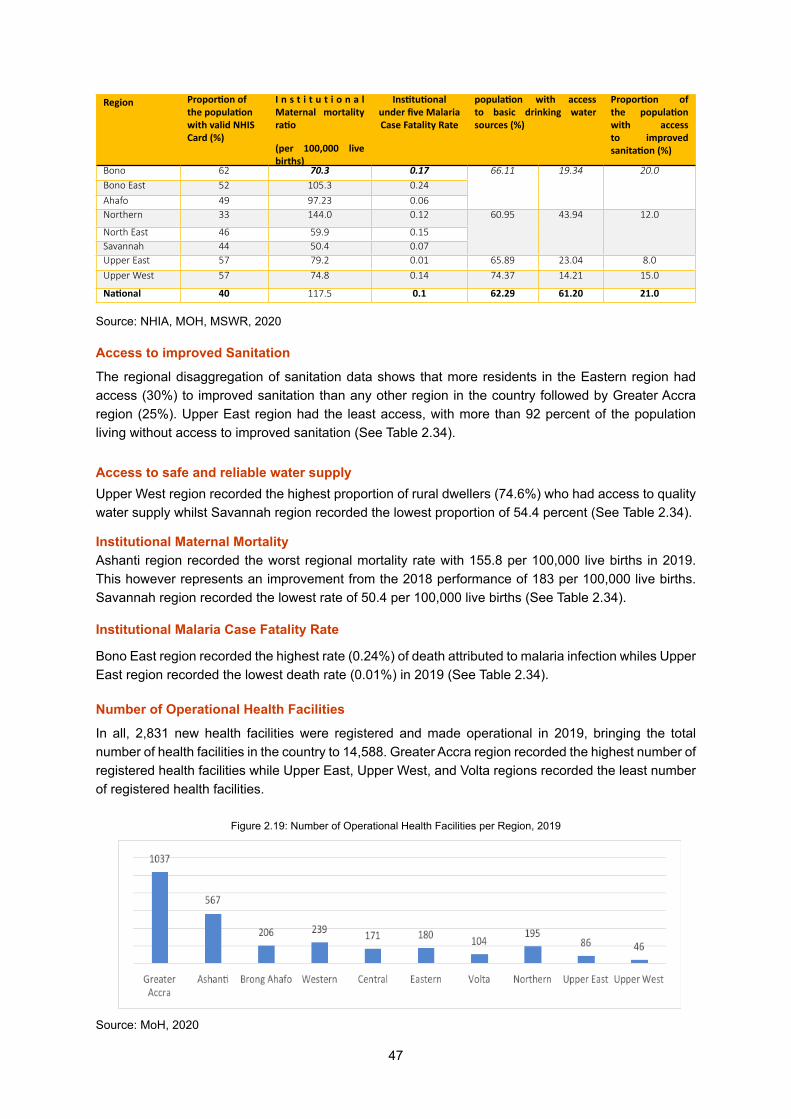
47
Region Proportion of the population with valid NHIS Card (%)
I n s t i t u t i o n a l Maternal mortality ratio
(per 100,000 live births)
Institutional under five Malaria Case Fatality Rate
population with access to basic drinking water sources (%)
Proportion of the population with access to improved sanitation (%)
Bono 62 70.3 0.17 66.11 19.34 20.0Bono East 52 105.3 0.24Ahafo 49 97.23 0.06Northern 33 144.0 0.12 60.95 43.94 12.0
North East 46 59.9 0.15Savannah 44 50.4 0.07Upper East 57 79.2 0.01 65.89 23.04 8.0Upper West 57 74.8 0.14 74.37 14.21 15.0
National 40 117.5 0.1 62.29 61.20 21.0
Source: NHIA, MOH, MSWR, 2020
Access to improved Sanitation
The regional disaggregation of sanitation data shows that more residents in the Eastern region had access (30%) to improved sanitation than any other region in the country followed by Greater Accra region (25%). Upper East region had the least access, with more than 92 percent of the population living without access to improved sanitation (See Table 2.34).
Access to safe and reliable water supplyUpper West region recorded the highest proportion of rural dwellers (74.6%) who had access to quality water supply whilst Savannah region recorded the lowest proportion of 54.4 percent (See Table 2.34).
Institutional Maternal MortalityAshanti region recorded the worst regional mortality rate with 155.8 per 100,000 live births in 2019. This however represents an improvement from the 2018 performance of 183 per 100,000 live births. Savannah region recorded the lowest rate of 50.4 per 100,000 live births (See Table 2.34).
Institutional Malaria Case Fatality Rate
Bono East region recorded the highest rate (0.24%) of death attributed to malaria infection whiles Upper East region recorded the lowest death rate (0.01%) in 2019 (See Table 2.34).
Number of Operational Health Facilities
In all, 2,831 new health facilities were registered and made operational in 2019, bringing the total number of health facilities in the country to 14,588. Greater Accra region recorded the highest number of registered health facilities while Upper East, Upper West, and Volta regions recorded the least number of registered health facilities.
Figure 2.19: Number of Operational Health Facilities per Region, 2019
Source: MoH, 2020

48
Number of births and deaths registered
Greater Accra region registered the highest births and deaths in 2019. Upper West and Upper East recorded
the least births and deaths (See Table 2.35).
Table 2.35: Birth and Death Registration, 2017-2019
Region
Birth Registered Death Registered
2017 2018 2019
Percentage + -
(2018 and 2019)
2017 2018 2019
Percentage + -
(2018 and 2019
Western 54,860 66,686 60,249 -9.7% 1,747 1,824 2,415 32.4%
Central 53,821 62,548 75,375 20.5% 3,780 4,546 4,733 4.1%
Gt Accra 90,314 86,725 123,860 42.8% 15,798 15,567 16,446 5.6%
Eastern 48,493 47,164 54,188 14.9% 6,922 7,234 7,381 2.0%
Volta 39,666 47,797 47,653 -0.3% 4,251 3,936 4,117 4.6%
Ashanti 92,392 89,354 113,014 26.5% 10,493 10,904 10,626 -2.5%Brong -Ahafo 49,484 55,280 72,282 30.8% 3,756 3,340 3,138 -6.0%
Northern 78,592 104,040 106,032 1.9% 1,305 1,421 1,382 -2.7%
Upper East 25,757 29,647 31,626 6.7% 247 374 374 0.0%
Upper West 18,554 21,416 22,785 6.4% 349 483 547 13.3%
National 551,933 610,657 707,064 15.8% 48,648 49,629 51,159 3.1%
Source: Birth and Death Registry, 2020
Total Agricultural Outputs
Production of major staple crops in 2019 increased over the 2018 performance. Maize recorded the largest annual increase of 52 percent to approximately 3.1 million Mt. This was followed by rice (33%), Cassava (30%) and Plantain (27%). Soya bean (7%) recorded the least annual increase (See Table 2.36).
Table 2.36: Production trend of major staple crops (‘000 Mt)
Crop 2016 2017 2018 2019Percentage + -
(2018 and 2019)Maize 1,691.6 1,721.9 2,011.2 3,059.1 52%Rice (Paddy) 641.5 687.7 722.1 963.3 33%Millet 157.4 159.0 163.5 189.7 16%Sorghum 228.4 229.6 277.5 342.9 24%Cassava 17,212.8 17,798.2 19,008.7 24,738.5 30%Yam 7,296.1 7,440.4 7,856.9
8,630.8 10%Cocoyam 1,301.2 1,343.7 1,387.3 1,652.7 19%Plantain 3952.4 4,000.4 4,278.8 5,440.2 27%Groundnuts 417.2 425.8 433.9 539.0 24%Cowpea 203.3 206.4 211.5 237.9 13%Soya bean 142.4 143.2 170.5
181.8 7%
Source: MoFA, 2020

49
2.7.3 KEY CHALLENGES AND POLICY RECOMMENDATIONS
The section outlines key challenges and proffers recommendations.
Table 2.27: Key challenges and recommendations for Implementing the MTNDPF at the District Level
No Challenges RecommendationsLow internally generated funds collection by MMDAs
• MMDAs must revalue all taxable properties and fully implement the street naming and property addressing system to enhance collection
• Pass the Local Government and Municipal Finances Bill to enable MMDAs diversify their sources of funding
• Strengthen and operationalize urban, zonal, town, and area councils, and unit committees to improve IGF col-lection
Inadequate staff at the regional and district level
Enhance the human resource capacity at the regional and district levels
Limited regional coverage of operational 1D1F initiatives
Facilitate the expansion and completion of 1D1F initiatives to provide employment opportunities at the districts level
Inability of MMDAs to complete the implementation of their annual action plans
Strengthen inter-sectorial collaboration among Ministry of Local Government and Rural Development, Office of the Head of Local Government Service, Ministry of Finance and NDPC to address administrative and operational challenges of DPCU and RPCUs

50
Chapter 3Conclusions The 2019 Annual Progress Report, assessed the implementation of the current the Medium-Term National Development National Policy Framework – An Agenda for Jobs: Creation Prosperity and Equal opportunity for all (2018-2014). It was based on data on selected indicators collected from MMDAs and gives an indication of the level of progress mid-way through the implementation of the framework. While the assessment focused on performance in 2019, it also highlighted the potential impact of the COVID-19 pandemic on reaching the medium-term goals of government.
The economy remains robust, but the COVID-19 jeopardises the achievement of the medium-term targets.
The report indicates that significant progress has been in most of the focus areas although many targets were not achieved. The economy, however remains robust largely due to the impressive average real GDP growth averaged of 7.0 percent chalked between 2017 and 2019. The Services sector experienced the highest growth rate of 7.6 percent, exceeding the end of year target of 5.4 percent, and contributed fifty nearly half of GDP. The information and Communication and Real Estate subsectors performed strongest with growth rates of 46.5 and 19.9 percent respectively. While the growth rates for Industry and Agriculture sectors fell short of the projected targets for 2019, both sectors are deemed to be robust given the good performance in the previous two years. The performance of the Industry sector was hampered by the contraction in the Water and Sewerage, and Construction subsectors which contracted by 4.4 percent each. Similarly, the contraction of the Forestry and Logging subsectors could be the reason for the marginal slowdown in the Agriculture sector.
Given the uncertainties around the COVID-19 pandemic, restrictions on cross-border trade and some economic activities, the economic performance is expected to decline in 2020. The various relief packages put in place to ameliorate the COVID-19 induced hardships on households and businesses, as well as stimulate the economy are steps in the right directions. The roll out of these packages should, as much as possible, be anchored at the local authority level to ensure that they are responsive to local needs and capabilities. In addition, the recovery process should include measures to ensure that local economies become more resilient and better to withstand future social and economic shocks.
Access to education and healthcare has improved, but quality of service and outcomes are major concerns.Gross enrolment has improved at all levels, particularly at SHS level (public, private and GES TVET) largely as a result of the Free SHS policy. Transition rate from JHS to SHS increased has improved to 91.6 percent, however completion rate remains low, at 55.9 percent with the drop-out rate higher among girls. Proficiency in literacy and numeracy among primary school pupils remains very low. About 6 out of 10 primary 4 pupils lack the minimum aptitude in literacy, while nearly 8 out of 10 lack minimum proficiency in numeracy.
The population enrolled on the National Health Insurance Scheme (NHIS) has increased to 40 percent, with those in the exempt category constituting 61.0 percent. Availability of health personnel has improved with the doctor-to-population ratio standing at 1:6,897, missing the sector target of 1:6,800. Nurse-to-population ratio is 1:539, exceeding the sector target of 1:700. Access to healthcare services improved with an increase in the number of functional Community-based Health Planning and Services (CHPS) zones to 78.5 percent. Every district now has at least one modern, a well-equipped ambulance and Emergency Medical Technicians.

51
Nearly half of the population suffer from multiple deprivations, with children and rural folks worse affected
The incidence of multidimensional poverty (45.6%) is nearly twice that of monetary poverty (24.2%), with the both phenomena being more prevalent in rural areas and in the northern parts of the country. About 19.3 percent of the population are both monetary and multidimensionally poor. Children are generally worse off than adults, with almost a third of children living in monetary poverty and nearly 7 out of ten, classified as being multidimensionally poor. Among both adults and children, the predominant driver of multidimensional poverty is access to basic sanitation services.
Poor water and air quality are concerns, and disasters are on a rise
The Operation Vanguard taskforce has succeeded in reducing the menace of illegal small mining activities which has resulted in an improvement in the ambient water quality of major river bodies, albeit not pristine. Ambient air quality along major road corridors in urban areas is poor and poses a major health hazard to those who live and/or work in such areas. The occurrence of disasters across the country increased by 10.5 percent, underscoring the country’s susceptibility to disasters, especially the climate-induced ones.
The transportation sector recorded a good performance in 2019 largely due to strategic improvements in infrastructure. Domestic air and rail passenger traffic volumes increased by nearly 65 percent 207.9 percent respectively. Also, freight and passenger traffic on the Volta lake increased by 11.9 percent and 4.9 percent respectively.
MMDAs have low staffing levels and heavily dependent on central government for revenues
Total revenue for MMDAS saw an annual increase of 13 percent, with largest sources being grants from central government and DACF. MMDAS improved on their resource mobilisation which resulted in 13 percent increase in IGF. In 2019, IGF constituted 23.4 percent of revenue which is relatively low and compelling MMDAs to be heavily dependent on transfers from central government. Staffing levels at local authorities are generally below the minimum number required to discharge their mandate. All but two out of the 260 MMDAs have the complement of their minimum staffing levels required. Most MMDAs (89.6%) are deemed to be severely understaffed with staff strength being less than 50 percent of the required minimum. It is important, that MMDAs are supported to with the necessary logistics, human, and financial resources to drive an inclusive and sustainable socio-economic growth.

52
APPENDICES
Appendix I: Economic Development
Table A2.2: Summary of Central Government Revenues and Grants for 2019
Indicators (GH₵ billion)
2018 2019
Prov. Out-turn Budget Revised
BudgetProj.
OutlookProv. Out-
turn Dev
(GH₵) Dev (%) y/y (%) Exec Rate (%)
Total Revenue & Grants 47.6 58.9 58.9 54.6 53.0 -5.9 -10.1 11.2 89.9
% of GDP 15.8 17.0 17.0 15.8 15.3
Non-oil Tax Revenue 35.8 42.9 45.1 42.4 42.6 -2.5 -5.5 19.0 94.5
% of GDP 11.9 12.4 13.0 12.2 12.3
Non-Oil Non-Tax Rev-enue 4.0 6.5 5.9 5.7 4.9 -1.0 -17.5 22.0 82.5
% of GDP 1.3 1.9 1.7 1.7 1.4
Oil and Gas Receipt 4.5 5.4 5.7 5.7 4.9 -0.8 -13.9 8.8 86.1
% of GDP 1.5 1.6 1.6 1.6 1.4
ESLA Receipt 1.8 2.5 2.6 2.0 1.9 -0.7 -27.4 5.2 72.6
% of GDP 0.6 0.7 0.8 0.6 0.6
SSNIT Contribution 0.4 0.5 0.5 0.5 0.2 -0.3 -69.0 -59.4 31.0
% of GDP 0.1 0.1 0.1 0.1 0.0
Grants 1.1 1.1 1.1 0.8 1.0 -0.1 -11.1 -13.1 88.9
% of GDP 0.4 0.3 0.3 0.2 0.3
Source: MoF, 2020
Table A2.3: Summary of Central Government Expenditures for 2019
Indicators (GH₵ billion) 2018 2019
Prov. Outturn Budget
Re-vised
Budget
Proj. Outlook
Prov. Outturn
Dev (GH₵) Dev (%) y/y (%) Exec Rate
(%)
Total Exp. (incl. Arrears clearance) 59.3 73.4 74.6 70.9 69.7 -4.9 -6.6 17.5 93.4
% of GDP 19.7 21.2 21.6 20.5 20.1
Compensation of Employees 19.6 22.8 22.8 22.5 22.0 -0.8 -3.5 12.3 96.5
% of GDP 6.5 6.6 6.6 6.5 6.4
o/w Wages & Salaries 17.2 19.4 19.8 19.8 19.5 -0.2 -1.2 13.4 98.8
% of GDP 5.7 5.6 5.7 5.7 5.6
Use of Goods and Services 5.1 6.3 6.9 6.9 6.2 -0.8 -11.1 20.3 88.9
% of GDP 1.7 1.8 2.0 2.0 1.8

53
Indicators (GH₵ billion) 2018 2019
Prov. Outturn Budget
Re-vised
Budget
Proj. Outlook
Prov. Outturn
Dev (GH₵) Dev (%) y/y (%) Exec Rate
(%)
Interest Payment 15.8 18.6 19.6 19.6 19.8 0.2 0.8 24.9 100.8
% of GDP 5.3 5.4 5.7 5.7 5.7
Grants to Other Gov’t Units 10.8 13.8 14.0 13.1 11.4 -2.6 -18.6 5.9 81.4
% of GDP 3.6 4.0 4.1 3.8 3.3
Capital Expenditure 4.7 8.5 7.7 6.0 6.2 -1.6 -20.2 29.8 79.8
% of GDP 1.6 2.5 2.2 1.7 1.8
Other Expenditure 2.1 2.6 2.8 2.1 2.1 -0.6 -22.6 1.4 77.4
% of GDP 0.7 0.7 0.8 0.6 0.6
Arrears 0.9 -0.7 -0.7 -0.7 -0.7 0.0 0.0 -185.0 100.0
% of GDP 0.3 -0.2 -0.2 -0.2 -0.2
Source: MoF, 2020
Table A2.4: Average Productivity of selected Major Staple Crops (Mt/Ha)
Indicators 2017 Baseline 2018 Outturn 2019 Targets 2019 Actual % change (2018/2019)
- Maize 2.04 2.26 - 2.52 11.50
- Rice (milled) 3.00 2.96 - 3.57 20.61
- Millet 1.05 1.28 - 1.33 3.91
- Sorghum 1.24 1.39 - 1.57 12.95
- Cassava 20.73 21.33 - 22.36 4.83
- Yam 16.71 16.58 - 17.38 4.83
- Cocoyam 6.79 7.19 - 7.75 7.79
- Plantain 11.77 12.11 - 12.99 7.27
- Groundnut 1.37 1.63 - 1.65 1.23
- Cowpea 1.37 1.51 - 1.52 0.66
- Soybean 1.66 1.72 - 1.77 2.91
Source: MoFA, 2020
Table A2.5: Status of Agriculture indicators, 2018 and 2019 Compared
Indicators 2018 Actual 2019 Actual
1. Total volume and value of agricultural commodi-ties exported 000 Kg (US$, 000):
WEIGHT: KGS (US$000): WEIGHT: KGS (US$000): *
-Cashew 259,432,105 378,209,971 237,889169
-Coffee 105 82 89,125
-Shea Nut 27,966,661 14,103,332 27,189,551
-Maize 192,249 204,168 3,626
-Yam products 17,278,744 8,620,574 11,883,095

54
Indicators 2018 Actual 2019 Actual
-Exotic vegetables 404,835 291,237 973,217
-Pineapple 17,506,891 9,254,194 9,228,405
-Mango 2,817,104 12,946,162 12,527,478
-Pawpaw 1,240,006 906,133 961,842
-Banana 178,902,808 85,543,506 63,827,556
-Fish and sea food 41,262,580 56,151,166 44,944,949
Source: MoFA/1D1F Secretariat, 2020
55
APPENDIX A2.6: SUMMARY OF PERFORMANCE OF KEY ECONOMIC DEVELOPMENT INDICATORS

56
55"
"
APP
ENDIX(A2.6:(SUMMARY(OF(PE
RFO
RMANCE(OF(KE
Y(EC
ONOMIC(D
EVEL
OPM
ENT(IN
DICATO
RS((
Focu
s(Are
a(Indica
tor(
Bas
eline((201
7)(
Actua
l(20
18(
Targ
et(
2019
(Actua
l(20
19(
1.
Strong
(and
(Resilien
t(Econ
omy (
1. Re
al(growth(in(Gross(Dom
estic(Produ
ct((G
DP)((%
):((
((
((!"Agriculture"(
6.1(
4.8(
6.4(
4.6(
"!"Industry"""(
15.7(
10.6(
8.8(
6.4(
Manufacturing""
9.5(
4.1(
6.7(
6.3(
Electricity"
19.4(
5.5(
7.1(
6.0(
!"Services"""
3.3(
2.7(
5.4(
7.6(
!"Oil"Inclusive"GDP""
8.1(
6.3(
7(6.5(
!"Non!oil"GDP"
4.6(
6.5(
5.9(
5.8(
2. Se
ctoral(sha
re(of(G
DP((%
)(((
((
(
X(Agriculture(
21.2(
19.7(
18.4(
18.5(
"!"Industry"(
32.7(
34.0(
31.5(
34.2(
!Manufacturing"
11.3(
X(10
.3(
X(!"Services((((
46.0(
46.3(
42.7(
47.2(
3. To
tal(num
ber(o
f(new
(jobs(created
6 (20
7,49
2(X(
X(X(
4. Se
ctoral(Sha
re(of(E
mploymen
t((%)(
((
((
(X(Agriculture"(
44.7(
X(X(
X("!"Industry""(
14.4(
X(X(
X(!Manufacturing"
X(X(
X(X(
"!"Services"
X(X(
X(X(
5. Gross(Dom
estic(Produ
ct((G
DP):(
((
((
(X(Nominal"(GH¢"Billions)"(
167.32
(30
0.5(
345.9(
349.4(
!"Nominal"(US$,"Billions)"
42.9(
65.5(
62.5(
66.9(
!"Population"(Million)"
28.3((2
016)(
30.28(
30.28(
30.28(
!"Per"Capita"(GHc)""
8,86
3.00
(X(
11,424
.90(
8,38
2.00
(!"Per"Capita"(US$)"
(X(
((
6. Infla
tion((%
(cha
nge(in(CPI,(ann
ual)(
11.80%
(9.40
%(
8(7.9(
7. Exchan
ge(Rate((%
(cha
nge,(ann
ual)((US$XCed
i)(4.88
%(
(Gh4
.36/$1
)(8.39
%(
X(12
.9(
8. Interest(ra
te((9
1Xda
y(TXBills)(
13.3%(
(Bud
get)(
14.56%
(X(
14.7(
9. Lend
ing(rate(
29.3%((B
OG)(
26.86%
(X(
23.6(
10.
Growth(in(Business(Cred
it((%
):((
((
((X(Nominal"(
17.51(
X(NA(
18.3(
"!"Real((
X0.17(
X(NA(
9.7(
11.
Non
XPerform
ing(Loan
s((NPLs)(Ratio(
21.60(%(
18.2%(
NA(
13.90%
(12
. Prop
ortio
n(of(Gha
naians(with
(access(to(fina
ncial(services(in(
the(trad
ition
al(ban
king
(sector(((
58%(
X((
(
13.
Prop
ortio
n(of(Gha
naians(with
(access(to(fina
ncial(services(in(
the(no
nXba
nking(sector(
58%(
X((
(
14.
Mob
ile(m
oney(pen
etratio
n(rate(
83.10%
(11
0.49
%(
((

57
56"
"
Focu
s(Are
a(Indica
tor(
Bas
eline((201
7)(
Actua
l(20
18(
Targ
et(
2019
(Actua
l(20
19(
15.
Budg
et(deficit(as(a(percentage(of(GDP(
4.5(
3.9(
X4.5(
X4.8(
16.
Governm
ent(R
even
ue((
((
((
!"Total"(Share"of"GDP)"(%)"(
15.5(
15.8(
17(
15.3(
!"Domestic"(Share"of"GDP)"(%)"
14.9(
15.5(
16.7(
15(
!"Nominal"(GH¢"Bil)"
39.7(
47.6(
57.8(
53(
17.
Governm
ent(E
xpen
diture((
((
((
Total((Share(of(GDP)((%
)((20
.2(
19.7(
21.6(
20.1(
!"Recurrent(
15(
15.7(
16.8(
16(
!"Capital((
3.8(
3.0(
3.6(
2.8(
18.
Statutory(fund
s((%
)(3.6(
28.6(
4.1(
3.3(
19.
Interest(Paymen
ts((%
)(5.3(
41.9(
5.7(
5.7(
20.
Wage(bill(as(a(percentage(of(ta
x(revenu
e((((
47.5(
45.6(
43.3(
46.1(
21.
Prim
ary(ba
lance(
0.5(
X1.4(
1.1(
0.8(
22.
Non
Xoil(prim
ary(ba
lance(as(percentage(of(GDP(
X0.4(
X0.1(
X0.5(
X0.6(
23.
Capital(expen
diture(as(a(pe
rcen
tage(of(total(expen
diture(
17.4(
15.4(
16.5(
14.3(
24.
Total(pub
lic(deb
t(as(%(of(G
DP(
55.6(
57.98(
60.0(
63.1(
25.
Deb
tXservice(ratio
((%)(
7.2(
45.4(
8.7(
9.0(
26.
Curren
t(Accou
nt(Balan
ce((%
(of(G
DP)(
X4.4(
X3.2(
X(X2.5(
27.
Trad
e(Ba
lance((US$(m
illion):(
((
((
(!"Merchandise"Exports""
13,835
.00(24
.2%)(
14,868
.1((7
.5%)(
15,372
(15
,634
(
!"Merchandise"Imports(
12,647
.40((2.1%)(
13,089
.3((3
.8%)(
X13,20
7(13
,335
("!"Trade"Deficit/Surplus(
1,18
7.70
((X16
6.7%
)(1,77
8.8((49.8%
)(2,16
5(2,29
8(28
. Official(internationa
l(reserves(
US$7.6(bill((w
orth(4.3(
mon
ths(of(im
port(cover)(
7,02
4.80
(X(
8,41
8(
2.
Indu
stria
l(Tran
sformation (
29.
Electricity
(con
sumption(pe
r(cap
ita((kWh(pe
r(cap
ita):((
(X(
((
X(Total(
348(
X(X(
11,052
.8(
!"Industry/Non!residential"users(
NA(
X(X(
4,24
2(30
. High(Techno
logy((H
iXtech)(export(sha
re(of(m
anufacturin
g((%
)(((
4.88
(X(
X(X(
31.
Man
ufactures(share(of(m
erchan
dise(exports((%
)(16
.8(
X(X(
X(3.
Private(Sector(
Develop
men
t (32
. Ease(of(d
oing
(business(rank(
120th(ou
t(of(
190(coun
tries(
114th
( out(of(
190(coun
tries(
X(11
8th( out(of(
190(coun
tries(
33.
Size(of(the
(inform
al(sector(
90.50%
(90
.50%
(X(
X(4.
Ag
riculture(and
(Rural(
Develop
men
t (34
. To
tal(volum
e(an
d(value(of(agricultural(com
mod
ities(
expo
rted
(Kg,((U
S$):((
515,74
0,53
4((440
,955
,283
)((
X(65
3,58
9,77
8((428
,108
756)(
!"Cashew(
262,94
5,11
2(37
8,20
9,97
1(X(
237,88
9,16
9(!"Coffee""
65,691
(82
(X(
89,125
(!"Shea"nut"
4,02
7,34
5(14
,103
,332
(X(
27,189
,551
(!"Maize"
28,929
(20
4,16
8(X(
3,62
6(!"Yam"products""
8,51
6,13
7(8,62
0,57
4(X(
11,883
,095
(!"Exotic"vegetables"
665,99
0(29
1,23
7(X(
973,21
7(

58
57"
"
Focu
s(Are
a(Indica
tor(
Bas
eline((201
7)(
Actua
l(20
18(
Targ
et(
2019
(Actua
l(20
19(
!"Pineapple""
18,055
,860
(9,25
4,19
4(X(
9,22
8,40
5(!"Mango""
10,852
,302
(12
,946
,162
(X(
12,527
,478
(!"Pawpaw""
1,15
9,29
2(90
6,13
3(X(
961,84
2(!"Banana""
38,797
,338
(85
,543
,506
(X(
63,827
,556
(!"Fish"and"sea"food
("72
,394
,003
(56
,151
,166
(X(
44,944
,949
(35
. Share(of(Agriculture(bud
get(in(Governm
ent(e
xpen
diture((%
)(<6
((
((
36.
Average(prod
uctiv
ity(of(selected(crop
((Mt/Ha):((
((
((
X(Maize"(
1.99
(2.26
(X(
2.52
(!"Rice"(paddy)(
2.92
(2.96
(X(
3.57
("""Millet""
1.16
(1.28
(X(
1.33
(!"Sorghum""
1.14
(1.39
(X(
1.57
(!"Cassava""
20.25(
21.33(
X(22
.36(
!"Yam""
17.42(
16.58(
X(17
.38(
!"Cocoyam""
6.53
(7.19
(X(
7.75
(!"Plantain""
11.17(
12.11(
X(12
.99(
!"Groundnut""
1.3(
1.63
(X(
1.65
(!"Cowpea""
1.41
(1.51
(X(
1.52
(!"Soybean""
1.65
(1.72
(X(
1.77
(!"Cocoa"
400(
X(X(
(37
. To
tal(V
olum
e(of(selected(cash(crops(produ
ced:((
((
((
X(Cocoa"(
969,50
0(90
4,74
0(X(
X(!"Shea"butter"(
NA(
X(X(
X(!"Oil"palm""
NA(
X(X(
X(!"Cashew"nut""
NA(
X(X(
X(!"Cotton"
NA(
X(X(
X(38
. Pe
rcen
tage(postXha
rvest(losses:((
((
((
!"Maize"(
15.85(
X(X(
X(!"Rice""
2.74
(X(
X(X(
!"Sorghum""
5.88
(X(
X(X(
!"Cassava""
22.26(
X(X(
X(!"Yam""
17.96(
X(X(
X(!"Fish"(Marine)""
10%(
X(5%
(13
%(
!"Fish"(Artisanal)"
29.5(
X(X(
X(39
. Co
ntrib
ution(of(livestock(to(GDP((%
)(1.2(
X(X(
5.7%
(5.
Fisheries(an
d(Aq
uacultu
re(
Develop
men
t (
40.
Total(Fish(Supp
ly((m
t):((
358,36
2.64
(33
3,61
1.72
(37
0,70
4.45
(33
9,99
7.53
(X(Marine"(
342,42
7.00
(30
2,43
1.50
(30
2,25
5.30
(33
2,14
6.00
(
!"Inland"Capture"fisheries"(
76,753
.66(
73,627
.80(
90,052
.46(
81,250
.00(
!"Aquaculture""
57,405
.31(
76,620
.00(
105,25
3.12
(52
,350
.02(
!"Total"domestic"production""
476,58
5.97
(45
2,67
9.30
(49
7,56
0.88
(46
5,70
0.08
(
!"Import"
197,06
3.45
(19
2,68
9.55
(17
9,95
7.44
(19
0,61
7.15
(!Export"
78,840
.122
(73
,621
.97(
53,101
.01(
64,914
.6(

59
58"
"
Focu
s(Are
a(Indica
tor(
Bas
eline((201
7)(
Actua
l(20
18(
Targ
et(
2019
(Actua
l(20
19(
6.
Tourism(and
(Creative(
Arts(Develop
men
t (41
. (Tou
rist(a
rrivals(
980,14
1(95
6,37
5(1,76
0,22
3.3(
1,13
0,30
7(42
. Ch
ange(in(to
urism(re
ceipts((U
S$(m
il)((
US$1,85
6.5(
US$2,58
9.85
(US$3,32
5.04
(3,31
2.93
(43
. Num
ber(o
f(job
s(in(th
e(Creativ
e(Arts(In
dustry(
1,14
8,07
2(1,20
4,56
0(1,38
9,16
7(1,35
8,15
2(
( ( ( ( ((

60
59"
"App
endix(II:(So
cial(D
evelop
men
t(FO
CUS(AREA
S(IN
DICATO
R(
BASE
LINE((201
7)(
2018
(TARGET
(20
18(ACTU
AL(
2019
(TARGET
(20
19(ACTU
AL(
Educ
ation(an
d(Tr
aining
(1.
Net(enrolmen
t(ratio:(
((
((
(X(((((((((((Kind
ergarten
(74
.60%
(80
%(
74.60%
(86
.00%
(73
.8%(
(X(((((((((((Prim
ary(
91.10%
(93
.50%
(89
.30%
(91
.60%
(87
.3%(
(X(((((((((((JHS(
49.70%
(54
.50%
(48
.50%
(52
.00%
(48
.4%(
X(((((((((((SH
S(26
.50%
(34
.50%
(29
.20%
((
33.7%(
2. JH
S3XSHS1(Transition
(Rate(
66.70%
(80
%(
78.2%(
75%(from
(EMIS(Data(
80%(
91.6%(
(3.
SHS(Re
tention(Ra
te(
92%(
96%(
N/A(
((
4. Com
pletion(rate:(
((
((
(X(((((((((((P6
(10
0.80
%(
122.40
%(
99.60%
((
(X(((((((((((JHS(
75.20%
(81
.10%
(78
.80%
((
79.1(
X(((((((((((SH
S(48
%(
50.30%
(52
.70%
((
(5.
Total(enrolmen
t(in:(
((
((
(X(((((((((((TV
ET(In
stitu
tions(
53,171
(NA(
74,934
((
76,770
(X(((((((((((Tertiary(
402,47
2(NA(
443,69
3((
479,83
4(X(((((((((((Special(schoo
ls(
6,87
4(NA(
7,10
2((
(6.
Enrolmen
t(ratio(of(the
(scien
ces(to(th
e(hu
man
ities(
in(te
rtiary(institu
tions:(
43:57:00
(45
:55:00
(45
:55:00
((
(
7. Gen
der(p
arity
(inde
x:(
((
((
(X(((((((((((Kind
ergarten
(1.01
(1.0(
1.0(
1.0(
(X(((((((((((Prim
ary(
1.01
(1.0(
1.0(
1.0(
1.0(
X(((((((((((JHS(
0.98
(0.99
(1.0(
0.99
(1.02
(in(fa
vour(of(g
irls(in(
2018
/201
9.(
X(((((((((((SH
S(0.98
(0.98
(0.92
((
0.95
(X(((((((((((Tertiary(
0.64
(0.7(
NA(
(0.73
(8.
Pup
ilsXtoXtraine
d(teache
r(ratio(in(basic(Schoo
ls:(
((
((
(X(((((((((((Kind
ergarten
(30
:01:00
(31
:01:00
(29
:1(
(32
:1(
X(((((((((((Prim
ary(
30:01:00
(31
:01:00
(29
:1(
(29
:1(
X(((((((((((JHS(
14:01(
15:01(
14:1(
(14
:1(
X(((((((((((SH
S(21
:01(
21:01(
23:01(
((
9. Proficiency(rate:(
((
((
(X(((((((((((En
glish(P4
(28
.4(
30.1(
37.2(
((
X(((((((((((Maths(P4(
22.1(
27(
22(
((
X(((((((((((En
glish(P6
(39
(49
(37
.9(
((
X(((((((((((Maths(P6(
10.9(
13.3(
24.9(
((
10. BE
CE(pass(rate(
68(
≥68(
NA(
((
11. Teache
r(absen
teeism
(rate(
7%(
≤7%(
NA(
((
12. Ba
sic(scho
ols(ne
eding(major(re
pairs((p
ub./priv.)(
(%)(
22(
20(
NA(
((

61
60"
"FOCUS(AREA
S(IN
DICATO
R(
BASE
LINE((201
7)(
2018
(TARGET
(20
18(ACTU
AL(
2019
(TARGET
(20
19(ACTU
AL(
13. Ed
ucation(expe
nditu
re(as(%(of(G
DP(
6.20
%(
≥8.0%(
10.00%
((
(Hea
lth(an
d(Hea
lth(
Services
(1.
Propo
rtion(of(fu
nctio
nal(C
ommun
ityXbased
(Health
(Plan
ning
(services((CHPS)(zon
es(
4,40
0((67.4%
)(4,60
0((72%
)(5,26
7((76.50
%)(
5,97
7((82%
)(5,50
9((78.7%
)(
2. Propo
rtion(of(fu
nctio
nal(ambu
lances(and
(service(
centres:(
((
((
(
X(((((((((((Am
bulances(
130(60
%)(
160((74%
)(25
(55.5%
)(80
(60%
)(47
(19.7%
)(of(a
mbu
lances(
operationa
l(X(((((((((((Stations(Service(Cen
tres(
80((3
7%)(
267((74%
)(13
3((41.4%
)(60
%(Availability(of(services(
19.7%(Availability(of(services(
3. Propo
rtion(of(traine
d(an
d(de
ployed
(Emergency(
Med
ical(Techn
icians((E
MTs)(
1,64
8((51%
)(2,22
5((69%
)(57
7(57
7(Ad
ditio
nal(personn
el(in(
training
(49
0(pe
rson
nel(passed(ou
t(and
(de
ployed
(4.
Propo
rtion(of(pub
lic(hospitals(with
(functio
nal(
emergency(team
(18
.50%
(20
%(
25.50%
((
(
5. Propo
rtion(of(pub
lic(hospital(offe
ring(men
tal(
health(treatm
ent(
100%
(NA(
100%
((
100%
(
6. Passage(of(M
ental(H
ealth
(L.I.(
The(Legislative(
Instrumen
t((LI)(o
n(the(
Men
tal(H
ealth
(Act(846
(is(before(the(
Committee
(on(
Subsidiary(Legislatio
n(of(Parliamen
t(
NA(
(65%
)(LI(sen
t(to(AG
(Ra
tify(LI(
LI(ra
tified(
7. Propo
rtion(of(re
gion
al(and
(district(p
ublic(hospitals(
offerin
g(trad
ition
al(m
edicine(practice(
13.20%
(13
.60%
(23
.70%
((
(
8. Percentage(of(th
e(po
pulatio
n(with
(valid(NHIS(card(
39%(
40%(
35.8%((((((((((((((((((((((((((((((((((((((((((((((((((((((((((((((((((((((((((((((((((((((((((((((((((((((((((((((((((((((((((
35.7%(from
(201
9(AP
R((
41%((((((((((((((((((((((((((((((((((((((((((((((((((((((((((((((((((((((((((((((((((((((((((((((((((((((((((((((((((((((((((((((((((((((((((((((((((((((((((((((((((((((((((((((((((((((((((((((((((((((((((((((((((((((((((((((((((((((((((((((((((((((((((((((((((((((((((((((((((((
40%(from
(201
9(AP
R(9.
Per(cap
ita(OutXpatient(Dep
artm
ent((OPD
)(attend
ance(
1.06
(1.17
(1.05
(1.08
(1.02
(
10. DoctorXtoXpop
ulation(ratio
(5.80
625(
1:8,29
0(1:(7,196
(1:68
00(
1:68
97(
11. NurseXtoXpo
pulatio
n(ratio
(1:79
9((
1:83
9(1:70
0(1:53
9(12
. Pe
r(cap
ita(expen
diture(on(he
alth(
USD
24.8(
USD
37(
USD
50(
USD
50(
N/A(
13. Und
er(X5
(mortality(ratio
((per(1,000
(live(births)(
41(
40(
52.9(
56(data(from
(MoH
(50
((
14. Infant((p
er(1,000
(live(births)(m
ortality(ratio
(60
(50
(41
((
(15
. Materna
l(mortality(ratio
:(((
((
((
X(((((((((((Survey(
319(
322(
310(
((
X(((((((((((Institu
tiona
l((de
aths(at(h
ealth
(facilities(pe
r(10
0,00
0(live(births(
147(
142(
128.6(
142(
122.2(
16. Stillbirth(rate(
17/100
0(live(birth(
14/100
0(live(births(
13.9/100
0(live(births(
14.5/100
0(live(births(
12.22/10
00(live(births(
17. Prop
ortio
n(of(children(im
mun
ised
((Pen
ta(3)((%)(
94.60%
(95
%(
95.50%
(95
.00%
(91
.10%
(18
. Institu
tiona
l(Malaria(case(fatality(rate(
0.3(
0.26
(0.27
(0.20
%(
0.1(
19. Und
erX5(m
alaria(case(fatality(rate(
0.32
(0.23
(0.16
(0.02
(0.11
(20
. HIV(prevalence(rate(
0.65
%(
0.60
%(
1.64
%(
1.67
%(
1.62
%(
1.7%
(
21. Pe
rcen
tage(of(P
LHIV(who
(received
(Antire
trovira
l(47
%(
50%(
35.7%(
45%(
44.9(%(

62
61"
"FOCUS(AREA
S(IN
DICATO
R(
BASE
LINE((201
7)(
2018
(TARGET
(20
18(ACTU
AL(
2019
(TARGET
(20
19(ACTU
AL(
therap
y((ART
)(33
.5%(
22. AIDSXrelated(mortality(rate(
8,00
0(6,58
0(14
,181
(40
00(
13,616
(23
. HIV(Reten
tion(
(85
%(
74.80%
((
(3:(Food(an
d(Nut
rition(
1. Und
er(5(stunting,(und
erweigh
t(and
(wastin
g:(
((
((
(X(((((((((((Stun
ting(
19.0%((2
014(DHS)(
14.50%
(18
%(
((
X(((((((((((Und
erweigh
t(11
.0%((2
014(DHS)(
10%(
13%(
((
X(((((((((((Wastin
g(5.0%
((201
4(DHS)(
<5%(
7%(
((
2. Low
(birth(weigh
t(9.5%
((201
4(DHS)(
8.60
%(
NA(
((
3. Prevalence(of(ana
emia:(
((
((
(X(((((((((((Ch
ildren(un
der(5
Xyears(
66%((2
014(DHS)(
35%((G
hana
(Micronu
trient(Survey,(
2017
)(
55%(
NA(
((
X(((((((((((Wom
en(of(rep
rodu
ctive(age((15X49
(years)(
42%((2
014(DHS)(
35%(
NA(
((
4. Exclusive(Breastfee
ding
(52
%((2
014(DHS)(
<52%
(43
%(
((
5. Propo
rtion(of(pop
ulation(overweigh
t/ob
ese(
((
((
(X(((((((((((Ch
ildren(un
derX5:(
2.60
%(
<2.6%(
1%((2
017/18
(MICS)(
((
X(((((((((((Wom
en((1
5X49
(years)(
40.1%((2
014(DHS)(
Less(th
an(2.6%(
NA(
((
6. N
ationa
l(Foo
d(Safety(Policy(fin
alised
(and
(im
plem
ented(
Policy(ad
opted(
Nationa
l(foo
d(safety(
bill(subm
itted
(to(
Parliam
ent(for(
consideration(an
d(ap
proval(
Policy(at(th
e(Ministry(
of(Health
(awaitin
g(Ca
bine
t(Mem
o(to(be(
subm
itted
(to(cab
inet(
for(ratificatio
n(
((
4:(Popu
lation(
Man
agem
ent(
1. Pop
ulation(grow
th(ra
te(
2.28
%(
2.25
%(
2.50
%(
2.22
%((N
ew(NPC
)(2.50
%(
2. Hou
seho
ld(size:(
((
((
(X(((((((((((Nationa
l(4.55
(4.5(
4.1(
(4.4(
X(((((((((((Urban
(4.1(
3.8(
5((
5.0(
X(((((((((((Ru
ral(areas(
((
((
9.1(
3. Propo
rtion(of(M
DAs/M
MDAs(integrating(
popu
latio
n(varia
bles(in(th
eir(d
evelop
men
t(plans(
96%(
((
(96
.0%((N
ew(NPC
)(
X(((((((((((MDAs(
NA(
0%(
100%
(0%
(10
0%(
X(((((((((((MMDAs(
96%(
0%(
100%
(0%
(10
0%(
4. Percentage(of(vita
l(events(registered
((
((
((
X(((((((((((Re
gistered
(births(
861,44
7(65
%(
70.10%
((
80.4%((7
07,064
)(X(((((((((((Re
gistered
(deaths(
51,805
((18%
)(38
%(
16.50%
((
16.6((5
1054
)(5.
Percentage(of(pop
ulation(en
rolled(in(th
e(integrated
(civil(register(
(NIA(re
gistered
(2,775
(ne
w(app
lican
ts;(Issue
d(3,65
8(to(re
gistered
(ap
plican
ts,(R
egistered(
14,027
(foreign(
natio
nals,(and
(
((
(Th
e(Nationa
l(Ide
ntificatio
n(Au
thority
(registered
(abo
ut(3.6(
million(citizen
s,(and
(13,50
0(foreign(reside
nts(un
der(the
(Fo
reign(Iden
tification(
Man
agem
ent(S
ystem(
X(((((((((((Gha
naian((
80%(
NA(
((

63
62"
"FOCUS(AREA
S(IN
DICATO
R(
BASE
LINE((201
7)(
2018
(TARGET
(20
18(ACTU
AL(
2019
(TARGET
(20
19(ACTU
AL(
X(((((((((((Fo
reigne
rs(
Rene
wed
(cards(of(
20,180
(50
%(
NA(
((
6. Con
tracep
tive(Prevalen
ce(Rate(
13.5%(X((PMA(20
20,(
2015
)(19
.80%
(25
.0%((G
MHS,(201
7)(
40.0%((N
ationa
l(Pop
ulation(
Policy,(201
7)(
25.0%((G
MHS)(
7. Total(Fertility
(Rate(of(wom
en(15X49
(years(
4.2((201
4(DHS)(
3.5(
3.9((GMHS,(201
7)(
3.5%
((Nationa
l(Pop
ulation(
Policy,(201
7)(
3.90
%(
8. You
th(Develop
men
t(Ind
ex(
NA(
Develop
men
t(of(Y
outh(
Develop
men
t(Ind
ex(
initiated
(
Drafting(yet(to(be
(initiated
((
The(YD
I(process(was(initiated
(in(
2019
,(to(measure(th
e(prog
ress(
of(you
th(develop
men
t(and
(em
powermen
t(in(areas(such(as(
education,(health
(and
(wellbeing
,(employmen
t(and
(op
portun
ity,(p
olitical(and
(civic(
participation.(A(te
chnical(
working
(group
(has(bee
n(constituted
(to(oversee
(the(
developm
ent(o
f(the
(Inde
x.(
9. Urban
isation(rates((%
)(50
.90%
(57
.2%(
56.5%((N
ew(NPC
)(NA(
57.2%((N
ew(NPC
)((
10. Share(of(re
mittan
ces(in(GDP(
7%(
13%(
5.8%
(4.1%
(MoF
((
5.4%
(MoF
(
5:(W
ater
(and
(En
viro
nmen
tal(
Sanitation(
1.
Percen
tage(of(p
opulation(with
(access(to(basic(
drinking
(water(sou
rce(
66.97%
((
67.51%
(70
.05%
(61
.80%
(
X(((((((U
rban
:(76
%(
79%(
71.00%
(72
.00%
(61
.30%
(X(((((((R
ural:(
62.03%
(69
.23%
(62
.06%
(70
.00%
(62
.29%
(2.
Pe
rcen
tage(of(d
istribution(loses(
51.10%
(≤4
0%(
53.41%
(49
.73%
(50
.52%
(3.
Pe
rcen
tage(of(p
opulation(with
(access(to(safe(
drinking
(water(sou
rces(
27%((JMP(Nationa
l)(31
.5%((JMP(Nationa
l)(19
.00%
(29
.50%
(36
.00%
(
4.
Percen
tage(of(p
opulation(with
(access(to(
improved
(liqu
id(water(m
anagem
ent(
15%(
20%(
15.00%
(18
.00%
(21
.00%
(
5.
Prop
ortio
n(of(com
mun
ities(achieving
(ope
n(de
fecatio
nXfree
((ODF)(status(
NA(
NA(
16%((M
SWR(X(recen
t(23
.00%
(21
.00%
(
6.
Percen
tage(of(solid(waste(prope
rly(dispo
sed(of(
(major(to
wns/cities)(
70%(
80%(
80.00%
(75
.00%
(80
.00%
(
7.
Prop
ortio
n(of(liqu
id(waste((faecal(m
atter)(safely(
disposed
(onXsite(or(p
rope
rly(collected
,(tran
sported(an
d(treated(offXsite(
3.90
%(
4.00
%(
7%(M
SWR(
9.00
%(
19.00%
(
6:(Pove
rty(an
d(Ineq
uality(
1.
Incide
nce(of(poverty(
24.20%
(19
.70%
(23
.4(
((
2.
Income(Distribution(Inde
x((Gini(Ind
ex)(
42.30%
(≤4
2.3%
(43
%((2
017(GLSS)(
((
3.
Num
ber(o
f(spe
cial(develop
men
t(initiatives/m
echa
nism
s(establishe
d(2(Develop
men
t(Au
thorities((SAD
A(an
d(CE
DEC
OM)(
Law(fo
r(estab
lishing
(three(Special(
Develop
men
t(Au
thorities,(n
amely(
Northern(
Passage(of(th
e(establishm
ent(o
f(these(de
velopm
ent(
authorities(in(201
7,(
followed
(by(the(
((

64
63"
"FOCUS(AREA
S(IN
DICATO
R(
BASE
LINE((201
7)(
2018
(TARGET
(20
18(ACTU
AL(
2019
(TARGET
(20
19(ACTU
AL(
Develop
men
t(Au
thority
((NDA),(
MiddleXBe
lt(Develop
men
t(Au
thority
((MDA)(and
(Co
astal(D
evelop
men
t(Au
thority
((CDA)(
passed
(by(Pa
rliam
ent(
inau
guratio
n(of(th
eir(
respectiv
e(bo
ards(in(
2018
(
4.
Num
ber(o
f(IPE
P(projects(im
plem
ented(by(ty
pe.(
0(Re
gion
al(te
am(to
(oversee(the(
implem
entatio
n(of(th
e(IPEP
(con
stitu
ted(an
d(infrastructure(nee
ds(of(
all(275
(con
stitu
encies(
cond
ucted(
Region
al(te
ams(to(
oversee(the(
implem
entatio
n(of(
the(IPEP
(were(set(u
p;(
infrastructure(nee
ds(
of(all(27
5(constitue
ncies(
assessed
;(prio
rity(
projects(iden
tified(
((
7:(Child(and
(Fam
ily(
Welfare
(1.
Prop
ortio
n(of(children((5X17)(years)(e
ngaged
(in(
hazardou
s(work(as(a(percentage(of(all(children(
14%(
10%(
14%((2
017(GLSS)(
N/A(
(
2.
Percen
tage(of(children(en
gaged(in(child(labo
ur(
21.80%
(16
.80%
(21
.8%((2
017(GLSS)(
N/A(
(3.
Incide
nce(of(child(abu
se(cases(
4,72
0(3,50
0(35
40(
N/A(
5,14
7(4.
Re
ported
(cases(of(child(trafficking
(and
(child(
abuse(
188(
150(
252(
80(
200((Child(trafficking
)(
8:(The
(Age
d(
1.
Ageing
(Bill(passed(into(law(and
(fully(
implem
ented(
Draft(Ageing(bill(
prep
ared
(Ag
eing
(bill(sub
mitted
(to(Parliamen
t(and
(pa
ssed
(into(law(
Nationa
l(Stakeho
lders(
and(Parliam
entary(
PreXscrutin
y(completed
(
Draft(ageing(bill(pa
ssed
(into(
law(
Stakeh
olde
rs(con
sulta
tions(
completed
(PreX(legislative(scrutin
y(with
(Pa
rliam
entary(Select(
Committee
s(completed
(2.
Pe
rcen
t(of(ind
igen
ts(re
gistered
(und
er(th
e(NHIS(
481,49
4((4.4%)(
≥5%(
390,54
5((3.8%)(
((
9:(G
ende
r(Eq
uality(
1.
Affirmative(Ac
tion(law(ena
cted
(and
(im
plem
ented(
Draft(Affirm
ative(
Actio
n(bill(in(
prep
aration(
Affirmative(Ac
tion(Bill(
finalised
(and
(subm
itted
(to(
parliam
ent(for(
consideration(
At(Attorne
yXGen
eral’s(
Dep
artm
ent(for(
review
(
((
2.
Percen
tage(of(w
omen
(in(pub
lic(life(
((
((
(X(((((((M
inisters(
23.25%
((9)(
40%(
10((2
0%)(
40%(
22.4%((1
3)(
X(((((((D
ep.(M
inisters(
20.93%
((8)(
>30%
(12
((20.3%
)(40
%(
20%((1
0)(
X(((((((M
Ps(
10.9%((3
0)(
10.50%
(37
((13.5%
)(40
%(
14%((3
8)(
X(((((((M
MDCE
(10
.3%((2
0)(
40%(
36((1
6.9%
)(40
%(
14.2%((3
7)(
X(((((((C
hief(Dire
ctors(
10%((4
)(>3
0%(
3((17%
)(40
%(
24%((7
)(X(((((((C
hief(Ju
stice(
100%
((1)(
100%
(1((100
%)(
100%
(10
0(%((1
)(X(((((((Sup
reme(Co
urt(Jud
ges(
23%((3
)(40
%(
15((2
6%)(
40%(
26%((4
)(X(((((((H
igh(Co
urt(Jud
ges(
38%((5
)(40
%(
5((38%
)(40
%(
35((3
6%)(
X(((((((O
verall((201
6)(=(26.8%
(26
.80%
(39
.10%
(NA(
47.50%
(32
.10%
(

65
64"
"FOCUS(AREA
S(IN
DICATO
R(
BASE
LINE((201
7)(
2018
(TARGET
(20
18(ACTU
AL(
2019
(TARGET
(20
19(ACTU
AL(
3.
Repo
rted
(cases(of(d
omestic(violence(
12,377
(≤9
,200
(NA(
((
4.
Prop
ortio
n(of(M
MDAs(im
plem
entin
g(the(
administrative(directive(on
(allocatio
n(of(30%
(of(
poverty(alleviation(an
d(cred
it(fund
(to(service(
wom
en’s(enterprises(
0(10
0%(
NA(
((
5.
Prop
ortio
n(of(wom
en(with
(access(to(institu
tiona
l(cred
it(90
%((M
ASLO
C)(
90%((M
ASLO
C)(
87%((M
ASLO
C)(
(55
.9%((N
BSSI)(
10:(So
cial(
Prote
ction(
1.
Num
ber(o
f(extremely(po
or(hou
seho
lds(
bene
fiting(from
(LEA
P(21
3,04
3(21
3,04
3(40
7,65
5(35
0,00
0((Enrolled)(
322,20
0((Enrolled)(
2.
Percen
t(of(b
eneficiarie
s(that(have(exite
d(the(
cash(tran
sfer(program
me(
0(NA(
NA(
500((7%)(
0%(
3.
Social(protectionXrelated(expe
nditu
re(as(a(
percen
tage(of(G
DP(
0.05
%(
≥5(
1.14
%(
((
4.
Prop
ortio
n(of(th
e(po
pulatio
n(in(vulne
rable(
employmen
t((%)(
73.67%
(72
.50%
(NA(
(66
.2%((G
LSS(7,(201
9)(
5.
Prop
ortio
ns(of(e
lderly(persons(abo
ve(60(years(
who
(receive(regu
lar(p
ension
(paymen
ts(
10%((2
67,895
/old(
peop
le)(
15%(
199,78
6((
211,93
4(
6.
Inform
al(Sector(P
ension
(Schem
e(establishe
d(SSNIT(In
form
al(Sector(
Fund
((SISF)(with
(15
0,00
0(inform
al(
sector(con
tributors(
Fram
ework(to(
operationa
lize(the(
sche
me(prep
ared
(
11(Schem
es(
establishe
d((brin
ging
(total(informal(sector(
sche
mes(to
(32)(
Establish(more(inform
al(
sector(schem
e(for(c
ocoa
(farm
ers(an
d(iden
tifiable(
grou
ps(
31(inform
al(sector(p
ension
(sche
mes(
11:(Disab
ility(an
d(Dev
elopm
ent(
1.
Prop
ortio
n(of(District(A
ssem
bly(Co
mmon
(Fun
d((DAC
F)(re
leased
(to(PWDs((%
)(3%
(Ghȼ(28.83
1(millionXcoverin
g(4th(
quarter(2
016,(and
(1stX
3rd(qu
arters(201
7)(
≥2%(of(D
ACF(
NA(
3%(District(A
ssem
bly(
Common
(Fun
d(to(be(
disbursed(to(PWDs(
3%(District(A
ssem
bly(Co
mmon
(Fu
nd(was(disbu
rsed
(to(PWDs(
2.
Prop
ortio
n(of(persons(with
(disab
ilitie
s(receiving(
need
ed(assistiv
e(techno
logies(
NA(
25%(of(P
WDs(provided
(with
(nee
ded(assistive(
techno
logies.(
15,970
(visua
lly(
impa
ired(pe
rson
s(use(
smarts(pho
nes(
((
3.
Percen
tage(of(P
WDs(in(pub
lic(life:(
((
((
(X((((M
embe
rs(of(P
arliamen
t(0%
(NA(
0((
0(X((((M
inisters(of(State(
1%(
NA(
1((
1(X((((M
embe
rs(of(D
istrict(A
ssem
blies(
NA(
NA(
32(
(32
((Collatio
n(of(data(on
(Mem
bers(of(D
istrict(A
ssem
blies(
still(onXgo
ing)(
X((((C
hief(Dire
ctors(
NA(
NA(
0((
0(X((((M
MDCE
s(NA(
NA(
1((
1(X((((C
hief(Executiv
e(of(Pub
lic(In
stitu
tions(
NA(
NA(
1((
1(X((((Leade
rship(po
sitio
n(in(m
ajor(political(Partie
s(NA(
NA(
1((
1(4.
Legislative(Instrumen
t(of(the
(Disab
ility(Act(715
(Co
nsultatio
ns(held(
with
(Disab
led(Pe
ople's(
Organ
izations((D
POs)(
to(develop
(propo
sals(
for(the
(review
(
Legislative(Instrumen
t(subm
itted
(to(
Parliam
ent(for(
consideration(an
d(en
actm
ent(
Initiated
(process(to
(review
(the(Pe
rson
s(with
(Disab
ility(Act(
2006
((Act(715
)(together(with
(the(LI(
Review
(Persons(with
(disability,(200
6((Act(715
)(to(
comply(with
(United(Nations(
Conven
tion(on
(the(Righ
ts(of(
Person
s(with
(Disab
ility((
Draft(Bill(on(the(Am
endm
ents(
to(th
e(Ac
t(715
(Prep
ared
(((
Draft(accom
panying(Legislative(

66
65"
"FOCUS(AREA
S(IN
DICATO
R(
BASE
LINE((201
7)(
2018
(TARGET
(20
18(ACTU
AL(
2019
(TARGET
(20
19(ACTU
AL(
Prep
are(the(accompa
nying(
Legislative(Instrumen
t(Instrumen
t(prepa
red(Legislative(
Scrutin
y(an
d(Parliam
entary(
engagemen
t(to(commen
ce(
2020
(12
:(Em
ploym
ent(
and(Dec
ent(Work(
1.
Annu
al(labo
ur(produ
ctivity
(growth((%
)(4%
(3.9%
((WDI,(WB)(
4.80
%(
5.6%
((201
7)(
3.0%
((WDI,(WB)(
((
2.
Prop
ortio
n(of(indu
stria
l(lab
our(d
ispu
tes(settled(
53.01%
(83
.65%
((LFS,(201
7)(
(67,76
1(of(81,00
7)(
≥70(
48.8%(
92%((M
ELR)(
≥80(
95%((M
ELR)(
3.
Wage(an
d(salarie
d(workers(as(a(pe
rcen
tage(of(
total(employmen
t(24
.30%
(30
.00%
(25
.49%
((
23.50%
(
13:(Yo
uth(
Dev
elopm
ent(
1.
Num
ber(o
f(you
ths(provided
(with
(employab
le(
skills(
5317
1("67,30
9((IC
CES=2,75
0(OICG=1
5,58
9(NVT
I=48
,970
)("(
≥100
,000
(45
,000
(70
356(
6344
8(((ICC
ES=3
,448
(((OICG=1
1,79
7(((
NVT
I=48
,203
(
50,000
.00(
55,056
((IC
CES=4,37
6(OICG=3
,601
(NVT
I=47
,079
)(
2.
Num
ber(o
f(you
th(Develop
men
t(Cen
tres(re
vived(
0(5(
7((
(3.
Yo
uth(un
employmen
t(rate(
12.1%(
16.9%((((((((((LFS,(201
7)(
10%(
NA(
(12
.6%((((((((G
LSS(7,(201
9)(
4.
Num
ber(o
f(job
s(created(un
der(the
(You
th(
Enterprise(Sche
me((YES),(Nationa
l(En
trep
rene
urship(and
(Inno
vatio
n(Plan
((NEIP)(
and(the(Nation(Bu
ilders(Co
rps(
62,635
(15
0,00
0(32
0,30
9((
(
5.
Prop
ortio
n(of(you
ng(peo
ple(in(political(life
:((
((
((
X(((((((((((Ministers(of(State(
1.8%
((2)(
NA(
NA(
((
X(((((((((((Mem
bers(of(P
arliamen
t(4%
((11)(
NA(
NA(
((
X(((((((((((MMDCE
s(NA(
NA(
NA(
((
X(((((((((((Mem
bers(of(D
istrict(A
ssem
blies(
NA(
NA(
NA(
((
X(((((((((((CE
Os(of(Pub
lic(In
stitu
tions(
NA(
NA(
NA(
((
14:(Sp
orts(an
d(Rec
reation(
1.
Num
ber(o
f(spo
rting(facilities(an
d(infrastructure(
reha
bilitated
/con
structed
((Mileston
e)(
1((Com
men
ced(
constructio
n(of(new
(Sports(stadium
)(
2(2(
2(2(reha
bilitated
((1(Co
nstructed(
2.
Num
ber(o
f(local(com
petitions(organ
ised
(70
(40
(85
(90
(Th
e(Nationa
l(Spo
rts(
Associations(organ
ized
(92(
compe
titions(in(th
e(course(of(
the(year(to
(promote(vario
us(
sports(disciplines(and
(to(
encourage(grassroo
ts(
participation.(
3.
Num
ber(o
f(interna
tiona
l(and
(sub
Xregiona
l(compe
titive(sportin
g(even
ts(in(which(Gha
na(
participated
(
20(events(
25(
70(
90(
The(Nationa
l(Spo
rts(Au
thority
(supp
orted(Nationa
l(Athletes(to(
participate(in(54(Internationa
l(compe
titions(in(201
9(

67
66"
"FOCUS(AREA
S(IN
DICATO
R(
BASE
LINE((201
7)(
2018
(TARGET
(20
18(ACTU
AL(
2019
(TARGET
(20
19(ACTU
AL(
4.
Sport(fun
d(establishe
d(A(13
Xmem
ber(
technical(team(to
(help(
with
(the(creatio
n(of(
the(fund
(inau
gurated,(
and(Nationa
l(conferen
ce(on(the(
establishm
ent(o
f(the
(sport(fun
d(organized.(
Fund
(estab
lishe
d(an
d(mad
e(op
erationa
l(Ca
bine
t(mem
o(on
(the(
fund
(prepa
red(bu
t(yet(
to(be(subm
itted
(to(
cabine
t(
Subm
it(to(cab
inet(
Subm
itted
(to(Cab
inet(
5.
Contrib
ution(of(spo
rts(to(GDP((%
)(NA(
NA(
GH¢3
03,118
.52(from
(8(matches(
GH34
9,66
3(from
(5(
matches((n
ew(data)(
((
((

68
67"
"App
endix(III:(Env
iron
men
t,(Infrastru
ctur
e(an
d(Hum
an(Set
tlem
ents(
Focu
s(Are
as(
Indica
tors(
Indica
tor(Definition(
Bas
eline(20
17(
2018
(20
19(Tar
get(
Status
(in(20
19(
1. Pro
tected
(Are
as(
(1.
Co
verage(of(p
rotected
(areas((
Prop
ortio
n(of(
terrestrial(
protected(
areas(
expressed(
over(to
tal(cou
ntry(area(
15.057
%(
(15
.057
%(
15.057
%(
15.057
%28(
2. Stock(of(biological(diversity:(
- Indigeno
us(plant(spe
cies(
- Fishes(
- Birds(
- Mam
mals(
- Species(
of(am
phibians(an
d(reptiles(
The(
numbe
r(of(spe
cies(in(
a(system
(and
(the
(variances(o
f(species'(local(abu
ndan
ce((
(≥2
,974
(≥5
04(
≥728
(≥2
25(
≥221
(
(≥2
,974
(≥5
04(
≥728
(≥2
25(
≥221
(
(≥2
,97(
≥504
(≥7
28(
≥225
(≥2
21(
(≥2
,974
(≥5
04(
≥728
(≥2
25(
≥221
(
3. Pe
rcen
tage(of(de
grad
ed(areas(
with
in(areas(und
er(protection(
The(
measuremen
t(of(
degrad
ed(forest(reserves(as(a(
percen
tage(of(total(
forest(
reserves(in(th
e(coun
try(
19%(
37.4%(
18%(
18%(
2.
Miner
als(
Extrac
tion((
(
1. Mineral(righ
ts(and
(produ
ction:(
a. M
ineral(righ
ts(granted
((( ( ( ( ( ( b.
Mineral(produ
ction(
- Gold((
- Diamon
ds(
- Ba
uxite
(-
Man
gane
se(
Total(
numbe
r(of(
mineral(
rights(gran
ted(by(the
(Minister(
respon
sible(
for(
mines(
in(
respect(
of(
mining(
lease,(
prospe
cting,(reconn
aissan
ce,(
salt,(
quarry,(
clay,(
sand
(winning
,(sm
allXscale(
gold/diamon
d,(etc.(
( Qua
ntity
(an
d(value(
of(
selected
(minerals(
prod
uced
(pe
r(ann
um(
( ( 55( ( ( ( ( ( ( (
4,24
1,20
2(87
,065
(1,47
6,96
6(3,02
1,63
3(
( ( 72( ( ( ( ( ( ( (
4,93
8,71
0(10
0,32
9(1,01
1,30
2(4,96
4,98
1(
( ( NA(
( (31
5( ( ( ( ( ( ( (4,67
3,97
4(31
,445
(1,11
6,33
4(5,40
1,09
3(2.
Num
ber(
of(
distric
ts(
and(
percen
tage(of(land
(area(affected
(by(th
e(activ
ities(of(illicit(m
ining:(
- No.(of(D
istricts(
- Pe
rcen
t(area(affected
((%)((
Coun
t(of(districts(rep
orted(to(
be(affe
cted
(by(illegal(m
ining(
by(the(
joint(
taskforce(
on(
mining(an
d(the(share(of(la
nd(
area(a
ffected
(by(these(
illicit(
activ
ities(
( ( ( ( NA(
21%((5
0,00
0(km
2 )(of(total(
land
(area(of(Gha
na(
( ( ( ( NA(
NA( (
NA(
NA(
3. Be
nefits(of(m
ineral(produ
ction(to(
Gha
naian(econ
omy:(
a. L
abou
r(- L
arge(scale((e
xpatria
te(and
(local);(m
ale(an
d(female(
( ( Num
ber(of(persons(employed
(in(
largeX(
and(
smallXscale(
mining,(b
oth(
expa
triate(a
nd(
( ( (23
,772
((
( ( (23
,894
((
NA(
( ( (31
,571
((
"""""""""""""""""""""""""""""""""""""""""""""""""""""""""""""
28"T
he c
alcu
latio
n is
pre
sent
ed fo
r th
e la
ndm
ass
or te
rres
tria
l are
as o
f the
cou
ntry
’s
terr
itory
and
exc
lude
d th
e m
arin
e ar
eas
unde
r na
tiona
l jur
isdi
ctio
n It
cove
rs le
gally
des
igna
ted
fore
st r
eser
ves,
wild
life
rese
rves
and
Ram
sar
site
s"

69
68"
"
Focu
s(Are
as(
Indica
tors(
Indica
tor(Definition(
Bas
eline(20
17(
2018
(20
19(Tar
get(
Status
(in(20
19(
- Small(
scale(
(legal(
and(
illegal)(
(b.
(Fo
reign(direct(investmen
t((in
(US$(m
illion)(
( c. M
ineral(re
venu
es((G
H¢m
)(- R
oyaltie
s((
- Corpo
rate(Taxes(
- Corpo
rate(social(
respon
sibility(
- Con
tribution(to(to
tal(
merchan
dise(exports(
( (d.
Rep
atria
tion(of(m
ineral(
revenu
e(- (%(of(m
ineral(re
venu
e(returned
(to(th
e(Gha
naian(
econ
omy((Com
mercial(
banks)((
- %(of(m
ineral(re
venu
e(spen
t(on(local(goo
ds(
local(
( Ratio
(of(
FDI(
to(
GDP,(
expressed(in(percentage(((
( ( Total(
amou
nt(
of(
mineral(
revenu
es(received
(throug
h(taxes,(
royalties,(
corporate(
social(
respon
sibility(
and(
expo
rt(of(m
ineral(re
sources(in(
Gha
na(Ced
is(
( ( ( Ratio
(of(reven
ue(from
(mineral(
expo
rts(
returned
(to(
the(
econ
omy(
to(total(revenu
e,(
expressed(as(a(percentage(
( The(value(of(m
ineral(reven
ue(
spen
t(on
(local(
good
s,(
expressed(as(a(percentage(of(
total(revenu
e(from
(mineral(
resources(in(a(given
(year((
1,00
0,00
0(( (
1,03
5.96
(( ( (
702.41
(1,45
8.34
(19
.80(
(6,00
1.96
(( ( ( ( (
70%(
( ( (50
%(
1,00
0,00
0(( (
953.17
(( ( (
705.47
(1,19
9.60
(24
.093
((
5,77
3.22
(( ( ( ( (
75%(
( ( (59
%(
1,00
0,00
0(( (
969.41
(( ( (
1,00
7(58
2(NA( (
6,67
8.74
(( ( ( ( ( NA( ( ( ( NA(
4. Pe
rcen
tage(of(m
ineral(produ
ction(
processed(locally((
- Gold(
- Diamon
ds(
- Ba
uxite
(-
Man
gane
se(
The(
amou
nt(
of(
the(
key(
mineral(resources,(includ
ing(
gold,(
bauxite
,(diam
ond,(
man
gane
se,(etc(prod
uce(an
d(processed(
locally,(express(as(
percen
tage.(
( ( ( NA(
NA(
NA(
NA(
( ( ( ( NA(
NA(
NA(
NA(
NA(
3. W
ater
(Res
our
ce(
Man
agem
ent(
1. Prop
ortio
n(of(bo
dies(of(water(
with
(goo
d(am
bien
t(water(qua
lity(
(Water(qua
lity(inde
x)((
Measures(
the(
redu
ction(
in(
pollutio
n(of(water(bo
dies(
(water(qua
lity)((
52%(
55.90%
(58
(57
.8(
2. Level(of(W
ater(Stress(
Freshw
ater(with
draw
al(as(a(
prop
ortio
n(of(total(a
vailable(
freshw
ater(re
sources(
1,92
8(1,92
2(1,90
0(1,91
8(
4. Coas
tal(an
d(Mar
ine(Res
our
ces(
(
1. Kilometer(of(coa
stline((
- Protected(
- Unp
rotected
(
The(
kilometers(
of(coastline
(that(re
quire
(protection(
377km(
NA(
NA(
377km(
9.55
km(
367.45
km(
377km(
10km
(36
7km(
377km(
8.1km(
368.9km(
2. Prop
ortio
n(of(
investmen
t(in(
finan
cing
(control(
structures,(
constructio
n,(an
d(techno
logical(
improvem
ents(
Percen
tage(
of(
resources(
invested
(in(coastal(
control(
structure(relativ
e(to(resou
rce(
plan
ned(
GH¢1
28,721
,051
(GH¢3
17,035
,497
(GH¢7
1,55
8,09
2(GH¢3
63,380
,874
(
3. Level(of(po
llutants(
of(efflu
ent(
A(measure(of(concen
trations(
63(In
dustrie
s(mon
itored(
81(In
dustrie
s(mon
itored(
100(Indu
strie
s(mon
itored(
158(Indu
strie
s(mon
itored(for(

70
69"
"
Focu
s(Are
as(
Indica
tors(
Indica
tor(Definition(
Bas
eline(20
17(
2018
(20
19(Tar
get(
Status
(in(20
19(
discha
rge(into(coa
stal(waters(an
d(lago
ons(
of(da
ily(biolog
ical(oxygen
(de
man
d(load
s((BOD5),(
suspen
ded(
solids,(turbidity
,(an
d(cond
uctiv
ity(o
f(efflu
ent(
discha
rge(
for(levels(of(pollutants(
efflu
ent(q
uality(were(
above(EP
A(recommen
ded(
guideline(levels(50m
g/l,(
75NTU
(and
(150
0(µS
/Cm(
respectiv
ely(for(m
ost(
indu
strie
s(
for(levels(of(pollutants(
efflu
ent(q
uality(were(
above(EP
A(recommen
ded(
guideline(levels(50m
g/l,(
75NTU
(and
(150
0(µS
/Cm(
respectiv
ely(for(m
ost(
indu
strie
s(
for(levels(of(pollutants(
efflu
ent(q
uality(were(
above(EP
A(recommen
ded(
guideline(levels(50m
g/l,(
75NTU
(and
(150
0(µS
/Cm(
respectiv
ely(for(m
ost(
indu
strie
s(
levels(of(p
ollutants(efflu
ent(
quality
(were(ab
ove(EP
A(recommen
ded(gu
ideline(levels(
50mg/l,(75
NTU
(and
(150
0(µS
/Cm(
respectiv
ely(for(m
ost(ind
ustries(
5. Env
ironm
ental(
Pollut
ion(
1. PM
10(
and(
PM2.5(
(Particulate(
Matter)(pollutio
n(level((
( - North(In
dustria
l(Area(An
nual(
Mean(
- First(Light(Ann
ual(M
ean(
- Shan
gri(La(An
nual(M
ean(
- Ac
himota(An
nual(M
ean(
- La(Palm(Ann
ual(M
ean(
- Graph
ic(Roa
d(An
nual(M
ean(
- Kasoa(An
nual(M
ean(
- Am
asam
an(Ann
ual(M
ean(
- Mallam(M
arket(
- Weija(
- Tantra(Hill((
Average(
level(of(pa
rticulate(
matter(in(the
(air(
at(selected(
locatio
ns(in(Accra(
( ( ( (93
(µg/m3(
(15
7(µg
/m3 (
162µ
g/m
3 (16
1(µg
/m3 (
166µ
g/m
3 (18
7µg/m
3 (20
4µg/m
3 (16
3(µg
/m3 (
159(µg
/m3 (
291(µg
/m3 (
131(µg
/m3 (
( ( ( (85
(µg/m3(
(12
3(µg
/m3 (
112(µg
/m3 (
106(µg
/m3 (
133(µg
/m3 (
187(µg
/m3 (
229(µg
/m3 (
158(µg
/m3 (
134µ
g/m
3 (13
9(µg
/m3 (
129(µg
/m3 (
( ( ( (70
(µg/m3(
(10
0(µg
/m3 (
112µ
g/m
3 (10
6µg/m
3 (12
0µg/m
3 (16
0µg/m
3 (20
0(µg
/m3 (
140µ
g/m
3 (NA(
NA(
NA(
( ( ( (74
(µg/m3(
(14
3(µg
/m3 (
129(µg
/m3 (
102(µg
/m3 (
125(µg
/m3 (
NA(
139(µg
/m3 (
139(µg
/m3 (
141(µg
/m3 (
NA(
95(µg/m
3 (2.
Num
ber(of(com
panies(com
pliant(
with
(Enviro
nmen
tal(Assessmen
t((EA)((
The(
numbe
r(of(compa
nies(
that(a
dhere(
with
(permitting(
cond
ition
s(
4,63
8(10
,030
(10
,030
(11
,060
(
6. Defore
station,(
Des
ertifica
tion(an
d(So
il(Ero
sion(
(
1. State(
of(
forest(
(Rate(
of(
deforestation)(
The(
chan
ges(
in(the(
forest(
cover(
arising(
out(
of(
conversion
(of(forested(land
(to(
othe
r(uses,(expressed(
as(a(
percen
tage(o
f(total(forested
(area(of(the
(previou
s(year(
21%(
21%(
21%(
21%(
2. Hectares(
of(
degrad
ed(
forest,(
mining(
area,(dry(
and(
wet(lan
ds(
restored
/(reh
abilitated:(
- (Forest(
- (M
ining(
- Wetland
s(an
d(man
groves(
Total(a
rea(in(hectares(of(lo
st(
forest,(mining(
area,(wetland
(an
d(man
grove(areas(restored
(((
( ( (9,10
3.83
(ha(
7,33
7.50
(ha(
N/A(
( ( (24
,915
ha(
NA(
4ha(
( ( (25
,000
(ha(
( ( (21
,365
(ha(
(
3. Pe
rcen
tage(o
f(compliance(
to(the
(An
nual(Allowab
le(Cut((A
AC)(
The(volume(of(timbe
r(tha
t(can
(be
(ha
rvested(
unde
r(sustaine
dXyield(
man
agem
ent(
in(any(one
(year,(as(stip
ulated
(in(the(
pertinen
t(ap
proved
(forest(m
anagem
ent(p
lan.(
849,85
1.29
m3(
589,46
8.64
9(m3(of(onX
reserve(AA
C((118
%)(
260,38
2.63
9(m3(of(offX
reserve(AA
C((52(pe
rcen
t)(
593,06
3m3 (
(552
,283
m3(of(onXreserve(
AAC((59%
);(40
,780
(m3 (o
f(offXreserve(
AAC( (
≤1,000
,000
(m3 (
1,15
7,22
9(m
3 ((862
,409
(m3(( on(Re
serve((116
%),(
294,82
0(m
3(( off(reserve"
7. Climate(
Var
iability(and
(1.
Percentage(
of(
sectors(
with
(clim
ate(
chan
ge(mitigatio
n(an
d(Th
e(nu
mbe
r(of(MDAs(with
(clim
ate(chan
ge(m
itigatio
n(an
d(35
%(
50%(
55%(
54%(

71
70"
"
Focu
s(Are
as(
Indica
tors(
Indica
tor(Definition(
Bas
eline(20
17(
2018
(20
19(Tar
get(
Status
(in(20
19(
Cha
nge(
(ad
aptatio
n(strategies(
adap
tatio
n(measures(
as(
related(to(agriculture,(m
arine(
ecosystems,(
coastal(
zone
(infrastructure,(hu
man
(health
(an
d(settlemen
t,(biod
iversity,(
water(resou
rces(and
(wetland
s(etc.,(
expressed(
as(
a(pe
rcen
tage(of(total(M
DAs(
2. G
reen
house(gas(em
ission
s(Em
ission
s(of(carbo
n(dioxide,(
metha
ne,(nitrou
s(oxide,(a
nd(
several(flu
orinated
(gases(
in(
Gha
na,(expressed(
in(million(
tonn
es(of(carbon
(dioxide(
equivalent(
50.5(M
TCO2e
(54
.5(M
TCO2e
(56
.1(M
TCO2e
(42
.2(M
TCO2e
(
3. G
loba
l(Green
(Econ
omy(
Inde
x((GGEI)(for(Gha
na(
Provides(a(ran
king
(of(coun
try(
and(
city(p
erform
ance(in(
the(
glob
al(green
(econo
my((GGE)(
and(ho
w(expert(practitione
rs(
perceive(
this(
performan
ce.(
(The
(pe
rforman
ce(
inde
x(uses(
quan
titative(
and(
qualita
tive(
indicators(to(measure(ho
w(
well(e
ach(coun
try(pe
rforms(in(
four(
key(
dimen
sion
s:(
lead
ership(
and(
clim
ate(
chan
ge;(
efficiency(
sectors;(
markets(and
(investmen
t;(an
d(en
vironm
ent(
and(
natural(
capital(
43.28(58
th(out(of(8
0(coun
tries)(
46((G
hana
(ranked
(78th
(out(
of(130
(cou
ntrie
s)(
50(
46(79th
)(
8. Disas
ter(
Man
agem
ent(
1. Num
ber(of(recorde
d(incide
nce(of(
disasters(across(th
e(coun
try(
Total(
numbe
r(of(disasters(
occurren
ces(
across(
the(
coun
try(in(a(year(
1,13
4(2,00
7(NA(
2,21
7(
2. Num
ber(of(com
mun
ities(trained
(in(
disaster(
preven
tion(
and(
man
agem
ent(
(especially(
bush(
fires(and
(floo
ding
)((
Total(n
umbe
r(of(com
mun
ities(
that(be
nefit(from
(disaster(
preven
tion(
and(
man
agem
ent(
training
(per(ann
um(
98( (
23(
200(
993(
3. Num
ber(
of(
deaths,(
missing
(pe
rson
s(an
d(pe
rson
s(affected
(by(
disaster(per(100
,000
(peo
ple((
Total(
numbe
r(of(
person
s(affected
(by(disasters(
997(
1,06
3(NA(
739(
9. Tra
nspo
rt(
Infras
truc
ture
((R
oad
,(Rail,(W
ater
(an
d(Air)(
(
1. Ro
ad(con
ditio
n(mix(
The(road
(con
ditio
n(mix(sho
ws(
the(
prop
ortio
n(of(
the(
classifie
d(road
(network(which(
is(goo
d,(fa
ir,(poo
r)(
41%(Goo
d(33
%(Fair(
26%(Poo
r(
(41
%(Goo
d(33
%(Fair(
26%(Poo
r(
45%(Goo
d(30
%(Fair(
25%(Poo
r(
41%(Goo
d*(
33%(Fair*(
26%(Poo
r*(
2. To
tal(roa
d(ne
twork(size((km)(
The(total(leng
th(of(classifie
d((
((
(

72
71"
"
Focu
s(Are
as(
Indica
tors(
Indica
tor(Definition(
Bas
eline(20
17(
2018
(20
19(Tar
get(
Status
(in(20
19(
- Trunk(ro
ads(
- Urban
(road
s((
- Fee
der(roa
ds(
road
(ne
twork(
by(
type
,(measured(in(kilometers(
71,401
km(
14,583
(km(
15,462
(km(
48,357
(km(
71,401
km(
14,583
(km(
15,462
(km(
48,357
(km(
78,401
(km(
14,583
(km(
15,462
(km(
48,357
(km(
78,401
(km*(
14,583
(km*(
15,462
(km*(
48,357
(km*(
3. Prop
ortio
n(of(classifie
d(road
(ne
twork(maintaine
d(Ro
ads(
maintaine
d(as(
a(pe
rcen
tage(of(the(
classifie
d(road
(network(
40%(
(55
%(
60%(
35%*(
4. Ac
cide
nt(statistics(
- Ro
ad(crashes(
- Maritime(accide
nts(
- Train(de
railm
ents((
- Aircraft(acciden
ts(
Num
ber(of(acciden
ts(fo
r(each(
tran
sport(m
ode(
(9,13
3(3( NA( 1(
(9,84
0(4( NA( 0(
(6,42
7(( ( 0(
(13
,877
*(( ( 0(
5. Num
ber(o
f(roa
d(traffic(fa
talities((
Coun
t(of(p
ersons(killed
(1,82
3(2,02
0(1,67
4(2,28
4*(
6. Num
ber(o
f(serious(injurie
s(Co
unt(
of(pe
rson
s(serio
usly(
injured(
5,67
7(6,27
5(4,16
6(5,75
9*(
7. Tu
rnXaroun
d(tim
e(of(vessels((
- Tema(po
rt(
- Takoradi(port(
Average(
time(
spen
t(for(
a(vessel(to
(unloa
d(go
ods.(
( (10
1.29
hrs(
131.99
hrs(
( (91
.96(
118.44
(
( (97
.20(
117.94
(
( (10
3.09
(12
4.37
(8.
Maritime(traffic:((
- Co
ntaine
r(traffic((TEU
s)(
- Ca
rgo(traffic((ton
nes)(
Weigh
t(of(go
ods(
in(metric
(tonn
es(carried(
by(maritime(
traffic,(to(an
d(from
(Gha
na(
(1,00
9,75
5(22
,086
,626
(
(1,05
6,78
5(25
,512
,289
(
(1,11
4,27
7(27
,978
,771
(
(1,04
8,37
7(27
,700
,343
(
9. Inland
(Water(traffic:(
- Freigh
t((To
nnes)((
- Num
ber(o
f(Veh
icles((No.)((
- Pa
ssen
ger((No.)(
Qua
ntity
(of(
good
s(an
d(nu
mbe
r(of(
vehicles(
and(
passen
gers(tran
sported(
on(
waterways(
(59
,739
(91
,903
(79
8,37
0(
(33
,309
.20(
147,25
7(84
6,89
2(
(14
1,48
6.2(
83,305
(77
4,08
9(
(37
,294
.97(26
.4%)(
95,654
(14.8%
)(88
9,22
5(11
4.9%
)(10
. To
tal(air(freigh
t(an
d(nu
mbe
r(of(
passen
gers(by(catego
ries:(
- Dom
estic(airc
raft(m
ovem
ent(
- Internationa
l(airc
raft(
movem
ent(
- Dom
estic(passeng
ers((No.)(
- Internationa
l(passeng
ers((No.)(
- Freigh
t(movem
ent((tonn
es)(
Num
ber(of(air(pa
ssen
gers(and
(weigh
t(of(a
ir(freigh
t(to(a
nd(
from
(Gha
naian(airports(
( (12
,491
(26
,726
((
483,26
1(1,81
1,42
8(50
,360
(
( (10
,140
(29
,015
((
418,61
0(1,97
5,80
3(52
,390
(
( (16
,473
(28
,335
((
662,92
8(2,09
8,93
5(50
,682
(
( (16
,499
(30
,497
((
690,31
4(2,11
0,59
3(49
,846
(11
. Pa
ssen
ger(
traffic(
and(
good
s(traffic(by(railw
ays:(
- Pa
ssen
ger(traffic((1,000
(pa
ssen
gersXkm)(
- Goo
ds(traffic((1
,000
(tonn
esX
km)(
Num
ber(
of(pa
ssen
gers(an
d(weigh
t(of(go
ods(
carried(
by(
railw
ays(
( (9,13
8((
40,441
(
( (63
0( (44
,620
(
( (3,04
8((
53,360
(
( (1,94
0((
35,660
(
12. Vo
lume(
of(
good
s(tran
sited(
throug
h(Gha
na:(
- Tran
sit(c
argo
(traffic((ton
nes)(
- Tran
sit(c
ontainers(traffic(
The(
volume(
of(go
ods(
that(
passes(throug
h(Gha
na(sea(
ports(to(lan
dlocked(or(other(
coastal(cou
ntrie
s(
( (94
4,08
2(51
,285
(
( (1,38
8,08
4(64
,838
(
( (1,47
4,66
9(70
,263
(
( (1,36
3,89
2(67
,352
(

73
72"
"
Focu
s(Are
as(
Indica
tors(
Indica
tor(Definition(
Bas
eline(20
17(
2018
(20
19(Tar
get(
Status
(in(20
19(
(TEU
s)(
13. Num
ber(
of(
cargo(
tran
sit(
term
inals(in(ope
ratio
n((
The(nu
mbe
r(of(pub
lic(or(PP
PXop
erated
(cargo(
tran
sit(
term
inals(
alon
g(the(
major(
tran
sit(
corridors,(
includ
ing(
Alub
oXAc
craXAflao(an
d(Ac
craX
KumasiXO
uagado
ugou
((
0((
0(0(
0(
10.
Info
rmation(
and(
Commun
icatio
n(Te
chno
logy
((
1. Value
(of(total(investmen
t(in(the
(ICT(sector(
Value(
of(p
ublic(a
nd(p
rivate(
investmen
t(in(the(ICT(sector(
NA(
NA(
NA(
NA(
2. Internet(pen
etratio
n(rate:((
- Subscribers(
- Providers((No.)(
The(ratio
(of(po
pulatio
n(with
(access(to(internet(to(total(
popu
latio
n,(expressed(
as(a(
percen
tage(
(82
.04%
(25
(
(92
.86%
(35
(
NA(
NA(
3. To
tal(broa
dban
d(capa
city(of(the(
coun
try(
(-
Internationa
l(transit(
(-
Local(backbon
e(capa
city(
Total(broa
dban
d(capa
city(in(
terabytes,(bo
th(pu
blic(an
d(private.(
( Sum(of(total(
internationa
l(gateway(cap
acity
(to(send
(and
(receive(internet(traffic.(
( Ability(to(tran
smit(
internet(
traffic(with
in(th
e(coun
try.(
( ( ( NA( ( NA( (
( ( ( NA( ( NA(
NA(
NA(
4. Delivery(of(G
overnm
ent(services(
using(ICT:(
- Ac
cess(services((Num
ber(
of(M
MDAs(Covered
)((
- EXservices((N
umbe
r(of(
MDAs)(
( ( Access(
for(
Governm
ent(
Agen
cies(to(de
liver(services(
throug
h(ICT(
( Provision(
of(
services(
by(
governmen
t(agen
cies(throu
gh(
ICT.(
( (12
0( ( ( ( 8(
(
500( ( ( 6(
NA(
NA(
11.
Scienc
e,(
Tech
nology
(an
d(Inno
vation(
1. Research(
and(
developm
ent(
(R&D)(
expe
nditu
re(
as(
a(pe
rcen
tage(of(G
DP(
Total(pu
blic(expe
nditu
re(by(
governmen
t(an
d(go
vernmen
t(institu
tions,(
and(
private(
sector(in
vestmen
ts(in
(scien
ce,(
techno
logy(an
d(inno
vatio
n,(
expressed(as(a(percentage(of(
GDP(
0.05
%(
(GHC4
1,98
4,47
3.26
)(0.08
%(
1.00
(0.08
%(
2. Num
ber(
of(research(fin
ding
s(ad
opted(by(indu
stry(
The(
numbe
r(of(
research(
finding
s(of(
key(
natio
nal(
research(
institu
tions(
(includ
ing(CS
IR,(G
AEC(an
d(the(
universitie
s)(
adop
ted(
by(
indu
stry(
32(
70(
80(
85(
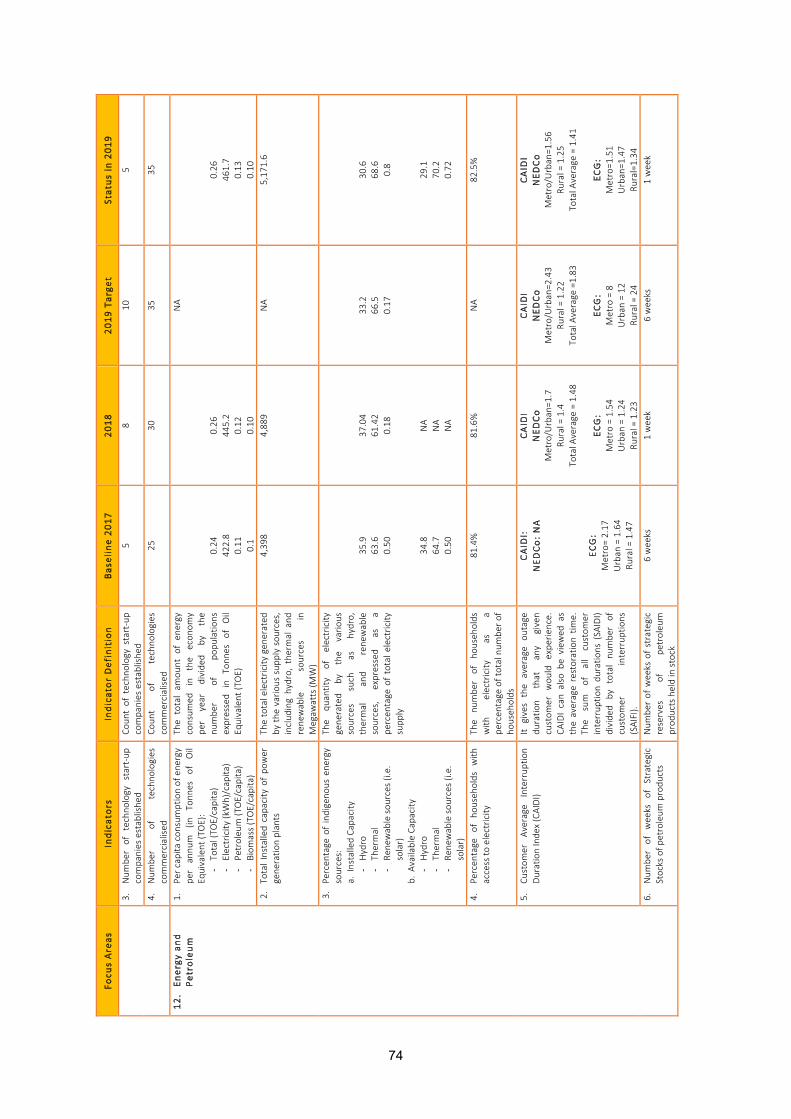
74
73"
"
Focu
s(Are
as(
Indica
tors(
Indica
tor(Definition(
Bas
eline(20
17(
2018
(20
19(Tar
get(
Status
(in(20
19(
3. Num
ber(of(techn
olog
y(startXup
(compa
nies(estab
lishe
d(Co
unt(of(techn
olog
y(startXup
(compa
nies(estab
lishe
d(5(
8(10
(5(
4. Num
ber(
of(
techno
logies(
commercialised
(Co
unt(
of(
techno
logies(
commercialised
(25
(30
(35
(35
(
12.
Ener
gy(and
(Pe
troleum
(1.
Pe
r(cap
ita(con
sumption(of(ene
rgy(((
per(
annu
m((in
(To
nnes(of(Oil(
Equivalent((T
OE):(
. To
tal((TO
E/capita)(
. Electricity
((kWh)/cap
ita)((
. Pe
troleu
m((T
OE/capita)(
. Biom
ass((TOE/capita)(
The(
total(am
ount(o
f(en
ergy(
consum
ed(in(the(
econ
omy(
per(
year(divide
d(by(the(
numbe
r(of(
popu
latio
ns(
expressed(
in(To
nnes(of(Oil(
Equivalent((T
OE)(
( ( (0.24
(42
2.8(
0.11
(0.1(
( ( (0.26
(44
5.2(
0.12
(0.10
(
NA(
( ( (0.26
(46
1.7(
0.13
(0.10
(2.
To
tal(Installed(capa
city(of(po
wer(
gene
ratio
n(plan
ts(
The(total(electric
ity(gen
erated
(by(th
e(vario
us(sup
ply(sources,(
includ
ing(hydro,(the
rmal(and
(rene
wab
le(
sources(
in(
Megaw
atts((M
W)(
4,39
8(4,88
9(NA(
5,17
1.6(
3. Pe
rcen
tage(of(indigeno
us(ene
rgy(
sources:(
a. Installed(Ca
pacity(
. Hydro(
. Th
ermal(
. Re
newab
le(sou
rces((i.e.(
solar)(
b. Available(Ca
pacity(
. Hydro(
. Th
ermal(
. Re
newab
le(sou
rces((i.e.(
solar)(
The(
quan
tity(
of(electricity
(gene
rated(
by(the(
vario
us(
sources(
such(
as(
hydro,(
thermal(
and(
rene
wab
le(
sources,(
expressed(
as(
a(pe
rcen
tage(of(total(e
lectric
ity(
supp
ly(
( ( (35
.9(
63.6(
0.50
(( (
34.8(
64.7(
0.50
(
( ( (37
.04(
61.42(
0.18
(( ( NA(
NA(
NA(
( ( (33
.2(
66.5(
0.17
(
( ( (30
.6(
68.6(
0.8( ( (
29.1(
70.2(
0.72
(
4. Pe
rcen
tage(of(ho
useh
olds(with
(access(to
(electric
ity(
The(
numbe
r(of(ho
useh
olds(
with
(electricity
(as(
a(pe
rcen
tage(of(total(num
ber(o
f(ho
useh
olds((
81.4%(
81.6%(
NA(
82.5%(
5. Cu
stom
er(Av
erage(
Interrup
tion(
Duration(Inde
x((CAIDI)(
It(gives(the(
average(
outage(
duratio
n(that(
any(
given(
custom
er(wou
ld(expe
rience.(
CAIDI(can(also(be(view
ed(as(
the(average(restoration(tim
e.(
The(
sum(of(all(
custom
er(
interrup
tion(du
ratio
ns((SA
IDI)(
divide
d(by(total(nu
mbe
r(of(
custom
er(
interrup
tions(
(SAIFI).(
CAID
I:(
NED
Co:(NA(
( (EC
G:(
Metro=(2.17
(Urban
(=(1.64(
Rural(=(1.47(
CAID
I(NED
Co(
Metro/U
rban
=1.7(
Rural(=(1.4(
Total(A
verage(=(1.48(
(EC
G:(
Metro(=(1.54(
Urban
(=(1.24(
Rural(=(1.23(
CAID
I(NED
Co(
Metro/U
rban
=2.43(
Rural(=(1.22(
Total(A
verage(=1.83
((
ECG:(
Metro(=(8(
Urban
(=(12(
Rural(=(24(
CAID
I(NED
Co(
Metro/U
rban
=1.56(
Rural(=(1.25(
Total(A
verage(=(1.41(
(EC
G:(
Metro=1
.51(
Urban
=1.47(
Rural=1.34
(6.
Num
ber(
of(wee
ks(of(Strategic(
Stocks(of(p
etroleum
(produ
cts(
Num
ber(of(w
eeks(of(strategic(
reserves(
of(
petroleu
m(
prod
ucts(held(in(stock(
6(wee
ks(
1(wee
k(6(wee
ks(
1(wee
k(

75
74"
"
Focu
s(Are
as(
Indica
tors(
Indica
tor(Definition(
Bas
eline(20
17(
2018
(20
19(Tar
get(
Status
(in(20
19(
7. Pe
rcen
tage(cha
nge(in:((
. Tran
smission
(losses(
(.
Distribution(losses(
The(
diffe
rence(
betw
een(
power(
purcha
sed(
from
(prod
ucers(
and(
sales(
by(
tran
smission
(and
(distribution(
compa
nies,(
expressed(
as(a(
percen
tage(
of(
power(
purcha
sed(
(GRIDCo
(=4.10
%(
(EC
G(=(24.25
%(
NED
Co(=(31.9%
(
(GRIDCo
=4.43%
((
ECG(=(24.3%
(NED
Co(=(30.4%
(
(GRIDCo
=5.2%(
(EC
G(=21
%(
NED
Co=2
7.5%
(
(GRIDCo
(=4.71
%(
(EC
G(=24
.7%(
NED
Co=2
8.5%
(
8. Co
st(Recovery(Ra
tio((%
):(.
VRA(
. EC
G29(ope
ratin
g(cost(
recovery(ra
tio)(
. NED
Co(
Average(
tariff(
/(Co
st(
of(
Service,(calculated:([((volum
eXba
sed(
charge(pe
r(kW
h(x(
volume(
consum
ed)(
+(fixed
(charge))(
/((total(cost(pe
r(kW
h)](
1.19
75(
(1.20
03(
58.1%(
(21
6*(
( ( (1.21
2%(
( (58
.3%(
(1.54
%(
9. To
tal(a
mou
nt(of(electricity
(saved
(from
(Dem
and(Side
(Man
agem
ent(
interven
tions((kWh)(
Total(am
ount(of(electricity
(saved(
by(
implem
entin
g(de
man
d(side
(man
agem
ent(
interven
tions(
such(
as(
replacem
ent(of(incan
descen
t(bu
lbs(
and(
old(
electrical(
appliances,(etc.(p
er(ann
um.(
NA(
NA(
NA(
NA(
10. Am
ount(of(n
ew(investmen
ts(in(oil(
and(gas(sector((U
S$(billion)(
Amou
nt(of(investmen
ts(going
(into(e
xploratio
n(for(oil(an
d(gas,(
and(
developm
ent(
of(
those(alread
y(discovered
(
60.6M(invested
(by(
compa
nies(in(exploratio
n(ph
ase(
$17.8b
n(invested
(on(
developm
ent(a
ctivities(
(includ
ing(FPSO
(cha
rter)(
$246
.6M(invested
(by(
compa
nies(in(exploratio
n(ph
ase.(
$1.67b
n(invested
(on(
developm
ent(a
ctivities(
(includ
ing(FPSO
(cha
rter)(
$536
.03M
(invested
(by(10
(compa
nies(in(exploratio
n(ph
ase.(
$1.83(bn
(invested
(on(
developm
ent(a
ctivities(
(includ
ing(FPSO
(cha
rter)(
$159
.5M(invested
(by(four(
compa
nies(in(exploratio
n(ph
ase.(
$557
.41M
(invested
(on(
developm
ent(a
ctivities((including
(FPSO
(cha
rter)(
11. Share(
of(c
ontracts(a
warde
d(to(
indigeno
us(com
panies(
The(
numbe
r(of(con
tracts(o
f(the(
oil(
and(
gas(
indu
stry(
executed
(by(
indigeno
us(
Gha
naian(indu
stry,(expressed(
as(a(
percen
tage(of(total(
contracts(of(the
(ind
ustry(pe
r(an
num((
71%((7
61(Con
tracts(
awarde
d(to(indigeno
us(
compa
nies(out(of(1
,070
(contracts(
44.08(pe
rcen
t((26
(contracts(aw
arde
d(to(
indigeno
us(com
panies(out(
of(59(contracts)(
NA(
28%(
(46(contracts(aw
arde
d(to(
indigeno
us(com
panies(out(of(1
64(
contracts)(
12. Pe
rcen
tage(sha
re(a
nd(v
alue
(of(
services(a
warde
d(to(ind
igen
ous(
compa
nies(
The(value(of(con
tracts(of(the(
oil(a
nd(gas(in
dustry(executed(
by(
indigeno
us(
Gha
naian(
indu
stry,(
expressed(
as(
a(pe
rcen
tage(of(total(contracts(
of(th
e(indu
stry(per(ann
um(
44.8%(
($39
4,72
5,37
5.98
)(19
.5%(
($59
,622
,794
.31)(
NA(
16%(
($(72,65
0,39
1.00
)(
13. Prop
ortio
n(of(
Gha
naians(
employed
(in(the(
oil(an
d(gas(
sector(
- Man
agem
ent(
Num
ber(
of(
Gha
naians(
employed
(in(
the(oil(an
d(gas(
sector(as(a(
percen
tage(of(
total(
employmen
t(in(
the(
( ( (38
6(
Note
:(Th
is(ana
lysis(is(
base
d(on(14
3(co
mpa
nies
(84
%((5
23)(
( ( (60
X70%
(
( ( (91
%((4
22)(
"""""""""""""""""""""""""""""""""""""""""""""""""""""""""""""
29"Total"Reven
ue"Collected
/Total"Ope
ratin
g"Co
st"

76
75"
"
Focu
s(Are
as(
Indica
tors(
Indica
tor(Definition(
Bas
eline(20
17(
2018
(20
19(Tar
get(
Status
(in(20
19(
- Technical(
- Others(
sector(
1,02
5(21
(75
%((1
929)(
98%((2
104)(
60X70%
(92
%(
87%((1
,366
)(99
%((1
,343
)(14
. Th
e(share(of(oil(an
d(gas(activ
ities(
in(GDP/contrib
ution(of(growth(in
(pe
troleu
m(outpu
t(to(GDP(grow
th(
Total(value(ad
ded(of(oil(an
d(gas(activ
ities(as(a(pe
rcen
tage(
of(to
tal(G
DP(
5.6%
(
(
3.80
%(
NA(
NA(
15. Pe
rcen
tage(cha
nge(in(oil(refin
ery(
capa
city((%
)(-
TORX(
- Platon
(-
GNGC(
- Ak
waaba
(
The(
chan
ge(
in(
total(
oil(
refin
ery(
capa
city,(
includ
ing(
expa
nsion(of(existing(refin
ery(
and(
constructio
n(of(
new(
refin
ery,(
expressed(
as(
a(pe
rcen
tage(
( (45
,000
(bpd
(18
00(bpd
(15
0mmscfd(
4000
(bpd
(
( (45
,000
bpd(
1800
bpsd(
150m
mscfd(
4000
bpd(
NA(
NA(
16. Prop
ortio
n(of(petroleum
(reven
ue(
allocated(to(prio
rity(areas(
The(
prop
ortio
n(of(An
nual(
Budg
et(
Fund
ing(
Amou
nt(
(ABF
A)(allocated(to(social(a
nd(
econ
omic(
infrastructure(
across(a
ll(sectors,(e
xpressed
(as(a(percentage(
ABFA
(45.3%
(of(
Herita
ge(16.38
(%(
Stab
ilisatio
n(38
.2%(of(
receipts(
ABFA
(70%
(of(G
oG(re
ceipts(
NA(
ABFA
(70%
(of(G
oG(re
ceipts(
17. Pe
rcen
tage(
of(
compa
nies(
complying
(with
(con
ditio
n(of(the
ir(respectiv
e(En
vironm
ental(
Assessmen
t((EA)(
and(
Environm
ental(
Man
agem
ent(
Plan
s((EMP)(Permit(
The(pe
rcen
tage(of(cond
ition
s(un
der(the(respectiv
e(EA
(and
(EM
P(pe
rmits(b
eing
(adh
ered
(to(by(compa
nies(in
(the(oil(and
(gas(sector(
100%
(com
pliance(
100%
(com
pliance(
100%
(com
pliance(
100%
(com
pliance(
13.
Cons
truc
tion(
Indu
stry(
Dev
elopm
ent(
1. Co
nstructio
n(Indu
stry(
law(
enacted(an
d(im
plem
ented(
Legal(fram
ework(
which(will(
regu
late(the
(develop
men
t(of(
the(Indu
stry(ena
cted
(into(law,(
includ
ing(
the(
setting(
up(of(
apex(bod
y(for(the
(indu
stry.((((
Draft(Con
struction(
Indu
stry(bill(in(
prep
aration.(The
(bill(has(
bene
fited
(from
(com
men
ts(
from
(the(AXG’s(
Dep
artm
ent(
NA(
Decem
ber(2
019(
NA(
14.
Dra
inag
e(an
d(Flood(Cont
rol(
1. N
umbe
r(of(drainage(master(plan
s(prep
ared
:(.
Region
al(
. Districts(
A(compreh
ensive(plan(which(
outline
s(system
ic(a
ctions(to(
create(
adeq
uate(
artificial(
waterways(
to(carry(
storm(
water(discha
rge(
in(major(
citie
s(an
d(towns((
Only(Ac
cra,(Tem
a,(Tam
ale,(
Kumasi(and
(Ho(so(fa
r(has(
draina
ge(m
aster(p
lans(
( ( NA(
NA(
( ( 1(
( ( NA(
2. Kilometres(of(drains(constructed:(
. Prim
ary(
. Second
ary(((
Kilometres(
of(
drains(
rechan
neled,(up
grad
ed(an
d(maintaine
d(
(0.2(
0km(
0.2km(
( 3( 0km(
3km(
(20
(km(
7km(
13km
(
(11
.3(
4.37
km(
6.73
km(
3. N
umbe
r(of(flood
(warning
(statio
ns(
constructed/(
reha
bilitated
(
Coun
t(of(na
tiona
l(ad
vanced
(flo
od(
warning
(system
(installed(for(forecastin
g(flo
ods(
2(0(
NA(
NA(
15.
Infras
truc
ture
(Maint
enan
ce(
1. N
ationa
l(pu
blic(
works(
mainten
ance(
fram
ework(
institu
ted(an
d(op
erationa
lized
(
A(routine(
mainten
ance(
arrang
emen
t(for(
all(
public(
infrastructure(
in(
health,(
0(NA(
1(NA(

77
76"
"
Focu
s(Are
as(
Indica
tors(
Indica
tor(Definition(
Bas
eline(20
17(
2018
(20
19(Tar
get(
Status
(in(20
19(
education,(road
s,(railw
ays,(
ports,(etc,(introd
uced
(an
d(en
forced
(by(go
vernmen
t(with
(ap
prop
riate(san
ctions(
16.
Land
(Adm
inistration(
and(
Man
agem
ent(
1. Num
ber(o
f(days(to(re
gister(land
s:(
. Land
(title
(certificate(
(.
Land
(Registry((Dee
ds)(
Average(
numbe
r(of(da
ys(it(
takes(to(get(title(to(la
nd(in
(a(
year(
( (5(mon
ths(
(7(mon
ths(
( (15
0(working
(days*(
(30
(working
(days(
( (12
0days(
(20
days(
( (15
0days(
(27
days(
2. Num
ber(
of(
distric
t(Land
(Co
mmission
(offices(establishe
d((
Num
ber(
of(distric
t(offices(
establishe
d(5(
( 1(2(
0(
17.
Hum
an(
Settlemen
ts(
and(Hous
ing(
(
1. P
ercentage(
implem
entatio
n(of(
Nationa
l(Spatial(
Develop
men
t(Fram
ework(
The(
numbe
r(of(
activ
ities(
outline
d(un
der(the(
Nationa
l(Spatial(
Develop
men
t(Fram
ework(
implem
ented,(
expressed(as(a(percentage(
Nationa
l(Spa
tial(
Develop
men
t(Framew
ork(
finalised
(and
(app
roved(by(
Cabine
t(for(
implem
entatio
n(
NA(
NA(
NA(
2. Pe
rcen
tage(
of(
MMDAs(
with
(distric
ts(
Spatial(
Develop
men
t(Fram
eworks(and
(structural(Plans:(
. (Spa
tial(D
evelop
men
t(Fram
eworks(
. Structural(Plans(
(. Local(Plans(
The(nu
mbe
r(of(M
MDAs(w
ho(
have(
prep
ared
(an
d(are(
implem
entin
g(distric
t(Spatial(
Develop
men
t(Fram
eworks(
(SDF)(Structural(Plans((S
P)(and
(Local(P
lans((LP)(as(a(sha
re(of(
total(MMDAs,(expressed(
as(
percen
tage(
( ( ( (6(District(Level(SDF’s(
(8(ne
w(Stricture(Plans(
(
( ( ( (2(ne
w(M
MDA(SD
Fs(
completed
(2(Structure(Plan
s(completed
((Tam
ale(an
d(Bu
ipe)(
( ( ( (19
.23%
((50(SD
F)(
(19
.23%
((50(SP)(
( ( ( (3.08
%((8
(SDF)(
(3.85
%((1
0(SP)(
3. Num
ber(
of(
housing(
units(
provided
(nationa
lly((tho
usan
ds)(
. Urban"households"
. Ru
ral"households(
The(nu
mbe
r(of(hou
sing
(units(
constructed(by(the
(pub
lic(and
(private(sector(in
(the
(rural(and
(urba
n(areas(
(1,91
8(1,91
8(0(
(1,91
8(1,91
8(0(
(3,08
0(3,08
0(0(
(1,34
8(1,34
8(0(
4. Ac
cess(to(affordab
le(hou
sing
(unit(
for(middle(to(lo
w(in
come(grou
ps(
(%).(
Num
ber(
of(middle(
to(low(
income(
popu
latio
n(with
(access(to
(affo
rdab
le(hou
sing
(
NA(
NA(
NA(
NA(
18.
Rur
al(
Dev
elopm
ent(
1. Inciden
ce(of(p
overty(in(ru
ral(areas(
(%)(
Prop
ortio
n(of(pe
ople(living(
below(th
e(up
per(p
overty(line
(NA(
NA(
NA(
NA(
2. N
umbe
r(of(rural(
subXprojects(
completed
(an
d(jobs(
created(
unde
r(the(rural(d
evelop
men
t(an
d(man
agem
ent(p
rogram
me:(
. SubXprojects(
. Jobs(created
(
Coun
t(of(rural(subXprojects(
completed
(and
(job
s(created(
unde
r(the(rural(de
velopm
ent(
and(man
agem
ent(p
rogram
me(
( ( ( ( (24
7(32
,091
(
( ( ( ( (94
2(16
7,63
6(
NA(
NA(
3. P
ropo
rtion(
of(rural(
popu
latio
n(with
(access(to(basic(services((%
):(.
Education(
. Health
(
Prop
ortio
n(of(ru
ral(p
opulation(
with
(access(to(ba
sic(
social(
services(such(as(ed
ucation(
and(he
alth(
( ( ( NA(
( ( ( NA(
NA(
NA(

78
77"
"
Focu
s(Are
as(
Indica
tors(
Indica
tor(Definition(
Bas
eline(20
17(
2018
(20
19(Tar
get(
Status
(in(20
19(
. Water(
NA(
NA(
NA(
NA(
19.
Urb
an(
Dev
elopm
ent(
1. Prop
ortio
n(of(u
rban
(pop
ulation(
(%)((
The(nu
mbe
r(of(peo
ple(living(
in(urban
(areas,(e
xpressed
(as(a(
percen
tage(
of(
total(
popu
latio
n(
55.41%
(57
.20%
(NA(
NA(
2. Th
e(nu
mbe
r(of(cities(develop
ed(
into(City
(region
s(Th
e(nu
mbe
r(of(cities(designe
d(un
der(
the(
NSD
F(to(
be(
develope
d(into(City
(Regions(
NA(
NA(
NA(
NA(
20.
Zong
os(an
d(Inne
r(Cities(
Dev
elopm
ent(
1. Prop
ortio
n(of(pe
ople(living(
in(
slum
(areas((
Total(p
opulation(living(in(slum(
areas(
as(characterised
(by(
overcrow
ded(
housing(
and(
lack(
of(
access(
to(
infrastructure(
(water,(
electricity
(sup
ply,(drains)(as(a(
percen
tage(
of(
the(
total(
popu
latio
n(in(selected(
citie
s(an
d(of(nationa
l(pop
ulation(
39.28%
((5.5million)(
39.21%
((5.97m
illion)(
38.63%
((5.91m
illion)(
38.9%((5
.95m
illion)(
2. Num
ber(of(p
eople(im
pacted
(by(
slum
s/(
Zong
o(up
grad
ing(
interven
tions(
Num
ber(
of(pe
ople(directly(
impa
cted
(throug
h(slum
s/zong
o(up
grad
ing(
interven
tions(
unde
r(the(
Zong
o(Develop
men
t(Fun
d:(
· Ed
ucationa
l(projects(
· Water(Projects(
· Sanitatio
n(projects(
· Drainage(projects(
· Ac
cess(ro
ads(
· Street(Lighting(
· Re
creatio
nal(facilitie
s(·
Local(
econ
omic(
developm
ent(
Parliam
ent(p
assed(the(
Law(estab
lishing
(the(
Zong
o(Develop
men
t(Fun
d((
10,260
(( ( ( (
240(
2,70
0(0(
4,32
0(1,60
0(0(
1,20
0(20
0(
116,65
0(( ( ( (
12,200
(15
,000
(1,25
0(8,00
0(16
,000
(60
,800
(2,40
0(1,00
0(
48,662
(( ( ( (
6,10
0(11
,700
(9,80
0(4,80
0(8,00
0(5,77
6(1,50
0(98
6(
( ((
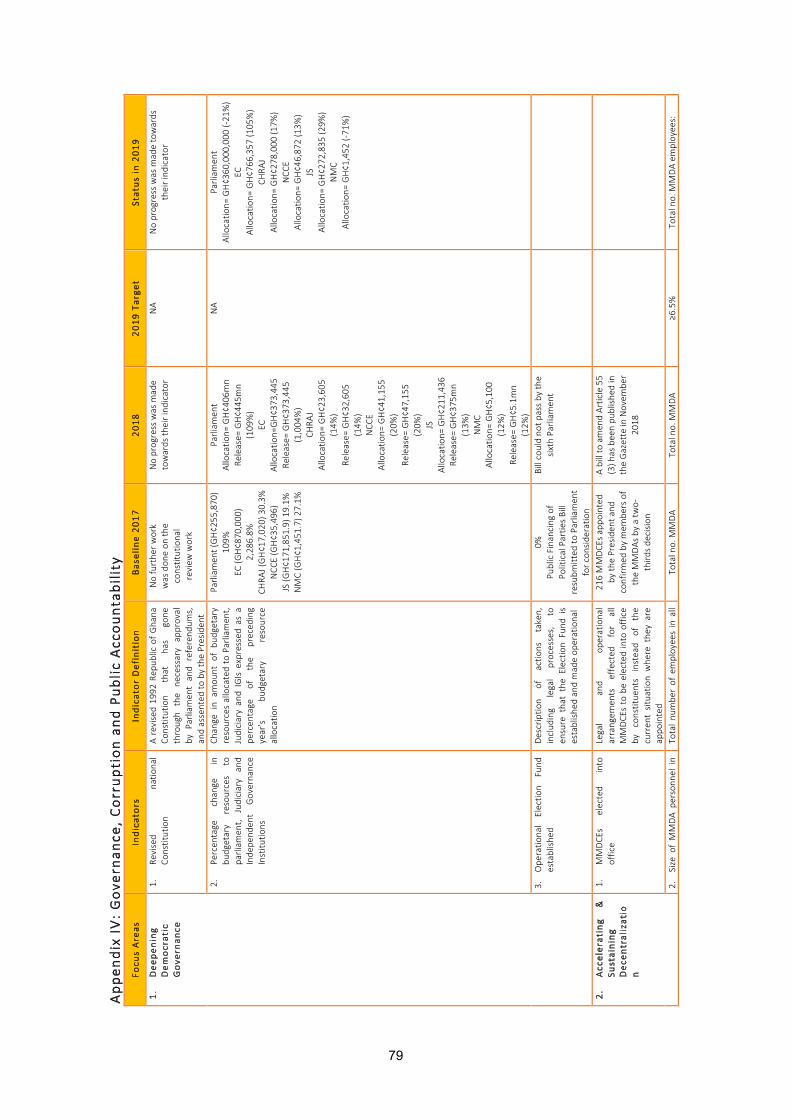
79
78"
"App
endix(IV:(Gov
erna
nce,(Cor
rupt
ion(an
d(Pu
blic(Acc
ount
ability(
Focu
s(Are
as(
Indica
tors(
Indica
tor(Definition(
Bas
eline(20
17(
2018
(20
19(Tar
get(
Status
(in(20
19(
1.
Dee
pening
(Dem
ocratic(
Gove
rnan
ce((
1.
Revised(
natio
nal(
Constitution(
A(revised(19
92(Rep
ublic(of(G
hana
(Co
nstitution(
that(
has(
gone
(throug
h(the(
necessary(
approval(
by(P
arliamen
t(an
d(referend
ums,(
and(assented
(to(by(the(Presiden
t(
No(furthe
r(work(
was(don
e(on
(the(
constitutiona
l(review
(work(
No(prog
ress(was(m
ade(
towards(th
eir(ind
icator(
NA(
No(prog
ress(was(m
ade(towards(
their(ind
icator(
2.
Percen
tage(
chan
ge(
in(
budg
etary(
resources(
to(
parliam
ent,(
Judiciary(
and(
Inde
pend
ent(
Governa
nce(
Institu
tions(
Chan
ge(in(
amou
nt(o
f(bu
dgetary(
resources(allocated(to(Parliamen
t,(Judiciary(an
d(IGIs(expressed
(as(a(
percen
tage(
of(
the(
preced
ing(
year’s(
budg
etary(
resource(
allocatio
n(
Parliam
ent((GH¢2
55,870
)(10
9%(
EC((G
H¢8
70,000
)(2,28
6.8%
(CH
RAJ((GH¢1
7,02
0)(30.3%
(NCC
E((GH¢3
5,49
6)(
JS((G
H¢1
71,851
.9)(1
9.1%
(NMC((GH¢1
,451
.7)(2
7.1%
(
Parliam
ent(
Allocatio
n=(GH¢4
06mn(
Release=
(GH¢4
45mn(
(109
%)(
EC(
Allocatio
n=GH¢3
73,445
(Re
lease=
(GH¢3
73,445
((1,004
%)(
CHRA
J(Allocatio
n=(GH¢2
3,60
5((14%
)(Re
lease=
(GH¢3
2,60
5((14%
)(NCC
E(Allocatio
n=(GH¢4
1,15
5((20%
)(Re
lease=
(GH¢4
7,15
5((20%
)(JS(
Allocatio
n=(GH¢2
11,436
(Re
lease=
(GH¢3
75mn(
(13%
)(NMC(
Allocatio
n=(GH¢5
,100
((12%
)(Re
lease=
(GH¢5
.1mn(
(12%
)(
NA(
Parliam
ent(
Allocatio
n=(GH¢3
60,000
,000
((X21
%)(
EC(
Allocatio
n=(GH¢7
66,357
((105
%)(
CHRA
J(Allocatio
n=(GH¢2
78,000
((17%
)(NCC
E(Allocatio
n=(GH¢4
6,87
2((13%
)(JS(
Allocatio
n=(GH¢2
72,835
((29%
)(NMC(
Allocatio
n=(GH¢1
,452
((X71
%)(
(
3. Ope
ratio
nal(
Electio
n(Fu
nd(
establishe
d(Descriptio
n(of(
actio
ns(
taken,(
includ
ing(
legal(
processes,(
to(
ensure(tha
t(the(Electio
n(Fu
nd(is(
establishe
d(an
d(mad
e(op
erationa
l(
0%(
Public(Finan
cing
(of(
Political(Partie
s(Bill(
resubm
itted
(to(Parliamen
t(for(c
onside
ratio
n(
Bill(could(no
t(pass(by(th
e(sixth(Pa
rliam
ent(
((
2.
Acc
eler
ating(
&(
Sustaining
(Dec
entralizatio
n(
1.
MMDCE
s(elected(
into(
office(
Legal(
and(
operationa
l(arrang
emen
ts(effected
(for(
all(
MMDCE
s(to(be(elected(into(office(
by(constitue
nts(
instead(
of(the(
curren
t(situation(whe
re(the
y(are(
appo
inted(
216(MMDCE
s(ap
pointed(
by(th
e(Presiden
t(and
(confirm
ed(by(mem
bers(of(
the(MMDAs(by(a(tw
oXthird
s(de
cision
(
A(bill(to(amen
d(Article(55(
(3)(h
as(bee
n(pu
blishe
d(in(
the(Gazette(in(Novem
ber(
2018
(
((
2. Size(of(MMDA(
person
nel(in(
Total(n
umbe
r(of(employee
s(in(all(
Total(no.(M
MDA(
Total(no.(M
MDA(
≥6.5%(
Total(no.(M
MDA(em
ployee
s:(

80
79"
"
Focu
s(Are
as(
Indica
tors(
Indica
tor(Definition(
Bas
eline(20
17(
2018
(20
19(Tar
get(
Status
(in(20
19(
relatio
n(to(
central(
governmen
t(MMDAs,(
expressed(
as(
a(pe
rcen
tage(of(total(nu
mbe
r(of(
person
nel(on(go
vernmen
t(payroll(
employee
s:(39,38
2((GoG
X30
,070
(&(IG
F(X(9
,312
),(To
tal(no.(personn
el(on(
Gov’t(pa
yroll:(52
2,32
1(MMDAs(sha
re:(5
.76%
(
employee
s:(GOG(^(IG
F(X(
39,253
(To
tal(no.(personn
el(on(
Govt(p
ayroll:(684
,352
(MMDA(share:(5.73%
(
GOG((2
7,55
4)(
IGF(X(9
,454
(To
tal(no.(personn
el(on(Govt(p
ayroll:(
562,23
6(MMDA(share:(4.9%((G
oG(only)(
6.6%
((GoG
(+(IG
F)(
3. Pe
rcen
tage(
of(
MMDA(
med
iumXterm(de
velopm
ent(
plan
s(certified
(
Num
ber(of(M
MDA(
med
iumXterm(
developm
ent(
plan
s(certified
(by(
NDPC
(as(
a(ratio
(of(
those(
uncertified
(
NA(
((
(
4. Share(
of(
MMDA(
total(
revenu
e(in(relation(
to(total(
natio
nal(reven
ue(
Total(MMDA(
revenu
e((in
clud
ing(
IGF,(D
ACF,(G
oG(transfers,(HIPC(
tran
sfers(
and(
dono
r(fund
s)(
expressed(as(a(percentage(of(to
tal(
natio
nal(reven
ue(
Total(M
MDA(Re
venu
e:(
GH₵(1,37
7.96
mn(
Total(nationa
l(revenu
e/receipt:(
GH₵(43
,097
.00m
n(%(Sha
re:(3
.20%
(
Total(M
MDA(Re
venu
e:(
GH¢1
,242
mn(
Total(nationa
l(reven
ue(
exclud
ing(gran
t:(GH¢4
9,05
9mn(
%Share:(2.53%
(
%Share:(≥3.5%
(To
tal(M
MDA(Re
venu
e:(
GH¢1
,315
,717
mn(
Total(nationa
l(reven
ue(excluding
(gran
t:(GH¢5
4,56
5,04
3mn(
%Share:(2.59%
(
5. Share(of(cen
tral(governm
ent(
tran
sfers(to(M
MDAs(in
(total(
natio
nal(bud
get(
Total(am
ount(of(DAC
F,(H
IPC(an
d(GoG
(fund
ing(
to(
MMDAs,(
expressed(
as(a(
percen
tage(of(
annu
al(na
tiona
l(total(
revenu
e,(
exclud
ing(gran
ts(
Total(C
entral(Govt(
tran
sfers:(GH₵8
69.36(
Total(nationa
l(reven
ue,(
exclud
ing(gran
t:(GH₵(41
,565
.00m
n(%Share:(2.09%
(%Share(DAC
F(in(to
tal(tax(
revenu
e:(5%(
Total(C
entral(Govt(
tran
sfers:(GH₵(
1,08
5,99
6,31
6.23
.(To
tal(nationa
l(reven
ue,(
exclud
ing(gran
t:(GH₵(48
,297
,908
,686
%(
Share:(2.24%
(
≥5%(
Total(C
entral(Govt(transfers:(G
H₵(
942,27
6mn(
Total(nationa
l(reven
ue,(excluding
(gran
t:(GH₵(53
,731
,877
mn(
Share:(1.89%
(
6. Num
ber(
of(
additio
nal(
region
s(created(
Num
ber(
of(
additio
nal(
administrative(region
s(created(to(
enha
nce(
coordina
tion(
and(
improve(their(a
dministration(
10(Regiona
l(Ad
ministrations((A
(Co
nstitutiona
l(Instrum
ent(
105(–((CI(105
)(–(was(
publishe
d(an
d(gazetted
(to(
enab
le(th
e(Presiden
t(to(
appo
int(a
(Com
mission
(of(
Inqu
iry(into(th
e(Creatio
n(of(New
(Regions(and
(a(
nine
Xmem
ber(C
ommission
(of(In
quiry
(inau
gurated)(
6(ad
ditio
nal(regions(
created(
((
3.
Public(
Acc
oun
tability(
1.
Righ
t(to(Inform
ation(
Bill(
(RTI)(
passed
(an
d(im
plem
ented(
Pass(into(
law(R
TI(B
ill(w
hich(w
ill(
give(sub
stan
ce(to(Article(21((1)((f)(
of(the(
Constitution(
and(
ensure(
that(all(pe
rson
s(shall(ha
ve(the(
right(to(inform
ation(
subject(
to(
such(qua
lifications(and
(laws(as(are(
necessary(in(a(dem
ocratic(society(
MOI(sup
ported
(MoJAG
D(
to(draft(RTI(Bill(and
(cabine
t(Mem
o(which(was(
subm
itted
(to(cab
inet(
RTI(B
ill(before(pa
rliam
ent(
((
2. Pe
rcen
tage(
of(
Public(
Accoun
ts(Co
mmittee
((PAC
)(recommen
datio
ns(
implem
ented(
Num
ber(of(PAC
(recom
men
datio
ns(
on(the
(ann
ual(Au
ditorXGen
eral’s(
Repo
rt(implem
ented(
by(relevan
t(agen
cies,(expressed
(as(pe
rcen
tage(
NA(
53(re
commen
datio
ns(
NA(
139(recommen
datio
ns(

81
80"
"
Focu
s(Are
as(
Indica
tors(
Indica
tor(Definition(
Bas
eline(20
17(
2018
(20
19(Tar
get(
Status
(in(20
19(
of(
total(
numbe
r(of(
recommen
datio
ns(
3. Laun
ch(
digitized
(M&E(
system
(to(mon
itor(qu
ality
(of(
service(
delivery(
by(
governmen
t(
An(ICT
Xbased
(nationa
l(mon
itorin
g(an
d(evalua
tion(system
(develop
ed(
and(op
erated
(by(NDPC
(to(m
onito
r(the(de
livery(of(pub
lic(services(
Concep
t(note(de
velope
d(an
d(ap
proved
(by(
stakeh
olde
rs(and
(fund
ing(
secured(
Concep
t(note(de
velope
d(an
d(ap
proved
(by(
stakeh
olde
rs.(C
onsulta
ncy(
firm(procured(to(design(
and(establish(the(system
(
Develop
(Fun
ctiona
l(ICT
XBa
sed(M&E(System
(Outpu
t(two:(Detailed(assessmen
t(of(
the(M&E(System
(Outpu
t(three
:(Designe
d(ICTXBa
sed(
M&E(System
(
4. Pe
rcen
tage(
of(
popu
latio
n(repo
rting(im
proved
(level(o
f(tran
sparen
cy(
and(
public(
accoun
tability(
Citizen
s(repo
rting(
improved
(tran
sparen
cy(
and(
public(
accoun
tability(
expressed(
as(a(
percen
tage(of(total(pop
ulation(
NA(
0%(
((
4.
Public(
Institut
iona
l(Reform
(&(
Tran
sform
ation(
1.
Integrated
(pu
blic(serviceX
wide(
Hum
an(
Resource(
Man
agem
ent(
Inform
ation(
System
((HRM
IS)(
establishe
d(
A(Hum
an(Resou
rce(Man
agem
ent(
Inform
ation(
System
(which(will(
allow(M
DAs(to(
upda
te(the
ir(HR(
data((processing
(of(recruitm
ent,(
prom
otions,(
resign
ations(
and(
retirem
ent,(
etc.)(establishe
d(an
d(mad
e(functio
nal(
20(M
DAs,(com
prising(7(
Commission
s,(5(Services(
and(8(ministries(wen
t(live(
on(th
e(HRM
IS.(This(
constitutes(19%
((113
,938
)(of(th
e(en
tire(workforce(of(
the(pu
blic(service(
40(M
DAs(
9(MDAs(to
(be(captured
(into(th
e(HRM
IS(
4(MDA(captured
(into(th
e(HRM
IS(
2. Prop
ortio
n(of(pub
lic(service(
institu
tions(
with
(client(
service(
charters(e
stab
lishe
d((%
)(
Num
ber(
of(
public(
service(
institu
tions(with
(client(service(
charters(estab
lishe
d,(expressed
(as(
percen
tage(o
f(all(pu
blic(service(
institu
tions(
NA(
Fund
ing(secured(un
der(
the(PSR(for(R
esults(
Project(to(supp
ort(this(in(
2019
(
((
3. Office(
of(
Public(
Ethics(
establishe
d(an
d(functio
ning
(Governm
ent(to(estab
lish(Office(of(
Public(Ethics(as(pa
rt(of(pu
blic(
sector(re
form
(initiatives(
20(ethics(officers(traine
d(0%
((
(
5.
Public(
Policy
(Acc
oun
tability(
1.
Public(
policy(
guidelines(
and(
alman
ac(de
velope
d(an
d(im
plem
ented(
NDPC
(de
velops(gu
idelines(for(
form
ulation(
of(
policy.(
Policy(
alman
ac(e
stab
lishe
d(to(serve(a
s(da
taba
se(of(a
ll(na
tiona
l(policies(
NA(
Draft(policy(gu
idelines(
and(alman
ac(web
site(
develope
d(
Laun
ch(Policy(Guide
lines(
and(Po
licy(Alman
ac(W
eb(
Portal(
Policy(Guide
lines(Finalised
(
2. Integrated
(nationa
l(statistical(
system
(estab
lishe
d(Gha
na(Statistical(Service(
(GSS)(
establishe
s(an
(integrated
(nationa
l(statistical(system(
Fund
ing(secured(for(the
(im
plem
entatio
n(of(th
e(Nationa
l(Statistical(
Develop
men
t(Strategy(
(NSD
S)(
10(M
DAs(im
plem
ented(
the(Gha
na(Statistics(
Develop
men
t(project.(The
(Gha
na(Statistics(
Develop
men
t(Project(was(
fully(im
plem
ented(from
(Ap
ril(201
4(to(Decem
ber(
2018
(
((
3. Ke
y(na
tiona
l(surveys(
cond
ucted(
Gha
na(Statistical(Service(
(GSS)(
cond
ucts(key(
natio
nal(
surveys(
includ
ing(Gha
na(Living(Stan
dards(
Survey(
Roun
d(Seven(
(GLSS),(
Popu
latio
n(an
d(Hou
sing
(Cen
sus,(
Agric
ultural(
Census,(
Gha
na(
Dem
ograph
ic(and
(Health
(Survey,(
YearXlo
ng(data(collection(
for(the
(Gha
na(Living(
Stan
dards(Survey(Rou
nd(
Seven((GLSS(7)(was(
completed
(
((
(

82
81"
"
Focu
s(Are
as(
Indica
tors(
Indica
tor(Definition(
Bas
eline(20
17(
2018
(20
19(Tar
get(
Status
(in(20
19(
etc.(
4. Econ
omic(an
d(forecasting(
mod
eling(
develope
d(for(
Gha
na(
NDPC
(develop
s(an
(econo
mic(and
(forecasting(mod
el(to(
serve(
as(a(
basis(
for(
natio
nal(de
velopm
ent(
plan
ning
(
Draft(econo
mic(and
(forecasting(mod
el(
develope
d(an
d(go
ing(
throug
h(fin
al(validation(
and(review
(of(e
quation(
((
(
6.
Hum
an(Se
curity(
and(
Public(
Safety(
1.
PoliceXcitizen
(ratio
(Ra
tio(o
f(total(nu
mbe
r(of(p
olice(
officers(to(to
tal(pop
ulation(
Total(no.(of(p
olice:(33,00
2(Ra
tio:(1
:877
(To
tal(no.(of(P
olice(=(
32,345
(1:91
6(
1:80
0(1:86
4(
2. Pe
rcen
tage(
chan
ge(
in(
repo
rted
(cases(
of(overall(
crim
e(levels(
per(
1,00
0(po
pulatio
n(
Chan
ge(in(nu
mbe
r(of(repo
rted
(cases(of(m
ajor(c
rimes(including
(rape
,(arm
ed(rob
bery(and
(murde
r,(expressed(as(a(percentage(of(to
tal(
numbe
r(of(repo
rted
(cases(
of(
major(crim
es(in(the(
preced
ing(
year(
Cases(repo
rted
(205
,936
(%(chg
.:(1.9%
((decrease)(
Cases(repo
rted
(=(213
,436
(%chan
ge(=(5.7%(
*Cases(re
ported
(=16
2,90
1(*%
chan
ge(=(5.01%
(de
crease(
Cases(repo
rted
(=(224
,221
(%chan
ge(=(5.05%
(
3. Pe
rcen
tage(
chan
ge(
in(
repo
rted
(commun
al(
and(
chieftaincy(conflicts((%
)(
Chan
ge(in
(the(nu
mbe
r(of(rep
orted(
commun
al(
and(
chieftaincy(
conflicts(expressed
(in(percentage(
NA( (
28%(
50%(re
duction(
74((O
ver(2
00%(increase)(
4. Num
ber(of(rep
orted(cases(of(
drug
(trafficking
(an
d(drug
Xrelated(crim
e(
Num
ber(of(rep
orted(cases(of(drug(
trafficking
(and
(drugXrelated(crim
e(NAC
OB(
Cases(repo
rted
:(15(
Cases(disposed
(of:(1(
%(chg
.=(X4
00%(
Police(=(64
4(
NAC
OB(
Cases(repo
rted
:(16(
(
NA(
NAC
OB(
Cases(repo
rted
:(30(
Police(=(62
7(
5. Fire(officerXcitizen
(ratio
(Ra
tio(of(total(nu
mbe
r(of(fire(
officers(to(to
tal(pop
ulation(
1:80
0(1.36
95(
*1:500
(1:34
69(
6. Re
corded
(incide
nce(
of(fire(
outbreaks(
Num
ber(of(rep
orted(incide
nts(of(
bush(fires(an
d(do
mestic(fire(
disasters(
5,48
7(5,53
1(*3
486((37%
(redu
ction)(
5,30
8(
7. Re
corded
(cases(of(foreign
ers(
arrested
(with
out(
reside
nce/work(pe
rmit(
Total(nu
mbe
r(of(illegal(foreign(
immigrants(
processed(
and(
arraigne
d(be
fore(cou
rt(
312(
%chan
ge.(=16
0%(
123((60.58
%)(
*35%
(redu
ction(in(
irregular(im
migrants(
196((X59
.35%
)(
8. Overcrowding
(rate(in(prison
s(Ch
ange(
in(
prison
(po
pulatio
n(expressed(
as(a(
ratio
(of(total(
holding(capa
city(
39.07%
(52
.54%
(*<
18%(
50.81%
(
9. Net(recruitm
ent(
rate(into(
the(Gha
na(Arm
ed(Forces(
Rate(of(recruitm
ent(
into(the(
Gha
na(A
rmed
(Forces,(G
hana
(Air(
Force,(Gha
na(Navy,(m
inus(th
e(rate(
of(loss(of(pe
rson
nel(
throug
h(retirem
ent,(de
ath,(etc.(
Net(re
cruitm
ent(rate(=(
11.5%(
Rate(of(recruitm
ent(=
(12
.1%(
Attrition
(rate(=(0.57%
(
Net(re
cruitm
ent(rate(=(
10.12%
(Ra
te(of(recruitm
ent(=
(10
.92%
(Attrition
(rate(=(0.8%(
Net(re
cruitm
ent(rate(=(
6.67
%(
Rate(of(recruitm
ent(=
(8.50
%(
Attrition
(rate(=(1.83%
(
Net(re
cruitm
ent(rate(=(4.73
%(
Rate(of(recruitm
ent(=
(6.70%
(Attrition
(rate(=(1.97%
(
10. Pe
rcen
tage(
of(
person
nel(
deployed
(in(pe
acekee
ping
(op
erations(
Armed
(Forces(pe
rson
nel(involved(
in(
peacekee
ping
(op
erations,(
expressed(as(a(percentage(of(the
(total(n
umbe
r(of(personn
el(in
(the
(Gha
na(Arm
ed(Forces(
16.40%
(16
.40%
(16
.40%
(16
.40%
(

83
82"
"
Focu
s(Are
as(
Indica
tors(
Indica
tor(Definition(
Bas
eline(20
17(
2018
(20
19(Tar
get(
Status
(in(20
19(
7.
Corrup
tion(
and(
Econo
mic(Crime(
1.
Special(P
rosecutor’s(O
ffice(
establishe
d(an
d(functio
ning
(
Establishm
ent(of(a(spe
cial(o
ffice(
with
(the
(autho
rity(an
d(control(to(
effectively(
investigate(
and(
prosecute(
some(
cases(
of(
corrup
tion(
Complete(the(legal(
processes(for(e
stab
lishing
(the(Office(and
(for(
appo
intin
g(the(Special(
Prosecutor(
The(special(prosecutor(
and(the(Dep
uty(Special(
Prosecutor((D
SP)(w
ere(
appo
inted(in(accorda
nce(
with
(the(Special(
Prosecutor(Act,201
7((Act(
959)(
Office(of(the
(Spe
cial(
Prosecutor(Estab
lishe
d(Office(of(the
(Spe
cial(Prosecutor(
establishe
d(an
d(functio
ning
(
2. Pe
rcen
t(of(corruption(cases(
for(
which(prosecution(
has(
been
(initiated
(by:((
- Special(Prosecutor((
- AttorneyXGen
eral’s(Office(
Corrup
tion(
cases(
for(
which(
prosecutions(h
ave(be
en(initia
ted(
as(a(percent(of(total(nu
mbe
r(of(
corrup
tion(cases(received
(
( ( ( ( NA(
NA(
( ( ( ( 0(35
%(
( ( ( ( NA(
15.4%(
( ( ( ( NA(
35%(
3. Num
ber(of(corruption(cases(
recorded
(and
(investigated
(by(
state(
antiXcorrup
tion(
institu
tions(including
(CHRA
J(an
d(EO
CO(
Num
ber(
of(
corrup
tionXrelated(
cases(
received
(by(CH
RAJ(
and(
EOCO
(
CHRA
J(No.(of(corruption(cases(
received
(=(59(
No.(of(corruption(cases(
investigated
(=(31(
EOCO
(Num
ber(o
f(cases(re
ported
(=2
18(
Num
ber(o
f(cases(
investigated
(=(218
(Num
ber(o
f(cases(
prosecuted
(=13
(Num
ber(o
f(con
victions(=(2(
CHRA
J(No.(of(corruption(cases(
received
(=(487
(EO
CO(
No.(of(cases(investigated
(=(44
6(cases(
No.(of(cases(prosecuted(=(
34(
No.(of(con
victions(
secured(=(3(
CHRA
J(NA(
EOCO
(No(of(cases(investigated
(=(
400(
No(of(cases(prosecuted(=(
10(cases(
No(of(con
victions(=(10(
CHRA
J(NA(
EOCO
(No(of(cases(investigated
(=(337
(No(of(cases(prosecuted(=(42
(cases(
No(of(con
victions(=(2(
4. Co
rrup
tion(Pe
rcep
tion(Inde
x(Co
mpo
site(inde
x(of(corrup
tionX
related(
data(which(focuses(
on(
corrup
tion(
in(the(
public(sector(
includ
ing(
the(
abuse(
of(pu
blic(
office(for(private(gain((i.e.(bribes(
taken(by(pub
lic(officials(in(pub
lic(
procurem
ent(a
nd(re
cruitm
ent)(
40(out(of(a
(clean
(score(of(
100(
41(out(of(1
00(
*50(ou
t(of(1
00(
41(out(of(1
00(
8.
Law(and
(Ord
er(
1. Num
ber(o
f(days(for(resolving
(dispute(
Average(nu
mbe
r(of(days(taken(for(
a(court(to(p
ass(judg
emen
t(on
(a(
dispute(
5(mon
ths(
5(mon
ths(
5(mon
ths(
5(mon
ths(
2. Num
ber(of(la
wyers(called(to(
the(Ba
r(To
tal(
numbe
r(of(ne
w(lawyers(
called(
to(the
(Bar(o
n(an
(ann
ual(
basis(
Called(to(th
e(Ba
r:(255
(Num
ber(o
f(law
yers(
appo
inted(to(th
e(Be
nch:(
28(
Called(to(th
e(Ba
r:(327
(Ca
lled(to(th
e(Ba
r:(600
(Ca
lled(to(th
e(Ba
r:(311
(Num
ber(o
f(law
yers(app
ointed
(to(
the(Be
nch:(22(
3. Pe
rcen
tage(
of(
courts(
compu
terised
(Num
ber(of(cou
rts(compu
terised
,(expressed(as(a(percentage(of(all(
courts(
0.96
(0.98
(0.98
(0.98
(
4. Num
ber(of(c
ases(recorde
d(an
d(settled(
throug
h(To
tal(nu
mbe
r(of(cases(recorde
d(an
d(settled(throug
h(AD
R(JS(
Recorded
(=(3,486
(JS(
Recorded
(=(7,657
(JS(
Recorded
(=(4,426
(JS(
Recorded
(=(6,209
(

84
83"
"
Focu
s(Are
as(
Indica
tors(
Indica
tor(Definition(
Bas
eline(20
17(
2018
(20
19(Tar
get(
Status
(in(20
19(
Alternative(
Dispu
te(
Resolutio
n((ADR)(
Settled=
1,57
1((45.0%
)(Legal(A
id(
Recorded
(=(8,570
(Settle
d(=(5,71
2((66.6%
)(Co
urt(c
onne
cted
(ADR(=(
NA(
Settled=
5,23
6((68.4%
)(Legal(A
id(
Recorded
(=(8,570
(Settle
d(=(5,23
6(61
.1%)(
Court(c
onne
cted
(ADR(=(
108(
Settled=
2,73
2(Legal(A
id(
Recorded
(=(9,841
(Settled(=(7,88
3((73%
)(Co
urt(c
onne
cted
(ADR(=(
129(
Settled=
3,04
1((49.0%
)(Legal(A
id(
Recorded
(=(7,971
(Settled(=(5,44
8((68.3%
)(Co
urt(c
onne
cted
(ADR(=(13
1(
5. Pe
rcen
tage(
of(
popu
latio
n(repo
rting(the(justice(system
(as(fair,(inde
pend
ent(
and(
profession
al(in(its(processes(
and(
procee
ding
s((Afrob
arom
eter(surveys)(
Citizen
s(ratin
g(the(justice(system
(as(
fair,(
inde
pend
ent(
and(
profession
al(in(
its(p
rocesses(and
(procee
ding
s(expressed(
by(%(of(
total(p
opulation(disaggregated(by(
gend
er,(
socioXecon
omic(
and(
disability(status(
0.5(
NA(
NA(
NA(
9.
Civil(
Societ
y(an
d(Civic(
Enga
gemen
t(
1. Level(o
f(CS
O(eng
agem
ent(in(
the(
policy(
form
ulation(
and(
developm
ent(p
rocess(
Inventory(
of(
natio
nal(
developm
ent(processes((such(
as(
natio
nal(
policy(
form
ulation,(
implem
entatio
n,(mon
itorin
g(an
d(evalua
tion;(
budg
etary(
process;(
natio
nal(
dialog
ues,(
etc.)(
that(
CSOs,(private(
sector,(trad
ition
al(
authorities,(religious(b
odies(an
d(think(tanks(are(involved
(in(during(
the(year,(as(w
ell(a
s(a(de
scrip
tion(
of(th
e(na
ture(of(involvemen
t(
CSOs,(th
ink(than
ks,(etc.(
were(involved
(in(th
e(prep
aration(of(ann
ual(
natio
nal(bud
get,(an
d(inception(an
d(followXup(
mee
tings(on(the(An
nual(
Prog
ress(Rep
ort((AP
R)(
((
(
2. Level(
of(
press(
free
dom(
(Press(Freed
om(In
dex(–(PFI)(
A(compo
site(inde
x(of(every(kind(of(
violation(
directly(
affecting(
journa
lists(
includ
ing(
murde
r,(im
prison
men
t,(ph
ysical(attacks(
and(
threats,(an
d(ne
ws(
med
ia(
censorship,(
confiscatio
n(of(
newspap
er(issue
s,(searche
s(an
d(ha
rassmen
t.(
26th(out(of(1
80(cou
ntrie
s(23
rd(out(180
(NA(
27th(out(of(1
80(
10.
Dev
elopm
ent(
Commun
ication
s(
1. Num
ber(of(Nationa
l(Po
licy(
Dialogu
es(
Num
ber(
of(
Mee
tXtheXPress(
sessions,(
budg
et(dissem
ination(
worksho
ps,(town(
hall(
mee
tings,(
etc.(organ
ised
(
No.(of(N
ationa
l(Policy(
Summit=
(NA(
Mee
tXtheXPress=(5(
Budg
et(dissemination(
prog
ramme=
(1(
Town(ha
ll(mee
tings=(10
0(Nationa
l(policy(fairs=(2(
Region
al(press(soirees=(
NA(
No.(of(N
ationa
l(Policy(
Summit=
(3(
Mee
tXtheXPress=(13(
Budg
et(dissemination(
prog
ramme=
(1(
Town(ha
ll(mee
tings=(15
2(Nationa
l(policy(fairs=(0(
Region
al(press(soirees=(
10(
No.(of(N
ationa
l(Policy(
Summit=
(4(
Mee
tXtheXPress=(30(
Budg
et(dissemination(
prog
ramme=
(1(
Town(ha
ll(mee
tings=(10
(Nationa
l(policy(fairs=(NA(
Region
al(press(soirees=(
10(
No.(of(N
ationa
l(Policy(Summit=
(1(
Mee
tXtheXPress=(25(
Budg
et(dissemination(prog
ramme=
(1(
Town(ha
ll(mee
tings=(6(
Nationa
l(policy(fairs=(NA(
Region
al(press(soirees=(6(
2. Num
ber(
of(
regu
lar(
interactions(
organised(
betw
een(
the(
Presiden
t(an
d(citizen
s(
Total(cou
nt(of(regular(in
teractions(
of(the
(Preside
nt(w
ith(citizens(per(
year(in
(the
(form(of(region
al(visits(
and(othe
r(fora(
The(Presiden
t(mad
e(8(
region
al(visits(to
(interact(
with
(trad
ition
al(
authorities(and
(citizens(on(
governmen
t(program
mes(
NA(
NA(
NA(

85
84"
"
Focu
s(Are
as(
Indica
tors(
Indica
tor(Definition(
Bas
eline(20
17(
2018
(20
19(Tar
get(
Status
(in(20
19(
and(to(laun
ch(flagship(
prog
rammes,(including
(Plan
ting(for(F
ood(an
d(Jobs;(free(SH
S;(1D1F;(
restoration(of(nurses’(
allowan
ce,(etc.(
3. Num
ber(
of(
presiden
tial(
mee
tXtheXpress(
sessions(
organised(
Total(coun
t(of(preside
ntial(mee
tXtheXpress(sessions(o
rgan
ised
(per(
year(
1(2(
2(1(
11.
Cultu
re(
for(
Nationa
l(Dev
elopm
ent(
1. Cu
lture(an
d(creativ
e(arts(
indu
stry(con
tribution(to(GDP(
Total(a
nnua
l(value
(of(cultu
re(and
(arts(activ
ities,(
expressed(
as(a(
percen
tage(of(G
DP(
NA((Creative(arts(sha
re(of(
NTEs(is(estim
ated
(at(
0.21
%(in(201
6)(
NA(
0.21
(NA(
2. Num
ber(of(traditio
nal(laws(
and(
lines(
of(
succession
(codifie
d(
Num
ber(of(traditio
nal(laws(an
d(cultu
re(catalog
ued((
11(draft(legislative(
instrumen
ts(in(line
s(of(
succession
(to(stools/(skins(
prep
ared
(
LIs(subm
itted
(to(Attorne
y(Gen
eral's(Dep
artm
ent(
19(
(8(new
)(19
(
3. Pe
rcen
tage(
of(
cases(
of(
chieftaincy(disputes(re
solved
(Num
ber(
of(chieftaincy(
disputes(
resolved
,(expressed(
as(
a(pe
rcen
tage(
of(
total(
disputes(
recorded
(
Total(num
ber(o
f(cases=38
3,(Num
ber(
disposed
(off=
28((7
.3%),(
Num
ber(P
ending
=355
(
At(least(5
%(of(a
ll(recorded
(cases(
10%(
Num
ber(o
f(Cases:(4
70(
Dispo
sed(off:(66
((14.04
%)(
Pend
ing:(404
(
((

86
85"
"App
endix(V:(Gha
na’s(role(in(Int
erna
tion
al(Affairs(
Focu
s(Are
as(
Indica
tors(
Indica
tor(Definition(
Bas
eline(20
17(
2018
(20
19(Tar
get(
Status
(in(20
19(
1.
Stre
ngth
en(
Gha
na’s(role(in(
inte
rnationa
l(affairs(
(
1.
Turnarou
nd(time(for(p
rocessing(
biom
etric
(passports(
Leng
th(o
f(tim
e(taken(
in(p
rocessing(
biom
etric
(pa
sspo
rts(
and(
consular(
services(
3(mon
ths(
for(n
ormal(
1(mon
th(
for(e
xpress(
(7(da
ys(
10(days(
2.
Num
ber(
of(
Gha
naians(
occupying(
positio
ns(
in(
internationa
l(organ
isations(
Gha
naians(elected(
or(ap
pointed(
to(
positio
ns(
in(
internationa
l(organisatio
ns(
6((
8(7(
3. Gha
na’s(
contrib
ution(
to(
peacekee
ping
(effo
rts(
Num
ber(of(security
(agency(pe
rson
nel(
deployed
(for(
glob
al(pe
acekee
ping
(efforts,(expressed
(as(a(pe
rcen
tage(of(
total(
numbe
r(of(security(
service(
person
nel(
NA(
(≤1
5percent(
≤16.4(pe
rcen
t(
4. Num
ber(
of(
investmen
t(prom
otion(activ
ities(held(
Coun
t(of(
trad
e(an
d(investmen
t(prom
otions(carried(
out(
by(Gha
na(
Mission
s(ab
road
(
22(
(30
(45
(
5. Re
presen
tatio
n(of(the(
Peop
le(
Amen
dmen
t(Law((RO
PAL)(2
006(
(Act(699
(fully(im
plem
ented(
ROPA
L(is(an(
Act(of(P
arliamen
t(that(
allows(Gha
naians(in(
the(diaspo
ra(to(
exercise(th
eir(franchise(during(gene
ral(
electio
ns(in(Gha
na.(
The(
Act(
was(
passed
(in(
2006
(bu
t(was(
not(
operationa
lised
.(
The(Law(has(not(
been
(im
plem
ented(
since(20
06(due
(to(
wha
t(Electoral(
Commission
((EC)(
describ
es(as(
operationa
l(challeng
es(
(Maintaine
d(Pa
ssed
(
6. Num
ber(of(G
hana
ians(registered(
with
(Gha
na(M
ission
s(ab
road
(Num
ber(of(Gha
naians(cap
tured(in(the
(da
taba
se(of(G
hana
(Mission
s(ab
road
(1,00
0,00
0((
1,30
0,00
0(3,58
1,54
5(
7. Num
ber(
of(Gha
naians(in(the(
diaspo
ra(
mob
ilised(
for(
developm
ental(interventions(
Coun
t(of(
Gha
naian(
profession
als(
mob
ilised(
to(sup
port(d
evelop
men
tal(
interven
tions(in(Gha
na(
20(
(30
(35
(
8. Pe
netration(
of(
Gha
naian(
prod
ucts(in(fo
reign(markets(
Num
ber(o
f(new
(markets(iden
tified(
NA(
(25
(30
(
( ( ( ( (

87
86"
"App
endix(VI:(Implem
entation
(of(th
e(MTN
DPF
(at(th
e(District(Le
vel(
( Resource"mobilization"by"districts"in"the"Upper"West"Region"
Upp
er(W
est(Reg
ion(
Actua
l(re
venu
e(in(201
8(Es
timated
(rev
enue
(in(
2019
(Actua
l(re
venu
e(in(
2019
(Var
ianc
e(in(201
9(%(Cove
red(in(201
9(
Sissala(East(
5,41
1,74
5.74
(14
,581
,981
.96(
5,68
2,02
1.93
(8,89
9,96
0.03
(39
.0(
Jirap
a(4,38
9,03
0.37
(2,69
4,73
9.80
(5,94
9,13
7.70
(X3,254
,397
.90(
220.8(
Nad
owli/Kaleo(
7,31
8,87
1.00
(6,67
8,50
5.35
(5,31
7,28
7.73
(1,36
1,21
7.62
(79
.6(
Wa(Mun
icipal(
7,81
6,28
4.04
(9,37
6,84
6.30
(9,52
9,03
5.04
(X152
,188
.74(
101.6(
Lawra(
2,94
3,94
5.41
(6,11
8,00
0.03
(4,94
2,15
9.15
(1,17
5,84
0.88
(80
.8(
Sissala(West(
4,09
7,61
3.63
(6,58
0,19
3.43
(5,91
4,32
8.46
(66
5,86
4.97
(89
.9(
Wa(East((
3,62
4,16
6.96
(4,44
7,56
3.77
(6,18
7,47
9.06
(X1,739
,915
.29(
139.1(
Wa(West(
4,47
3,85
4.65
(7,79
3,51
7.00
(6,56
1,52
3.47
(1,23
1,99
3.53
(84
.2(
Lambu
sie/Karni(
4,00
3,38
5.20
(8,64
8,53
1.87
(3,99
4,74
8.86
(4,65
3,78
3.01
(46
.2(
Nan
dom(
3,81
7,74
8.39
(6,56
9,26
2.52
(4,87
6,71
8.32
(1,69
2,54
4.20
(74
.2(
Daffia
mXBussieXIssa(
4,13
8,60
9.15
(5,31
9,18
4.99
(4,72
2,13
3.18
(59
7,05
1.81
(88
.8(
(TOTA
L((
48,788
,354
.68(
78,808
,327
.02(
63,676
,572
.90(
15,131
,754
.12(
80.8(
" Fiscal"resource"mobilization"by"districts"in"the"Upper"East"Region"
Upp
er(Eas
t(Reg
ion(
Actua
l(re
venu
e(in(201
8(Es
timated
(in(20
19(
reve
nue(
Actua
l(re
venu
e(in(
2019
(Var
ianc
e(in(201
9(%(Cove
red(in(201
9(
Kassen
a(X(N
ankana
(Mun
(6,55
6,29
3.57
(10
,270
,599
.96(
8,21
5,37
1.68
(2,05
5,22
8.28
(80
.0(
(Bolgatang
a(Mun
icipal((
7,13
7,56
0.84
(15
,331
,380
.36(
7,20
7,49
4.09
(8,12
3,88
6.27
(47
.0(
(Bon
go((
5,96
9,40
0.59
(10
,024
,937
.24(
6,34
5,33
9.73
(3,67
9,59
7.51
(63
.3(
(Builsa(North((
3,20
7,16
8.18
(7,70
9,77
7.28
(4,25
3,74
8.67
(3,45
6,02
8.61
(55
.2(
(Baw
ku(M
un((
6,59
4,98
8.68
(13
,854
,204
.36(
8,24
3,61
6.85
(5,61
0,58
7.51
(59
.5(
(Baw
ku(W
est((
4,39
7,11
3.19
(8,75
9,00
1.48
(4,67
9,23
1.39
(4,07
9,77
0.09
(53
.4(
(Garu(((
4,74
4,57
8.39
(17
,100
,722
.00(
5,05
2,53
6.22
(12
,048
,185
.78(
29.5(
(Talen
si(((
4,51
1,81
9.35
(7,44
1,17
2.64
(5,34
3,45
8.08
(2,09
7,71
4.56
(71
.8(
(Kassena
XNan
kana
(West((
4,36
7,29
8.36
(8,38
4,17
2.28
(5,29
5,30
5.06
(3,08
8,86
7.22
(63
.2(
(Bindu
ri((
4,10
2,07
9.10
(7,44
4,27
1.68
(4,76
4,00
8.91
(2,68
0,26
2.77
(64
.0(
(Pusiga((
3,61
7,26
2.18
(6,00
2,22
4.61
(5,17
2,42
6.52
(82
9,79
8.09
(86
.2(
(Builsa(South((
3,75
2,15
4.79
(10
,827
,132
.12(
4,96
1,44
1.93
(5,86
5,69
0.19
(45
.8(
(Nab
dam((
3,76
9,40
8.27
(5,89
8,00
1.44
(4,83
0,78
9.68
(1,06
7,21
1.76
(81
.9(
(Bolgatang
a(East((
952,43
6.97
(6,38
1,77
0.60
(3,29
8,21
4.03
(3,08
3,55
6.57
(51
.7(
(Tem
pane
((84
1,98
4.33
(16
,237
,333
.87(
4,04
2,87
3.27
(12
,194
,460
.60(
24.9(
(TOTA
L((
64,521
,546
.79(
151,66
6,70
1.92
(81
,705
,856
.11(
69,960
,845
.81(
53.9(
( "Fiscal"resource"mobilization"by"districts"in"the"Northern"Region"
Northe
rn(Reg
ion((
Actua
l(re
venu
e(in(201
8(Es
timated
(rev
enue
(in(
2019
(Actua
l(re
venu
e(in(
2019
(Var
ianc
e(in(201
9(%(Cove
red(in(201
9(
(Sab
oba(((
5,47
5,88
2.20
(10
,392
,139
.67(
4,71
3,95
6.69
(5,67
8,18
2.98
(45
.4(
(Tolon
((7,18
5,09
5.12
(11
,460
,274
.11(
6,81
8,27
4.77
(4,64
1,99
9.34
(59
.5(
(Tam
ale((
16,182
,831
.64(
29,369
,082
.47(
19,873
,554
.89(
9,49
5,52
7.58
(67
.7(

88
87"
"Northe
rn(Reg
ion((
Actua
l(re
venu
e(in(201
8(Es
timated
(rev
enue
(in(
2019
(Actua
l(re
venu
e(in(
2019
(Var
ianc
e(in(201
9(%(Cove
red(in(201
9(
(Gushiegu((
5,97
5,93
7.81
(8,77
2,50
0.96
(6,45
7,56
1.48
(2,31
4,93
9.48
(73
.6(
(Savelug
u/(Nan
ton((
3,17
5,45
5.53
(9,16
4,95
6.46
(7,64
0,32
7.86
(1,52
4,62
8.60
(83
.4(
(Zab
zugu
((4,12
4,48
9.97
(6,97
7,96
2.94
(4,77
4,10
7.01
(2,20
3,85
5.93
(68
.4(
(Yen
di(M
unicipal((
5,16
7,18
1.75
(11
,131
,758
.87(
7,21
3,74
1.01
(3,91
8,01
7.86
(64
.8(
(Nan
umba
(North((
6,62
7,98
6.11
(10
,036
,694
.10(
9,82
4,40
1.57
(21
2,29
2.53
(97
.9(
(Karaga((
4,00
9,61
3.73
(13
,351
,869
.00(
6,22
0,75
9.73
(7,13
1,10
9.27
(46
.6(
(Nan
umba
(Sou
th((
5,18
4,81
9.00
(8,64
1,16
8.51
(6,23
7,48
8.08
(2,40
3,68
0.43
(72
.2(
(Kpa
ndai((
6,14
0,99
6.80
(10
,475
,879
.56(
6,96
0,85
8.21
(3,51
5,02
1.35
(66
.4(
(Kum
bugu
((3,48
9,06
0.56
(10
,396
,704
.72(
7,59
8,89
4.20
(2,79
7,81
0.52
(73
.1(
(Mion((
4,68
1,52
2.58
(7,47
2,92
8.85
(6,03
6,22
2.87
(1,43
6,70
5.98
(80
.8(
(Sagne
rigu((
6,87
2,93
3.85
(14
,221
,596
.36(
9,69
2,52
0.30
(4,52
9,07
6.06
(68
.2(
(Tatale(Sang
uli((
3,66
1,89
9.42
(7,68
3,78
0.49
(4,99
3,74
7.47
(2,69
0,03
3.02
(65
.0(
(Nan
ton((
1,15
1,86
4.64
(7,36
1,15
9.55
(3,13
5,77
9.52
(4,22
5,38
0.03
(42
.6(
(Total((
89,107
,570
.71(
176,91
0,45
6.62
(11
8,19
2,19
5.66
(58
,718
,260
.96(
66.8(
( "Fiscal"resource"mobilization"by"districts"in"North"East"Region"
North(Ea
st(Reg
ion(
Actua
l(re
venu
e(in(201
8(Es
timated
(rev
enue
(in(
2019
.(Actua
l(re
venu
e(in(
2019
(Var
ianc
e(in(201
9(%(Cove
red(in(201
9(
West(M
amprusi(M
un(
5,21
3,99
8.40
(7,95
6,07
7.52
(6,47
9,78
7.23
(1,47
6,29
0.29
(81
.4(
East(M
amprusi(M
un(
4,96
9,68
4.63
(12
,786
,014
.00(
9,58
9,74
5.61
(3,19
6,26
8.39
(75
.0(
Bunkpu
rugu
(X(Nakpa
duri((
3,31
3,59
0.07
(7,86
6,56
7.12
(3,52
4,47
6.04
(4,34
2,09
1.08
(44
.8(
Yunyoo
XNasua
m((
725,60
3.68
(6,80
4,91
8.00
(2,95
9,45
1.31
(3,84
5,46
6.69
(43
.5(
Mam
prug
u(Moa
duri((
3,80
1,60
4.56
(6,22
5,96
1.02
(4,51
4,68
1.74
(1,71
1,27
9.28
(72
.5(
Cherep
oni((
5,22
1,95
1.70
(8,58
4,51
9.35
(5,22
7,81
0.79
(3,35
6,70
8.56
(60
.9(
(Total((
23,246
,433
.04(
50,224
,057
.01(
32,295
,952
.72(
17,928
,104
.29(
64.3(
" "Fiscal"resource"mobilization"by"districts"in"the"Savannah"Region"
Sava
nnah
(Reg
ion((
Actua
l(re
venu
e(in(201
8(Es
timated
(rev
enue
(in(
2019
(Actua
l(re
venu
e(in(
2019
(Var
ianc
e(in(201
9(%(Cove
red(in(201
9(
(Bole((
4,99
3,68
1.10
(13
,966
,412
.00(
5,75
4,33
1.65
(8,21
2,08
0.35
(41
.2(
(Saw
la(X(Tu
na(X(Kalba((
3,61
5,12
0.15
(7,15
9,47
0.35
(5,39
2,73
3.68
(1,76
6,73
6.67
(75
.3(
(West(G
onja((
4,17
0,80
7.79
(8,09
7,99
2.21
(4,31
3,82
4.73
(3,78
4,16
7.48
(53
.3(
(North(Gon
ja((
5,03
9,41
3.94
(7,87
3,45
3.00
(5,18
8,76
0.42
(2,68
4,69
2.58
(65
.9(
(Cen
tral(Gon
ja((
5,94
4,25
1.95
(9,90
2,42
4.00
(7,39
4,22
1.69
(2,50
8,20
2.31
(74
.7(
(East(G
onja(M
unicipal((
6,55
0,25
0.70
(13
,917
,298
.00(
6,89
0,16
7.90
(7,02
7,13
0.10
(49
.5(
(North(East(G
onja((
0.00
(4,37
7,02
0.13
(1,74
5,10
2.07
(2,63
1,91
8.06
(39
.9(
(Total((
30,313
,525
.63(
65,294
,069
.69(
36,679
,142
.14(
28,614
,927
.55(
56.2(
( "Fiscal"resource"mobilization"by"districts"in"the"Bono"Region"
Bono
(Reg
ion(
Actua
l(re
venu
e(in(201
8(Es
timated
(rev
enue
(in(
2019
(Actua
l(re
venu
e(in(
2019
(Var
ianc
e(in(201
9(%(Cove
red(in(201
9(
(Wen
chi((
10,223
,500
.61(
10,258
,246
.56(
9,21
9,39
3.47
(1,03
8,85
3.09
(89
.9(

89
88"
"Bono
(Reg
ion(
Actua
l(re
venu
e(in(201
8(Es
timated
(rev
enue
(in(
2019
(Actua
l(re
venu
e(in(
2019
(Var
ianc
e(in(201
9(%(Cove
red(in(201
9(
(Sun
yani(M
unicipal(((
15,001
,428
.98(
21,955
,350
.34(
13,217
,911
.74(
8,73
7,43
8.60
(60
.2(
(Dormaa(Cen
tral(M
un(
913,41
5.97
(13
,280
,866
.07(
8,35
4,27
0.60
(4,92
6,59
5.47
(62
.9(
(Jaman
(Sou
th((
9,05
0,11
7.06
(7,74
1,50
0.13
(7,26
9,37
7.21
(47
2,12
2.92
(93
.9(
(Berekum
(Mun
icipal((
9,05
2,54
3.00
(13
,997
,206
.42(
7,89
6,40
7.93
(6,10
0,79
8.49
(56
.4(
(Jaman
(North((
7,29
6,98
1.50
(9,99
9,25
0.98
(6,60
5,75
7.08
(3,39
3,49
3.90
(66
.1(
(Tain((
6,50
6,93
3.02
(6,47
3,79
3.59
(5,92
6,89
4.91
(54
6,89
8.68
(91
.6(
(Sun
yani(W
est((
9,10
4,65
0.51
(9,91
5,69
7.00
(8,29
0,01
7.39
(1,62
5,67
9.61
(83
.6(
(Dormaa(East((
6,14
3,94
3.00
(6,34
9,57
9.25
(5,73
5,36
2.89
(61
4,21
6.36
(90
.3(
(Ban
da((
5,38
1,16
5.12
(6,93
6,05
8.49
(4,67
4,82
0.74
(2,26
1,23
7.75
(67
.4(
(Dormaa(W
est((
8,34
1,82
5.29
(7,16
3,68
0.75
(3,97
7,54
9.51
(3,18
6,13
1.24
(55
.5(
(Berekum
(West((
2,63
8,22
4.00
(5,80
6,60
3.53
(4,04
1,05
4.27
(1,76
5,54
9.26
(69
.6(
(Total((
89,654
,728
.06(
119,87
7,83
3.11
(85
,208
,817
.74(
34,669
,015
.37(
71.1(
( "Fiscal"resource"mobilization"by"districts"in"the"Bono"East"Region"
Bono
(Eas
t(Actua
l(re
venu
e(in(201
8(Es
timated
(rev
enue
(in(
2019
(Actua
l(re
venu
e(in(
2019
(Var
ianc
e(in(201
9(%(Cove
red(in(201
9(
Ateb
ubuXAm
antin
(Mun
(5,77
0,81
7.00
(8,64
7,75
9.41
(5,48
3,92
8.79
(3,16
3,83
0.62
(63
.4(
Nkoranza(South((
6,43
4,77
9.47
(11
,932
,425
.46(
6,98
8,44
2.31
(4,94
3,98
3.15
(58
.6(
Nkoranza(North((
6,42
2,35
6.57
(6,83
2,79
1.60
(4,38
0,31
3.05
(2,45
2,47
8.55
(64
.1(
Kintam
po(Sou
th((
5,26
6,87
6.71
(6,85
6,67
8.73
(5,86
8,53
8.60
(98
8,14
0.13
(85
.6(
Kintam
po(North(M
un(
5,74
4,07
1.21
(9,94
5,57
6.00
(7,61
1,22
9.38
(2,33
4,34
6.62
(76
.5(
Pru(West((
822,61
4.56
(5,38
4,35
3.48
(66
3,62
2.99
(4,72
0,73
0.49
(12
.3(
Pru(East((
8,02
8,94
7.35
(6,53
3,63
8.00
(5,27
8,93
0.15
(1,25
4,70
7.85
(80
.8(
Sene
(East((
6,41
7,28
8.98
(6,83
7,53
6.84
(5,58
3,68
3.08
(1,25
3,85
3.76
(81
.7(
Sene
(West((
7,44
7,42
6.91
(7,25
6,59
7.94
(5,79
3,04
3.39
(1,46
3,55
4.55
(79
.8(
Techim
an(North(M
un(
8,74
0,08
1.70
(8,20
0,00
0.98
(5,71
4,56
5.40
(2,48
5,43
5.58
(69
.7(
Techim
an(M
unicipal((
13,391
,346
.23(
18,135
,719
.40(
12,536
,357
.13(
5,59
9,36
2.27
(69
.1(
(Total((
74,486
,606
.69(
96,563
,077
.84(
65,902
,654
.27(
30,660
,423
.57(
68.2(
( "Fiscal"resource"mobilization"by"districts"in"the"Ahafo"Region"
Aha
fo(Reg
ion(
Actua
l(re
venu
e(in(201
8(Es
timated
(rev
enue
(in(
2019
(Actua
l(re
venu
e(in(
2019
(Var
ianc
e(in(201
9(%(Cove
red(in(201
9(
(Tan
o(South(Mun
icipal((
5,56
7,05
3.88
(9,42
8,77
0.00
(7,20
0,28
2.73
(2,22
8,48
7.27
(76
.4(
(Tan
o(North(M
unicipal((
6,70
3,42
7.20
(8,95
2,13
8.35
(7,14
2,47
9.44
(1,80
9,65
8.91
(79
.8(
(Asuna
fo(North(M
un(
10,203
,215
.75(
9,61
1,63
6.19
(7,28
3,49
8.98
(2,32
8,13
7.21
(75
.8(
(Asuna
fo(Sou
th((
10,033
,588
.00(
7,68
4,40
6.10
(5,55
8,06
7.81
(2,12
6,33
8.29
(72
.3(
(Asutifi(N
orth((
10,186
,357
.00(
10,325
,053
.30(
10,194
,163
.60(
130,88
9.70
(98
.7(
(Asutifi(Sou
th((
6,27
5,34
5.43
(6,89
6,66
0.46
(5,06
4,01
1.66
(1,83
2,64
8.80
(73
.4(
(Total((
48,968
,987
.26(
52,898
,664
.40(
42,442
,504
.22(
10,456
,160
.18(
80.2(

90
89"
"(( Fiscal"resource"mobilization"by"districts"in"the"Ashanti"Region"
Ash
anti(Reg
ion(
Actua
l(re
venu
e(in(201
8(Es
timated
(rev
enue
(in(
2019
(Actua
l(re
venu
e(in(
2019
(Var
ianc
e(in(201
9(%(Cove
red(in(201
9(
(Kum
asi(M
etro.((
49,502
,192
.33(
55,996
,014
.03(
44,367
,995
.76(
11,628
,018
.27(
79.2(
(Aha
fo(Ano
(North((
6,81
9,27
4.36
(7,14
8,88
9.88
(6,46
2,88
1.13
(68
6,00
8.75
(90
.4(
(Sekyere(East((
4,88
4,74
3.94
(8,51
5,81
7.62
(6,61
9,68
2.12
(1,89
6,13
5.50
(77
.7(
(Asante(Ak
im(North((
2,86
6,69
3.16
(8,34
1,70
0.00
(6,37
1,48
0.70
(1,97
0,21
9.30
(76
.4(
(Aman
sie(West((
7,79
9,66
9.44
(8,58
5,92
2.34
(7,52
2,70
1.08
(1,06
3,22
1.26
(87
.6(
(Ada
nsi(Sou
th((
4,44
4,77
0.31
(6,15
2,30
7.96
(5,31
9,67
7.33
(83
2,63
0.63
(86
.5(
(Bosom
twi((
4,78
8,19
4.99
(8,16
4,58
0.03
(6,72
1,39
9.60
(1,44
3,18
0.43
(82
.3(
(Afig
ya(Kwab
re((
7,01
0,58
8.48
(10
,560
,000
.00(
6,56
5,88
2.19
(3,99
4,11
7.81
(62
.2(
(Ejura(Sekyedu
mase((
5,75
2,42
1.65
(8,46
1,22
6.06
(5,47
6,35
1.42
(2,98
4,87
4.64
(64
.7(
(Aha
fo(Ano
(Sou
th((
1,69
6,05
2.20
(6,91
3,86
5.78
(5,44
9,15
6.41
(1,46
4,70
9.37
(78
.8(
(Kwab
re(East((
6,54
6,98
5.80
(8,62
7,81
7.74
(7,21
3,60
1.49
(1,41
4,21
6.25
(83
.6(
(Asante(Ak
im(Sou
th((
6,48
3,56
6.39
(7,47
6,28
9.99
(7,05
8,94
7.75
(41
7,34
2.24
(94
.4(
(Ejisu((
7,25
3,22
3.07
(11
,001
,976
.20(
8,94
0,02
9.20
(2,06
1,94
7.00
(81
.3(
(Offinso(Mun
icipal((
3,29
7,46
8.09
(8,57
7,11
5.98
(5,92
9,16
4.35
(2,64
7,95
1.63
(69
.1(
(Sekyere(Cen
tral((
4,44
7,33
0.10
(7,26
2,88
3.87
(7,55
5,98
1.74
(X293
,097
.87(
104.0(
(Atw
ima(Nwab
iagya((
6,27
9,03
6.24
(8,43
8,42
4.73
(5,79
1,19
7.68
(2,64
7,22
7.05
(68
.6(
(Aman
sie(Ce
ntral((
3,30
6,40
5.66
(7,28
8,95
5.00
(4,92
0,21
8.32
(2,36
8,73
6.68
(67
.5(
(Obu
asi(M
un((
6,81
9,27
4.36
(26
,610
,997
.00(
8,36
1,55
2.95
(18
,249
,444
.05(
31.4(
(Ada
nsi(N
orth((
2,54
8,61
0.40
(7,00
4,06
6.31
(5,19
8,52
1.60
(1,80
5,54
4.71
(74
.2(
(Bekwai(M
un((
6,31
6,32
0.80
(10
,488
,060
.58(
6,64
5,68
1.70
(3,84
2,37
8.88
(63
.4(
(Atw
ima(X(M
ponu
a((
4,19
9,06
0.98
(7,44
4,23
8.64
(5,72
5,04
4.23
(1,71
9,19
4.41
(76
.9(
(Offinso(North((
4,60
9,58
3.24
(7,36
3,82
9.41
(6,17
9,49
0.65
(1,18
4,33
8.76
(83
.9(
(Mam
pong
(((3,73
4,44
4.77
(9,12
1,48
7.33
(6,78
6,23
3.67
(2,33
5,25
3.66
(74
.4(
(Bosom
e(Freh
o((
4,08
2,84
1.38
(5,94
0,89
7.51
(5,33
9,53
6.29
(60
1,36
1.22
(89
.9(
(Atw
imaXKw
anwom
a((
5,15
0,46
8.08
(9,60
2,32
3.56
(6,48
7,83
8.24
(3,11
4,48
5.32
(67
.6(
(Sekyere(Sou
th((
2,94
6,38
4.88
(7,82
9,22
2.48
(6,65
4,68
3.08
(1,17
4,53
9.40
(85
.0(
(Sekyere(Afram
(Plains((
2,19
4,16
7.36
(5,36
7,58
0.96
(4,74
8,79
6.10
(61
8,78
4.86
(88
.5(
(Asokore(M
ampo
ng((
11,025
,469
.28(
20,697
,688
.76(
14,950
,778
.89(
5,74
6,90
9.87
(72
.2(
(Asanti(A
kim(Cen
tral((
4,34
2,66
8.28
(10
,600
,513
.49(
6,37
4,16
5.99
(4,22
6,34
7.50
(60
.1(
(Sekyere(Kum
awu((
4,02
8,49
3.65
(6,73
7,21
2.17
(5,32
6,04
7.86
(1,41
1,16
4.31
(79
.1(
(Aha
fo(Ano
(Sou
th(W
est((
4,26
0,47
4.55
(5,16
3,40
5.72
(3,19
2,88
7.06
(1,97
0,51
8.66
(61
.8(
Atwim
a(Nwab
iagya(North((
1,70
2,94
4.87
(6,88
2,97
1.19
(4,53
1,21
9.32
(2,35
1,75
1.87
(65
.8(
(Akrofuo
m((
986,06
4.31
(5,74
6,87
3.49
(3,70
8,23
1.10
(2,03
8,64
2.39
(64
.5(
(Ada
nsi(A
sokw
a((
1,06
4,92
2.88
(6,11
9,22
7.98
(4,92
4,54
6.54
(1,19
4,68
1.44
(80
.5(
(Obu
asi(East((
2,07
0,87
3.53
(7,06
8,83
3.29
(4,19
5,56
8.66
(2,87
3,26
4.63
(59
.4(
(Afig
ya(Kwab
re(North((
2,05
8,30
7.38
(6,50
5,23
8.55
(4,51
6,62
7.03
(1,98
8,61
1.52
(69
.4(
(Aman
sie(South((
2,47
8,83
2.56
(7,59
7,37
3.64
(5,82
9,77
6.94
(1,76
7,59
6.70
(76
.7(
(Oforik
rom((
2,22
0,02
5.05
(13
,311
,353
.62(
5,70
7,39
1.49
(7,60
3,96
2.13
(42
.9(
(Kwad
aso((
3,13
7,40
2.17
(12
,604
,006
.00(
7,51
9,96
6.20
(5,08
4,03
9.80
(59
.7(
(Old(Tafo((
1,98
9,61
8.77
(23
,394
,132
.43(
6,79
8,82
4.35
(16
,595
,308
.08(
29.1(

91
90"
"Ash
anti(Reg
ion(
Actua
l(re
venu
e(in(201
8(Es
timated
(rev
enue
(in(
2019
(Actua
l(re
venu
e(in(
2019
(Var
ianc
e(in(201
9(%(Cove
red(in(201
9(
(Asokw
a((
3,14
3,46
3.27
(28
,831
,759
.26(
8,24
7,31
7.56
(20
,584
,441
.70(
28.6(
(Sua
me((
3,01
9,01
0.55
(28
,702
,285
.81(
10,313
,965
.87(
18,388
,319
.94(
35.9(
(Juab
en((
1,13
8,34
7.29
(6,41
4,96
6.77
(4,41
0,87
9.96
(2,00
4,08
6.81
(68
.8(
(Total((
224,44
6,69
0.85
(48
0,66
4,33
3.16
(31
0,96
1,92
1.60
(16
9,70
2,41
1.56
(64
.7(
( "Fiscal"resource"mobilization"by"districts"in"the"Eastern"Region"
Easter
n(Reg
ion(
Actua
l(re
venu
e(in(201
8(Es
timated
(rev
enue
(in(
2019
(Actua
l(re
venu
e(in(
2019
(Var
ianc
e(in(201
9(%(Cove
red(in(201
9(
(Fan
teakwa((
(7,31
0,68
6.70
(5,57
3,72
2.55
(1,73
6,96
4.15
(76
.2(
(East(A
kim((
(16
,199
,430
.20(
7,43
4,46
7.10
(8,76
4,96
3.10
(45
.9(
(Akuap
em(North((
6,85
7,75
1.84
(9,14
3,90
4.00
(8,35
9,96
7.88
(78
3,93
6.12
(91
.4(
(Birim(Cen
tral((
6,80
4,11
4.22
(9,77
3,74
6.40
(8,53
5,25
9.86
(1,23
8,48
6.54
(87
.3(
(Yilo(Krobo
((5,09
9,38
5.03
(9,23
9,81
5.82
(6,90
6,90
5.05
(2,33
2,91
0.77
(74
.8(
(Birim(North((
8,20
2,12
8.65
(12
,202
,889
.63(
9,73
6,90
2.27
(2,46
5,98
7.36
(79
.8(
(Kwah
u(South((
5,26
0,46
5.76
(6,98
3,07
6.52
(5,72
5,76
7.44
(1,25
7,30
9.08
(82
.0(
(Asuog
yaman
((4,77
2,79
3.12
(7,47
9,69
1.40
(7,90
9,58
4.47
(X429
,893
.07(
105.7(
(Kwah
u(Afram(Plains(North((
4,69
1,85
4.59
(6,56
6,73
4.97
(5,90
0,33
9.24
(66
6,39
5.73
(89
.9(
(Suh
um(((((((((((((
6,88
8,53
8.49
(5,24
1,64
4.08
(6,47
4,95
7.34
(X1,233
,313
.26(
123.5(
(Nsawam
(Ado
agyiri(((
7,50
9,56
0.27
(9,87
0,53
6.00
(4,08
3,60
4.26
(5,78
6,93
1.74
(41
.4(
(New
(Juab
en((
12,296
,170
.12(
14,508
,682
.39(
12,394
,795
.04(
2,11
3,88
7.35
(85
.4(
(Low
er(M
anya(((
5,37
7,73
4.83
(15
,739
,951
.30(
5,90
7,65
2.45
(9,83
2,29
8.85
(37
.5(
(West(A
kim((
4,76
8,29
8.39
(8,35
3,21
2.25
(8,75
5,04
6.06
(X401
,833
.81(
104.8(
(Kwaebibirim
((4,79
0,65
9.30
(10
,411
,451
.06(
6,02
0,07
5.44
(4,39
1,37
5.62
(57
.8(
(Kwah
u(West((
6,87
5,54
1.46
(8,90
2,36
0.46
(8,46
1,48
5.78
(44
0,87
4.68
(95
.0(
(Atiw
a((
4,97
7,59
0.79
(6,88
9,29
2.49
(6,68
7,12
4.66
(20
2,16
7.83
(97
.1(
(Upp
er(M
anya((
4,31
8,30
8.07
(6,00
7,21
2.13
(5,59
6,07
9.61
(41
1,13
2.52
(93
.2(
(Kwah
u(East((
4,86
0,80
0.81
(7,05
9,18
0.59
(7,08
5,69
4.61
(X26,51
4.02
(10
0.4(
(Birim(Sou
th((
5,27
4,95
6.22
(7,78
7,43
2.00
(5,72
2,11
0.77
(2,06
5,32
1.23
(73
.5(
(Akyem
ansa((
3,71
1,50
6.62
(10
,086
,646
.86(
6,34
3,56
6.66
(3,74
3,08
0.20
(62
.9(
(Ayensua
no((
4,35
2,91
9.97
(6,81
6,19
0.39
(6,35
9,98
7.72
(45
6,20
2.67
(93
.3(
(Den
kyem
bour((
3,77
3,38
1.92
(6,64
6,23
2.49
(7,10
2,24
7.00
(X456
,014
.51(
106.9(
(Kwah
u(Afram(Plains(South((
4,08
8,44
7.61
(6,39
5,84
5.19
(6,86
0,41
8.89
(X464
,573
.70(
107.3(
(Upp
er(W
est(A
kyem
((4,85
0,95
0.30
(8,35
0,72
1.05
(6,40
5,09
4.40
(1,94
5,62
6.65
(76
.70(
(Akw
apim
(Sou
th((
1,57
7,97
6.26
(7,42
9,65
2.73
(6,31
8,63
8.49
(1,11
1,01
4.24
(85
.0(
(Okere((
1,37
0,02
0.26
(5,64
6,49
9.91
(5,07
7,41
1.26
(56
9,08
8.65
(89
.9(
(Atiw
a(East((
2,12
1,53
5.49
(5,73
2,87
5.48
(4,91
7,30
1.09
(81
5,57
4.39
(85
.8(
(Fan
teakwa(South((
1,37
9,18
7.93
(6,35
3,00
4.00
(4,03
4,84
8.19
(2,31
8,15
5.81
(63
.5(
(Asene
/Man
so/Akroso((
1,51
2,69
3.51
(5,10
3,99
8.27
(4,40
2,92
6.35
(70
1,07
1.92
(86
.3(
(Abu
akwa(North((
2,50
3,94
0.87
(6,89
0,97
0.00
(5,39
1,75
9.32
(1,49
9,21
0.68
(78
.2(
(New
(Juab
en(North((
(7,18
7,40
3.43
(4,91
1,66
4.63
(2,27
5,73
8.80
(68
.3(
(Achiase((
7,56
4,38
4.80
(5,84
8,62
5.25
(2,57
4,75
4.66
(3,27
3,87
0.59
(44
.0(
(Totals((
155,12
7,95
5.78
(27
4,15
9,59
5.44
(21
3,97
2,16
0.54
(60
,187
,434
.90(
78.0(
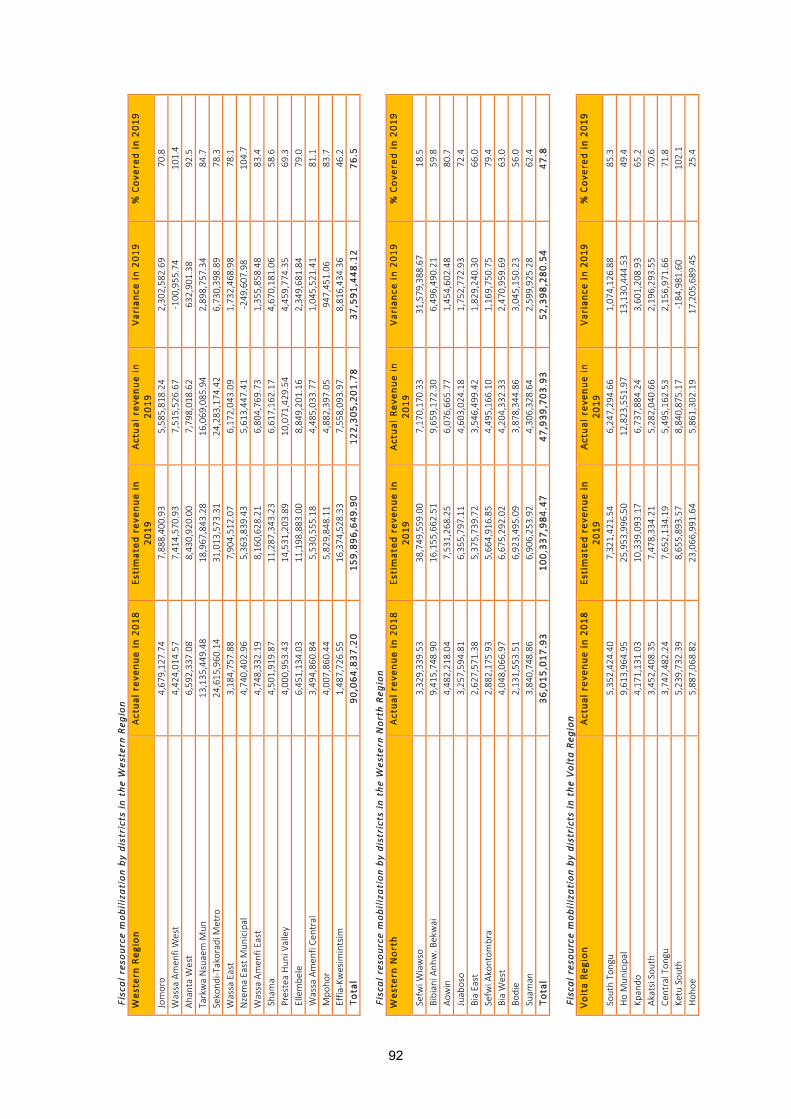
92
91"
"" "Fiscal"resource"mobilization"by"districts"in"the"Western"Region"
Wes
tern
(Reg
ion(
Actua
l(re
venu
e(in(201
8(Es
timated
(rev
enue
(in(
2019
(Actua
l(re
venu
e(in(
2019
(Var
ianc
e(in(201
9(%(Cove
red(in(201
9(
Jomoro((
4,67
9,12
7.74
(7,88
8,40
0.93
(5,58
5,81
8.24
(2,30
2,58
2.69
(70
.8(
Wassa(Amen
fi(West((
4,42
4,01
4.57
(7,41
4,57
0.93
(7,51
5,52
6.67
(X100
,955
.74(
101.4(
Ahan
ta(W
est((
6,59
2,33
7.08
(8,43
0,92
0.00
(7,79
8,01
8.62
(63
2,90
1.38
(92
.5(
Tarkwa(Nsuaem(M
un(
13,135
,449
.48(
18,967
,843
.28(
16,069
,085
.94(
2,89
8,75
7.34
(84
.7(
Sekond
iXTakorad
i(Metro((
24,615
,960
.14(
31,013
,573
.31(
24,283
,174
.42(
6,73
0,39
8.89
(78
.3(
Wassa(East((
3,18
4,75
7.88
(7,90
4,51
2.07
(6,17
2,04
3.09
(1,73
2,46
8.98
(78
.1(
Nzema(East(M
unicipal((
4,74
0,40
2.96
(5,36
3,83
9.43
(5,61
3,44
7.41
(X249
,607
.98(
104.7(
Wassa(Amen
fi(East((
4,74
8,33
2.19
(8,16
0,62
8.21
(6,80
4,76
9.73
(1,35
5,85
8.48
(83
.4(
(Sha
ma((
4,50
1,91
9.87
(11
,287
,343
.23(
6,61
7,16
2.17
(4,67
0,18
1.06
(58
.6(
(Prestea(Hun
i(Valley((
4,00
0,95
3.43
(14
,531
,203
.89(
10,071
,429
.54(
4,45
9,77
4.35
(69
.3(
(Ellembe
le((
6,45
1,13
4.03
(11
,198
,883
.00(
8,84
9,20
1.16
(2,34
9,68
1.84
(79
.0(
(Wassa(Amen
fi(Ce
ntral((
3,49
4,86
0.84
(5,53
0,55
5.18
(4,48
5,03
3.77
(1,04
5,52
1.41
(81
.1(
(Mpo
hor((
4,00
7,86
0.44
(5,82
9,84
8.11
(4,88
2,39
7.05
(94
7,45
1.06
(83
.7(
(EffiaXKw
esim
intsim
((1,48
7,72
6.55
(16
,374
,528
.33(
7,55
8,09
3.97
(8,81
6,43
4.36
(46
.2(
(Total((
90,064
,837
.20(
159,89
6,64
9.90
(12
2,30
5,20
1.78
(37
,591
,448
.12(
76.5(
" "Fiscal"resource"mobilization"by"districts"in"the"Western"North"Region"
Wes
tern
(North(
Actua
l(re
venu
e(in(201
8(Es
timated
(rev
enue
(in(
2019
(Actua
l(Rev
enue
(in(
2019
(Var
ianc
e(in(201
9(%(Cove
red(in(201
9(
(Sefwi(W
iawso((
3,32
9,33
9.53
(38
,749
,559
.00(
7,17
0,17
0.33
(31
,579
,388
.67(
18.5(
(Bibiani(Anh
w.(B
ekwai((
9,41
5,74
8.90
(16
,155
,662
.51(
9,65
9,17
2.30
(6,49
6,49
0.21
(59
.8(
(Aow
in(((
4,48
2,21
8.04
(7,53
1,26
8.25
(6,07
6,66
5.77
(1,45
4,60
2.48
(80
.7(
(Juab
oso(((
3,25
7,59
4.81
(6,35
5,79
7.11
(4,60
3,02
4.18
(1,75
2,77
2.93
(72
.4(
(Bia(East((
2,62
7,57
1.38
(5,37
5,73
9.72
(3,54
6,49
9.42
(1,82
9,24
0.30
(66
.0(
(Sefwi(A
kontom
bra((
2,88
2,17
5.93
(5,66
4,91
6.85
(4,49
5,16
6.10
(1,16
9,75
0.75
(79
.4(
(Bia(W
est((
4,04
8,06
6.97
(6,67
5,29
2.02
(4,20
4,33
2.33
(2,47
0,95
9.69
(63
.0(
(Bod
ie((
2,13
1,55
3.51
(6,92
3,49
5.09
(3,87
8,34
4.86
(3,04
5,15
0.23
(56
.0(
(Sua
man
((3,84
0,74
8.86
(6,90
6,25
3.92
(4,30
6,32
8.64
(2,59
9,92
5.28
(62
.4(
(Total((
36,015
,017
.93(
100,33
7,98
4.47
(47
,939
,703
.93(
52,398
,280
.54(
47.8(
( "Fiscal"resource"mobilization"by"districts"in"the"Volta"Region"
Volta(Reg
ion((
Actua
l(re
venu
e(in(201
8(Es
timated
(rev
enue
(in(
2019
(Actua
l(re
venu
e(in(
2019
(Var
ianc
e(in(201
9(%(Cove
red(in(201
9(
(Sou
th(Ton
gu((
5,35
2,42
4.40
(7,32
1,42
1.54
(6,24
7,29
4.66
(1,07
4,12
6.88
(85
.3(
(Ho(Mun
icipal((
9,61
3,96
4.95
(25
,953
,996
.50(
12,823
,551
.97(
13,130
,444
.53(
49.4(
(Kpa
ndo((
4,17
1,13
1.03
(10
,339
,093
.17(
6,73
7,88
4.24
(3,60
1,20
8.93
(65
.2(
(Akatsi(Sou
th((
3,45
2,40
8.35
(7,47
8,33
4.21
(5,28
2,04
0.66
(2,19
6,29
3.55
(70
.6(
(Cen
tral(Ton
gu((
3,74
7,48
2.24
(7,65
2,13
4.19
(5,49
5,16
2.53
(2,15
6,97
1.66
(71
.8(
(Ketu(South((
5,23
9,73
2.39
(8,65
5,89
3.57
(8,84
0,87
5.17
(X184
,981
.60(
102.1(
(Hoh
oe((
5,88
7,06
8.82
(23
,066
,991
.64(
5,86
1,30
2.19
(17
,205
,689
.45(
25.4(

93
92"
"Volta(Reg
ion((
Actua
l(re
venu
e(in(201
8(Es
timated
(rev
enue
(in(
2019
(Actua
l(re
venu
e(in(
2019
(Var
ianc
e(in(201
9(%(Cove
red(in(201
9(
(Keta((
5,77
5,68
4.96
(8,83
3,92
8.33
(6,54
2,27
5.26
(2,29
1,65
3.07
(74
.1(
(Ago
rtim
e(Ziop
e((
4,40
8,50
3.12
(7,83
5,62
2.42
(4,99
1,44
7.84
(2,84
4,17
4.58
(63
.7(
(Sou
th(Dayi((
4,04
2,43
4.19
(6,24
8,19
1.28
(5,78
2,71
8.53
(46
5,47
2.75
(92
.6(
(Ketu(North((
3,97
3,11
1.19
(8,14
4,75
9.70
(5,42
7,76
8.77
(2,71
6,99
0.93
(66
.6(
(Akatsi(N
orth((
4,01
6,41
8.74
(6,37
5,22
6.18
(4,89
4,29
7.12
(1,48
0,92
9.06
(76
.8(
(Afadzato(South((
3,53
4,28
3.74
(7,01
1,60
0.47
(5,37
5,72
1.56
(1,63
5,87
8.91
(76
.7(
(Ho(West((
4,03
9,26
0.26
(6,66
0,65
7.44
(5,03
7,28
8.55
(1,62
3,36
8.89
(75
.6(
(North(Dayi((
3,19
8,81
2.30
(6,23
1,66
2.23
(4,99
4,62
6.57
(1,23
7,03
5.66
(80
.1(
(North(Ton
gu((
4,00
1,86
8.73
(6,53
3,18
5.01
(5,36
5,25
2.76
(1,16
7,93
2.25
(82
.1(
(Ada
klu((
3,03
4,00
4.05
(6,00
8,42
2.19
(3,75
7,67
2.31
(2,25
0,74
9.88
(62
.5(
(Anlog
a((
0.00
(4,32
8,64
3.19
(1,78
7,89
7.49
(2,54
0,74
5.70
(41
.3(
(Total((
77,488
,593
.46(
164,67
9,76
3.26
(10
5,24
5,07
8.18
(59
,434
,685
.08(
63.9(
" "Fiscal"resource"mobilization"by"districts"in"the"Oti"Region"
Oti(
Actua
l(re
venu
e(in(201
8(Es
timated
(rev
enue
(in(
2019
(Actua
l(re
venu
e(in(
2019
(Var
ianc
e(in(201
9(%(Cove
red(
(Biakoye((
2,49
7,73
6.02
(6,57
4,17
9.00
(4,32
3,80
9.15
(2,25
0,36
9.85
(65
.8(
(Jasikan((
3,64
8,20
1.07
(5,77
1,45
6.26
(4,33
8,26
1.39
(1,43
3,19
4.87
(75
.2(
(Kad
jebi((
4,24
2,70
7.57
(8,40
6,08
1.95
(4,47
4,92
2.70
(3,93
1,15
9.25
(53
.2(
(Krachi(East((
5,41
8,71
6.67
(7,74
9,72
7.41
(5,48
1,63
5.57
(2,26
8,09
1.84
(70
.7(
(Krachi(N
chum
uru(
2,17
4,45
0.20
(7,68
3,60
2.87
(4,42
4,39
8.54
(3,25
9,20
4.33
(57
.6(
(Krachi(W
est((
3,28
9,74
9.47
(6,15
7,75
7.06
(4,89
6,86
3.90
(1,26
0,89
3.16
(79
.5(
(Nkw
anta(North((
3,48
5,98
3.22
(6,19
2,96
9.95
(5,07
1,60
2.45
(1,12
1,36
7.50
(81
.9(
(Nkw
anta(Sou
th((
3,82
5,29
4.55
(6,72
3,26
9.53
(5,96
6,49
9.22
(75
6,77
0.31
(88
.7(
Total((
28,582
,838
.77(
55,259
,044
.03(
38,977
,992
.92(
16,281
,051
.11(
70.5(
( "Fiscal"resource"mobilization"by"districts"in"the"Central"Region"
Cen
tral(Reg
ion(
Actua
l(re
venu
e(in(201
8(Es
timated
(rev
enue
(in(
2019
(((Actua
l(re
venu
e(in(
2019
(Var
ianc
e(in(201
9(%(Cove
red(in(201
9(
(Abu
raXAsebu
XKwam
an.((
4,70
9,26
1.61
(7,62
8,13
6.28
(7,08
2,50
6.68
(54
5,62
9.60
(92
.8(
(Cap
e(Co
ast(M
etro((
9,87
9,35
2.64
(14
,882
,346
.50(
10,166
,823
.71(
4,71
5,52
2.79
(68
.3(
(Gom
oa(W
est((
2,97
9,33
0.57
(5,97
5,50
0.39
(6,32
4,26
3.11
(X348
,762
.72(
105.8(
(AsikumaXOdo
benXBrakwa((
4,66
4,58
4.74
(7,86
8,39
1.00
(6,20
1,90
9.70
(1,66
6,48
1.30
(78
.8(
(Assin(Fosu((
2,71
3,14
6.55
(8,05
2,37
9.98
(6,21
4,37
6.87
(1,83
8,00
3.11
(77
.2(
(Twifu
(AtiXMorkw
a((
2,77
9,75
3.86
(7,81
7,74
5.16
(6,03
2,98
4.36
(1,78
4,76
0.80
(77
.2(
(Mfantseman
((7,21
7,15
7.99
(17
,613
,332
.11(
6,06
5,18
8.21
(11
,548
,143
.90(
34.4(
(Ago
na(W
est((
3,79
1,42
4.40
(10
,763
,363
.85(
8,25
2,35
1.31
(2,51
1,01
2.54
(76
.7(
(Kom
enda
XEdina
XEgu
.XAbr.((
5,74
9,01
8.88
(8,26
1,12
4.00
(7,15
7,46
8.06
(1,10
3,65
5.94
(86
.6(
(AjumakoXEn
yamXEssiam((
4,90
6,72
5.63
(10
,689
,165
.68(
5,97
1,70
6.41
(4,71
7,45
9.27
(55
.9(
(Upp
er(Den
kyira
(West((
4,88
9,82
7.84
(10
,627
,598
.42(
6,71
5,58
8.62
(3,91
2,00
9.80
(63
.2(
((Effu
tu(M
unicipal(((
4,10
1,68
3.15
(8,33
4,33
1.01
(8,86
1,52
0.72
(X527
,189
.71(
106.3(
(Assin(Sou
th((
2,93
9,73
9.52
(7,62
3,31
7.90
(5,18
7,67
4.65
(2,43
5,64
3.25
(68
.1(

94
93"
"(Gom
oa(East((
1,41
9,60
1.01
(11
,601
,289
.63(
4,98
5,97
2.05
(6,61
5,31
7.58
(43
.0(
(Awutu(Senya((
5,63
2,12
3.04
(8,35
2,24
6.68
(6,67
3,31
9.38
(1,67
8,92
7.30
(79
.9(
(Upp
er(Den
kyira
(East((
3,38
8,77
5.38
(8,15
0,17
4.13
(5,29
0,75
5.45
(2,85
9,41
8.68
(64
.9(
(Ago
na(East((
5,24
1,17
5.15
(6,80
8,31
0.00
(5,39
6,96
4.07
(1,41
1,34
5.93
(79
.3(
(Awutu((Sen
ya(East((
7,91
4,27
9.57
(21
,281
,688
.93(
11,266
,782
.01(
10,014
,906
.92(
52.9(
(Twifu
XHem
ang(Lower(Den
kyira
((3,68
7,35
0.32
(6,86
3,95
3.00
(5,18
7,90
6.90
(1,67
6,04
6.10
(75
.6(
(Ekumfi((
3,18
5,42
8.16
(8,67
1,93
7.73
(4,97
3,77
8.55
(3,69
8,15
9.18
(57
.4(
(Assin(North((
1,35
8,74
5.01
(5,60
7,54
4.46
(4,05
4,81
4.64
(1,55
2,72
9.82
(72
.3(
(Gom
oa(Cen
tral((
4,13
8,17
6.62
(8,76
0,48
4.72
(5,47
7,13
4.79
(3,28
3,34
9.93
(62
.5(
(Total((
97,286
,661
.64(
212,23
4,36
1.56
(14
3,54
1,79
0.25
(68
,692
,571
.31(
67.6(
"Fiscal"resource"mobilization"by"districts"in"the"Greater"Accra"Region"
Gre
ater
(Acc
ra(Reg
ion(
Actua
l(re
venu
e(in(201
8(Es
timated
(rev
enue
(in(
2019
(Actua
l(re
venu
e(in(
2019
(Var
ianc
e(in(201
9(%(Cove
red(in(201
9(
Shai(Osodu
ku((D
ist.((
7,25
4,23
3.93
(13
,620
,290
.46(
8,61
1,16
4.36
(5,00
9,12
6.10
(63
.2(
Accra(Metro.((
83,170
,347
.86(
51,882
,279
.38(
45,150
,199
.33(
6,73
2,08
0.05
(87
.0(
Ga(West((
13,123
,633
.81(
17,666
,587
.47(
12,751
,807
.36(
4,91
4,78
0.11
(72
.2(
Ada((East(D
ist.((
6,07
8,69
2.09
(9,92
6,24
2.51
(4,31
7,93
8.65
(5,60
8,30
3.86
(43
.5(
Tema(Metro((
30,736
,597
.87(
44,495
,142
.72(
35,390
,234
.44(
9,10
4,90
8.28
(79
.5(
Ga(East(M
un.((
12,013
,756
.99(
18,446
,338
.61(
13,212
,283
.80(
5,23
4,05
4.81
(71
.6(
Ledzokuku(Mun
.((12
,117
,434
.05(
22,139
,194
.00(
10,580
,185
.53(
11,559
,008
.47(
47.8(
Ga(South(Mun
.((6,19
9,43
8.72
(13
,040
,597
.71(
9,38
9,35
7.29
(3,65
1,24
0.42
(72
.0(
Asha
iman
(Mun
.((11
,022
,430
.60(
20,770
,712
.16(
14,582
,929
.68(
6,18
7,78
2.48
(70
.2(
Aden
tan(Mun
.((19
,018
,635
.49(
27,329
,000
.00(
19,511
,858
.92(
7,81
7,14
1.08
(71
.4(
Ga(Ce
ntral(M
un.((
10,663
,067
.29(
24,600
,000
.00(
12,190
,845
.13(
12,409
,154
.87(
49.6(
Kpon
eXKantam
anso(M
un.((
16,836
,498
.24(
23,445
,526
.00(
20,880
,016
.99(
2,56
5,50
9.01
(89
.1(
La(Nkw
antanm
ang(Mad
ina((M
un(
9,28
5,19
2.40
(15
,199
,527
.49(
11,509
,231
.70(
3,69
0,29
5.79
(75
.7(
La(Dad
eXKo
topo
n(Mun
.((14
,896
,169
.18(
25,000
,000
.00(
18,538
,074
.01(
6,46
1,92
5.99
(74
.2(
Ada(West((
3,95
2,92
4.74
(7,11
2,52
9.26
(5,38
7,39
1.85
(1,72
5,13
7.41
(75
.7(
Ningo
(Prampram
(Dist.((
7,89
0,46
3.77
(12
,365
,979
.73(
8,68
4,61
7.38
(3,68
1,36
2.35
(70
.2(
Okaikwe(North(M
un.((
3,35
0,54
5.54
(18
,075
,775
.61(
10,648
,367
.75(
7,42
7,40
7.86
(58
.9(
Ablekuma(North(M
un.((
2,77
9,36
9.84
(12
,471
,834
.82(
8,74
2,47
7.37
(3,72
9,35
7.45
(70
.1(
Ablekuma(West(M
un((
2,89
3,55
2.49
(12
,768
,409
.90(
9,23
0,87
6.87
(3,53
7,53
3.03
(72
.3(
Ayaw
aso(East(M
un.((
1,86
1,90
3.75
(9,21
3,74
6.01
(7,30
7,34
1.52
(1,90
6,40
4.49
(79
.3(
Ayaw
aso(North((M
un((
1,97
2,59
5.01
(11
,271
,221
.00(
5,96
4,88
7.84
(5,30
6,33
3.16
(52
.9(
Ayaw
aso(West(M
un.((
5,69
9,44
7.32
(25
,575
,778
.36(
14,308
,179
.40(
11,267
,598
.96(
55.9(
Ga(North((M
un((
2,38
2,77
0.73
(9,19
1,21
8.74
(6,95
2,60
2.31
(2,23
8,61
6.43
(75
.6(
(WeijaXGba
we(Mun
((10
,539
,040
.71(
16,359
,855
.11(
9,12
8,62
5.23
(7,23
1,22
9.88
(55
.8(
(Tem
a(West(M
un((
4,01
4,66
2.87
(24
,100
,259
.88(
8,81
3,60
7.75
(15
,286
,652
.13(
36.6(
(Krowor(M
un((
2,51
0,38
8.92
(14
,253
,115
.14(
6,77
2,02
3.23
(7,48
1,09
1.91
(47
.5(
(Korle(Klottey(M
un((
0.00
(23
,996
,000
.00(
8,91
2,08
3.72
(15
,083
,916
.28(
37.1(
(Ayawaso(Ce
ntral(M
un,((
0.00
(6,76
3,34
0.25
(4,21
1,66
6.26
(2,55
1,67
3.99
(62
.3(
(Ablekum
a(Ce
ntral(M
un((
0.00
(13
,936
,396
.26(
8,43
2,52
7.03
(5,50
3,86
9.23
(60
.5(
(Total((
302,26
3,79
4.21
(54
5,01
6,89
8.58
(36
0,11
3,40
2.70
(18
4,90
3,49
5.88
(66
.1(

95
94"
"( Expe
nditur
e(of(Met
ropo
litan,(M
unicipal(and
(District(Assem
blies((M
MDAs)(in(20
19(
Reg
ions
(
Compe
nsatio
n(of(
Employe
es(
Use
(of(Goods
(&(and
(Se
rvices
(
Cons
umpt
ion(of(Fixe
d(Cap
ital(
Social(
Ben
efits(
Oth
er(
Expe
nses
(To
tal(Rec
urre
nt(
Expe
nditur
e(Cap
ital(
Exp.(IGF)(
Cap
ital(
Exp.(C
F&OTH
ERS)(
Total(Cap
.Exp
(To
tal(((
Expe
nditur
e(REC
/TE
X(
((A((C((T.((
((A((C((T.((
((A((C((T.((
((A((C((T.((
((A((C((T.((
((A((C((T.((
((A((C((T.((
((A((C((T.((
((A((C((T.((
((A((C((T.((
%(
Asha
nti(R
egion((
94,551
,227
.33(
61,477
,719
.20(
(((((((((((((((((((((X((((
280,73
1.95
(10
0,02
9,25
0.51
(25
6,33
8,92
8.99
(((((((((((((((((((((((X((((
30,104
,391
.45(
30,104
,391
.45(
286,44
3,32
0.44
(89
.49(
Ahafo(Re
gion
(12
,162
,331
.83(
5,49
5,83
3.02
((((((((((((((((((((((X((((
324,08
1.29
(6,90
1,24
6.07
(24
,883
,492
.21(
((((((((((((((((((((((X((((
13,355
,522
.26(
13,355
,522
.26(
38,239
,014
.47(
65.07(
Bono
(Region(
33,820
,775
.04(
9,68
2,12
7.18
(X(
149,89
5.73
(7,98
8,84
7.17
(51
,641
,645
.12(
218,55
9.67
(25
,273
,098
.09(
25,491
,657
.76(
77,133
,302
.88(
66.95(
Bono
(East(R
egion(
21,652
,512
.19(
13,580
,153
.67(
(((((((((((((((((((((X((((
23,373
.47(
11,929
,767
.61(
47,185
,806
.94(
7,80
0.00
(15
,095
,681
.91(
15,103
,481
.91(
62,289
,288
.85(
75.75(
Central(R
egion(
46,290
,424
.99(
42,012
,294
.68(
(((((((((((((((((((((X((((
523,24
8.44
(13
,302
,290
.60(
102,12
8,25
8.71
(((((((((((((((((((((((X((((
28,268
,444
.73(
28,268
,444
.73(
130,39
6,70
3.44
(78
.32(
Eastern(Re
gion
(53
,538
,014
.43(
44,804
,723
.80(
32,065
.50(
134,94
2.19
(37
,483
,781
.18(
135,99
3,52
7.10
(1,68
6,77
8.99
(55
,854
,502
.59(
57,541
,281
.58(
193,53
4,80
8.68
(70
.27(
Greater(Accra(
Region
(11
1,10
5,62
5.48
(11
4,84
6,80
3.68
(15
6,54
2.44
(1,40
5,75
0.61
(26
,895
,131
.60(
254,40
9,85
3.81
(18
,143
,314
.83(
59,007
,078
.50(
77,150
,393
.33(
331,56
0,24
7.14
(76
.73(
Northern(Re
gion
((30
,902
,509
.34(
22,578
,607
.44(
34,716
.15(
315,87
9.21
(24
,558
,908
.40(
78,390
,620
.54(
389,71
5.30
(18
,381
,063
.08(
18,770
,778
.38(
97,161
,398
.92(
80.68(
North(East(R
egion(
5,94
3,02
9.26
(6,40
5,85
7.44
((((((((((((((((((((((X((((
(((((((((((((((((((((X((((
9,32
3,53
5.06
(21
,672
,421
.76(
((((((((((((((((((((((X((((
4,73
8,44
4.40
(4,73
8,44
4.40
(26
,410
,866
.16(
82.06(
Oti(Re
gion
(10
,640
,833
.24(
9,27
1,34
7.19
((((((((((((((((((((((X((((
41,586
.39(
6,74
3,58
6.73
(26
,697
,353
.55(
((((((((((((((((((((((X((((
6,46
7,45
4.41
(6,46
7,45
4.41
(33
,164
,807
.96(
80.50(
Savann
ah(Region(
6,91
1,36
0.81
(11
,781
,786
.89(
(((((((((((((((((((((X((((
59,487
.70(
4,50
4,15
9.45
(23
,256
,794
.85(
((((((((((((((((((((((X((((
9,62
6,02
7.81
(9,62
6,02
7.81
(32
,882
,822
.66(
70.73(
Upp
er(East(R
egion((
24,854
,658
.80(
15,967
,507
.70(
(((((((((((((((((((((X((((
61,778
.00(
11,843
,779
.92(
52,727
,724
.42(
((((((((((((((((((((((X((((
17,232
,077
.66(
17,232
,077
.66(
69,959
,802
.08(
75.37(
Upp
er(W
est(R
egion(
17,900
,062
.82(
2,31
8,47
6.83
(X(
17,253
.00(
12,549
,653
.58(
32,785
,446
.23(
X(29
,048
,261
.13(
29,048
,261
.13(
61,833
,707
.36(
53.02(
Volta
(Region(
26,347
,442
.50(
12,437
,729
.00(
(((((((((((((((((((((X((((
208,07
6.97
(21
,798
,963
.52(
60,792
,211
.99(
239,48
2.96
(18
,098
,352
.22(
18,337
,835
.18(
79,130
,047
.17(
76.83(
Western(Region((
30,524
,031
.35(
45,461
,044
.22(
(((((((((((((((((((((X((((
748,97
4.64
(6,95
7,00
9.61
(83
,691
,059
.82(
23,138
.50(
27,608
,378
.63(
27,631
,517
.13(
111,32
2,57
6.95
(75
.18(
Western(North(
Region
(13
,191
,317
.32(
15,396
,723
.22(
X(19
0,96
8.00
(4,89
8,04
7.45
(33
,677
,055
.99(
X(10
,043
,984
.43(
10,043
,984
.43(
43,721
,040
.42(
77.03(
Total(
540,33
6,15
6. 73(
433,51
8,73
5. 16(
223,32
4.09
(4,48
6,02
7. 59(
307,70
7,95
8. 46(
1,28
6,27
2,20
2. 03(
20,708
,790
.25
(36
8,20
2,76
3.30
(38
8,91
1,55
3. 55(
1,67
5,18
3,75
5. 58(
76.78(
( Staff"Strengths"of"MMDAs"
Metropo
litan
+Assem
blies+
MMDAs(
Requ
iremen
ts+
Actual+
%+of+m
inim
um+Cov
ered
++Minim
um+
Maxim
um+
2019
+Ku
masi"M
etro"
718"
1,12
6"61
4"85
.5"
Seko
ndi@T
akorad
i++71
8+11
26+
464+
64.6"
Accra"Metropo
litan""
718"
1,12
6"74
3"10
3.5"
Tema"Metropo
litan
""71
8"1,12
6"31
0"43
.2"
Cap
e C
oast
Met
ropo
litan
71
8 1,
126
157
21.9
Tamale"Metropo
litan
"71
8"11
26"
449"
62.5"
Total""
4308
"6,75
6"27
37"
63.5"
"Mun
icipal+Assem
blies+
MMDAs(
Req
uire
men
ts(
Actua
l(%(of(minim
um(cove
red((
Minim
um(
Max
imum
(20
19(
Asan
te(Akim(Cen
tral(
465(
690(
119(
25.6(
Asan
te(Akim(Sou
th(
465(
690(
116(
24.9(
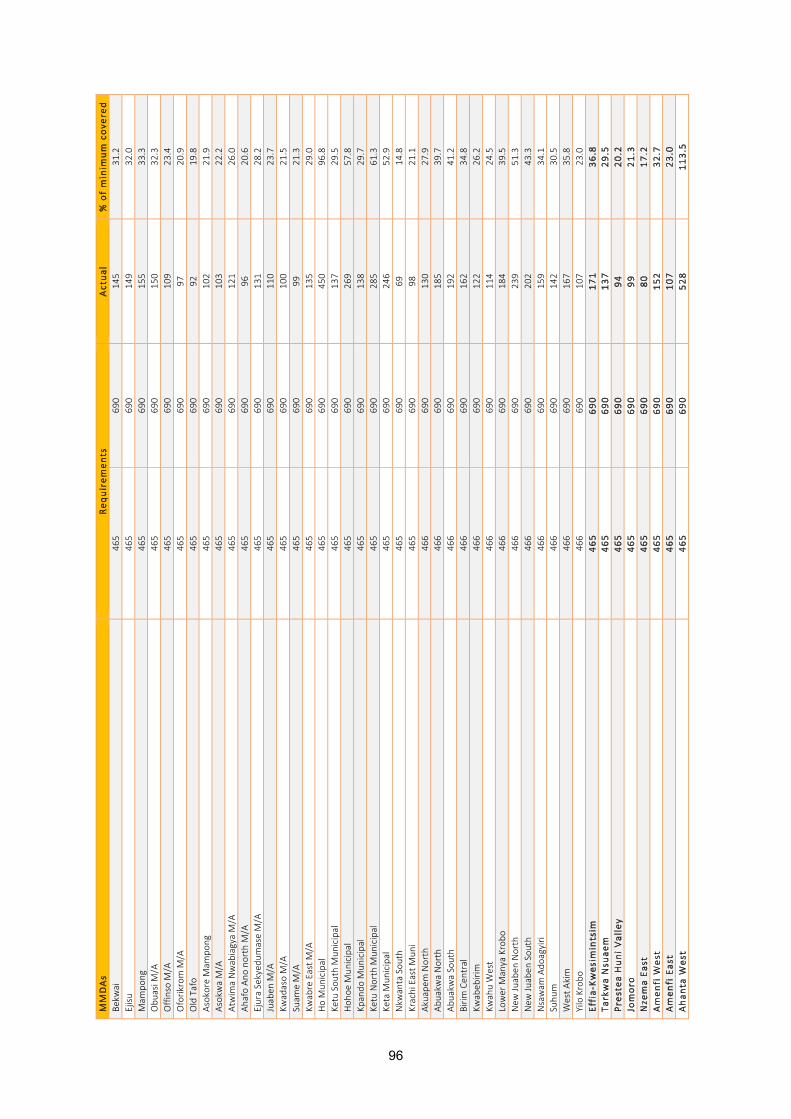
96
95"
"MMDAs(
Req
uire
men
ts(
Actua
l(%(of(minim
um(cove
red((
Bekw
ai(
465(
690(
145(
31.2(
Ejisu(
465(
690(
149(
32.0(
Mam
pong
(46
5(69
0(15
5(33
.3(
Obu
asi(M
/A(
465(
690(
150(
32.3(
Offinso(M/A(
465(
690(
109(
23.4(
Oforik
rom(M
/A(
465(
690(
97(
20.9(
Old(Tafo((
465(
690(
92(
19.8(
Asokore(Mam
pong
(46
5(69
0(10
2(21
.9(
Asokwa(M/A(
465(
690(
103(
22.2(
Atwim
a(Nwab
iagya(M/A(
465(
690(
121(
26.0(
Ahafo(An
o(no
rth(M/A(
465(
690(
96(
20.6(
Ejura(Sekyed
umase(M/A(
465(
690(
131(
28.2(
Juab
en(M
/A(
465(
690(
110(
23.7(
Kwad
aso(M/A(
465(
690(
100(
21.5(
Suam
e(M/A(
465(
690(
99(
21.3(
Kwab
re(East(M
/A(
465(
690(
135(
29.0(
Ho(Mun
icipal((
465(
690(
450(
96.8(
Ketu(Sou
th(M
unicipal(
465(
690(
137(
29.5(
Hoh
oe(M
unicipal((
465(
690(
269(
57.8(
Kpan
do(M
unicipal(
465(
690(
138(
29.7(
Ketu(North(M
unicipal(
465(
690(
285(
61.3(
Keta(M
unicipal(
465(
690(
246(
52.9(
Nkw
anta(Sou
th(
465(
690(
69(
14.8(
Krachi(East(M
uni(
465(
690(
98(
21.1(
Akua
pem(North(
466(
690(
130(
27.9(
Abua
kwa(North(
466(
690(
185(
39.7(
Abua
kwa(South(
466(
690(
192(
41.2(
Birim
(Cen
tral(
466(
690(
162(
34.8(
Kwab
ebirim((
466(
690(
122(
26.2(
Kwah
u(West(
466(
690(
114(
24.5(
Lower(M
anya(Krobo
(46
6(69
0(18
4(39
.5(
New
(Juab
en(North(
466(
690(
239(
51.3(
New
(Juab
en(Sou
th(
466(
690(
202(
43.3(
Nsawam
(Ado
agyiri(
466(
690(
159(
34.1(
Suhu
m(
466(
690(
142(
30.5(
West(A
kim(
466(
690(
167(
35.8(
Yilo(Krobo
(46
6(69
0(10
7(23
.0(
EffiaXKw
esim
intsim
(46
5(69
0(17
1(36
.8(
Tarkwa(Nsu
aem((
465(
690(
137(
29.5(
Pres
tea(Hun
i(Valley((
465(
690(
94(
20.2(
Jomoro
((46
5(69
0(99
(21
.3(
Nze
ma(Ea
st(
465(
690(
80(
17.2(
Amen
fi(W
est(
465(
690(
152(
32.7(
Amen
fi(Eas
t((
465(
690(
107(
23.0(
Aha
nta(Wes
t((
465(
690(
528(
113.5(

97
96"
"MMDAs(
Req
uire
men
ts(
Actua
l(%(of(minim
um(cove
red((
Aowin((
465(
690(
106(
22.8(
Bibian
iXAnh
wiasoXBekwai((
465(
690(
138(
29.7(
Sefw
i(Wiawso((
465(
690(
174(
37.4(
Tema(West((
465(
690(
165(
35.5(
Ga(West((
465(
690(
180(
38.7(
Ga(East((
465(
690(
163(
35.1(
Ga(South((
465(
690(
123(
26.5(
Ga(Ce
ntral((
465(
690(
119(
25.6(
Ga(North((
465(
690(
144(
31.0(
Ledzokuku(M/A((
465(
690(
145(
31.2(
Krow
or(M
/A((
465(
690(
88(
18.9(
Kpon
e(Kataman
so(M
/A((
465(
690(
207(
44.5(
La(Dad
ekotop
on(M
/A((
465(
690(
145(
31.2(
Ablekuma(North(M
/A((
465(
690(
103((
((Ab
lekuma(West(M
/A((
465(
690(
152(
32.7(
Asha
iman
(M/A((
465(
690(
216(
46.5(
Aden
tan(M/A((
465(
690(
204(
43.9(
La(Nkw
antana
ng(M
adina((
465(
690(
192(
41.3(
Ayaw
aso(East(M
/A((
465(
690(
65(
14.0(
Ayaw
aso(North(M
/A((
465(
690(
81(
17.4(
Ayaw
aso(West(M
/A((
465(
690(
147(
31.6(
Okaikwei(North(M
/A((
465(
690(
102(
21.9(
Ablekuma(Ce
ntral((
465(
690(
91(
19.6(
Ayaw
aso(Ce
ntral(((
465(
690(
57(
12.3(
Korle
(Klottey(((
465(
690(
122(
26.2(
Sissala(East(
465(
690(
118(
25.4(
Lawra(
465(
690(
115(
24.7(
Jirap
a(46
5(69
0(11
2(24
.1(
Wa(
465(
690(
177(
38.1(
Bolgatan
ga(M
unicipal((
465(
690(
218(
46.9(
Bawku(M
unicipal((
465(
690(
176(
37.8(
Kassen
aXNan
kana
(Mun
icipal(
465(
690(
48(
10.3(
East(M
amprusi(
465(
690(
127(
27.3(
West(M
amprusi(
465(
690(
116(
24.9(
Berekum(East(M
unicipal(
465(
690(
210(
45.2(
Dormaa(Cen
tral(M
unicipal(
465(
690(
149(
32.0(
Sunyan
i(Mun
cipa
l(46
5(69
0(24
1(51
.8(
Sunyan
i(West(M
unicipal(
465(
690(
217(
46.7(
Jaman
(Sou
th(M
unicipal(
465(
690(
170(
36.6(
Wen
chi(M
unicipal(
465(
690(
398(
85.6(
Asun
afo(North((
465(
690(
195(
41.9(
Tano
(North(
465(
690(
211(
45.4(
Tano
(Sou
th(
465(
690(
179(
38.5(
Ateb
ubu(Am
antin
(46
5(69
0(11
8(25
.4(
Kintam
po(North(
465(
690(
129(
27.7(

98
97"
"MMDAs(
Req
uire
men
ts(
Actua
l(%(of(minim
um(cove
red((
Nkoranza(South(
465(
690(
202(
43.4(
Techim
an(M
unicipal(
465(
690(
376(
80.9(
Agon
a(West((
465(
690(
237(
51.0(
Assin(Fo
su((
465(
690(
88(
18.9(
Awutu(Senya(East((
465(
690(
123(
26.5(
Effutu((
465(
690(
194(
41.7(
Komen
da/Edina
/Egu
afo/Ab
rem((
465(
690(
151(
32.5(
Mfantseman
((46
5(69
0(14
6(31
.4(
Upp
er(Den
kyira
(East((
465(
690(
167(
35.9(
Gushe
gu(M
unicipal(
465(
690(
80(
17.2(
Nan
umba
(North(M
unicipal(
465(
690(
109(
23.4(
Sagn
erigu(Mun
icipal(
465(
690(
358(
77.0(
Savelugu
(Mun
icipal(
465(
690(
214(
46.0(
Yend
i(Mun
icipal(
465(
690(
90(
19.4(
East(Gon
ja(
465(
690(
65(
14.0(
Total(
4976
8(73
830(
1664
4(33
.4(
(Districts(
MMDAs(
Req
uire
men
ts(
Actua
l(%(of(minim
um(
Cove
red((
Minim
um(
Max
imum
(20
19(
Adan
si(North(D/A(
356(
519(
71(
19.9(
Adan
si(Sou
th(D/A(
356(
519(
87(
24.4(
Afigya(Kwab
re(Sou
th((
356(
519(
117(
32.9(
Afigya(Kwab
re(North(
356(
519(
60(
16.9(
Ahafo(An
o(South(East(D/A(
356(
519(
62(
17.4(
Ahafo(An
o(South(West(D
/A(
356(
519(
90(
25.3(
Aman
sie(Ce
ntral(D
/A(
356(
519(
87(
24.4(
Aman
sie(West(D
/A(
356(
519(
82(
23.0(
Aman
sie(South(D/A(
356(
519(
49(
13.8(
Atwim
a(Nwab
iagya(North(D/A(
356(
519(
72(
20.2(
Atwim
a(Kw
anwom
a(D/A(
356(
519(
107(
30.1(
Atwim
a(Mpo
nua(D/A(
356(
519(
(64(
18.0((
Akrofuom
(D/A(
356(
519(
54(
15.2(
Bosome(Freh
o(D/A(
356(
519(
(61(
17.1((
Bosomtw
e(D/A(
356(
519(
132(
37.1(
Asan
te(Akim(North(D/A(
356(
519(
(94(
26.4((
Adan
si(Asokw
a(D/A(
356(
519(
59(
16.6(
Offinso(North(D/A(
356(
519(
84(
23.6(
Obu
asi(East(D
/A(
356(
519(
80(
22.5(
Sekyere(Ku
maw
u(D/A(
356(
519(
72(
20.2(
Sekyere(Ce
ntral(D
/A(
356(
519(
91(
25.6(
Sekyere(East(D/A(
356(
519(
132(
37.1(
Sekyere(South(D/A(
356(
519(
131(
36.8(
Sekyere(Afram(Pains(D/A(
356(
519(
57(
16.0(
Agotim
e(Ziop
e((
356(
519(
246(
69.1(

99
98"
"MMDAs(
Req
uire
men
ts(
Actua
l(%(of(minim
um(
Cove
red((
South(Dayi((
356(
519(
165(
46.3(
Central(Ton
gu((
356(
519(
178(
50.0(
Afad
zato(Sou
th((
356(
519(
150(
42.1(
Ho(West((
356(
519(
187(
52.5(
Akatsi(Sou
th((
356(
519(
255(
71.6(
Akatsi(North((
356(
519(
208(
58.4(
North(Ton
gu((
356(
519(
284(
79.8(
Adaklu((
356(
519(
139(
39.0(
South(To
ngu((
356(
519(
169(
47.5(
North(Dayi((
356(
519(
191(
53.7(
Anloga((
356(
519(
138(
38.8(
Nkw
anta(North(
356(
519(
63(
17.7(
Jasikan(
356(
519(
76(
21.3(
Kadjeb
i(35
6(51
9(66
(18
.5(
Krachi(W
est(
356(
519(
103(
28.9(
Biakoye(
356(
519(
90(
25.3(
Krachi(Nchum
uru(
356(
519(
51(
14.3(
Achiase(
366(
519(
48(
13.1(
Akua
pem(Sou
th(
366(
519(
296(
80.9(
Akyeman
sa(
366(
519(
129(
35.2(
Atiwa(East(
366(
519(
82(
22.4(
Atiwa(West(
366(
519(
102(
27.9(
Ayen
suan
o(36
6(51
9(57
(15
.6(
Asen
e(Man
so(Akroso(
366(
519(
57(
15.6(
Asuo
gyam
an(
366(
519(
122(
33.3(
Birim
(North(
366(
519(
120(
32.8(
Birim
(Sou
th(
366(
519(
91(
24.9(
Den
kyem
bour(
366(
519(
89(
24.3(
Fanteakw
a(North(
366(
519(
115(
31.4(
Fanteakw
a(South(
366(
519(
118(
32.2(
Kwah
u(Afram(Plains(North(
366(
519(
152(
41.5(
Kwah
u(Afram(Plains(South(
366(
519(
113(
30.9(
Kwah
u(East(
366(
519(
86(
23.5(
Kwah
u(South(
366(
519(
125(
34.2(
Okere(
366(
519(
70(
19.1(
Upp
er(M
anya(Krobo
(36
6(51
9(76
(20
.8(
Upp
er(W
est(A
kim(
366(
519(
125(
34.2(
Mpo
hor((
356(
519(
105(
29.5(
Was
sa(Eas
t(35
6(51
9(13
7(38
.5(
Sham
a((
356(
519(
120(
33.7(
Ellembe
lle((
356(
519(
106(
29.8(
Amen
fi(Cen
tral((
356(
519(
55(
15.4(
Sefw
i(Akontom
bra((
356(
519(
91(
25.6(
Bia(West((
356(
519(
106(
29.8(
Bia(East((
356(
519(
93(
26.1(

100
99"
"MMDAs(
Req
uire
men
ts(
Actua
l(%(of(minim
um(
Cove
red((
Juab
oso((
356(
519(
246(
69.1(
Suam
an((
356(
519(
174(
48.9(
Bodi((
356(
519(
187(
52.5(
WeijaXGba
we(D/A((
356(
519(
146(
41.0(
Shai(Osudo
ku(D/A((
356(
519(
143(
40.2(
Ada(East(D/A((
356(
519(
127(
35.7(
Ada(West(D
/A((
356(
519(
112(
31.5(
(Ningo
(Prampram
(D/A((
356(
519(
125(
35.1(
Wa(East(
356(
519(
68(
19.1(
Wa(West(
356(
519(
75(
21.1(
Lambu
ssie(
356(
519(
66(
18.5(
Sissala(West(
356(
519(
78(
21.9(
Daffia
maXBu
ssieXIssa(
356(
519(
72(
20.2(
Nan
dom(
356(
519(
77(
21.6(
Nad
owli/Kaleo(
356(
519(
112(
31.5(
Talensi(D
istrict((
356(
519(
105(
29.5(
Nab
dam((
356(
519(
74(
20.8(
Bong
o((
356(
519(
119(
33.4(
Kassen
aXNan
kana
(West((
356(
519(
100(
28.1(
Builsa(North((
356(
519(
102(
28.7(
Builsa(South((
356(
519(
66(
18.5(
Pusiga((
356(
519(
79(
22.2(
Tempa
ne((
356(
519(
45(
12.6(
Bind
uri((
356(
519(
80(
22.5(
Garu((
356(
519(
43(
12.1(
Bolgatan
ga(East((
356(
519(
86(
24.2(
Bawku(W
est((
356(
519(
129(
36.2(
Bunkpu
rugu
XNakpa
nduri(
356(
519(
54(
15.2(
Cheripon
i(35
6(51
9(71
(19
.9(
Mam
prug
u(Moa
gduri(
356(
519(
65(
18.3(
Yunyoo
XNasua
n(35
6(51
9(22
(6.2(
Dormaa(East(D
istrict(
356(
519(
110(
30.9(
Dormaa(W
est(D
istrict(
356(
519(
111(
31.2(
Jaman
(North(District(
356(
519(
137(
38.5(
Tain(District(
356(
519(
157(
44.1(
Band
a(District(
356(
519(
74(
20.8(
Berekum(W
est(D
istrict(
356(
519(
113(
31.7(
Asun
afo(South(
356(
519(
125(
35.1(
Asutifi(North(
356(
519(
139(
39.0(
Asutifi(Sou
th(
356(
519(
102(
28.7(
Kintam
po(Sou
th(
356(
519(
137(
38.5(
Nkoranza(North(
356(
519(
113(
31.7(
Pru(East(
356(
519(
73(
20.5(
Sene
(East(
356(
519(
86(
24.2(

101
100"
"MMDAs(
Req
uire
men
ts(
Actua
l(%(of(minim
um(
Cove
red((
Sene
(West(
356(
519(
142(
39.9(
Techim
an(North(
356(
519(
136(
38.2(
Pru(West(
356(
519(
65(
18.3(
Agon
a(East(D/A((
356(
519(
156(
43.8(
Abura/Aseb
u/Kw
aman
kese((
356(
519(
125(
35.1(
Assin(South(D/A((
356(
519(
164(
46.1(
Assin(North(D/A((
356(
519(
68(
19.1(
Awutu(Senya(D/A((
356(
519(
131(
36.8(
Ajum
ako/En
yan/Essiam
((35
6(51
9(15
9(44
.7(
Asikum
a/Odo
ben/Brakwa(((
356(
519(
171(
48.0(
Ekum
fi(D/A((
356(
519(
62(
17.4(
Gom
oa(Cen
tral(D/A((
356(
519(
139(
39.0(
Gom
oa(East(D
/A((
356(
519(
95(
26.7(
Gom
oa(W
est(D
/A((
356(
519(
186(
52.2(
Twifo
(Hem
ang(Lower(Den
kyira
((35
6(51
9(91
(25
.6(
Twifo
(Atti(M
orkw
a((
356(
519(
182(
51.1(
Upp
er(Den
kyira
(West(D
/A((
356(
519(
124(
34.8(
Karaga(District(
356(
519(
99(
27.8(
Kpan
dai(D
istrict(
356(
519(
65(
18.3(
Kumbu
ngu(District(
356(
519(
151(
42.4(
Mion(District(
356(
519(
110(
30.9(
Nan
ton(District(
356(
519(
99(
27.8(
Nan
umba
(Sou
th(District(
356(
519(
86(
24.2(
Sabo
ba(District(
356(
519(
126(
35.4(
Tatale(San
guli(District(
356(
519(
60(
16.9(
Tolon(District(
356(
519(
159(
44.7(
Zabzug
u(District(
356(
519(
77(
21.6(
Bole(
356(
519(
64(
18.0(
Central(G
onja(
356(
519(
68(
19.1(
North(Gon
ja(
356(
519(
44(
12.4(
SawlaXTun
aXKalba(
356(
519(
48(
13.5(
West(G
onja(
356(
519(
64(
18.0(
North(East(G
onja(
356(
519(
41(
11.5(
Total(
5253
2(76
293(
1560
3(29
.7(
( Staff(Stre
ngth
s(of(MMDAs(at(the
(reg
iona
l(leve
l(
Reg
ion(
REQ
UIREM
ENTS
(ACTU
AL(
GAP((M
AX(X(ACTU
AL)(
%(COVER
ED(
Minim
um(
Max
imum
(20
19(
Ashanti"
17,632
(26
,002
(4,51
9(19
711(
17.4(
Volta
(77
10(
1133
5(42
88(
7047
(37
(Oti(
3,06
6(4,49
4(61
6(3,87
8(13
.7(

102
101"
"
Eastern(
1337
8(19
350(
4278
(13
372(
22.1(
Western(
6218
(92
41(
2355
(67
84(
25.5(
Western(North(
3531
(51
84(
2915
(22
69(
56.23(
Greater(Accra(
13,446
(20
,027
(4,71
7(15
,310
(23
.6(
Upp
er(W
est(
4352
(63
93(
1070
(53
23(
16.7(
Upp
er(East(
4191
(61
32(
1470
(46
62(
24(
North(East(
2354
(34
56(
455(
3001
(13
.2(
Bono
(49
26(
7254
(20
87(
4817
(28
.8(
Ahafo(
2463
(36
27(
951(
2676
(26
.2(
Bono
(East(
4352
(63
93(
1577
(48
16(
24.7(
Cen
tral(
8957
(13
222(
3116
(95
29(
23.57(
Sava
nnah
(26
01(
3804
(39
4(34
10(
10.4(
( Reg
iona
l(Distribut
ion(of(1D
1F(Int
erve
ntions
(((
SECTO
R(
Reg
ion(
Agr
o(Pro
cessing(
Man
ufac
turing
(Live
stock
(Oth
ers(
Total(
Percen
t(Sh
are(
Asha
nti(
8(14
(2(
1(24
(20
.17(
Ahafo(
0(2(
0(0(
2(1.68
(Bo
no(
5(2(
0(0(
7(5.88
(Bo
no(East(
2(0(
0(0(
2(1.68
(Ce
ntral(
5(1(
0(0(
6(5.04
(Eastern(
9(16
(0(
0(25
(21
.01(
Greater(Accra(
3(30
(0(
1(34
(28
.57(
Northern(
1(2(
0(0(
3(2.52
(North(East(
0(0(
0(0(
0(0.00
(Oti(
1(0(
0(0(
1(0.84
(Savann
ah(
0(0(
0(0(
0(0.00
(Upp
er(East(
0(1(
0(0(
1(0.84
(Upp
er(W
est(
1(1(
0(0(
2(1.68
(Vo
lta(
5(1(
0(0(
6(5.04
(Western(
3(3(
0(0(
6(5.04
(Western(North(
0(0(
0(0(
0(0.00
(To
tal(
43(
73(
2(2(
120(
100(
Source:"Ministry"of"Trade"and"Industry"
" S tatus
(of(Im
plem
entation(of(One
(District(One
(Fac
tory((1D
1F)(Initiative
s(COMPA
NY(
DISTR
ICT(
REG
ION(
SECTO
R(
STATU
S(REM
ARKS
(
Sprin
gs(and
(Bolts(Com
pany(Lim
ited(
Kumasi(A
sokw
a(Asha
nti(
Man
ufacturin
g(In(ope
ratio
n(Man
ufacturin
g(Of(U
XBolts(and
(Leaf(Springs(and
(Trailor(S
uspe
nsion(
Casa(De(Ro
pa((
Gom
oa(W
est((
Central(
Agro(processing(
In(ope
ratio
n(Processing
(Orang
e(Fleshe
d(Sw
eet(Po
tato(into(
bread,(chips,(crips(an
d(biscuits(
Petersfie
ld(and
(Rey(Group
(Lim
ited(
Komen
da(Edina
(Egu
afo(Ab
irem(
Central(
Agro(processing(
In(ope
ratio
n(Processing
(of(p
ineapp
le(and
(orang
e(into(juices(
LK(In
ternationa
l(Co.(Lim
ited((M
otor(
King
)((Tamale(Metropo
litan
(Northern(
Man
ufacturin
g(In(ope
ratio
n(Assembling,(distrib
ution(
and(
mainten
ance(of(motor(bikes,(tricycles,(
bicycles(etc(

103
102"
"
COMPA
NY(
DISTR
ICT(
REG
ION(
SECTO
R(
STATU
S(REM
ARKS
(
B5(Plus(Alloys((
Ningo
(Prampram
(Greater(Accra(
Man
ufacturin
g(In(ope
ratio
n(Prod
uctio
n(of(Steel(and
(related(prod
ucts((
Golde
n(Milan(Limite
d(Ningo
(Prampram
(Greater(Accra(
Man
ufacturin
g(In(ope
ratio
n(Man
ufacturin
g(of(aluminum
(profile(to(sup
port(th
e(constructio
n(indu
stry(
Agric
ultural,(Indu
stria
l(and
(Com
mercial(
Prod
ucts(AICP(Limite
d (Kw
abre(M
unicipal(
Asha
nti(
Man
ufacturin
g(In(ope
ratio
n(Processing
(of(charcoal(into(activ
ated
(carbo
n(an
d(related(prod
ucts(for(
expo
rt(
Zurie
l(Carbo
n((
Kwah
u(West(
Eastern(
Man
ufacturin
g(In(ope
ratio
n(Man
ufacturin
g(of(briq
uettes(from
(saw
(dust(for(th
e(expo
rt(m
arket(
Kete(Krachie(Tim
ber(R
ecovery(Limite
d.(
Asuo
gyam
an(
Eastern(
Man
ufacturin
g(In(ope
ratio
n(Th
e(compa
ny(uses(a(robu
st(und
erwater(lo
gging(system
(to(recover(tree
s(from
(the(Vo
lta(Lake(an
d(process(it(into(woo
d(an
d(woo
d(prod
ucts(
Maagrace(Indu
strie
s(Limite
d(New
(Juab
en(M
unicipal(Assem
bly(
Eastern(
Man
ufacturin
g(In(ope
ratio
n(Man
ufacturin
g((of(various(ty
pes(of(Garmen
t(Lan(Tian
yi(Com
pany(Lim
ited.(
Shai(Osudo
ku(
Greater(Accra(
Agro(processing(
In(ope
ratio
n(Cu
ltivatio
n(an
d(processing
(of(soy(into(m
ilk.((
Ankod(Indu
strie
s(Shai(Osudo
ku(
Greater(Accra(
Man
ufacturin
g(In(ope
ratio
n(Man
ufacturin
g(an
d(distrib
ution(of(ro
ofing(shee
ts,(and
(related(prod
ucts(
Keda
(Ceram
ics(Co
mpa
ny(Lim
ited.((
Sham
a(Western(
Man
ufacturin
g(In(ope
ratio
n(Prod
uctio
n(of(Ceram
ic(Tiles(from
(clay(
Sund
a(Gha
na(Diape
rs(Lim
ited(
Ga(South(
Greater(Accra(
Man
ufacturin
g(In(ope
ratio
n(Prod
uctio
n(of(Diape
rs(and
(San
itary(Nap
kins(
Asam
oah(an
d(Yamoa
h(Farm
s(Atwim
a(Kw
anwom
a(Asha
nti(
Agro(processing(
In(ope
ratio
n(Re
aring(an
d(processing
(of(p
oultry(an
d(related(prod
ucts(
Prefos(Gha
na(Lim
ited.((
Ejisu(Mun
icipal((
Asha
nti(
Man
ufacturin
g(In(ope
ratio
n(Man
ufacture(of(stree
t(lights(an
d(po
les(includ
ing(de
livery(of(electric
al(and
(related(services( (
Birim
(Oil(Mills(Limite
d((
Kwaebibrim
((Eastern(
Agro(processing(
In(ope
ratio
n(Processing
(of(O
il(Pa
lm(into(edible(oil.(((
Appa
h(Farm
s(Limite
d.((
Kwah
u(East((
Eastern(
Agro(processing(
In(ope
ratio
n(Re
aring(an
d(processing
(of(p
oultry(into(m
eat(a
nd(re
lated(prod
ucts.((
KAD(In
dustrie
s(Ac
cra(Metropo
litan
(Greater(Accra(
Man
ufacturin
g(In(ope
ratio
n(Man
ufacturin
g(of(garmen
ts(
Navina(Ca
rtel(Garmen
ts((
Okaikoi(North((
Greater(Accra(((
Man
ufacturin
g(In(ope
ratio
n(Garmen
t(and
(App
arel(produ
ction((
Unijay(Garmen
ts(Ltd.(
Asokwa,(Ashan
ti((
Asha
nti(
Man
ufacturin
g(In(ope
ratio
n(Man
ufacturin
g(of(various(types(of(garm
ent(for(bo
th(local(and
(export(
markets((
Strong
men
(Foo
ds(&(Farms(Ltd.(
Yilo(Krobo
((Eastern(
Agro(processing(
In(ope
ratio
n(Cu
ltivatio
n,(m
illing(an
d(distrib
ution(of(rice((
Inno
vatio
n(&(M
anufacturin
g(Group
(Kp
one((
Greater(Accra(
Man
ufacturin
g(In(ope
ratio
n(Prod
uctio
n(of(biscuits,(con
fectione
ry(and
(related(prod
ucts((
Gee
(Fresh(Com
pany(Ltd.(
Tamale(Metropo
litan
(Northern(
Agro(processing(
In(ope
ratio
n(Re
aring(an
d(processing
(of(g
uine
a(fowl((
Nou
rishe
r(Processing(Gha
na(Ltd(
Accra(Metropo
litan
(Greater(Accra(
Man
ufacturin
g(In(ope
ratio
n(Fruit(juice(processing((
Calte
ch(Ven
tures(Ltd(
Ho(Mun
icipal((
Volta
(Ag
ro(processing(
In(ope
ratio
n(Prod
uctio
n(an
d(processing
(of(cassava(into(Ethan
ol(and
(Carbo
n(Dioxide
((Hom
e(Fo
ods(Processing
(Tema(Mun
icipal((
Greater(Accra((
Man
ufacturin
g(In(ope
ratio
n(prod
uctio
n(of(Veg.(o
il.(Spices/Pe
ppers/(Ready(to
(eat(m
eals(
Everpu
re(Gha
na(Ltd(
Ga(South(
Greater(Accra((
Man
ufacturin
g(In(ope
ratio
n(Prod
uctio
n(of(m
ineral,(sachet(a
nd(flavoured
(water(a
nd(intravano
us(
infusion
((Linise(Lim
ited(
Sunyan
i(West(
Bono
(Ag
ro(processing(
In(ope
ratio
n(Prod
uce(
and(
process(
maize(for(
the(
poultry(
indu
stry(an
d(hu
man
(consum
ption(
Delaw
in(Farms(Ltd((
Kpon
e(Kataman
so(
Greater(Accra((
Man
ufacturin
g(In(ope
ratio
n(Re
aring(an
d(processing
(pou
ltry(an
d(related(prod
ucts.((
Obibini(Blackman
(Com
pany(Lim
ited(
Suam
e(Asha
nti(
Man
ufacturin
g(In(ope
ratio
n(Prod
uctio
n(of(Alcoh
olic(and
(Non
XAlcoh
olic(beverages(
Wen
tec(Co
mpa
ny((
Accra(Metro((
Greater(Accra((
Man
ufacturin
g(In(ope
ratio
n(Prod
uctio
n(sachet(and
(water(labe
ls(
Yede
nt(Agro(Limite
d((
Sunyan
i(East((
Bono
(Ag
ro(processing(
In(ope
ratio
n(Processing
(of(soya(be
an,(m
aize(and
(other(cereals(
Sund
a(Gha
na(In
vestmen
t(Com
pany(Ltd(
Ga(South(
Greater(Accra(
Man
ufacturin
g(In(ope
ratio
n(Prod
uctio
n(of(Hardw
are(e.g.(Roo
fing(Shee
t,(Iro
n(rod(an
d(na
ils(
Shab
a(En
terprise(
Kwah
u(West((
Eastern(
Man
ufacturin
g(In(ope
ratio
n(Man
ufacture(of(coo
kers(and
(other(electric
als(
Pam(Pha
rmaceu
ticals(Ltd.((
Akwap
im(Sou
th(((
Eastern((
Man
ufacturin
g(In(ope
ratio
n(Man
ufacture(of(P
harm
aceu
tical(prodcuts((
Integrated
(Com
post(&(Recycling(Plan
t(Ltd((
Accra(Metropo
litan
(Greater(Accra(
Man
ufacturin
g(In(ope
ratio
n(Re
cycling(of(waste(into(com
post((
Nordiq(Hygiene
(Care(Indu
strie
s(Ltd.((
Tema(Mun
icipal((
Greater(Accra(
Man
ufacturin
g(In(ope
ratio
n(Prod
uctio
n(of(Diape
rs(and
(San
itary(Nap
kins(
Sentuo
(Ceram
ic(Gha
na(
Kpon
e(Kataman
so(
Greater(Accra(
Man
ufacturin
g(In(ope
ratio
n(Prod
uctio
n(of(Ceram
ic(Tiles(an
d(related(prod
ucts(

104
103"
"
COMPA
NY(
DISTR
ICT(
REG
ION(
SECTO
R(
STATU
S(REM
ARKS
(
Miro
(Forestry(Limite
d(Sekyere(Afram(Plains(
Asha
nti(
Man
ufacturin
g(In(ope
ratio
n(Man
ufacturin
g(of(ven
eer(a
nd(plywoo
d(Brom
pton
(Portfolio(
Akua
pim(Sou
th(M
unicipal((
Eastern(
Man
ufacturin
g(In(ope
ratio
n(Man
ufacturin
g(of(to
ilet(roll((
Skyline(Stee
l(Com
pany(Lim
ited((
Ejisu(
Asha
nti(
Man
ufacturin
g(In(ope
ratio
n(Man
ufacturin
g(of(steel(ro
ofing(tiles((
Mass(Indu
strie
s(Limite
d(Kp
one(Kataman
so(
Greater(Accra(
Man
ufacturin
g(In(ope
ratio
n(Prod
uctio
n(of(Buiscuits(etc.(
De(United(Fo
ods(Indu
strie
s(Limite
d(Tema(West(
Greater(Accra(
Man
ufacturin
g(In(ope
ratio
n(Man
ufacture(of(n
oodles(and
(Spa
ghetti(
Hap
py(Sun
shine(Co
mpa
ny(Lim
ited(
Suhu
m(
Eastern(
Agro(processing(
In(ope
ratio
n(Man
ufacturin
g(of(can
ned(tomatoe
(Glofert(Gha
na((
Suhu
m(
Eastern(
Man
ufacturin
g(In(ope
ratio
n(Prod
uctio
n(of(fe
rtilizer(to(supp
ort(a
griculture(
Ekum
fi(Fruit(P
rocessing(Co
mpa
ny(
Ekum
fi(Ce
ntral(
Agro(processing(
In(ope
ratio
n(Prod
uctio
n(an
d(processing
(of(p
ineapp
le(into(juice(
Leefou
nd(Com
pany(Lim
ited(
Ningo
(Prampram
(Greater(Accra(
Agro(processing(
In(ope
ratio
n(Prod
uctio
n(of(to
mato(pu
ree,(ketchup
(and
(shitto(
Prem
ium(Foo
ds((
Ejisu(JUAB
ENG(M
unicipal((
Asha
nti(
Agro(processing(
In(ope
ratio
n(Fo
od(Processing((
Zond
a(Sino
truk(Assem
bly(Plan
t(Ltd(
Kpon
e(Kataman
so(
Greater(Accra(
Man
ufacturin
g(In(ope
ratio
n(Assembling(an
d(marketin
g(of(heavy(and
(ligh
t(duty(vehicles((
Ayum
(Forest(P
rodu
cts((
Asua
nafo(North((
Ahafo((
Man
ufacturin
g(In(ope
ratio
n(Processing
(of(tim
bers(lo
gs(in
to(various(ty
pes(of(woo
d(prod
ucts(in
clud
ing,(
vene
er(and
(plywoo
d(Prim
e(Hold((
Ayen
suan
o(Eastern(
Man
ufacturin
g(In(ope
ratio
n(Prod
uctio
n(of(re
fined
(fuel(oil(from
(waste(ru
bber((
KYF(Indu
stria
l(Com
pany(Ltd.((
Sunyan
i(East((
Bono
(Man
ufacturin
g(In(ope
ratio
n(Prod
uctio
n(of(lon
gXspan
(roo
fing(
shee
ts(to(
supp
ort(the(
constructio
n(indu
stry(
Golde
n(Afric
a(Co
sumer(Produ
cts(Gha
na(
LIMITED
((Kp
one(Taman
so(M
unicipal(
Greater(Accra(
Man
ufacturin
g(In(ope
ratio
n(Prod
uctio
n(of(pow
der(d
etergents(an
d(liquid(multiXpu
rpose(de
tergen
ts((
(Amalgamated
(Foo
ds(Lim
ited((
Accra(Metropo
litan
(Greater(Accra(
Man
ufacturin
g(In(ope
ratio
n((Produ
ction(of(animal(fe
ed(((
Anok(Gyes(Farm
s(Limite
d(Wiamoa
se(
Asha
nti(
Man
ufacturin
g(In(ope
ratio
n(Pig(Feed
(Produ
ction(
Bibian
i(Log
ging
(Lim
ited(((
Asokwa(Mun
icipal(Assem
bly(
Asha
nti(
Man
ufacturin
g(In(ope
ratio
n(Man
ufacturin
g(of(woo
d(prod
ucts((
Bofas(Co
mpa
ny(Lim
ited(
Wa(Ce
ntral(
Upp
er(W
est(
Man
ufacturin
g(In(ope
ratio
n(Shea(butter(P
rocessing(
Dagan
(Farms(Ltd.(
Asuo
gyam
an((
Eastern(
Agro(processing(
In(ope
ratio
n(Fish(fa
rming(an
d(processing
(EK
A(Fo
ods((
Sunyan
i(East((
Bono
(Ag
ro(processing(
In(ope
ratio
n(Processing
(of(vegetab
les((
Envirotech(bam
booLim
ited(
Odu
m(Kum
asi(
Asha
nti(
Man
ufacturin
g(In(ope
ratio
n(Ba
mbo
o(bike(m
anufacturin
g(Fean
za(In
dustrie
s((
Ellembe
lle(
Western(
Agro(processing(
In(ope
ratio
n(Processing
(of(C
ocon
ut(oil((
Harmon
y(Tren
ds(
LedzokukuXkrow
or(
Greater(Accra(
Man
ufacturin
g(In(ope
ratio
n(Ap
parel(M
anufacturin
g(K(Bo
ah(Autom
ation(an
d(Weigh
ing(
System
s(Takoradi(
Western(
Man
ufacturin
g(In(ope
ratio
n(Supp
ly(of(A
utom
ated
(Weigh
ing(Scale(
M(&(B(See
d(an
d(Ag
ricultural(Services(
Gha
na(
Ho(Mun
icipal((
Volta
(Ag
ro(processing(
In(ope
ratio
n(Seed
(multip
lication(
Omnifert(Lim
ited(
New
(Daw
henya,(Ningo
XPrampram
(District,((
Greater(Accra(
Man
ufacturin
g(In(ope
ratio
n(Fertilizer(M
anufacturin
g(
Patex(Limite
d(Bo
lgatan
ga(
Upp
er(East(
Man
ufacturin
g(In(ope
ratio
n(Expo
rtation(of(baskets((Straw
(baskets)(
Plot(Com
odities(Gha
na(Lim
ited(
LedzokukuXkrow
or(
Greater(Accra(
Other(
In(ope
ratio
n(Creativ
e(ArtXOnline(TV
(Profad
(Glazing
(System(Lim
ited(
Aden
tan(Mun
icipal(
Greater(Accra(
Man
ufacturin
g(In(ope
ratio
n(Man
ufacturin
g(of(aluminum
(profile(to(sup
port(th
e(constructio
n(indu
stry(
ProXLife(In
fusion
s(Limite
d(JamasiXY
onso,(Sekyere(Sou
th(
Asha
nti(
Man
ufacturin
g(In(ope
ratio
n(Man
ufacturin
g(of(Pha
rmaceu
ticals(
SamXDen
(Oil(Mills(Limite
d(Takoradi(
Western(
Agro(processing(
In(ope
ratio
n(Oil(Pa
lm(Processing(
Savana
(Foo
ds(Empire(Lim
ited(
Wa(Ce
ntral(
Upp
er(W
est(
Agro(processing(
In(ope
ratio
n(Processing
(of(Soya(beans(in
to(cake(an
d(refin
ed(soy(oil(for(do
mestic(and
(indu
stria
l(purpo
ses(
Top(Creativ
ity(In
dustrie
s(Limite
d(Tema(Mun
icipal((
Greater(Accra(
Man
ufacturin
g(In(ope
ratio
n(Processing
(of(N
atural(Cocoa
(into(cocoa
(pow
der(
Volta
(Forest(P
rodu
cts(Co
mpa
ny((
Hoh
oe(M
unicipal((
Volta
(Man
ufacturin
g(In(ope
ratio
n(Woo
d(processing
(

105
104"
"
COMPA
NY(
DISTR
ICT(
REG
ION(
SECTO
R(
STATU
S(REM
ARKS
(
Gha
na(Rub
ber(E
states(Ltd((G
REL)(
Ahan
ata(West(M
unicipal(
Western(
Man
ufacturin
g(In(ope
ratio
n(Natural(ru
bber(produ
ction(
Ada(Prem
ium(Diape
rs(Com
pany(
Ada(
Greater(Accra(
Man
ufacturin
g(Und
er(Con
struction(
Prod
uctio
n,(Diape
rs,(San
itary,(Pillow
(and
(related(prod
ucts(((
Afric
an(Europ
ean(Textiles((
Tamale(Metropo
litan
(Northern(
Man
ufacturin
g(Und
er(Con
struction(
Man
ufacturin
g(of(C
otton(
Yarns(to(sup
port(the
(textiles(a
nd(g
armen
t(indu
stry(
Beatex(Enterprise(Limite
d(Kp
one(X(K
atam
anso((
Greater(Accra((
Man
ufacturin
g(Und
er(Con
struction(
Prod
uctio
n(of(M
osqu
ito(Coils(and
(related(prod
ucts((
Central(O
il(Mills(Limite
d(Lower(Den
kyira
(Ce
ntral(R
egion(
Agro(processing(
Und
er(Con
struction(
Oil(Pa
lm(Produ
ction(an
d(Processing
(Ch
ocho
(Indu
strie
s(Suhu
m(M
unicipal(
Eastern(
Man
ufacturin
g(Und
er(Con
struction(
Man
ufacturin
g(of(Herba
l(produ
cts(
Eskay(Th
erap
eutics(Limite
d(Ac
cra(Metro(
Greater(Accra((
Man
ufacturin
g(Und
er(Con
struction(
Man
ufacturin
g(an
d(distrib
ution(of(pha
rmaceu
tical(produ
cts((
GKV
(Investmen
t(Lim
ited(
Sekond
i(X(Takorad
i(Metro(
Western(
Agro(processing(
Und
er(Con
struction(
Coconu
t(Produ
ction(into(cocon
ut(oil(
Josm
a(Ag
ro(Lim
ited(
Mam
pong
(Mun
icipal(
Asha
nti(
Agro(processing(
Und
er(Con
struction(
Processing
(of(C
assava(into(Starch(an
d(Flou
r(Kasapreko(Gha
na(X(Asha
nti((
Kwad
aso(Mun
icipal((
Asha
nti(
Agro(processing(
Und
er(Con
struction(
Fruit(juice(and
(water(processing((
Kojach(Lim
ited((
Oforik
rom(M
etropo
litan
(Asha
nti(
Man
ufacturin
g(Und
er(Con
struction(
Prod
uctio
n(an
d(pa
ckaging(of(pha
rmaceu
tical(produ
cts(
Oserby(Uniqu
e(Ve
ntures((
Ejisu(Mun
icipal(
Asha
nti(
Agro(processing(
Und
er(Con
struction(
Rearing(
and(
processing
(of(livestock(includ
ing(
poultry,(pigs(an
d(aq
uacultu
re(
Osiad
an(Con
cretes(Produ
cts(Ltd((
Weija(Gba
we(Mun
icipal(
Greater(Accra(
Man
ufacturin
g(Und
er(Con
struction(
Man
ufacturin
g(of(con
crete(prod
ucts((
Profad
(Glazing
(System(Lim
ited((
Aden
tan(Mun
icipal((
Greater(Accra(
Man
ufacturin
g(Und
er(Con
struction(
Man
ufacturin
g(of(aluminum
(profile(to(sup
port(th
e(constructio
n(indu
stry(
Abab
io(Express(((
AsokoreXMam
pong
((Asha
nti((
Agro(processing(
Und
er(Con
struction(
Prod
uctio
n(of(fruit(juice(and
(con
centrates(
Agric
ultural(M
anufacturin
g(Group
(Ningo
XPrampram
(Greater(Accra(
Man
ufacturin
g(Und
er(Con
struction(
Fertilizer(M
anufacturin
g(Ateb
ubuXAm
antin
(Agro(Processing
((Ateb
ubuX(Aman
tin(
Bono
(East(
Agro(processing(
Und
er(Con
struction(
Prod
uctio
n(an
d(Processing
(of(Ca
ssava(into(in
dustria
l(starch,(ethan
ol(and
(related(prod
ucts(to
(sup
port(indu
stry(
Atlantic(Life
sciences(Lim
ited((
Ningo
XPrampram
(Greater(Accra(
Man
ufacturin
g(Und
er(Con
struction(
Man
ufacturin
g(of(pha
rmaceu
tical(and
(related(prod
ucts(
Best(Fertilizer(Lim
ited((
Asha
nti(A
kim(Sou
th(
Asha
nti(
Man
ufacturin
g(Und
er(Con
struction(
Prod
uctio
n(of(fe
rtilizer((
Blue
(Cross(In
fusion
(Gha
na(Ltd.(
Ga(West(
Greater(Accra(
Man
ufacturin
g(Und
er(Con
struction(
Man
ufacturin
g(of(In
fusion
s(prod
ucts(
Bodu
kwan
(Farms(Limite
d(Atwim
a(Kw
anwom
a(District(
Asha
nti(R
egion(
Agro(processing(
Und
er(Con
struction(
Man
go(Cultiv
ation(an
d(Processing
(into(juice(an
d(othe
r(produ
cts((
Builders(Assessories(Limite
d(Sekyere(South(District(
Asha
nti(R
egion(
Man
ufacturin
g(Und
er(Con
struction(
Wareh
ousing
(Ce
ntral(Sug
ar(Com
pany(Ltd(
Pru(East(District((
Bono
(East((
Agro(processing(
Und
er(Con
struction(
Prod
uctio
n(an
d(Processing
(of(Ca
ssava(into(in
dustria
l(starch,(ethan
ol(and
(related(prod
ucts(to
(sup
port(indu
stry(
Cham
pion
(Beverages((
LedzekukuXKrow
or(M
unicipal(
Greater(Accra(
Agro(processing(
Und
er(Con
struction(
Prod
uctio
n(of(Fruit(Drin
ks(and
(Non
Xalcoh
olic(Beverages(
CHXGloba
l(Lim
ited(
Krachi(East(
Oti(
Agro(processing(
Und
er(Con
struction(
Cultivatio
n(an
d(Processing
(of(C
assava(
Deb
ridge(Com
pany(Ltd.((
Ho(Mun
icipal(
Volta
(Ag
ro(processing(
Und
er(Con
struction(
Rearing(an
d(Procesing(of(fish(
Dorothy(Kan
i(Com
pany(Lim
ited(
East(Akim(
Eastern(
Agro(processing(
Und
er(Con
struction(
Cultivatio
n(an
d(Processing
(of(O
rang
e(Flesh(Sw
eet(P
otato(
EKA(Fo
ods((
Sunyan
i(East((
Bono
(Ag
ro(processing(
Und
er(Con
struction(
Food
(Processing((
Entran
ce(In
dustrie
s(Ltd(
LedzekukuXKrow
or(M
unicipal(
Greater(Accra(
Man
ufacturin
g(Und
er(Con
struction(
Man
ufacturin
g(of(pha
rmaceu
tical(and
(related(prod
ucts(
Farm
(Fresh(Foo
ds(Lim
ited(
Lower(Den
kyira
(Ce
ntral(
Agro(processing(
Und
er(Con
struction(
Poultry(processing
(King
sgate(Co
mpa
ny(Lim
ited(
Efutu(Mun
icipal((
Central((
Man
ufacturin
g(Und
er(Con
struction(
Man
ufacturin
g(of(biscuits(and
(related(prod
ucts((
KOP(Farm
s(Co
nsultancy(Services(Ltd(
South(To
ngu((
Volta
(Ag
ro(processing(
Und
er(Con
struction(
Cultivatio
n(an
d(processing
(of(g
rains((
Mikad
do(Lab
oratories(
Tema(Mun
icipal(
Greater(Accra(
Man
ufacturin
g(Und
er(Con
struction(
Man
uifacturing(of(pha
rmaceu
tical(produ
cts(
Mira
cle(Fruits(Processing(Gha
na(
Suhu
m(Krabo
a(Co
altar((
(Eastern(
Agro(processing(
Und
er(Con
struction(
Cultivatio
n(an
d(Processing
(of(M
iracle(be
rries(
Mod
ern((Odike)(V
entures(Ltd.(
Afigya(Kwab
re(Sou
th((
Asha
nti(
Man
ufacturin
g(Und
er(Con
struction(
Man
ufacture(of(various(ty
pes(of(garmen
t(Nan
o(Fo
ods(Limite
d((
Akua
pim(Sou
th(M
unicipal((
Eastern(
Man
ufacturin
g(Und
er(Con
struction(
Prod
uctio
n(of(Fruit(Drin
ks(and
(Mineral(W
ater(
OSR
(Beverage(&(Bottling
(Lim
ited(
Aden
tan(
Greater(Accra(
Man
ufacturin
g(Und
er(Con
struction(
Prod
uctio
n(of(Non
XAlcho
lic(Beverages(

106
105"
"
COMPA
NY(
DISTR
ICT(
REG
ION(
SECTO
R(
STATU
S(REM
ARKS
(
Rhovan
ni(Royal(Ltd(
Tano
(Sou
th((
Ahafo(
Man
ufacturin
g(Und
er(Con
struction(
Prod
uctio
n(of(burnt(bric
ks,(p
avem
ent(b
locks,(ro
ofing(tiles(etc(from
(clay.(
SBA(Co
mpa
ny(Ltd((A
shan
ti(Fo
ods)(
Bosomtw
e((
Asha
nti(
Agro(processing(
Und
er(Con
struction(
Processing
(and
(can
ning
(of(A
ckee
(fruits(fo
r(export(
Soshad
a(Co
mpa
ny(Lim
ited(
Suhu
m(Krabo
a(Co
altar((
Eastern(
Man
ufacturin
g(Und
er(Con
struction(
Cultivatio
n(an
d(procesing(of(vegetab
les,(Onion
s,(Okro(etc.((
Sino
ston
e(Alcoho
l(Man
ufacturin
g(Ltd.(
North(Ton
gu((
Volta
(Man
ufacturin
g(Und
er(Con
struction(
Processing
(of(C
assava(into(alcoh
ol(
Supe
r(Con
tec(Co
mpa
ny(Lim
ited(
Accra((
Greater(accra(
Man
ufacturin
g(Und
er(Con
struction(
Man
ufactin
g(of(Con
sumer(Electronics(
Voalys(Farms(Limite
d(Afigya(Kwab
re(Sou
th((
Asha
nti(
Agro(processing(
Und
er(Con
struction(
Livestock(rearing(an
d(processing
((Wed
di(Africa(Limite
d(Be
rekum(M
unicipal(
Bono
(Region(
Agro(processing(
Und
er(Con
struction(
Cultivatio
n(an
d(Processing
(of(tom
atoe
s(into(to
mato(pa
ste(
Yantab
(Produ
cts(Limite
d((
Dormaa(East((
Bono
(Man
ufacturin
g(Und
er(Con
struction(
Recycling(of(pap
er(to
(produ
ce(eggs(crate,(cartons(and
(related(prod
ucts(
Kaskazini(
((
Bekw
ai(M
unicipality
((
Asha
nti(
AgroXProcessing(
In(Ope
ratio
n(Processing
(of(O
il(Pa
lm(into(edible(oil.(((
Source:"Ministry"of"Trade"and"Industry"
( E mploym
ent(crea
ted(by
(58(1d
1f(Pro
jects(Und
er(O
pera
tion(
No.(
COMPA
NY(
ACTIVITY(
DISTR
ICT(
REG
ION(
EMPL
OYM
ENT(
DIREC
T(IN
DIREC
T(1(
Pam(Pha
rmaceu
ticals(Ltd.((
Man
ufacture(of(P
harm
aceu
tical(produ
cts((
Akwap
im(Sou
th(((
Eastern((
422(
116(
306(
2(Prefos(Gha
na(Lim
ited.((
Man
ufacture(of(stree
t(lights(an
d(po
les(includ
ing(de
livery(of(
electrical(and
(related(services( (
Ejisu(Mun
icipal((
Asha
nti(
82(
57(
25(
3(Brom
pton
(Portfolio(
Man
ufacturin
g(toilet(roll((
Akua
pim(Sou
th(M
unicipal((
Eastern(
105(
25(
80(
4(Profad
(Glazing
(System(Lim
ited(
Man
ufacturin
g(roofing(shee
t(Ad
entan(Mun
icipal(Assem
bly(
Greater(Accra(
57(
57(
X(5(
Osiad
an(Con
cretes(Produ
cts(Ltd(
Man
ufacturin
g(of(con
crete(prod
ucts(
Weija(Gba
we(
Greater(Accra(
15(
15(
X(6(
Ankod(Indu
strie
s(Man
ufacturin
g(an
d(distrib
ution(of(ro
ofing(shee
ts,(and
(related(prod
ucts(
Shai(Osudo
ku(
Greater(
ACCR
A(12
0(12
0(X(
7(Golde
n(Milan(Limite
d(Man
ufacturin
g(of(aluminium(profile(to(sup
port(th
e(constructio
n(indu
stry(
Ningo
(Prampram
(Greater(
ACCR
A(10
0(80
(20
(
8(Zu
riel(C
arbo
n((
Man
ufacturin
g(of(briq
uettes(from
(saw
(dust(for(th
e(expo
rt(
market (
(
Kwah
u(West(
Eastern(
91(
30(
61(
9(Skyline(Stee
l(Com
pany(Lim
ited((
Man
ufacturin
g(of(steel(ro
ofing(tiles((
Ejisu(
Asha
nti(
45(
45(
X(10
(Sprin
gs(and
(Bolts(Com
pany(Lim
ited(
Man
ufacturin
g(Of(U
XBolts(and
(Leaf(Springs(and
(Trailor(
Suspen
sion
(Ku
masi(A
sokw
a(Asha
nti(
65(
65(
X(
11(
LK(In
ternationa
l(Co.(Lim
ited((M
otor(King)((
Assembling,(distribution(an
d(mainten
ance(of(m
otor(bikes,(
tricycles,(bicycles(etc(
Tamale(Mun
icipal(
Northern(
392(
45(
347(
12(
Shab
a(En
terprise(
Man
ufacture(of(coo
kers(and
(other(electric
als(
Kwah
u(West((
Eastern(
65(
20(
45(
13(
B5(Plus(Alloys((
Prod
uctio
n(of(Steel(and
(related(prod
ucts((
Ningo
(Prampram
(Greater(Accra(
1,90
0(1,90
0(X(
14(
Sentuo
(Ceram
ic(Gha
na(
Prod
uctio
n(of(Ceram
ic(Tiles(an
d(related(prod
ucts(
Tema(Mun
icipal((
Greater(Accra(
850(
300(
550(
15(
KEDA(Ce
ramics(Co
mpa
ny(Lim
ited.((
Prod
uctio
n(of(Ceram
ic(Tiles(from
(clay(
Sham
a(Western(
2,79
2(60
0(2,19
2(16
(Ke
te(Krachie(Tim
ber(R
ecovery(Limite
d.(
The(compa
ny(uses(a(robu
st(und
erwater(logging(system
(to(
recover(trees(from
(the(Vo
lta(Lake(an
d(process(it(into(woo
d(an
d(woo
d(prod
ucts(
Asuo
gyam
an(
Eastern(
55(
15(
40(
17(
Volta
(Forest(P
rodu
cts(Co
mpa
ny((
Woo
d(processing
((Hoh
oe(M
unicipal((
Volta
((4,00
0(85
(3,91
5(18
(Miro
(Forestry(Limite
d(Man
ufacturin
g(of(ven
eer(a
nd(plywoo
d((
Sekyere(Afram(Plains(
Asha
nti(
1,10
0(80
0(30
0(
19(
Sund
a(Gha
na(In
vestmen
t(Com
pany(Ltd(
Prod
uctio
n(of(Hardw
are(e.g.(Roo
fing(Shee
t,(Iro
n(rod(an
d(na
ils(
Ga(South(
Greater(Accra(
1,45
0(45
0(1,00
0(

107
106"
"No.(
COMPA
NY(
ACTIVITY(
DISTR
ICT(
REG
ION(
EMPL
OYM
ENT(
DIREC
T(IN
DIREC
T(20
(EK
A(Fo
ods((
AgroXProcessing(
Sunyan
i(East((
Bono
(1,47
0(20
(1,45
0(21
(Kaskazini(Ltd(
Processing
(of(p
alm(and
(kerne
l(oil(
Bekw
ai(M
unicipality
(Asha
nti(
30(
30(
X(22
(Lan(Tian
yi(Com
pany(Lim
ited.(
Cultivatio
n(an
d(processing
(of(soy(into(m
ilk.((
Shai(Osudo
ku(
Greater(
ACCR
A(50
0(40
(46
0(
23(
Strong
men
(Foo
ds(&(Farms(Ltd.(
Cultivatio
n,(m
illing(an
d(distrib
ution(of(rice((
Yilo(Krobo
((Eastern(
950(
700(
250(
24(
Fean
za(In
dustrie
s((
Processing
(of(C
ocon
ut(oil((
Ellembe
lle((
Western(
1,66
0(16
0(1,50
0(25
(Birim
(Oil(Mills(Limite
d((
Processing
(of(O
il(Pa
lm(into(edible(oil.(((
Kwaebibrim
((Eastern(
295(
95(
200(
26(
Petersfie
ld(and
(Rey(Group
(Lim
ited(
Processing
(of(p
ineapp
le(and
(orang
e(into(juices(
Komen
da(Edina
(Egu
afo(Ab
irem(
Central(
1,25
0(50
(1,20
0(27
(Yede
nt(Agro(Limite
d((
Processing
(of(soya(be
an,(m
aize(and
(other(cereals(
Sunyan
i(East((
Bono
(70
(70
(X(
28(
(Savana
(Foo
ds(Empire(Lim
ited(
Processing
(of(Soya(be
ans(into(cake(an
d(refin
ed(soy(oil(for(
domestic(and
(indu
stria
l(purpo
ses(
Wa(Ce
ntral(
Upp
er(W
est(
1,45
0(25
0(1,20
0(
(29
(Ca
sa(De(Ro
pa(
Processing
(Orang
e(Fleshe
d(Sw
eet(P
otato(into(bread
,(chips,(
crips(an
d(biscuits(
Gom
oa(W
est((
Central(
154(
154(
X(
30(
Linise(
Prod
uce(an
d(process(maize(fo
r(the
(pou
ltry(indu
stry(and
(hu
man
(con
sumption(
Sunyan
i(West(
Bono
(4,09
4(94
(4,00
0(
32(
Calte
ch(Ven
tures(Ltd(
Prod
uctio
n(an
d(processing
(of(cassava(into(Ethan
ol(and
(Ca
rbon
(Dioxide
(Ho(Mun
icipal((
Volta
(1,20
0(20
0(1,00
0(
(33
(Obibini(Blackman
(Com
pany(Lim
ited(
Prod
uctio
n(of(Alcoh
olic(and
(Non
XAlcoh
olic(beverages(
Suam
e(Asha
nti(
1,10
0(50
0(60
0(
34(
Vestor(Oil(Processing
(Com
pany(
Prod
uctio
n(of(Edible(oils(
Bosomtw
e((
Asha
nti(
205(
150(
55(
35(
Abab
io(Express(((
Prod
uctio
n(of(fruit(juice(and
(con
centrates(
AsokoreXMam
pong
((Asha
nti((
1,16
0(16
0(1,00
0(36
((Aglow
(Farms(Ltd.((
(Processing(of(pou
ltry(prod
ucts(((
Weija,(G
a(South(
Greater(
ACCR
A(3,08
0(80
(3,00
0(
37(
Dagan
(Farms(Ltd.(
Fish(fa
rming(an
d(processing
(Asuo
gyam
an((
Eastern(
47(
15(
32(
38(
Nou
rishe
r(Processing(Gha
na(Ltd(
Fruit(juice(processing((
Accra(Metropo
litan
(Greater(Accra(
610(
450(
160(
39(
Bibian
i(Log
ging
(Lim
ited(((
Man
ufacturin
g(of(woo
d(prod
ucts((
Kumasi(M
etropo
litan
(Asha
nti(
1,10
0(50
0(60
0(40
(Ag
ricultural,(Indu
stria
l(and
(Com
mercial(
Prod
ucts(AICP(Limite
d(Processing
(of(cha
rcoa
l(into(activ
ated
(carbo
n(an
d(related(
prod
ucts(fo
r(export(
Kwab
re(M
unicipal(
Asha
nti(
280(
80(
200(
41(
Gee
(Fresh(Com
pany(Ltd.(
Rearing(an
d(processing
(of(g
uine
a(fowl((
Tamale(Mun
icipal((
Northern(
5,39
8(39
8(5,00
0(42
(Asam
oah(an
d(Yamoa
h(Farm
s(Re
aring(an
d(processing
(of(p
oultry(an
d(related(prod
ucts(
Atwim
a(Kw
anwom
a(Asha
nti(
120(
120(
X(43
(Ap
pah(Farm
s(Limite
d.((
Rearing(an
d(processing
(of(p
oultry(into(m
eat(a
nd(re
lated(
prod
ucts.((
Kwah
u(East((
Eastern(
140(
40(
100(
44(
Delaw
in(Farms(Ltd((
Rearing(an
d(processing
(pou
ltry(an
d(related(prod
ucts.((
Kpon
e(Kataman
so(
Greater(Accra((
79(
20(
59(
45(
Mass(Indu
strie
s(Limite
d(Prod
uctio
n(of(Biscuits(etc.(
Kpon
e(Kataman
so(
Greater(Accra(
400(
250(
150(
46(
Sund
a(Gha
na(Diape
rs(Lim
ited(
Prod
uctio
n(of(Diape
rs(and
(San
itary(Nap
kins(
Ga(South(
Greater(
ACCR
A(1,09
3(59
3(50
0((
( 47(
Nordiq(Hygiene
(Care(Indu
strie
s(Ltd.((
Prod
uctio
n(of(Diape
rs(and
(San
itary(Nap
kins(
Tema(Mun
icipal((
Greater(Accra(
800(
240(
560(
(48
(Everpu
re(Gha
na(Ltd(
Prod
uctio
n(of(m
ineral,(sache
t(and
(flavou
red(water(and
(intraven
ous(infusion
((Ngleshie((Aman
from
/Ga(South(
Greater(
ACCR
A(4,60
0(60
0(4,00
0(
48(
Wen
tec(Co
mpa
ny((
Prod
uctio
n(sachet(and
(water(labe
ls(
Accra(Metro((
Greater(Accra((
150(
50(
100(
50(
Integrated
(Com
post(&(Recycling(Plan
t(Ltd((
Recycling(of(waste(into(com
post((
Accra(Metropo
litan
(Greater(Accra(
4,10
0(12
0(3,98
0(50
(Hom
e(food
s(Processing
(Ve
g.(oil.(Spices/Pe
pers/(R
eady(to
(eat(m
eals(
Tema(Mun
icipal((
Greater(
ACCR
A(80
(80
(X(

108
107"
"No.(
COMPA
NY(
ACTIVITY(
DISTR
ICT(
REG
ION(
EMPL
OYM
ENT(
DIREC
T(IN
DIREC
T(51
(Navina(Ca
rtel(Garmen
ts((
Garmen
t(and
(App
arel(produ
ction((
Okaikoi(North((
Greater(Accra(((
500(
200(
300(
52(
Unijay(Garmen
ts(Ltd.(
Man
ufacturin
g(of(various(ty
pes(of(garmen
t(for(both(local(
and(expo
rt(m
arkets((
Asokwa,(Ashan
ti((
Asha
nti(
1,70
0(20
0(1,50
0(
53(
Maagrace(Indu
strie
s(Limite
d(Man
ufacturin
g(of(various(ty
pes(of(Garmen
t(New
(Juab
en(M
unicipal(Assem
bly(
Eastern(
400(
100(
300(
(54
(KA
D(In
dustrie
s(Man
ufacturin
g(of(garmen
ts(
Accra(Metropo
litan
(Greater(
ACCR
A(45
0(45
0(X(
55(
Inno
vatio
n(Man
ufacturin
g(Group
(Man
ufacturin
g(of(biscuits,(con
fectione
ry(and
(related(
prod
ucts((
Kpon
e((
Greater(
ACCR
A(1,13
0(13
0(1,00
0(
56(
De(United(Fo
ods(Indu
strie
s(Limite
d(Man
ufacture(of(n
oodles(and
(Spa
ghetti(
Tema(West(
Greater(Accra(
381(
234(
147(
57(
Hap
py(Sun
shine(Co
mpa
ny(Lim
ited(
Man
ufacturin
g(of(can
ned(tomatoe
s(Suhu
m(
Eastern(
646(
579(
67(
58(
Glofert(Gha
na((
Prod
uctio
n(of(fe
rtilizer(to(supp
ort(a
griculture(
Suhu
m(
Eastern(
150(
150(
0((
TOTA
L(((
((((
56,728
(13
,177
(43
,551
(So
urce
:(Ministry(of(Tr
ade(an
d(Indu
stry((((((((((
*Since
(201
7((
((
((
((
Total(out
put(in(agr
icultu
ral(pr
odu
ction,(201
9((Figur
es(in(Met
ric(To
nnes
)(Reg
ion/
(Met
ric(
Wes
tern
(Wes
tern
(Nor
th(
Cen
tral(
Gre
ater
(Acc
ra(
Volta(
Oti(
Easter
n(Ash
anti(
Bon
o(Bon
o(Ea
st(
Aha
fo(
Nor
ther
n(Nor
th(Eas
t(Sa
vann
ah(
Upp
er(
East(
Upp
er(
Wes
t(To
tal(
Cro
p(
Maize(
Outpu
t(88
586.1(
35,210
.50(
285,66
7.30
(80
381(
9731
3.5(
5867
6.8(
5175
35(
4902
46.1(
3199
08(
2296
88.2(
4850
3.2(
1579
16(
3731
5(54
779(
161,12
4.00
(23
3439
(28
9628
8(Av
erage(
Yield/Hctre(
1.57
(1.46
(2.82
(9.24
(2.44
(2.58
(2.98
(3.02
(2.68
(2.32
(1.57
(1.7(
1.54
(1.66
(2.17
(2.69
(2.52
(
Rice(
Outpu
t(25
,329
.90(
48,487
.70(
9502
.556
(21
596(
2030
07.7(
1389
16(
4126
1.2(
6710
4.7(
1014
1.6(
1987
7.6(
5725
.4(
1268
45(
2636
6(24
497(
1270
51.9(
2380
9(91
9519
.1(
Average(
Yield/Hctre(
1.98
(1.95
(3.29
(5.22
(5.81
(5.63
(4.1(
4.5(
2.61
(2.8(
2.22
(2.02
(2.1(
1.99
(2.97
(2.9(
3.3(
Millet(
Outpu
t((
((
((
((
((
((
5337
2.9(
3030
1(12
294(
5041
4(84
035(
2304
16.3(
Average(
Yield/Hctre(
((
((
((
((
((
(1.6(
2(1.4(
1.2(
1.74
(1.56
(
Sorghu
m(
Outpu
t((
((
(1,11
5(94
40.42(
((
114.4(
3673
.32(
(84
661.7(
2618
4(20
794(
7836
4.72
(12
1997
(34
6344
.7(
Average(
Yield/Hctre(
((
((
1.81
(1.66
((
(1.3(
1.52
((
1.77
(1.76
(1.72
(1.37
(1.44
(1.53
(
Cassava(
Outpu
t(81
8313
.3(
6881
58.2(
3058
852.7(
4802
9(10
7537
5(10
3733
7(58
2974
2(37
9531
1(17
8598
2(17
9569
1(79
4185
(84
9862
(29
334(
5208
49(
((
22,127
,021
(Av
erage(
Yield/Hctre(
14.96(
14.18(
20.39(
10.1(
23.2(
23.72(
26.54(
24.82(
24.78(
25.18(
14.73(
12.89(
8.4(
15.4(
((
21.7(
Yam(
output(
2077
0.9(
1270
67.3(
2326
7.6(
(20
4192
.6(
5432
75(
9042
39(
7037
40(
5840
01.4(
2439
579(
3401
2(17
9008
3(39
746(
5548
27(
0(78
3698
(8,75
2,49
8(Av
erage(
Yield/Hctre(
8.9(
9.6(
7((
18(
22.4(
21.16(
17.31(
16.69(
21.7(
16.05(
14.12(
6.3(
14(
(19
.82(
17.5(
Cocoyam(
Outpu
t(57
215.28
(29
0045
.5(
5940
4.74
((
2161
7.54
(52
462.5(
2472
32(
4650
17.3(
1223
95.9(
6828
.01(
9105
1.2(
((
((
(14
1327
0(Av
erage(
Yield/Hctre(
7.52
(6.73
(6(
(6.51
(7.88
(8.79
(6.94
(6.81
(5.45
(3.12
((
((
((
6.6(
Plan
tain(
Outpu
t(25
1193
.8(
8093
42.1(
2804
93.24(
(26
837.7(
6883
9.3(
8806
41(
1668
302(
4445
52.7(
2944
1.44
(42
6857
((
((
((
4886
501(
Average(
Yield/Hctre(
12.15(
12.36(
11.01(
(8.02
(8.33
(10
.22(
14.82(
15.02(
9.8(
7.82
((
((
((
11.94(
Groun
dnuts(
Outpu
t((
((
((
(14
016.9(
1134
2(30
27.3(
1641
3.11
((
1106
22(
3885
4(38
317(
4868
8.95
(27
6396
(55
7677
.7(
Average(
Yield/Hctre(
((
((
((
1.71
(1.86
(1.14
(1.07
((
1.96
(1.51
(1.71
(1.24
(1.76
(1.66
(
Cowpe
a(Outpu
t((
((
(46
70.9(
3910
.53(
2619
.1(
8075
.8(
1442
.8(
8396
.718
((
5702
1.3(
3003
1(16
412(
3115
8.02
(83
505(
2472
43.4(
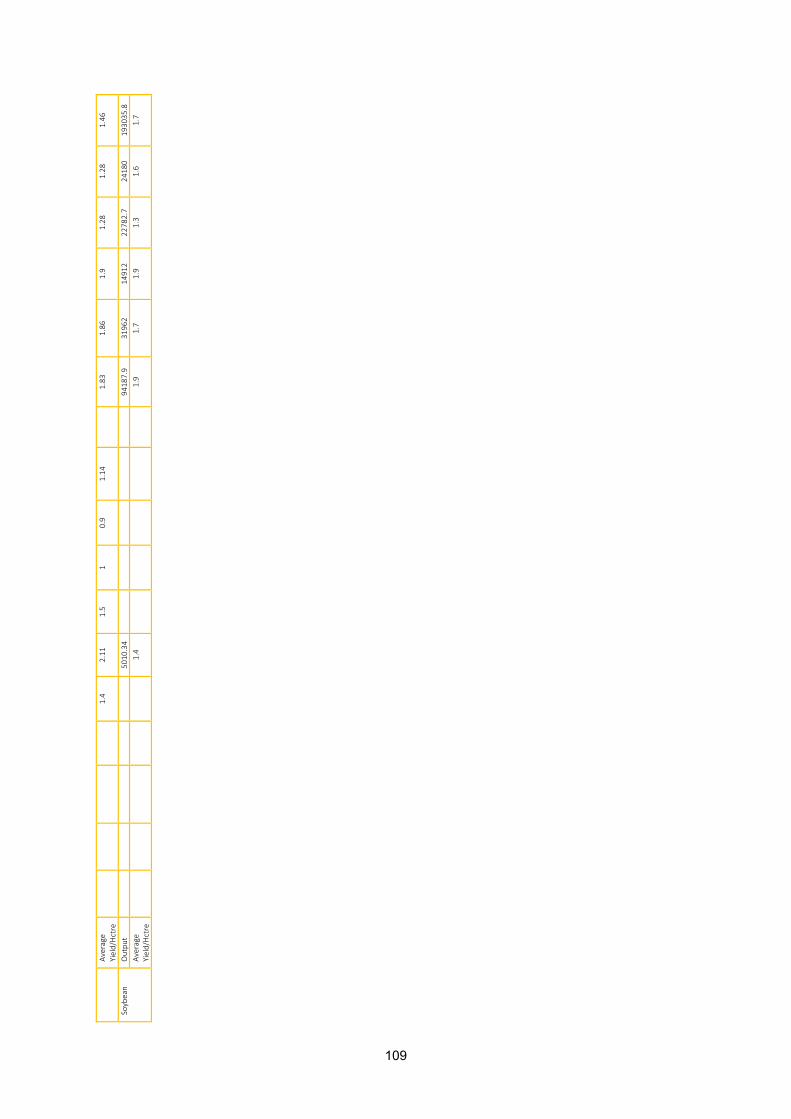
109
108"
"
Average(
Yield/Hctre(
((
((
1.4(
2.11
(1.5(
1(0.9(
1.14
((
1.83
(1.86
(1.9(
1.28
(1.28
(1.46
(
Soybean(
Outpu
t((
((
((
5010
.34(
((
((
(94
187.9(
3196
2(14
912(
2278
2.7(
2418
0(19
3035
.8(
Average(
Yield/Hctre(
((
((
(1.4(
((
((
(1.9(
1.7(
1.9(
1.3(
1.6(
1.7(
(