an analysis of china’s lng demand and the spa supply
TRANSCRIPT

29 July 2016
An Analysis of China’s LNG demand and the SPA supply

Winn Maria Hayman Shaozeng Feynman
Energy Bureau Sinopec GDLNG CNOOC Guangzhou Gas

INTRODUCTION
THE SIGNED SPA VS. THE FACILITIES CAPABILITY IN CHINA
CHALLENGES AND OPPORTUNITIES FOR LNG CONSUMPTION
CONCLUSION
1
2
3
4
An Analysis of China's Capability to Absorb the Signed SPA
Content

An Analysis of China's Capability to Absorb the Signed SPA
Introduction

An Analysis of China's Capability to Absorb the Signed SPA
文 ?内
容
Signed SPA
Difficulties
LNG Demand
Opportunities
Introduction

An Analysis of China's Capability to Absorb the Signed SPA
The Signed SPA VS. The Facilities Capability in China
7 SPA signed by CNOOC, totally procured long term 23.4 million tons LNG per annum.
Buyer Project
Annual ToP
Obligation
(mmt)
Supply
Duration(year)
SPA Signing
(year)
Delivery
Commencement
(year)
CNOOC
Australia North West Shelf LNG
Project 3.70 25 2002 2006
Indonesia Tangguh LNG project 2.60 25 2006 2009
Malaysia Tiga LNG project 3.00 25 2006 2009
Qatar LNG
(Phase II) 2.00 25 2008 2009
TOTAL 1.00 15 2009 2010
Australia QCLNG project(BG) 3.60 20 2010 2014
Australia QCLNG project & BG
Portfolio 5.00 20 2012 2015
BP Portfolio 1.50 20 2014 2019
The Signed SPA--CNOOC (China National Offshore Oil Company) SPA

An Analysis of China's Capability to Absorb the Signed SPA
The Signed SPA VS. The Facilities Capability in China
Buyer Project
Annual ToP
Obligation
(mmt)
Supply
Duration
(year)
SPA Signing
(year)
Delivery
Commencement
(year)
CNPC
Qatar LNG (Phase IV) 3.00 25 2008 2011
SHELL 2.00 20 2008 2011
Exxon Mobile Gorgon Project 2.25 20 2009 2016
Yamal LNG 3.00 20 2018
The Signed SPA--CNPC (China National Petroleum Co.) SPA
CNPC signed 4 SPA with totally 10.25 million tons LNG procurement quantity per year and 3 of them are in operation now.

An Analysis of China's Capability to Absorb the Signed SPA
The Signed SPA VS. The Facilities Capability in China
The Signed SPA--SINOPEC (China National Petrochemical Co.) SPA
SINOPEC is importing 9.6 million tons LNG from PNG LNG project (2 million tons per year) and Australia APLNG project (7.6 million tons per year) every year.
Buyer Project Annual ToP
Obligation (mmt)
Supply
Duration
(year)
SPA Signing
(year)
Delivery
Commencemen
t (year)
SINOPEC
PNG LNG project 2.00 20 2009 2014
Australia APLNG project (T1) 4.30 20 2011 2015
Australia APLNG project (T2) 3.30 20 2012 2016

An Analysis of China's Capability to Absorb the Signed SPA
The Signed SPA VS. The Facilities Capability in China
The Signed SPA-- Other companies
Buyer Project
Annual ToP
Obligation
(mmt)
Supply
Duration
(year)
SPA Signing
(year)
Delivery
Commencement
(year)
ENN
Total 0.50 10 2018
Origin 0.50 5 2018
Chevron 10 2018
Huadian
Pavilion 2020
Chevron 1.00 10 2020
BP 0.50+0.50 20 2021
Guanghui Petronas 0.50 10 2017
From 2017 to 2020, some small-scale LNG SPA will be put into operation gradually and totally will reach 3.5 million tons per year in 2020.

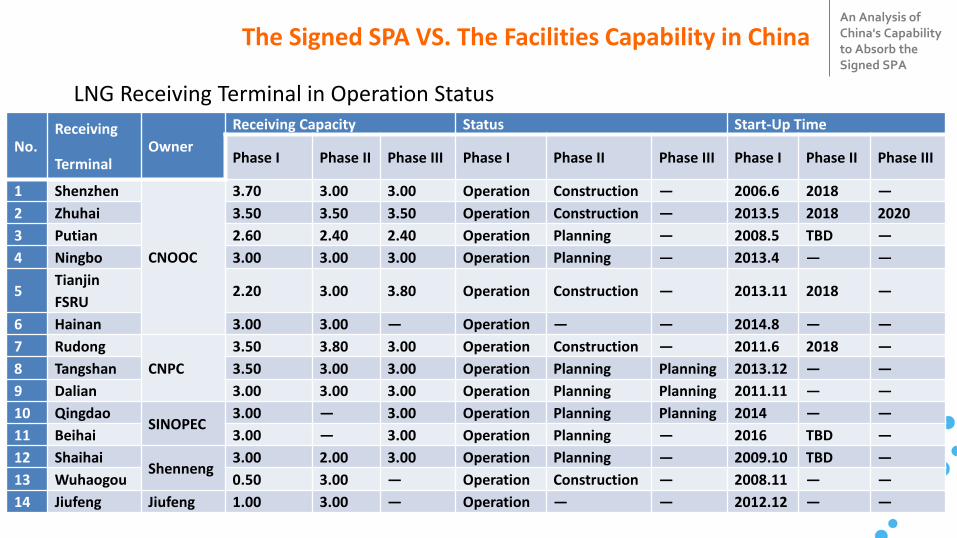
Till June, 2016, there are 14
receiving terminals in operation
status in China Mainland, total
receiving capability 38.5 million
tons per year.
An Analysis of China's Capability to Absorb the Signed SPA
The Signed SPA VS. The Facilities Capability in China
LNG Receiving Terminal in Operation Status
The LNG Receiving Terminals in China
An Analysis of China's Capability to Absorb the Signed SPA
The Signed SPA VS. The Facilities Capability in China
LNG Receiving Terminal in Operation Status
No. Receiving
Terminal Owner
Receiving Capacity Status Start-Up Time
Phase I Phase II Phase III Phase I Phase II Phase III Phase I Phase II Phase III
1 Shenzhen
CNOOC
3.70 3.00 3.00 Operation Construction — 2006.6 2018 —
2 Zhuhai 3.50 3.50 3.50 Operation Construction — 2013.5 2018 2020
3 Putian 2.60 2.40 2.40 Operation Planning — 2008.5 TBD —
4 Ningbo 3.00 3.00 3.00 Operation Planning — 2013.4 — —
5 Tianjin
FSRU 2.20 3.00 3.80 Operation Construction — 2013.11 2018 —
6 Hainan 3.00 3.00 — Operation — — 2014.8 — —
7 Rudong
CNPC
3.50 3.80 3.00 Operation Construction — 2011.6 2018 —
8 Tangshan 3.50 3.00 3.00 Operation Planning Planning 2013.12 — —
9 Dalian 3.00 3.00 3.00 Operation Planning Planning 2011.11 — —
10 Qingdao SINOPEC
3.00 — 3.00 Operation Planning Planning 2014 — —
11 Beihai 3.00 — 3.00 Operation Planning — 2016 TBD —
12 Shaihai Shenneng
3.00 2.00 3.00 Operation Planning — 2009.10 TBD —
13 Wuhaogou 0.50 3.00 — Operation Construction — 2008.11 — —
14 Jiufeng Jiufeng 1.00 3.00 — Operation — — 2012.12 — —

An Analysis of China's Capability to Absorb the Signed SPA
The Signed SPA VS. The Facilities Capability in China
LNG Receiving Terminal under Construction in China
No. Receiving
Terminal Owner
Receiving Capacity Status Start-Up Time
Phase I Phase II Phase III Phase I Phase II Phase III Phase I Phase II Phase
III
1 Yuedong
CNOOC
2.00 7.00 2.00 Construction Planning — 2017 TBD —
2 Shenzhen 4.00 — — Construction — — 2017 — —
3 Fangchenggang 0.60 — — Construction — — 2017 — —
4 Yuexi
5 Tianjin SINOPEC 3.00 — 7.00 Construction Planning — 2017 TBD —
6 Qidong Xinjiang
Guanghui 0.60 — 1.50 Construction Planning Planning 2017 TBD TBD
7 Zhoushan ENN 3.00 — 1.20 Construction Planning Planning 2017 TBD TBD

An Analysis of China's Capability to Absorb the Signed SPA
The Signed SPA VS. The Facilities Capability in China
The Long Term SPA Quantity and the Receiving Capability
Year 2015 2016 2017 2018 2019 2020
Receiving Capability (mmt) 35.8 38.8 52 65.3 65.3 68.8
SPA Tops Obligation (mmt) 28.9 35.05 39.25 43.25 44.75 45.75
0
20
40
60
80
2015 2016 2017 2018 2019 2020
RECEIVING CAPABILITY & TOP OBLIGATION MATCHING ANALYSIS
Receiving Capability (mmt) SPA ToP Obligation (mmt)

An Analysis of China's Capability to Absorb the Signed SPA
The Signed SPA VS. The Facilities Capability in China
The Physical Receiving Capability for Spot Cargoes
Year 2015 2016 2017 2018 2019 2020
Spot Cargo Physical Receiving Capability (mmt) 6.9 3.75 12.75 22.05 20.55 23.05
0
5
10
15
20
25
2015 2016 2017 2018 2019 2020
Spot Cargo Physical Receiving Capability (mmt)
An Analysis of China's Capability to Absorb the Signed SPA
Challenges and Opportunities for LNG Consumption
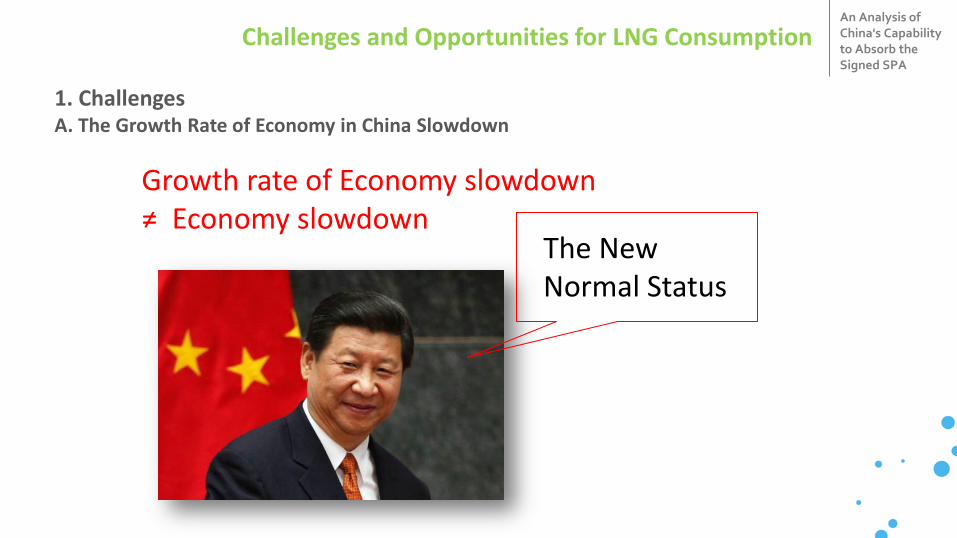
1. Challenges A. The Growth Rate of Economy in China Slowdown
Growth rate of Economy slowdown ≠ Economy slowdown
The New Normal Status

An Analysis of China's Capability to Absorb the Signed SPA
Source: National Bureau of Statistic of China
Overcapacity
Debt
demand
1. Difficulties A. The Growth Rate of Economy in China Slowdown
Challenges and Opportunities for LNG Consumption

An Analysis of China's Capability to Absorb the Signed SPA
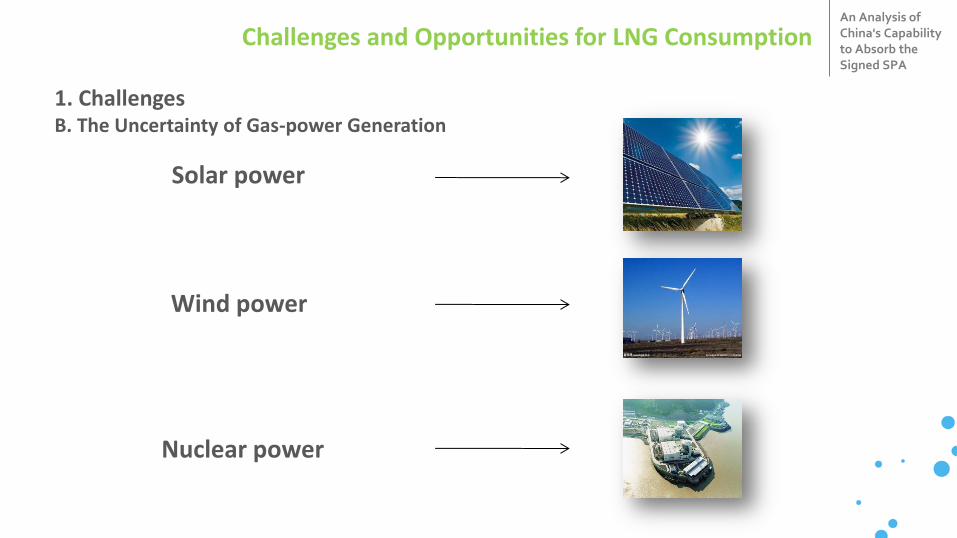
1. Challenges B. The Uncertainty of Gas-power Generation
0
1000
2000
3000
4000
5000
6000
Annual electricity consumption in China
Unit billion kwh
Challenges and Opportunities for LNG Consumption

An Analysis of China's Capability to Absorb the Signed SPA
19%
76%
2% 3% 0%
Percentage of output in Power Electricity in China 2014
Output of Hydro Power Electricity
Output of Thermal Power Electricity
Output of Nuclear Power Electricity
Output of Wind Power Electricity
Others
1. Challenges B. The Uncertainty of Gas-power Generation
Challenges and Opportunities for LNG Consumption
An Analysis of China's Capability to Absorb the Signed SPA
difficulty Solar power
Wind power
Nuclear power
1. Challenges B. The Uncertainty of Gas-power Generation
Challenges and Opportunities for LNG Consumption

An Analysis of China's Capability to Absorb the Signed SPA
difficulty 1. Challenges C. Advantage of LNG Price Disappeared
0
20
40
60
80
100
120
140
Mar
-11
Jun
-11
Sep
-11
De
c-1
1
Mar
-12
Jun
-12
Sep
-12
De
c-1
2
Mar
-13
Jun
-13
Sep
-13
De
c-1
3
Mar
-14
Jun
-14
Sep
-14
De
c-1
4
Mar
-15
Jun
-15
Sep
-15
De
c-1
5
USD
/ b
arre
l
International Crude Oil Prices Curve (2011-2015)
OPEC
WTI
Brent oil
Source:http://www.plasway.com/price/price_base_d.jsp
LNG Price Sudden
declines
JCC price
Lag of adjustment
Strict Regulation
Challenges and Opportunities for LNG Consumption
An Analysis of China's Capability to Absorb the Signed SPA
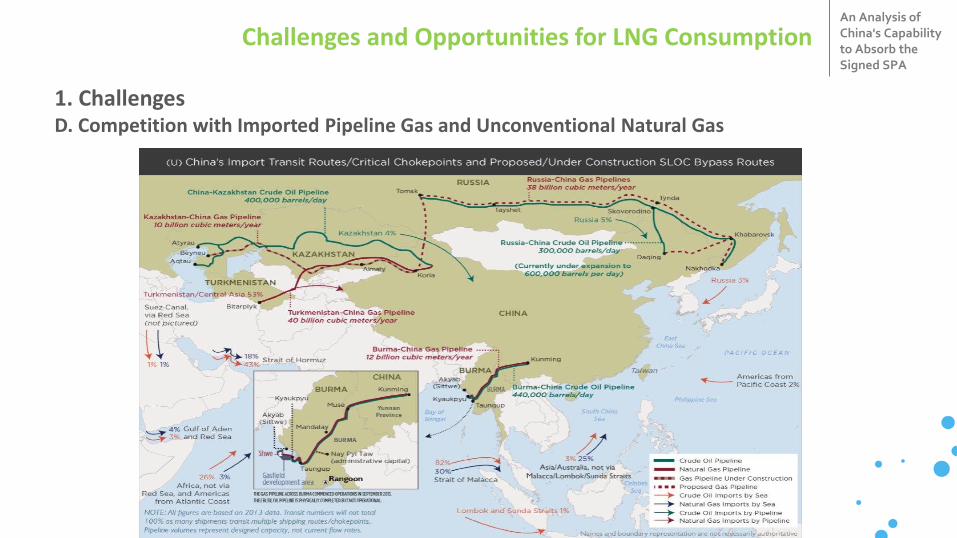
difficulty 1. Challenges D. Competition with Imported Pipeline Gas and Unconventional Natural Gas
Challenges and Opportunities for LNG Consumption

An Analysis of China's Capability to Absorb the Signed SPA
difficulty 1. Challenges D. Competition with imported pipeline gas and unconventional natural gas
Challenges and Opportunities for LNG Consumption
An Analysis of China's Capability to Absorb the Signed SPA
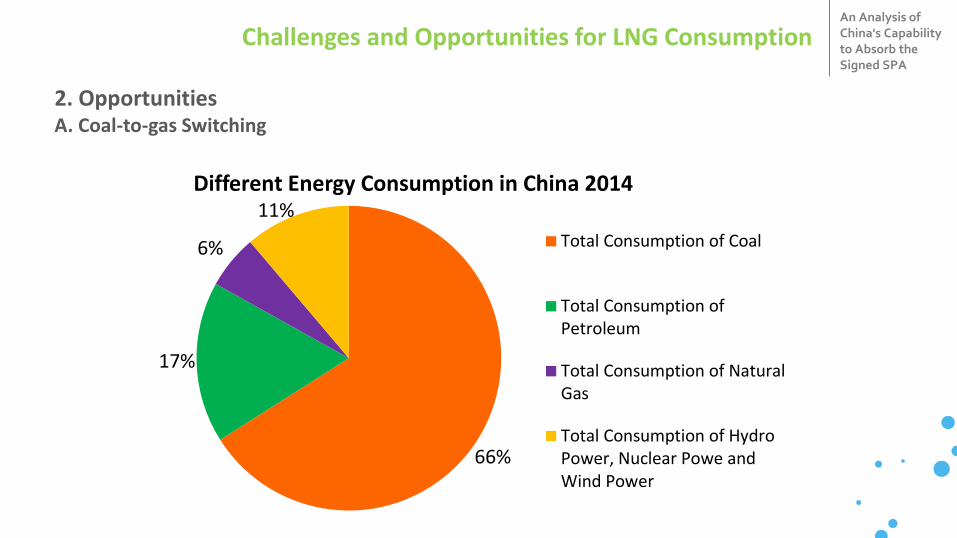
2. Opportunities A. Coal-to-gas Switching
66%
17%
6%
11% Different Energy Consumption in China 2014
Total Consumption of Coal
Total Consumption ofPetroleum
Total Consumption of NaturalGas
Total Consumption of HydroPower, Nuclear Powe andWind Power
Challenges and Opportunities for LNG Consumption
An Analysis of China's Capability to Absorb the Signed SPA
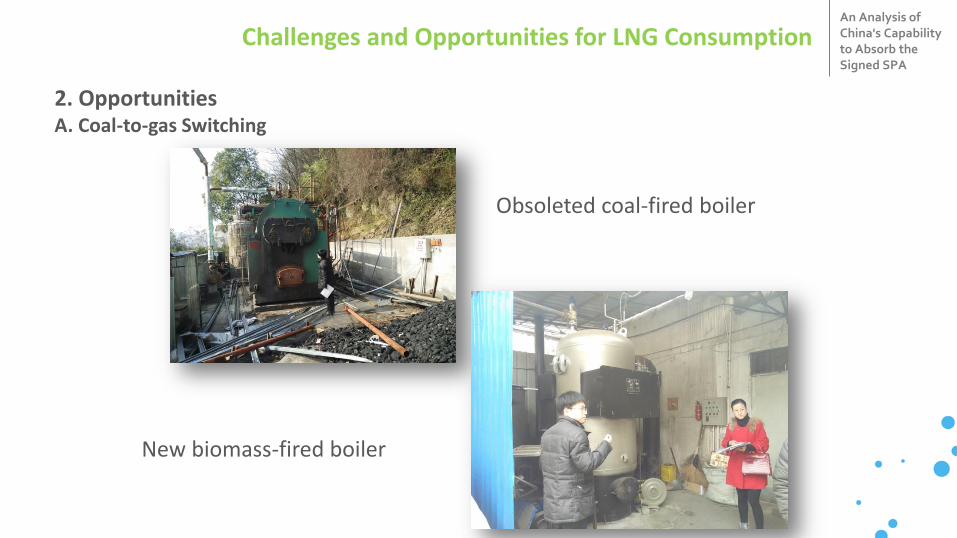
2. Opportunities A. Coal-to-gas Switching
Obsoleted coal-fired boiler
New biomass-fired boiler
Challenges and Opportunities for LNG Consumption

An Analysis of China's Capability to Absorb the Signed SPA
2. Opportunities B. Reform of NGM (Natural Gas Market)
Highly regulated Market-based
Challenges and Opportunities for LNG Consumption

An Analysis of China's Capability to Absorb the Signed SPA
2. Opportunities B. Reform of NGM (Natural Gas Market)
The first private company (ENN) own LNG Importation and Bunkering Terminal in China
Challenges and Opportunities for LNG Consumption

An Analysis of China's Capability to Absorb the Signed SPA
2. Opportunities C. City Gas
0
50
100
150
200
250
300
0
50000
100000
150000
200000
250000
300000
350000
400000
450000
500000
2010 2011 2012 2013 2014
Po
pu
lati
on
/mill
ion
Len
gth
/km
Length of Gas Pipeline&Users of City Gas in China
Length of Gas Pipeline(km) Users of City Gas(million)
Challenges and Opportunities for LNG Consumption

An Analysis of China's Capability to Absorb the Signed SPA
2. Opportunities C. City Gas
0.0020.0040.0060.0080.00
100.00120.00140.00160.00180.00200.00
2010 2011 2012 2013 2014
bill
ion
cu
bic
met
ers
Consumption of Natural Gas in China Life Natural Gas Consumption
Industrial Natural Gas Consumption
Total Natural Gas Consumption
Challenges and Opportunities for LNG Consumption

An Analysis of China's Capability to Absorb the Signed SPA
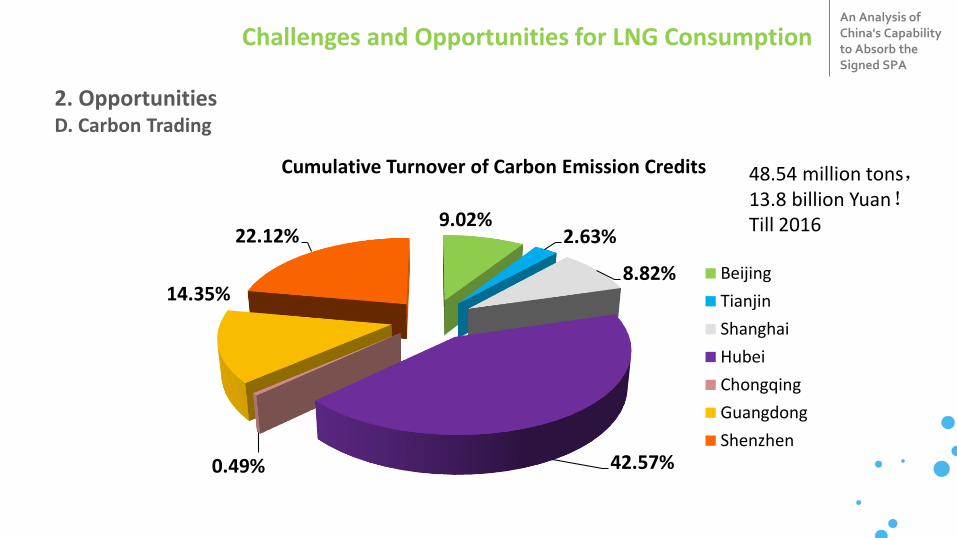
2. Opportunities D. Carbon Trading
Challenges and Opportunities for LNG Consumption
An Analysis of China's Capability to Absorb the Signed SPA
9.02% 2.63%
8.82%
42.57% 0.49%
14.35%
22.12%
Cumulative Turnover of Carbon Emission Credits
Beijing
Tianjin
Shanghai
Hubei
Chongqing
Guangdong
Shenzhen
2. Opportunities D. Carbon Trading
48.54 million tons, 13.8 billion Yuan! Till 2016
Challenges and Opportunities for LNG Consumption

An Analysis of China's Capability to Absorb the Signed SPA
Conclusion
China Gas Demand Forecast
Low Case High Case
Forecasted by CNPC
269bcm (192mmt)
334bcm (239mmt)
Signed SPA 25-51mmt

An Analysis of China's Capability to Absorb the Signed SPA
Conclusion
Environmental
concern and
policy choices
mainly decide the
demand of LNG.
China’s facilities
can support the
signed SPA and
further spot
potential.
The China reform
process plays a
more important
role.
China has the potential to
use more natural gas

Thank you
An Analysis of China's Capability to Absorb the Signed SPA
End