an analysis of growth dynamics in chennai … an analysis of growth dynamics in chennai metropolitan...
TRANSCRIPT
31
An Analysis of Growth Dynamics in Chennai Metropolitan Area
Prof. Dr. S.P. Sekar and S. Kanchanamala
AbstractChennai Metropolitan Area is experiencing a differential growth among the villages. The dynamics in the growth trends are attributable to various influencing factors. This paper attempts to study the growth dynamics of CMA to find out the factors influencing the same. Policies and directives for future development and their impact on the growth trend of CMA is also examined.
S. Kanchanamala, is a Assistant Planner in Chennai Metropolitan Development Authority, Research Scholar, Department of Planning, School of Architecture and Planning, Anna University, Chennai. Email: [email protected]. Dr. S.P. Sekar, is Professor and Head of Department of Planning, School of Architecture and Planning, Anna University, Chennai. Email:[email protected].
1. IntroDuCtIon
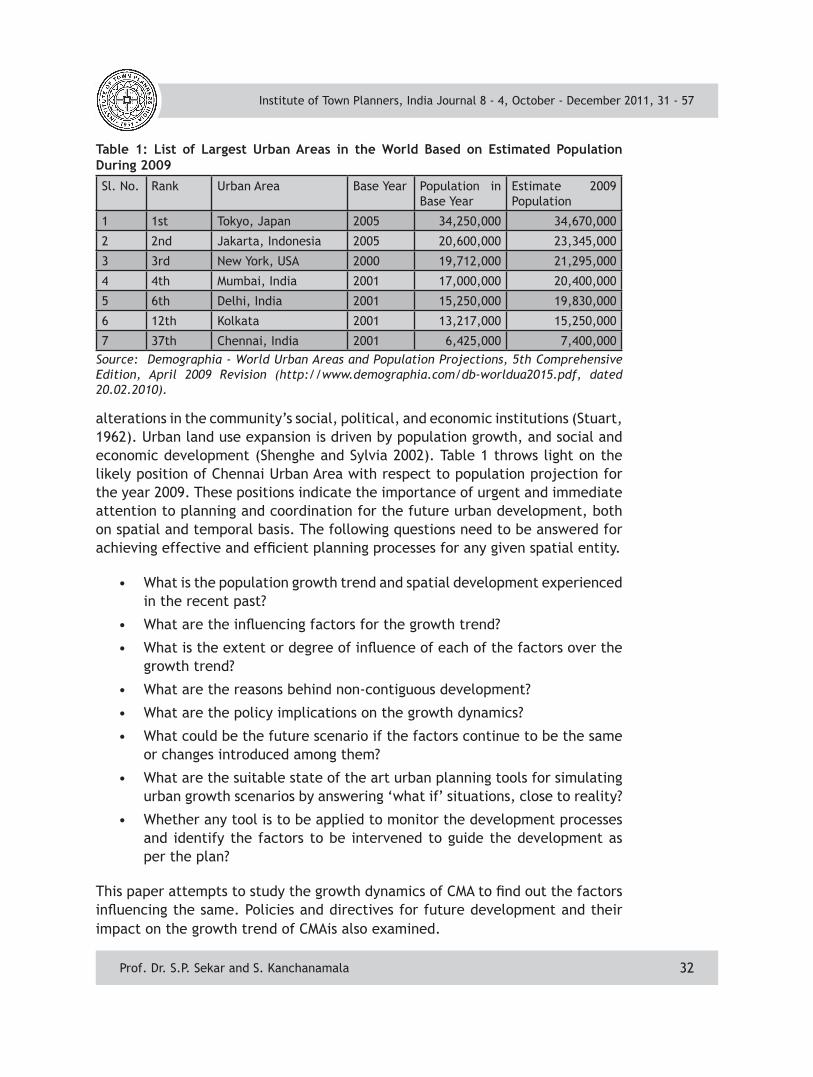
Chennai city, the fourth largest metropolitan city of the country, finds 157th rank in the list of urban areas categorized by developed land area i.e. urban foot print. As per the study titled ‘Demography - World Urban Areas and Population Projections’(2009) Chennai (comprising the Chennai City Corporation and the immediate developed areas) occupies 157th position in the world on the basis of developed land area with a population of 64.25 lakhs during 2001, and an area of over 609 sq km with a population density of 10,550 persons per sq km. On the same basis, Delhi ranks 51st with an area of 1,483 sq km, Kolkata ranks 82nd with 984 sq km, Hyderabad ranks 112nd with 790 sq km, Mumbai ranks 115th with 777 sq km, and Bangalore ranks 148th with 648 sq km. On the basis of population density, Chennai is placed at 139th rank. However, based on the estimated population for the year 2009, Chennai finds 37th place in the list of largest urban areas in the world (Table 1). Table 1 shows the position of the major Indian urban areas in the list of largest urban areas in the world based on estimated population for the year 2009. As per this estimate, Mumbai urban area is placed at the 4th position followed by Delhi (6th), Kolkata (12th) and Chennai urban area at 37th position. Chennai urban area is expected to attain a population of 100.70 lakh in the year 2025.
Urban growth is the spatial pattern of land development and the process of attaining a form influenced by various factors. Urban development is conceived broadly and simply as change in the city – whether it is the expansion of population and land area, shifts in land-use patterns or transportation systems of the city, changes in the pattern of industrial or commercial development, or
Institute of Town Planners, India Journal 8 - 4, October - December 2011, 31 - 57
Prof. Dr. S.P. Sekar and S. Kanchanamala
32
alterations in the community’s social, political, and economic institutions (Stuart, 1962). Urban land use expansion is driven by population growth, and social and economic development (Shenghe and Sylvia 2002). Table 1 throws light on the likely position of Chennai Urban Area with respect to population projection for the year 2009. These positions indicate the importance of urgent and immediate attention to planning and coordination for the future urban development, both on spatial and temporal basis. The following questions need to be answered for achieving effective and efficient planning processes for any given spatial entity.
• What is the population growth trend and spatial development experienced in the recent past?
• What are the influencing factors for the growth trend?
• What is the extent or degree of influence of each of the factors over the growth trend?
• What are the reasons behind non-contiguous development?
• What are the policy implications on the growth dynamics?
• What could be the future scenario if the factors continue to be the same or changes introduced among them?
• What are the suitable state of the art urban planning tools for simulating urban growth scenarios by answering ‘what if’ situations, close to reality?
• Whether any tool is to be applied to monitor the development processes and identify the factors to be intervened to guide the development as per the plan?
This paper attempts to study the growth dynamics of CMA to find out the factors influencing the same. Policies and directives for future development and their impact on the growth trend of CMAis also examined.
Institute of Town Planners, India Journal 8 - 4, October - December 2011, 31 - 57
Prof. Dr. S.P. Sekar and S. Kanchanamala
table 1: list of largest urban Areas in the world Based on estimated Population During 2009Sl. No. Rank Urban Area Base Year Population in
Base YearEstimate 2009 Population
1 1st Tokyo, Japan 2005 34,250,000 34,670,000
2 2nd Jakarta, Indonesia 2005 20,600,000 23,345,000
3 3rd New York, USA 2000 19,712,000 21,295,000
4 4th Mumbai, India 2001 17,000,000 20,400,000
5 6th Delhi, India 2001 15,250,000 19,830,000
6 12th Kolkata 2001 13,217,000 15,250,000
7 37th Chennai, India 2001 6,425,000 7,400,000Source: Demographia - World Urban Areas and Population Projections, 5th Comprehensive Edition, April 2009 Revision (http://www.demographia.com/db-worldua2015.pdf, dated 20.02.2010).
33
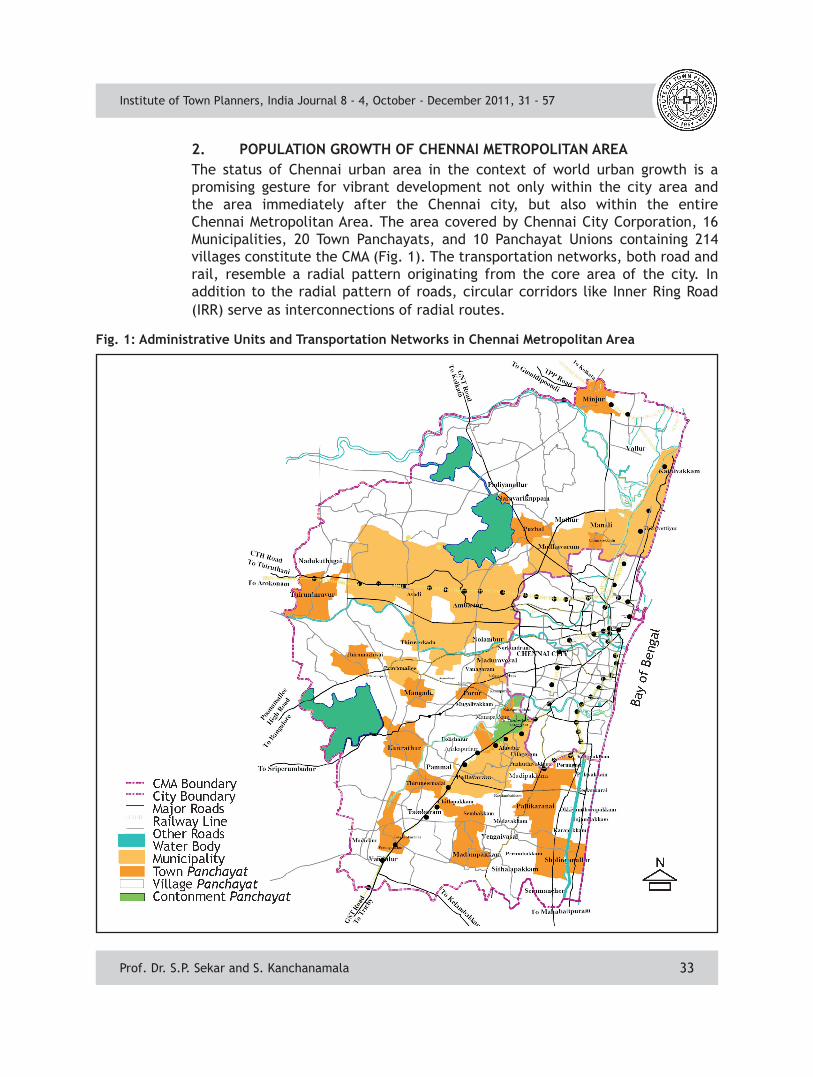
2. PoPulAtIon GrowtH of CHennAI MetroPolItAn AreAThe status of Chennai urban area in the context of world urban growth is a promising gesture for vibrant development not only within the city area and the area immediately after the Chennai city, but also within the entire Chennai Metropolitan Area. The area covered by Chennai City Corporation, 16 Municipalities, 20 Town Panchayats, and 10 Panchayat Unions containing 214 villages constitute the CMA (Fig. 1). The transportation networks, both road and rail, resemble a radial pattern originating from the core area of the city. In addition to the radial pattern of roads, circular corridors like Inner Ring Road (IRR) serve as interconnections of radial routes.
Fig.1:AdministrativeUnitsandTransportationNetworksinChennaiMetropolitanArea
Institute of Town Planners, India Journal 8 - 4, October - December 2011, 31 - 57
Prof. Dr. S.P. Sekar and S. Kanchanamala
34
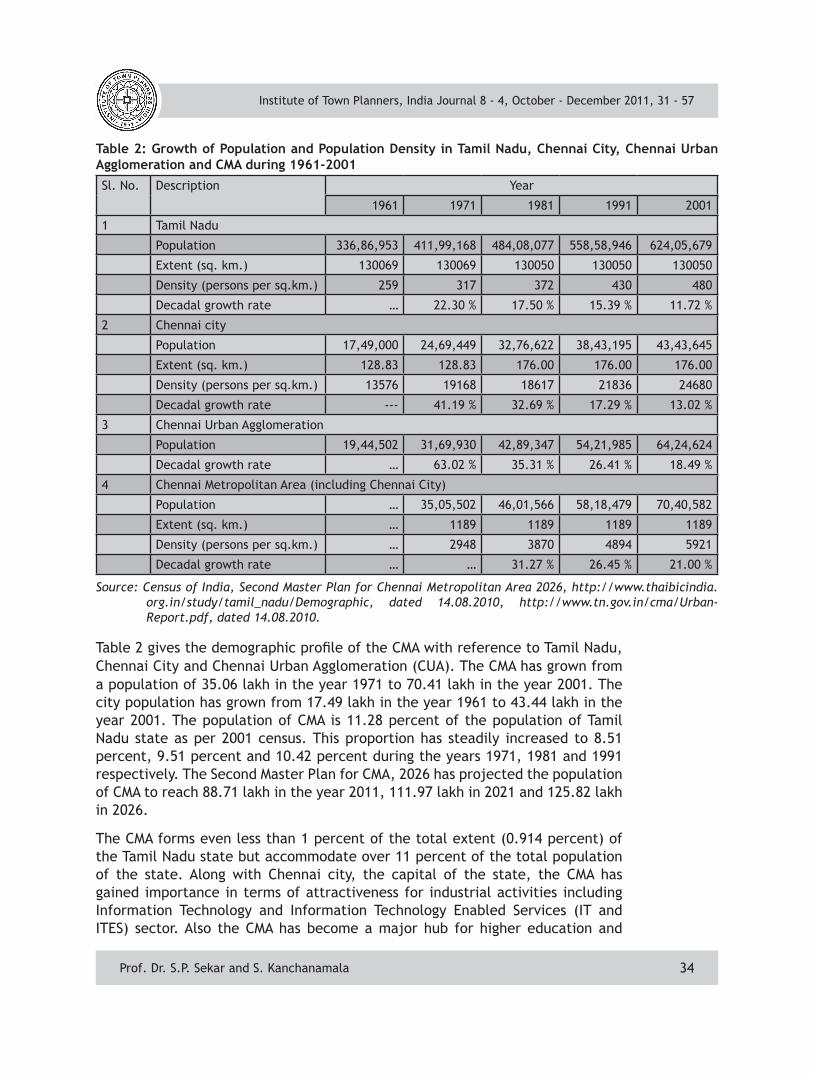
Table 2 gives the demographic profile of the CMA with reference to Tamil Nadu, Chennai City and Chennai Urban Agglomeration (CUA). The CMA has grown from a population of 35.06 lakh in the year 1971 to 70.41 lakh in the year 2001. The city population has grown from 17.49 lakh in the year 1961 to 43.44 lakh in the year 2001. The population of CMA is 11.28 percent of the population of Tamil Nadu state as per 2001 census. This proportion has steadily increased to 8.51 percent, 9.51 percent and 10.42 percent during the years 1971, 1981 and 1991 respectively. The Second Master Plan for CMA, 2026 has projected the population of CMA to reach 88.71 lakh in the year 2011, 111.97 lakh in 2021 and 125.82 lakh in 2026.
The CMA forms even less than 1 percent of the total extent (0.914 percent) of the Tamil Nadu state but accommodate over 11 percent of the total population of the state. Along with Chennai city, the capital of the state, the CMA has gained importance in terms of attractiveness for industrial activities including Information Technology and Information Technology Enabled Services (IT and ITES) sector. Also the CMA has become a major hub for higher education and
Table2:GrowthofPopulationandPopulationDensityinTamilNadu,ChennaiCity,ChennaiUrbanAgglomeration and CMA during 1961-2001Sl. No. Description Year
1961 1971 1981 1991 2001
1 Tamil Nadu
Population 336,86,953 411,99,168 484,08,077 558,58,946 624,05,679
Extent (sq. km.) 130069 130069 130050 130050 130050
Density (persons per sq.km.) 259 317 372 430 480
Decadal growth rate … 22.30 % 17.50 % 15.39 % 11.72 %
2 Chennai city
Population 17,49,000 24,69,449 32,76,622 38,43,195 43,43,645
Extent (sq. km.) 128.83 128.83 176.00 176.00 176.00
Density (persons per sq.km.) 13576 19168 18617 21836 24680
Decadal growth rate --- 41.19 % 32.69 % 17.29 % 13.02 %
3 Chennai Urban Agglomeration
Population 19,44,502 31,69,930 42,89,347 54,21,985 64,24,624
Decadal growth rate … 63.02 % 35.31 % 26.41 % 18.49 %
4 Chennai Metropolitan Area (including Chennai City)
Population … 35,05,502 46,01,566 58,18,479 70,40,582
Extent (sq. km.) … 1189 1189 1189 1189
Density (persons per sq.km.) … 2948 3870 4894 5921
Decadal growth rate … … 31.27 % 26.45 % 21.00 %
Source: Census of India, Second Master Plan for Chennai Metropolitan Area 2026, http://www.thaibicindia.org.in/study/tamil_nadu/Demographic, dated 14.08.2010, http://www.tn.gov.in/cma/Urban-Report.pdf, dated 14.08.2010.
Institute of Town Planners, India Journal 8 - 4, October - December 2011, 31 - 57
Prof. Dr. S.P. Sekar and S. Kanchanamala
35
specialized health care facilities, inviting increasing population both from various parts of the country and abroad.
From the above Table 2, it is observed that the rate of decadal population growth over the past four decades follows a decreasing trend in the state, Chennai city, CUA and CMA as well. However, CMA is experiencing higher decadal growth rates since 1981-1991 as compared to the Chennai city area and Chennai Urban Agglomeration. Density in the CMA is as less as 59 persons per hectare as per 2001 census, which indicates huge scope for accommodating higher population densities as against the already denser (247 persons per hectare) Chennai city.
Any plan, proposal or project intended for the development of the urban area should therefore be prepared based on scientific methods of population projections, land use allocation strategies as well as based on appropriate spatial simulation techniques to foresee the likely influence of the plan, proposal, scheme or project on the growth of the urban area. Understanding of the pattern of spatial development of the urban area on temporal scale is thus the most important aspect for planning the directives to achieve a better future development. This could be made possible only on proper identification of the variables and determinants which would influence the population growth and spatial development so that appropriate directives and interventions on the urban growth are drawn.
3. reseArCH DesIGn
The objectives of the research are:
• To identify the settlements in the CMA experiencing high, medium and low growth rate during 1961-2001.
• To identify and assess the factors responsible for these growth trends.
• To study the policy statements on the growth of the CMA and to identify the conflicting areas.
• To spell out development interventions required for the growth of the CMA.
Studies reveal an extensive set of factors used to represent demographic, socio-economic, physical, and environmental and infrastructure aspects influencing urban development. Ian Bracken (1981) lists out many development potential factors used in the Structure Plan for Staffordshire, West Berkshire and Worcestershire.
In another study Chattopadhyay and Subramanian (1993) identified factors such as transportation corridors, slope, land capability, geology, soils, relief, rainfall, cyclones and flooding, drainage, minerals and wild life sanctuaries in their study on spatial pattern of settlements in Tamil Nadu.
Institute of Town Planners, India Journal 8 - 4, October - December 2011, 31 - 57
Prof. Dr. S.P. Sekar and S. Kanchanamala
36
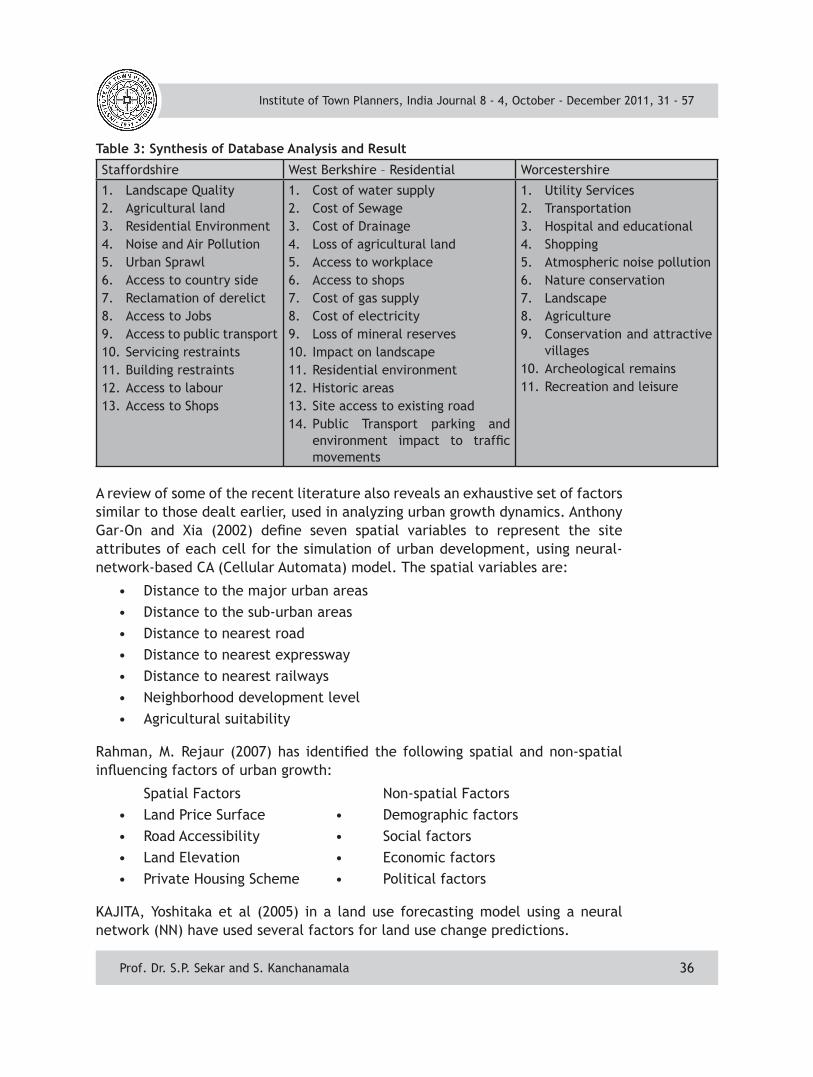
A review of some of the recent literature also reveals an exhaustive set of factors similar to those dealt earlier, used in analyzing urban growth dynamics. Anthony Gar-On and Xia (2002) define seven spatial variables to represent the site attributes of each cell for the simulation of urban development, using neural-network-based CA (Cellular Automata) model. The spatial variables are:
• Distance to the major urban areas • Distance to the sub-urban areas • Distance to nearest road • Distance to nearest expressway• Distance to nearest railways• Neighborhood development level• Agricultural suitability
Rahman, M. Rejaur (2007) has identified the following spatial and non-spatial influencing factors of urban growth:
Spatial Factors Non-spatial Factors• Land Price Surface • Demographic factors• Road Accessibility • Social factors• Land Elevation • Economic factors • Private Housing Scheme • Political factors
KAJITA, Yoshitaka et al (2005) in a land use forecasting model using a neural network (NN) have used several factors for land use change predictions.
table 3: synthesis of Database Analysis and result
Staffordshire West Berkshire – Residential Worcestershire
1. Landscape Quality2. Agricultural land3. Residential Environment4. Noise and Air Pollution5. Urban Sprawl6. Access to country side7. Reclamation of derelict8. Access to Jobs9. Access to public transport10. Servicing restraints11. Building restraints12. Access to labour13. Access to Shops
1. Cost of water supply2. Cost of Sewage3. Cost of Drainage4. Loss of agricultural land5. Access to workplace6. Access to shops7. Cost of gas supply8. Cost of electricity9. Loss of mineral reserves10. Impact on landscape11. Residential environment12. Historic areas13. Site access to existing road14. Public Transport parking and
environment impact to traffic movements
1. Utility Services2. Transportation3. Hospital and educational4. Shopping5. Atmospheric noise pollution6. Nature conservation7. Landscape8. Agriculture9. Conservation and attractive
villages10. Archeological remains11. Recreation and leisure
Institute of Town Planners, India Journal 8 - 4, October - December 2011, 31 - 57
Prof. Dr. S.P. Sekar and S. Kanchanamala
37
• Present condition of the land uses of the mesh itself
• Present condition of the land uses of the surrounded mesh
• Population density
• Weighted distance from a colony mesh
• Weighted distance calculated for each urbanization and land use division such as public use, residence, commerce, industry, park, transportation facilities, and road use
• Distance from a nearby (traffic) station
• Distance from a central city area
• Altitude
• Distance from an urbanization promotion area
In a study, considering the local conditions, following twenty two factors relating to physical, environmental and infrastructure aspects which influence the growth trends was identified for each of the villages in the CMA:
• Population size
• Population density
• Decadal growth rate of population
• Percentage of total workers
• Percentage of male workers
• Percentage of primary workers
• Percentage of secondary workers
• Percentage of tertiary workers
• Water table level
• Quality of ground water
• Physical constraints on land development
• Land value
• Land ownership
• Availability of land for development
• Nearness to work places
• Government schemes
• Government proposals
• Accessibility by road
• Accessibility by rail
• Road condition
Institute of Town Planners, India Journal 8 - 4, October - December 2011, 31 - 57
Prof. Dr. S.P. Sekar and S. Kanchanamala
38
• Environmental condition• Social condition
Other factors which also contribute considerably to the growth of a village viz. level of facilities such as health, education, water supply, sewage and drainage were not included in the above list. It was felt that the collection and use of data, particularly qualitative data, on these factors for quite large number of villages within the stipulated duration of study was highly difficult.
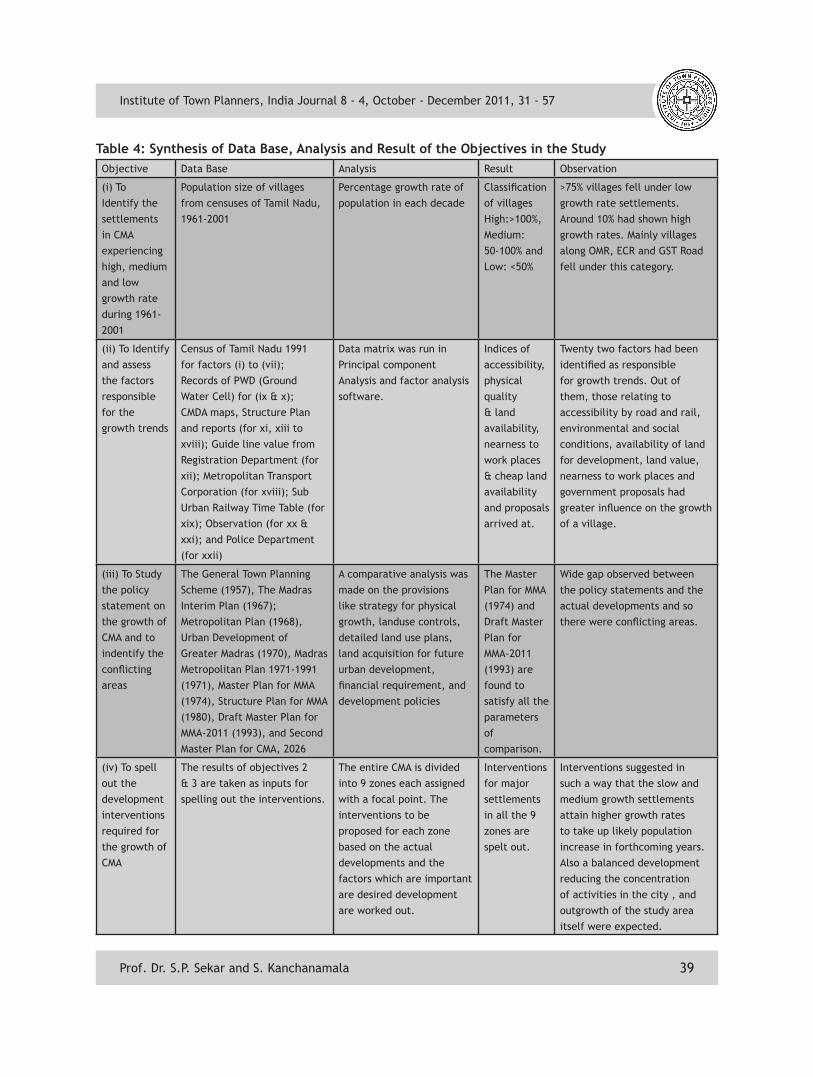
Data related to all the twenty two factors collected at village level were used in the preparation of data matrix. The data matrix was run in computer based principal component analysis technique and factor analysis technique. Table 4 gives the synthesis of data base, analysis of data and the results obtained relating to each of the set objectives.
4. tHe 2001 sCenArIo
4.1 Population size
A total of 15 villages in CMA have population more than 10,000 during the year 1971, the most populous among them was Thiruvottiyur Municipality with a population of over 82,000. Nine other villages emerged, each of them crossing a population of 10,000 during the year 1981 with Thiruvottiyur Municipality upholding the position with a population over 134,000. However Ambattur Municipality emerged as the most populous one during the year 1991 and 2001 with a population of about 215,000 and 311,000 respectively. Sixteen more villages emerged during 1991 and three more villages emerged during 2001 with a population of over 10,000.
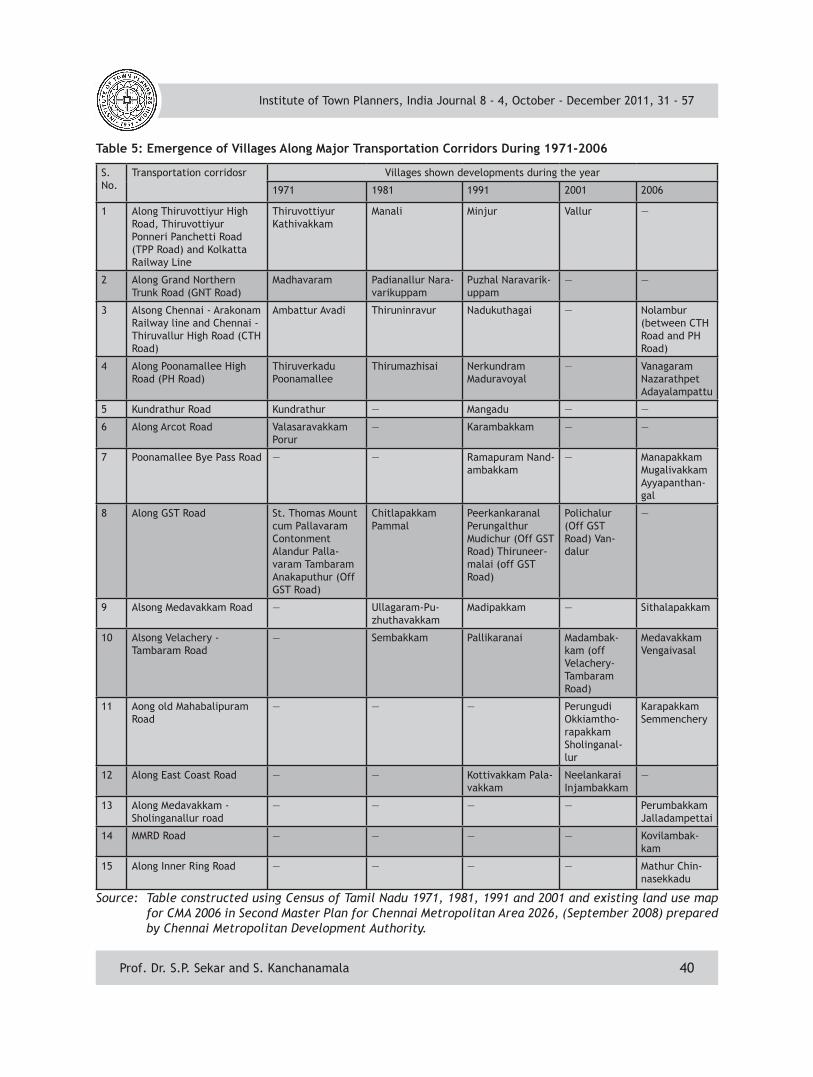
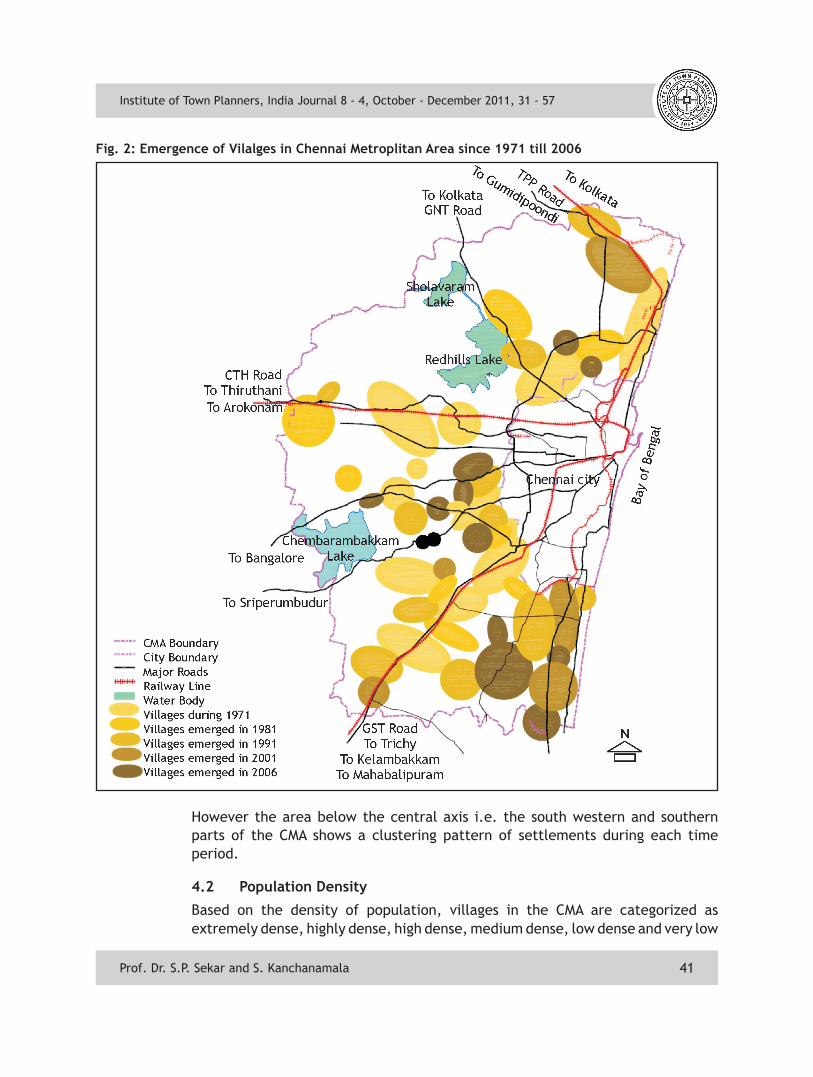
Quite interestingly, it is observed that villages present immediately abutting the city boundary viz. Thiruvottiyur, Madhavaram, Ambattur, Valasaravakkam, St. Thomas Mount Cantonment and Alandur picked up development as early as 1971. Ullagaram – Puzhuthivakkam showed emergence during 1981. Nerkundram, Ramapuram, Manapakkam and Kottivakkam emerged during 1991 whereas Perungudi and Pallikaranai emerged only during 2001. During 2001, the villages along Old Mahabalipuram Road viz. Perungudi, Okkiyamthorapakkam and Sholinganallur and those along ECR viz. Neelankarai and Injambakkam emerged in a contiguous fashion. Only one village in the northern part of the CMA, namely, Vallur emerged with a population crossing 10,000 during the year 2001. Table 6 indicates the transportation corridors along which the growth of villages has taken place during 1971 – 2006. Fig. 2 shows the emergence of villages from 1971 to 2006.
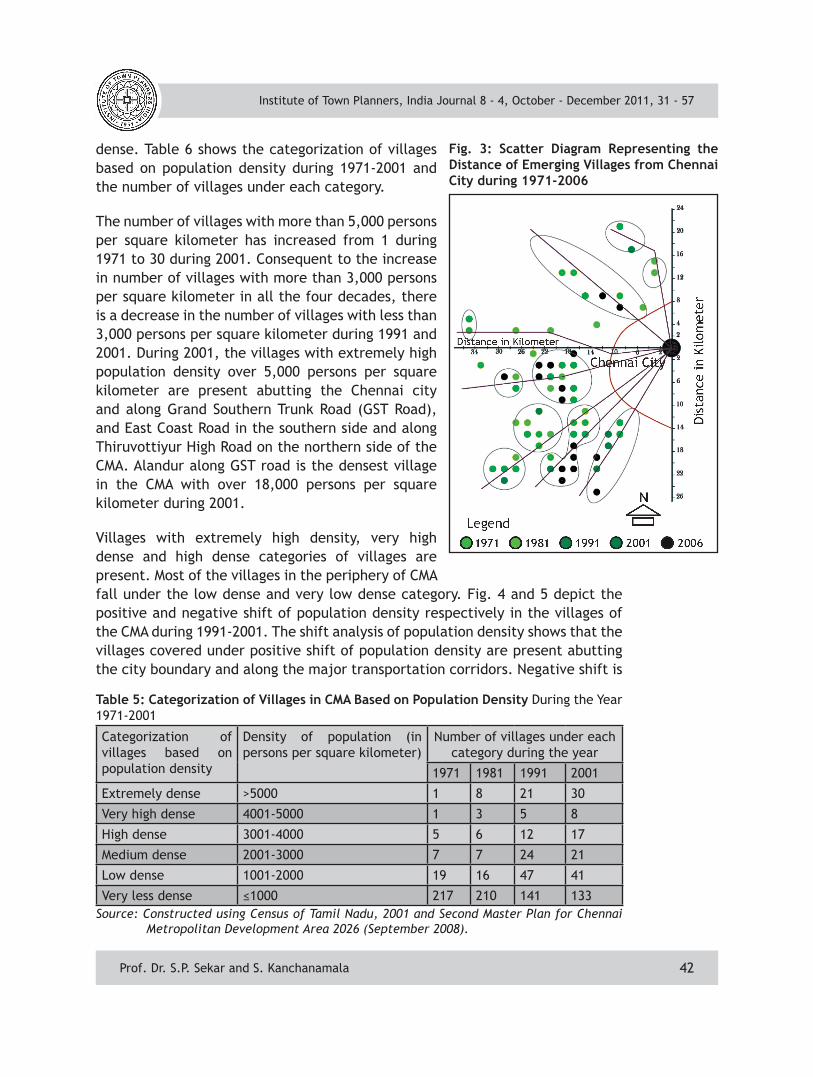
The scatter diagram (Fig. 3) clearly shows the distribution of emerging villages from the Chennai city during different points of time from 1971 to 2006. The area above the central axis shows a dispersed pattern of emergence of villages.
Institute of Town Planners, India Journal 8 - 4, October - December 2011, 31 - 57
Prof. Dr. S.P. Sekar and S. Kanchanamala
39
table 4: synthesis of Data Base, Analysis and result of the objectives in the studyObjective Data Base Analysis Result Observation
(i) To Identify the settlements in CMA experiencing high, medium and low growth rate during 1961-2001
Population size of villages from censuses of Tamil Nadu, 1961-2001
Percentage growth rate of population in each decade
Classification of villages High:>100%, Medium: 50-100% and Low: <50%
>75% villages fell under low growth rate settlements. Around 10% had shown high growth rates. Mainly villages along OMR, ECR and GST Road fell under this category.
(ii) To Identify and assess the factors responsible for the growth trends
Census of Tamil Nadu 1991 for factors (i) to (vii); Records of PWD (Ground Water Cell) for (ix & x); CMDA maps, Structure Plan and reports (for xi, xiii to xviii); Guide line value from Registration Department (for xii); Metropolitan Transport Corporation (for xviii); Sub Urban Railway Time Table (for xix); Observation (for xx & xxi); and Police Department (for xxii)
Data matrix was run in Principal component Analysis and factor analysis software.
Indices of accessibility, physical quality & land availability, nearness to work places & cheap land availability and proposals arrived at.
Twenty two factors had been identified as responsible for growth trends. Out of them, those relating to accessibility by road and rail, environmental and social conditions, availability of land for development, land value, nearness to work places and government proposals had greater influence on the growth of a village.
(iii) To Study the policy statement on the growth of CMA and to indentify the conflicting areas
The General Town Planning Scheme (1957), The Madras Interim Plan (1967); Metropolitan Plan (1968), Urban Development of Greater Madras (1970), Madras Metropolitan Plan 1971-1991 (1971), Master Plan for MMA (1974), Structure Plan for MMA (1980), Draft Master Plan for MMA-2011 (1993), and Second Master Plan for CMA, 2026
A comparative analysis was made on the provisions like strategy for physical growth, landuse controls, detailed land use plans, land acquisition for future urban development, financial requirement, and development policies
The Master Plan for MMA (1974) and Draft Master Plan for MMA-2011 (1993) are found to satisfy all the parameters of comparison.
Wide gap observed between the policy statements and the actual developments and so there were conflicting areas.
(iv) To spell out the development interventions required for the growth of CMA
The results of objectives 2 & 3 are taken as inputs for spelling out the interventions.
The entire CMA is divided into 9 zones each assigned with a focal point. The interventions to be proposed for each zone based on the actual developments and the factors which are important are desired development are worked out.
Interventions for major settlements in all the 9 zones are spelt out.
Interventions suggested in such a way that the slow and medium growth settlements attain higher growth rates to take up likely population increase in forthcoming years. Also a balanced development reducing the concentration of activities in the city , and outgrowth of the study area itself were expected.
Institute of Town Planners, India Journal 8 - 4, October - December 2011, 31 - 57
Prof. Dr. S.P. Sekar and S. Kanchanamala
40
table 5: emergence of Villages Along Major transportation Corridors During 1971-2006
S. No.
Transportation corridosr Villages shown developments during the year
1971 1981 1991 2001 2006
1 Along Thiruvottiyur High Road, Thiruvottiyur Ponneri Panchetti Road (TPP Road) and Kolkatta Railway Line
Thiruvottiyur Kathivakkam
Manali Minjur Vallur —
2 Along Grand Northern Trunk Road (GNT Road)
Madhavaram Padianallur Nara-varikuppam
Puzhal Naravarik-uppam
— —
3 Alsong Chennai - Arakonam Railway line and Chennai - Thiruvallur High Road (CTH Road)
Ambattur Avadi Thiruninravur Nadukuthagai — Nolambur (between CTH Road and PH Road)
4 Along Poonamallee High Road (PH Road)
Thiruverkadu Poonamallee
Thirumazhisai Nerkundram Maduravoyal
— Vanagaram Nazarathpet Adayalampattu
5 Kundrathur Road Kundrathur — Mangadu — —
6 Along Arcot Road Valasaravakkam Porur
— Karambakkam — —
7 Poonamallee Bye Pass Road — — Ramapuram Nand-ambakkam
— Manapakkam Mugalivakkam Ayyapanthan-gal
8 Along GST Road St. Thomas Mount cum Pallavaram Contonment Alandur Palla-varam Tambaram Anakaputhur (Off GST Road)
Chitlapakkam Pammal
Peerkankaranal Perungalthur Mudichur (Off GST Road) Thiruneer-malai (off GST Road)
Polichalur (Off GST Road) Van-dalur
—
9 Alsong Medavakkam Road — Ullagaram-Pu-zhuthavakkam
Madipakkam — Sithalapakkam
10 Alsong Velachery - Tambaram Road
— Sembakkam Pallikaranai Madambak-kam (off Velachery-Tambaram Road)
Medavakkam Vengaivasal
11 Aong old Mahabalipuram Road
— — — Perungudi Okkiamtho-rapakkam Sholinganal-lur
Karapakkam Semmenchery
12 Along East Coast Road — — Kottivakkam Pala-vakkam
Neelankarai Injambakkam
—
13 Along Medavakkam - Sholinganallur road
— — — — Perumbakkam Jalladampettai
14 MMRD Road — — — — Kovilambak-kam
15 Along Inner Ring Road — — — — Mathur Chin-nasekkadu
Source: Table constructed using Census of Tamil Nadu 1971, 1981, 1991 and 2001 and existing land use map for CMA 2006 in Second Master Plan for Chennai Metropolitan Area 2026, (September 2008) prepared by Chennai Metropolitan Development Authority.
Institute of Town Planners, India Journal 8 - 4, October - December 2011, 31 - 57
Prof. Dr. S.P. Sekar and S. Kanchanamala
41
fig. 2: emergence of Vilalges in Chennai Metroplitan Area since 1971 till 2006
Institute of Town Planners, India Journal 8 - 4, October - December 2011, 31 - 57
Prof. Dr. S.P. Sekar and S. Kanchanamala
However the area below the central axis i.e. the south western and southern parts of the CMA shows a clustering pattern of settlements during each time period.
4.2 Population Density
Based on the density of population, villages in the CMA are categorized as extremely dense, highly dense, high dense, medium dense, low dense and very low
42
table 5: Categorization of Villages in CMA Based on Population Density During the Year 1971-2001
Categorization of villages based on population density
Density of population (in persons per square kilometer)
Number of villages under each category during the year
1971 1981 1991 2001
Extremely dense >5000 1 8 21 30
Very high dense 4001-5000 1 3 5 8
High dense 3001-4000 5 6 12 17
Medium dense 2001-3000 7 7 24 21
Low dense 1001-2000 19 16 47 41
Very less dense ≤1000 217 210 141 133Source: Constructed using Census of Tamil Nadu, 2001 and Second Master Plan for Chennai
Metropolitan Development Area 2026 (September 2008).
Institute of Town Planners, India Journal 8 - 4, October - December 2011, 31 - 57
Prof. Dr. S.P. Sekar and S. Kanchanamala
dense. Table 6 shows the categorization of villages based on population density during 1971-2001 and the number of villages under each category.
The number of villages with more than 5,000 persons per square kilometer has increased from 1 during 1971 to 30 during 2001. Consequent to the increase in number of villages with more than 3,000 persons per square kilometer in all the four decades, there is a decrease in the number of villages with less than 3,000 persons per square kilometer during 1991 and 2001. During 2001, the villages with extremely high population density over 5,000 persons per square kilometer are present abutting the Chennai city and along Grand Southern Trunk Road (GST Road), and East Coast Road in the southern side and along Thiruvottiyur High Road on the northern side of the CMA. Alandur along GST road is the densest village in the CMA with over 18,000 persons per square kilometer during 2001.
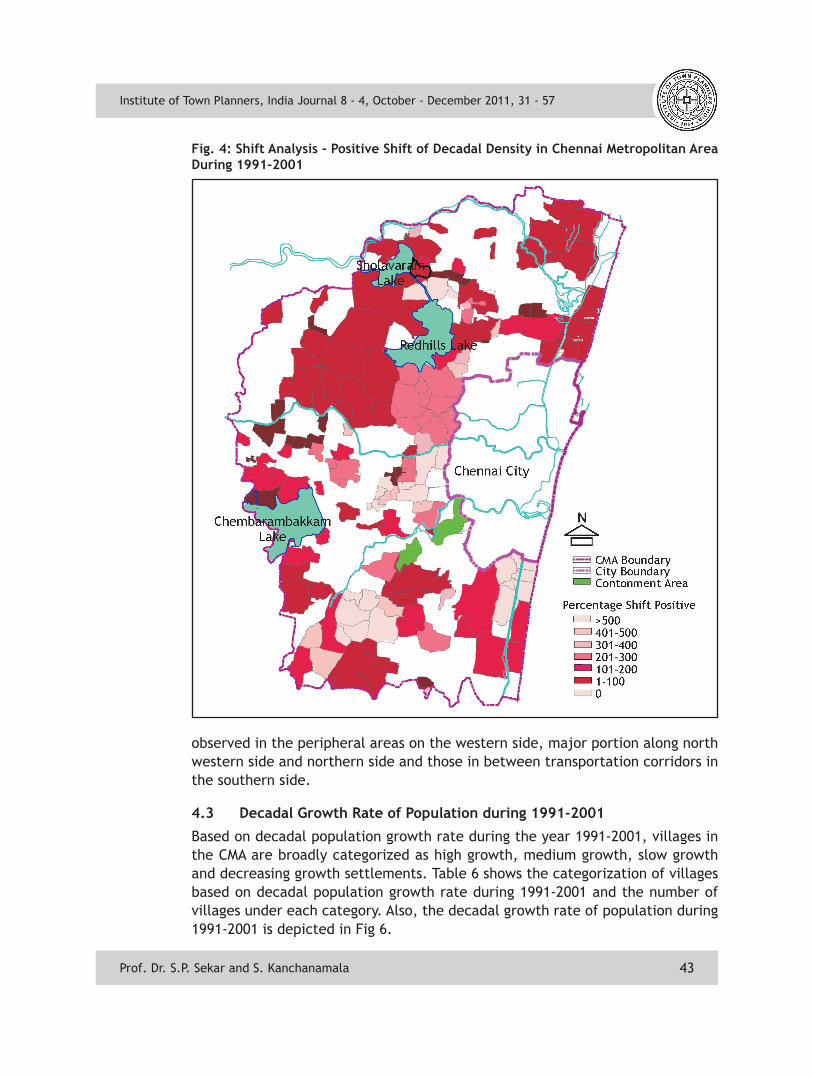
Villages with extremely high density, very high dense and high dense categories of villages are present. Most of the villages in the periphery of CMA fall under the low dense and very low dense category. Fig. 4 and 5 depict the positive and negative shift of population density respectively in the villages of the CMA during 1991-2001. The shift analysis of population density shows that the villages covered under positive shift of population density are present abutting the city boundary and along the major transportation corridors. Negative shift is
fig. 3: scatter Diagram representing the Distance of emerging Villages from Chennai City during 1971-2006
43
observed in the peripheral areas on the western side, major portion along north western side and northern side and those in between transportation corridors in the southern side.
4.3 DecadalGrowthRateofPopulationduring1991-2001
Based on decadal population growth rate during the year 1991-2001, villages in the CMA are broadly categorized as high growth, medium growth, slow growth and decreasing growth settlements. Table 6 shows the categorization of villages based on decadal population growth rate during 1991-2001 and the number of villages under each category. Also, the decadal growth rate of population during 1991-2001 is depicted in Fig 6.
fig. 4: shift Analysis - Positive shift of Decadal Density in Chennai Metropolitan Area During 1991-2001
Institute of Town Planners, India Journal 8 - 4, October - December 2011, 31 - 57
Prof. Dr. S.P. Sekar and S. Kanchanamala
44
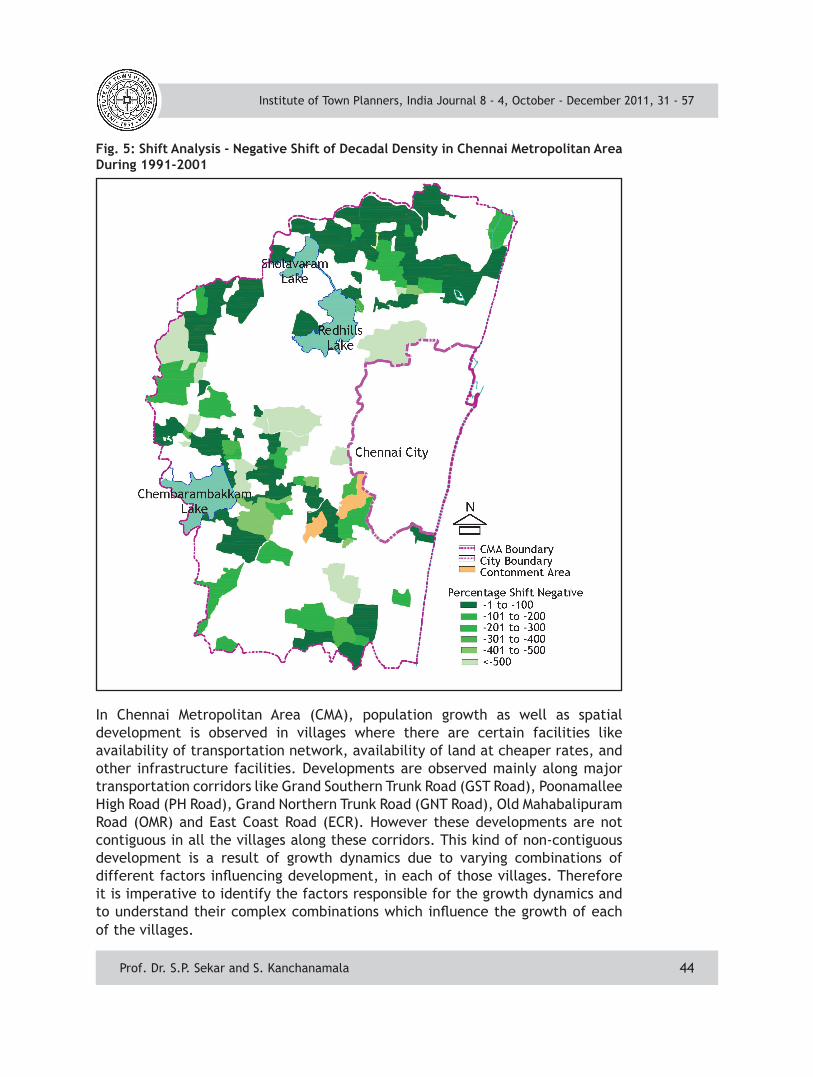
fig. 5: shift Analysis - negative shift of Decadal Density in Chennai Metropolitan Area During 1991-2001
Institute of Town Planners, India Journal 8 - 4, October - December 2011, 31 - 57
Prof. Dr. S.P. Sekar and S. Kanchanamala
In Chennai Metropolitan Area (CMA), population growth as well as spatial development is observed in villages where there are certain facilities like availability of transportation network, availability of land at cheaper rates, and other infrastructure facilities. Developments are observed mainly along major transportation corridors like Grand Southern Trunk Road (GST Road), Poonamallee High Road (PH Road), Grand Northern Trunk Road (GNT Road), Old Mahabalipuram Road (OMR) and East Coast Road (ECR). However these developments are not contiguous in all the villages along these corridors. This kind of non-contiguous development is a result of growth dynamics due to varying combinations of different factors influencing development, in each of those villages. Therefore it is imperative to identify the factors responsible for the growth dynamics and to understand their complex combinations which influence the growth of each of the villages.
45
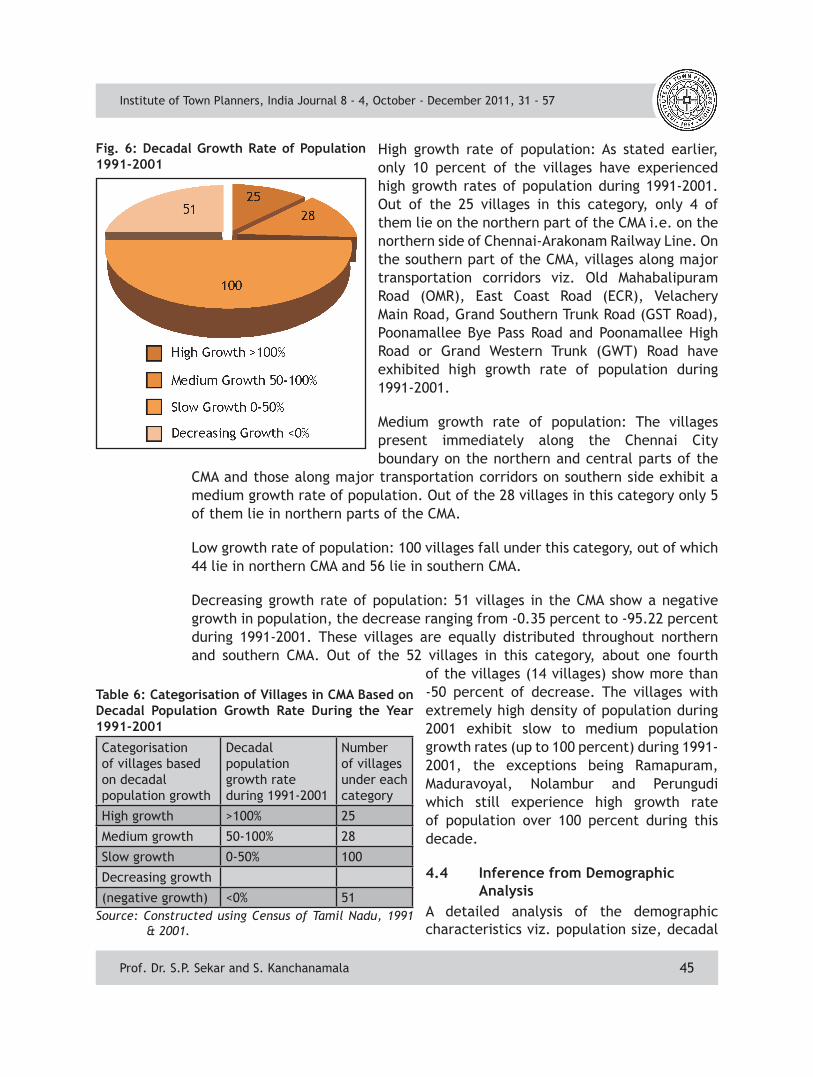
Fig.6:DecadalGrowthRateofPopulation1991-2001
High growth rate of population: As stated earlier, only 10 percent of the villages have experienced high growth rates of population during 1991-2001. Out of the 25 villages in this category, only 4 of them lie on the northern part of the CMA i.e. on the northern side of Chennai-Arakonam Railway Line. On the southern part of the CMA, villages along major transportation corridors viz. Old Mahabalipuram Road (OMR), East Coast Road (ECR), Velachery Main Road, Grand Southern Trunk Road (GST Road), Poonamallee Bye Pass Road and Poonamallee High Road or Grand Western Trunk (GWT) Road have exhibited high growth rate of population during 1991-2001.
Medium growth rate of population: The villages present immediately along the Chennai City boundary on the northern and central parts of the
CMA and those along major transportation corridors on southern side exhibit a medium growth rate of population. Out of the 28 villages in this category only 5 of them lie in northern parts of the CMA.
Low growth rate of population: 100 villages fall under this category, out of which 44 lie in northern CMA and 56 lie in southern CMA.
Decreasing growth rate of population: 51 villages in the CMA show a negative growth in population, the decrease ranging from -0.35 percent to -95.22 percent during 1991-2001. These villages are equally distributed throughout northern and southern CMA. Out of the 52 villages in this category, about one fourth
of the villages (14 villages) show more than -50 percent of decrease. The villages with extremely high density of population during 2001 exhibit slow to medium population growth rates (up to 100 percent) during 1991-2001, the exceptions being Ramapuram, Maduravoyal, Nolambur and Perungudi which still experience high growth rate of population over 100 percent during this decade.
4.4 Inference from Demographic AnalysisA detailed analysis of the demographic characteristics viz. population size, decadal
table 6: Categorisation of Villages in CMA Based on Decadal Population Growth Rate During the Year1991-2001
Categorisation of villages based on decadal population growth
Decadal population growth rate during 1991-2001
Number of villages under each category
High growth >100% 25
Medium growth 50-100% 28
Slow growth 0-50% 100
Decreasing growth
(negative growth) <0% 51Source: Constructed using Census of Tamil Nadu, 1991
& 2001.
Institute of Town Planners, India Journal 8 - 4, October - December 2011, 31 - 57
Prof. Dr. S.P. Sekar and S. Kanchanamala
46
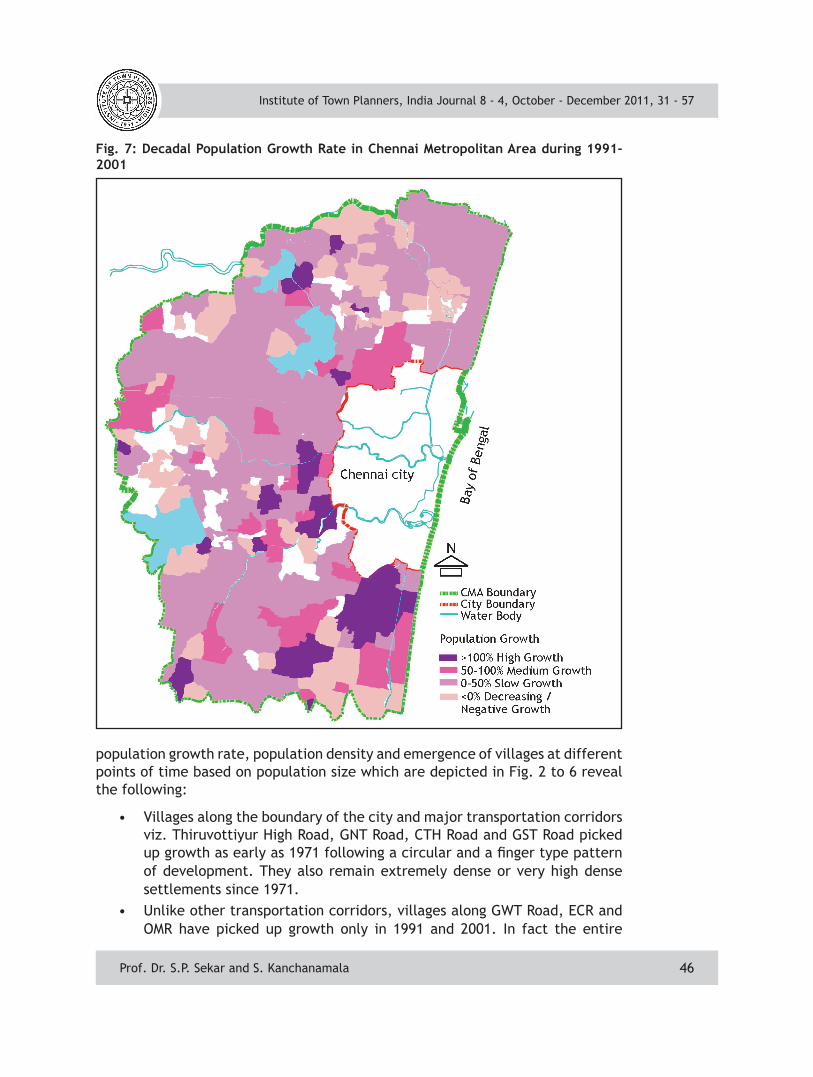
Fig.7:DecadalPopulationGrowthRateinChennaiMetropolitanAreaduring1991-2001
Institute of Town Planners, India Journal 8 - 4, October - December 2011, 31 - 57
Prof. Dr. S.P. Sekar and S. Kanchanamala
population growth rate, population density and emergence of villages at different points of time based on population size which are depicted in Fig. 2 to 6 reveal the following:
• Villages along the boundary of the city and major transportation corridors viz. Thiruvottiyur High Road, GNT Road, CTH Road and GST Road picked up growth as early as 1971 following a circular and a finger type pattern of development. They also remain extremely dense or very high dense settlements since 1971.
• Unlike other transportation corridors, villages along GWT Road, ECR and OMR have picked up growth only in 1991 and 2001. In fact the entire
47
southern part of the CMA along OMR and ECR has emerged only during 1991-2006.
• Villages emerged during 1991-2006 are experiencing slow to medium growth rates. Also they have shown a positive shift in population density which means that they are undergoing consolidation of population.
Institute of Town Planners, India Journal 8 - 4, October - December 2011, 31 - 57
Prof. Dr. S.P. Sekar and S. Kanchanamala
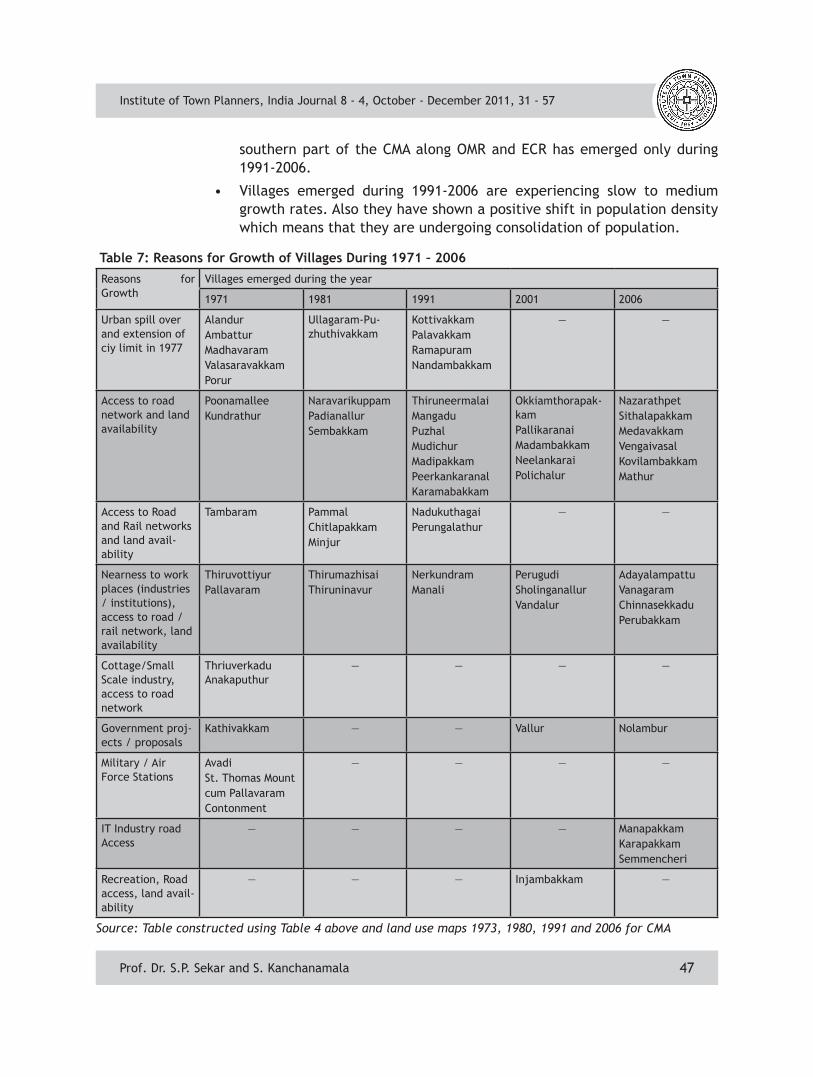
Table7:ReasonsforGrowthofVillagesDuring1971–2006Reasons for Growth
Villages emerged during the year
1971 1981 1991 2001 2006
Urban spill over and extension of ciy limit in 1977
AlandurAmbatturMadhavaramValasaravakkamPorur
Ullagaram-Pu-zhuthivakkam
KottivakkamPalavakkamRamapuramNandambakkam
— —
Access to road network and land availability
PoonamalleeKundrathur
NaravarikuppamPadianallurSembakkam
ThiruneermalaiMangaduPuzhalMudichurMadipakkamPeerkankaranalKaramabakkam
Okkiamthorapak-kamPallikaranaiMadambakkamNeelankaraiPolichalur
NazarathpetSithalapakkamMedavakkamVengaivasalKovilambakkamMathur
Access to Road and Rail networks and land avail-ability
Tambaram PammalChitlapakkamMinjur
NadukuthagaiPerungalathur
— —
Nearness to work places (industries / institutions), access to road / rail network, land availability
ThiruvottiyurPallavaram
ThirumazhisaiThiruninavur
NerkundramManali
PerugudiSholinganallurVandalur
AdayalampattuVanagaramChinnasekkaduPerubakkam
Cottage/Small Scale industry, access to road network
Thriuverkadu Anakaputhur
— — — —
Government proj-ects / proposals
Kathivakkam — — Vallur Nolambur
Military / Air Force Stations
AvadiSt. Thomas Mountcum PallavaramContonment
— — — —
IT Industry road Access
— — — — ManapakkamKarapakkamSemmencheri
Recreation, Road access, land avail-ability
— — — Injambakkam —
Source: Table constructed using Table 4 above and land use maps 1973, 1980, 1991 and 2006 for CMA
48
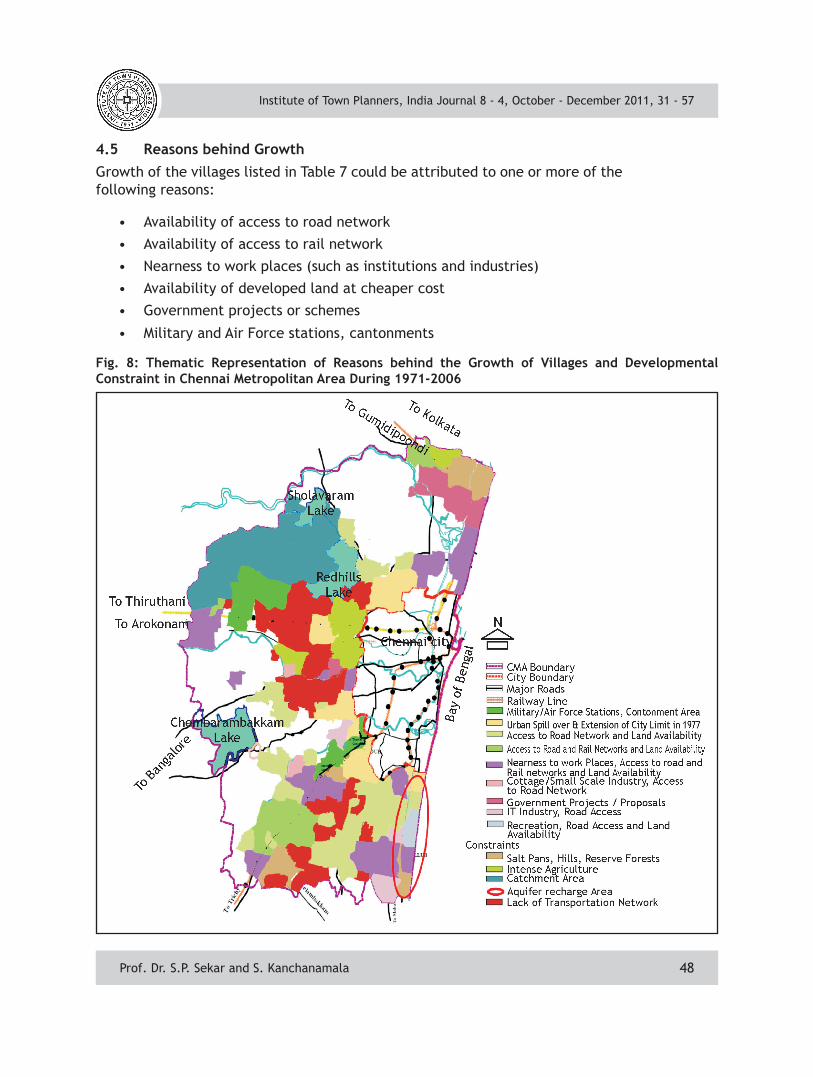
Fig. 8: Thematic Representation of Reasons behind the Growth of Villages and DevelopmentalConstraint in Chennai Metropolitan Area During 1971-2006
Institute of Town Planners, India Journal 8 - 4, October - December 2011, 31 - 57
Prof. Dr. S.P. Sekar and S. Kanchanamala
4.5 reasonsbehindGrowthGrowth of the villages listed in Table 7 could be attributed to one or more of the following reasons:
• Availability of access to road network
• Availability of access to rail network
• Nearness to work places (such as institutions and industries)
• Availability of developed land at cheaper cost
• Government projects or schemes
• Military and Air Force stations, cantonments
49
• Religious places
• Recreation centres
Table 7 lists out the reasons for the growth of each of the villages during 1971 – 2006. Thematic representation of the reasons behind the growth of villages and the developmental constraints is shown in Fig. 8. During 1971-1981, villages immediately along the boundary of the Chennai city grew mainly because of the spillover of the urban activities. This was mainly because of the nearness of villages of Kanagam, Tharamani, Thiruvanmiyur, Velacheri, Kodambakkam (part), Virugambakkam, Saligramam, Koyambedu, Thirumangalam, Villivakkam, Erukkancheri, Kolathur and Kodungaiyur with the city during the year 1977 and the impetus created in the neighboring villages. Further reasons are such as ancient temple towns, military and air force establishments, old industrial towns, and good access for road and rail networks. For instance, Alandur along the city boundary on the southern side is a hub of mixed residential activities mainly due to urban spill over. Further it has good accessibility by road and rail network, and has been very close to work places like the Guindy Industrial Estate. Thiruvottiyur, lying just outside the city boundary on the northern side is an ancient temple town with good access by means of both road and rail network. It is also an industrial area with premier industries such as Corborundum Universal Ltd, WIMCO Match Factory, ITC Ltd., Enfield, MRF, and KCP India Ltd.
On the other hand, Pallavaram and Tambaram, quite far away from the city boundary have also shown development as early as 1971 in a non-contiguous fashion along the GST Road and the southern line of Chennai sub-urban Railway. The reasons for the outgrowth of Pallavaram are nearness to work places such as electrical, leather and pharmaceutical industries, educational institutions, access to road and rail network. Suburban Railway terminal, nearness to work places, residential quarters, educational institutions (Madras Christian College) are the reasons for the outgrowth of Tambaram. On the other hand villages such as Minambakkam, Tirusulam and Chitlapakkam, though having the advantages of access to both road and rail networks and presence of institutions did not show development because of constraints such as large portion of land owned by Airports Authority of India in Minambakkam, large portion of land under Hill in Tirusulam and large portion of land under water body in Chitlapakkam.
Ambattur village along the CTH road, quite away from city boundary has good access by road and rail network, industrial estate and land available for development and so it has outgrown Korattur and Padi villages just along the city boundary as they continued with agriculture activities and they lacked internal roads and land for development. These villages have picked up development with industries and residences only during 1981 after the extension of Chennai city limit.
Institute of Town Planners, India Journal 8 - 4, October - December 2011, 31 - 57
Prof. Dr. S.P. Sekar and S. Kanchanamala
50
Institute of Town Planners, India Journal 8 - 4, October - December 2011, 31 - 57
Prof. Dr. S.P. Sekar and S. Kanchanamala
Developments along the Thiruvottiyur Ponneri Panchetti Road (TPP Road) and the northern railway line to Kolkata are also not contiguous. After Thiruvottiyur and Kathivakkam which emerged in 1971, Minjur in the extreme end along these corridors emerged in the year 1981 leaving behind villages such as Manali, Vaikkadu, Kadapakkam, Vellivoyal, Vallur, Ennore, Athipattu and Nandiyambakkam. All these villages lacked good accessibility to road network. Manali remains an industrial village and it picked up development only during 1991 after the development of Inner Ring Road. Buckingham Canal, Ennore Creek and Kosathalaiar River were constraints on development in this stretch as there were no connectivity by bridges, culverts and so they lack transportation facilities. Also there were agricultural activities as well as salt pans which prevented new developments. However, Minjur present after these villages possessed facilities such as high schools, health centre, banks, connectivity to the neighboring places, veterinary hospital, Block Development Office and theatres which helped in the emergence of the village in the year 1981. Vallur present before Minjur has emerged only in the year 2001 after the commencement of the North Chennai Thermal Power Station, widening of the TPP Road and Athipattu Main Road and the Ennore Port works.
Altogether, it is evident from Table 7 that over 70 percent of the villages emerged during 2001 and 2006 mainly because of two reasons viz. (i) access to road network and land availability and (ii) nearness to work places and institutions along with access to road/rail network and land availability. Development, improvement and widening of roads such as Poonamallee Bye Pass Road, Velachery – Tambaram Road, Medavakkam – Sholinganallur Road and MMRD Road have drastically improved the potential for development. Next to these reasons, the boom in the IT industry and related road development activities in the southern part of the CMA have led to the growth of even the remotest village in the CMA viz. Semmencheri and also Karapakkam. As stated in the previous section, the reasons behind non-contiguous growth pattern include:
• Physical constraints such as water bodies, hills, salt pans, estuaries, swamps, catchment areas, low lying areas and reserve forests.
• Development restrictions in areas such as Coastal Regulation Zone (CRZ), aquifer recharge area, prohibited area around IAF station, cantonments and agriculture/non-urban/open space and recreation land use zones.
5. fACtors AnD AssessMent of InDICes of GrowtH DYnAMICs
5.1 results of Analysis
The results of both Factor Analysis and Principal Component Analysis techniques revealed that the development of a village in the CMA could be attributed to the following four indices:
51
• Index of accessibility: Villages with high degree of accessibility in terms of road or rail connectivity have high factor scores.
• Index of physical quality and land availability: Villages with good environmental and social conditions and with availability of land for development have obtained high factor scores.
• Index of nearness to workplaces and cheap land availability: Villages with industrial and institutional activities and where cost of land is low have obtained high factor scores.
• Index of proposals: Villages where new projects and schemes are proposed have obtained high factor scores under this category.
Our analysis helped in drawing a conclusion that the variables relating to land value, availability of land for development, nearness to work places, government proposals, accessibility by road and rail, environmental and social conditions have greater influence on the growth of a given village than all other variables. In particular, more number of villages in southern CMA has shown higher growth rates than those in the northern CMA in view of the fact that they have better accessibility with good frequency both in terms of road and rail transportation which helped in commuting to workplaces. Also cheap lands are available in localities with good social and environmental conditions. Based on this observation, interventions are suggested to have a balanced development throughout the CMA, by dividing the entire CMA area into nine zones, each one of them planned with one or more focal points.
5.2 IndexofAccessibilitytoTransportationNetwork
In order to evaluate the first index viz. the ‘index of accessibility’, the transportation network in the CMA, the population dynamics during the year 1991 and 2001 and the corresponding land use changes that have happened in the CMA are studied. The elaborate discussion in section 4 above on the population aspect has already revealed that population growth and population density are on the higher side along the transportation corridors.
During 1991, dense developments are present along major transportation corridors viz. Thiruvottiyur High Road, GNT Road, Inner Ring Road (Jawaharlal Nehru Salai), Chennai-Arakonam Railway Line, Madras Thiruvallur High Road (Present Chennai Thiruvallur High Road), Poonamallee High Road, Arcot Road, Poonamallee Bye Pass Road, GST Road, Velachery Tambaram Road, Old Mahabalipuram Road (Present IT corridor- Rajiv Gandhi Salai) and ECR.
During 2006, developments are spread in few more villages along the above transportation corridors with filling up of developments in the vacant areas within the already developed areas. The villages away from the city have sporadic
Institute of Town Planners, India Journal 8 - 4, October - December 2011, 31 - 57
Prof. Dr. S.P. Sekar and S. Kanchanamala
52
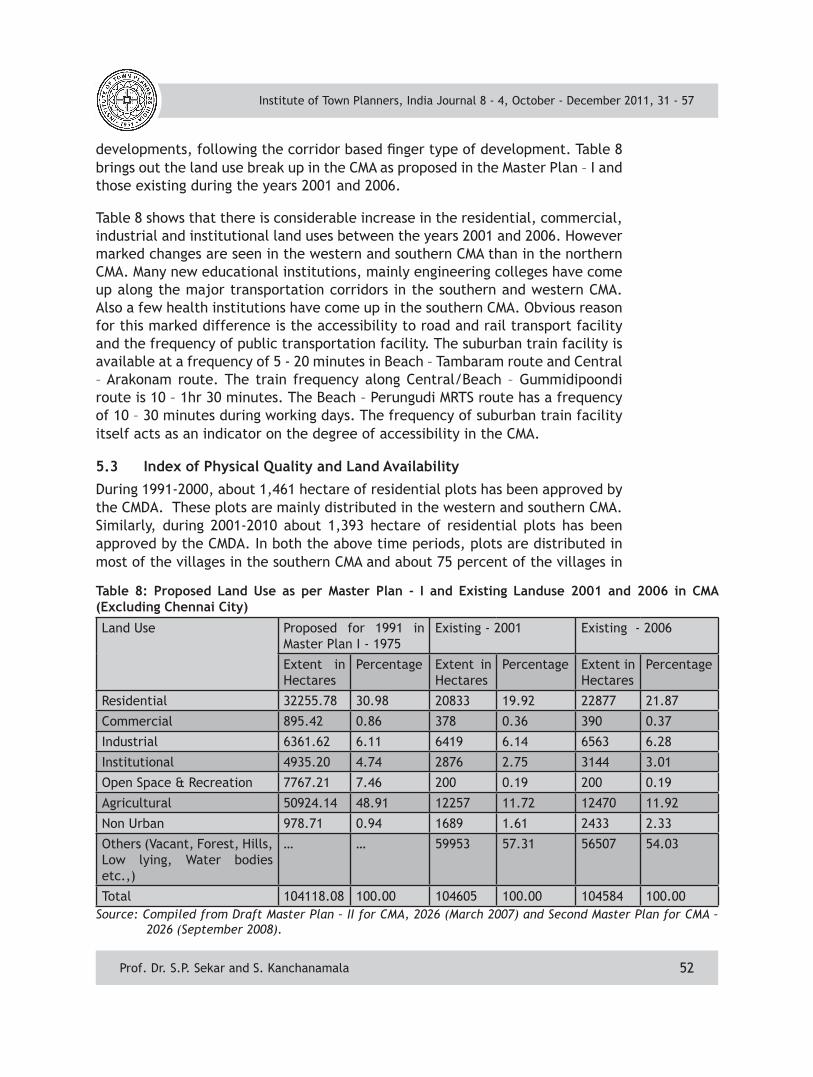
table 8: Proposed land use as per Master Plan - I and existing landuse 2001 and 2006 in CMA (excluding Chennai City)
Land Use Proposed for 1991 in Master Plan I - 1975
Existing - 2001 Existing - 2006
Extent in Hectares
Percentage Extent in Hectares
Percentage Extent in Hectares
Percentage
Residential 32255.78 30.98 20833 19.92 22877 21.87
Commercial 895.42 0.86 378 0.36 390 0.37
Industrial 6361.62 6.11 6419 6.14 6563 6.28
Institutional 4935.20 4.74 2876 2.75 3144 3.01
Open Space & Recreation 7767.21 7.46 200 0.19 200 0.19
Agricultural 50924.14 48.91 12257 11.72 12470 11.92
Non Urban 978.71 0.94 1689 1.61 2433 2.33
Others (Vacant, Forest, Hills, Low lying, Water bodies etc.,)
… … 59953 57.31 56507 54.03
Total 104118.08 100.00 104605 100.00 104584 100.00Source: Compiled from Draft Master Plan – II for CMA, 2026 (March 2007) and Second Master Plan for CMA –
2026 (September 2008).
Institute of Town Planners, India Journal 8 - 4, October - December 2011, 31 - 57
Prof. Dr. S.P. Sekar and S. Kanchanamala
developments, following the corridor based finger type of development. Table 8 brings out the land use break up in the CMA as proposed in the Master Plan – I and those existing during the years 2001 and 2006.
Table 8 shows that there is considerable increase in the residential, commercial, industrial and institutional land uses between the years 2001 and 2006. However marked changes are seen in the western and southern CMA than in the northern CMA. Many new educational institutions, mainly engineering colleges have come up along the major transportation corridors in the southern and western CMA. Also a few health institutions have come up in the southern CMA. Obvious reason for this marked difference is the accessibility to road and rail transport facility and the frequency of public transportation facility. The suburban train facility is available at a frequency of 5 - 20 minutes in Beach – Tambaram route and Central – Arakonam route. The train frequency along Central/Beach – Gummidipoondi route is 10 – 1hr 30 minutes. The Beach – Perungudi MRTS route has a frequency of 10 – 30 minutes during working days. The frequency of suburban train facility itself acts as an indicator on the degree of accessibility in the CMA.
5.3 Index of Physical Quality and land Availability
During 1991-2000, about 1,461 hectare of residential plots has been approved by the CMDA. These plots are mainly distributed in the western and southern CMA. Similarly, during 2001-2010 about 1,393 hectare of residential plots has been approved by the CMDA. In both the above time periods, plots are distributed in most of the villages in the southern CMA and about 75 percent of the villages in
53
the western CMA. In the northern CMA approved layouts are there only along the transportation corridors.
As per the land use maps, more industries are present in the northern and western CMA, which are special and hazardous industries creating pollution in these areas. In contrast, number of buildings being used for Information Technology (IT) and Information Technology Enabled Services (ITES) has come up in the southern CMA, mainly along the OMR – IT corridor (Rajiv Gandhi Salai). Further many of the industries in Ambattur and Guindy Industrial Estates are undergoing transformations into IT and ITES offices inviting more developments in the western part of the CMA.
5.4 Index of nearness to work Places and Availability of land at Cheaper Costs
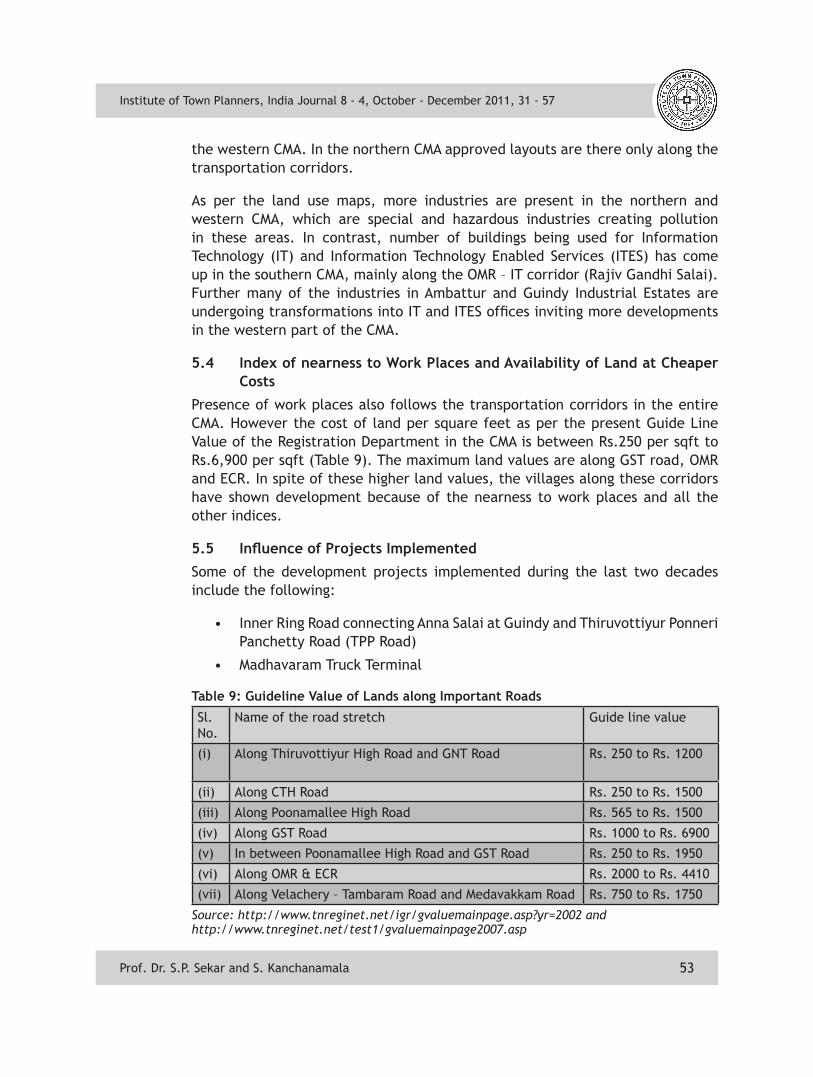
Presence of work places also follows the transportation corridors in the entire CMA. However the cost of land per square feet as per the present Guide Line Value of the Registration Department in the CMA is between Rs.250 per sqft to Rs.6,900 per sqft (Table 9). The maximum land values are along GST road, OMR and ECR. In spite of these higher land values, the villages along these corridors have shown development because of the nearness to work places and all the other indices.
5.5 InfluenceofProjectsImplemented
Some of the development projects implemented during the last two decades include the following:
• Inner Ring Road connecting Anna Salai at Guindy and Thiruvottiyur Ponneri Panchetty Road (TPP Road)
• Madhavaram Truck Terminal
table 9: Guideline Value of lands along Important roads
Sl. No.
Name of the road stretch Guide line value
(i) Along Thiruvottiyur High Road and GNT Road Rs. 250 to Rs. 1200
(ii) Along CTH Road Rs. 250 to Rs. 1500
(iii) Along Poonamallee High Road Rs. 565 to Rs. 1500
(iv) Along GST Road Rs. 1000 to Rs. 6900
(v) In between Poonamallee High Road and GST Road Rs. 250 to Rs. 1950
(vi) Along OMR & ECR Rs. 2000 to Rs. 4410
(vii) Along Velachery – Tambaram Road and Medavakkam Road Rs. 750 to Rs. 1750
Source: http://www.tnreginet.net/igr/gvaluemainpage.asp?yr=2002 andhttp://www.tnreginet.net/test1/gvaluemainpage2007.asp
Institute of Town Planners, India Journal 8 - 4, October - December 2011, 31 - 57
Prof. Dr. S.P. Sekar and S. Kanchanamala
54
Institute of Town Planners, India Journal 8 - 4, October - December 2011, 31 - 57
Prof. Dr. S.P. Sekar and S. Kanchanamala
• Sathangadu Iron and Steel Market
• NH Bypass Road connecting GST Road at Peerkankaranai - Irumbuliyur and Poonamallee High Road at Maduravoyal and its extension till GNT Road
• Development/Improvement of roads such as Poonamallee Bye Pass Road, Velachery –Tambaram Road, ECR and MMRD Road
• Special concessions for designated IT/ITES buildings including permitting multi-storeyed buildings for IT / ITES purpose outside City limits within the CMA
• Declaration of OMR within the CMA as IT corridor and widening of OMR by Tamil Nadu Road Development Corporation
• OMR – ECR link road at Sholinganallur
• Outer Ring Road (ORR) linking GST Road Grand Western Trunk Road (NH 4), GNT Road and TPP Road which is under progress
• Mass Rapid Transit System (MRTS) Phase III Extension from Velachery to St. Thomas Mount, which is targeted for completion by December 2011
• Local Bodies Assistance Programme to improve infrastructure facilities like roads, streetlights, improvement of burial ground, and purchase of vehicles for water supply, sewage disposal and solid waste management. The CMDA gives 90 percent grant for the local bodies for this programme.
• Chennai Urban Transport sub-component under Tamil Nadu Urban Development Project (TNUDP)-III, which comprises of widening and strengthening of existing five roads for a total stretch of 36 km.
• Community Based Environment Development Programme with 80 percent grant from the CMDA, limited to a maximum of Rs.10 lakh per year for improvement to the burning/burial grounds, improvement to the parks/play fields, solid waste management, de-silting of lakes/ponds/tanks to augment water supply and improve the ground water table, construction/renovation of toilets and other environmental improvements in the schools run by local bodies, construction of storm water drains, construction of common utility buildings, and any other projects with an object to improve local environment.
• Housing schemes by Tamil Nadu Housing Board and Tamil Nadu Slum Clearance Board in villages like Sholinganallur, Semmencheri, and Nolambur.
Projects have definitely enhanced the face value of the respective villages and their immediate surroundings in which they are implemented.
6. VAlIDItY of tHe InDICes of GrowtH trenDs
An elaborate discussion in the previous sections brings about the fact that the four indices viz. accessibility, physical quality and land availability, nearness to
55
work places and availability of cheap land and proposals, framed from the results of the Factor Analysis and Principal Component Analysis techniques applied on the twenty two variables could very well explain the growth trend of an area. This study has proved that the above factors are very much responsible for the trend of growth of the CMA during 1991-2001. Therefore the model could be applied for any area for any time period with the required data (either actual set of values or the projected values) for all the twenty two variables, and applying the said techniques the principal component or the factors responsible for growth at that point of time could be identified.
The study has been carried out with population data pertaining to one decade i.e. 1991-2001. The Second Master Plan for CMA – 2026 has brought out Development Regulations for all developments within the CMA which is a positive sign to attract development in the slow and medium growth settlements also because of the provisions such as:
• Permitting multi-storeyed buildings in the rest of the CMA also excluding the Island Grounds, approved layout areas, Aquifer recharge area and Redhills catchment area
• Permitting IT buildings and bio-informatics centers in mixed residential, commercial, institutional use zones
• Defining IT corridor along the Rajiv Gandhi Salai (Old Mamallapuram Road)
• Treating buildings with maximum 6 dwelling units under ‘Ordinary Building’ category as against the earlier limit of 4 dwelling units
• Accommodating working women’s hostels and old age homes in the primary residential areas
• Proposing transfer of development rights in cases of road widening
• Providing for restricted developments in aquifer recharge area
• Reducing plot extent or side setback requirements
• Allowing multi-storey buildings (MSBs) along 12 m and 15 m wide roads with limitations on FSI and height
• Reservation of 10 percent of land for EWS/LIG with dwelling sizes not exceeding 45 sqm, in the case of special buildings, group developments, multi-storeyed buildings on land of extent exceeding 1 hectare either within the site proposed for the development or in a location within a radius of 2 km from a site under reference
• Allowing additional FSI 0.25 in cases of special buildings and group developments with dwelling units each not exceeding 45 sqm floor area
Further there are projects in store for the immediate future such as
• Elevated expressway;
Institute of Town Planners, India Journal 8 - 4, October - December 2011, 31 - 57
Prof. Dr. S.P. Sekar and S. Kanchanamala
56
Institute of Town Planners, India Journal 8 - 4, October - December 2011, 31 - 57
Prof. Dr. S.P. Sekar and S. Kanchanamala
• Extension of Corporation limit by including 8 Municipalities, 8 Town Panchayats and 25 Village Panchayats in CMA;
• Truck terminal at Karunakaracheri and Annambedu villages near Thiruninravur along Outer Ring Road;
• Sea water desalination plants; and
• Extension of jurisdiction of Chennai Metropolitan Water Supply and Sewerage Board for providing water supply and sewerage facilities in villages outside city limit.
All the new, ongoing and proposed development projects may have an impact on the growth trend of the CMA in general and the villages in which they are implemented in particular. In addition to the projects proposed by government agencies, there are several developments being carried out by the private developers and institutions which may also alter the development potential of a particular area. Therefore, the weightages for each of variables identified may be altered by assigning values according to the expected relative benefits in each of the villages. The results of the exercise would be the guiding factor in decision making for development of the area as a whole.
7. ConClusIons
In the context of rapid urbanization, planning for development of the metropolitan area deserves utmost importance on par with the city area. Since the urban areas abutting the city area are targeted by the urbanization process, projection of future population, planning for achieving a balanced growth in terms of population density, planning for provision of adequate infrastructure facilities, strengthening of the institutional mechanisms, monitoring and enforcing of regulatory measures, planning for in-built mid-course corrective measures and futuristic planning for adjacent areas outside the metropolitan area need emphasis. This is where identification of variables responsible for the growth trends and adoption of an appropriate technique to identify the impact of each of the variables on the growth trends come into picture and serve as a guiding feature for decision making in the planning process. This paper has explored the usefulness of the variables identified in judging the present growth trend of the CMA. The growth trendsare found to follow the indices identified using Factor Analysis and Principal Component Analysis and thus the validity of the model is proved. This is a positive sign for adopting the model in a similar situation elsewhere in the world.
referenCes
Bracken, I. (1981) Urban Planning Methods: Research and Policy Analysis, Methuen, London.
Batty, M. (2007) Model Cities, CASA working Paper Series - Paper113, February 2007 (The 10th Abercrombie Lecture 2006). http://www.casa.ucl.ac.uk/working_papers/ paper113.pdf, dated 14.07.2009
57
Chapin, S. F. Jr. and Weiss, S.F. (Eds.) (1962) Urban Growth Dynamics in a Regional Cluster of Cities, John Wiley, London.
Chattopadhyay, R.N. and Subramanian, K.P. (1993) Spatial pattern of urban settlements in Tamil Nadu, Journal of Institute of Town Planners, India, Vol.12, No.1(155).
Chennai Metropolitan Development Authority (2007) Draft Master Plan – II for Chennai Metropolitan Area – 2026, Chennai Metropolitan Development Authority, Chennai.
Chennai Metropolitan Development Authority (2008) Second Master Plan for Chennai Metropolitan Area – 2026, Chennai Metropolitan Development Authority, Chennai.
Demography World Urban Areas and Population Projections: 5th Comprehensive Edition (Revised), April 2009, http://www.demographia.com/db-worldua2015.pdf, dated 20.02.2010.
Gar-On Yeh, A. and Li, X. (2002) Urban simulation using Neural Networks and Cellular Automata for Land Use Planning, Symposium on Geospatial Theory, Processing and Applications, Ottawa, 2002. http://www.isprs.org/Commission4/Proceedings02/pdfpapers/036.pdf, dated 15.07.2009.
Kanchanamala, S. (1996) Growth Dynamics and Development Interventions in Madras Metropolitan Area, MTP Thesis, Anna University, Chennai, Chennai.
Nathaniel, J.M. (1974) Readings in Urban Dynamics, Vol. I, Wright-Allen Press, Massachusetts.
Rahman, M.R. (2007) Urban Spatial Growth Analysis of Khulna City, http://www.gisdevelopment.net/application/urban/sprawl/RejaurRahman.htm, dated 21.10.2010.
Shenghe, L. and Sylvia, P. (2002) Spatial Patterns and Dynamic Mechanisms of Urban Land Use Growth in China: Case studies in Beijing and Shanghai, Interim Report IR-02-005, International Institute for Applied Systems Analysis, Austria.
Yoshitaka, K., Hiroshi, T., Satoshi, T.O.I. and Shinya, Y. (2005)An Approach for Predicting Land Use Changes in an Urbanization Control Area- A case study of Japanese Regional Hub City, European Regional Science Association (ERSA) 45th Congress, August 2005, http://www-sre.wu-wien.ac.at/ersa/ersaconfs/ersa05/papers/415.pdf , dated 10.03.2010.
weBsItes
http://census2001.tn.nic.in/pca2001.aspx
http://www.tnreginet.net/igr/gvaluemainpage.asp?yr=2002
http://www.tnreginet.net/test1/gvaluemainpage2007.asp
http://www.tn.gov.in/cma/Urban-Report.pdf
http://www.southernrailway.gov.in/sr/sutt/MAS_SPE.pdf
http://www.chennai.tn.nic.in/chndistprof.htm#loc
Institute of Town Planners, India Journal 8 - 4, October - December 2011, 31 - 57
Prof. Dr. S.P. Sekar and S. Kanchanamala