an analysis of haptoglobin genotypes and recovery …
TRANSCRIPT
1
AN ANALYSIS OF HAPTOGLOBIN GENOTYPES AND RECOVERY FROM ANEURYSMAL SUBARACHNOID HEMORRHAGE
by
Ellen Kantor
Bachelor of Science in Nursing, University of Pittsburgh, 2010
Bachelor of Philosophy, University of Pittsburgh, 2010
Submitted to the Graduate Faculty of
School of Nursing in partial fulfillment
of the requirements for the degree of
Bachelor of Philosophy
University of Pittsburgh
2010
2
UNIVERSITY OF PITTSBURGH
SCHOOL OF NURSING
This thesis was presented
by
Ellen Kantor
It was defended on
July 21, 2010
and approved by
Yvette Conley, PhD, Associate Professor, Health Promotion and Development,
University of Pittsburgh School of Nursing
Dianxu Ren, MD, PhD, Assistant Professor, Health and Community Systems,
University of Pittsburgh School of Nursing
Hülya Bayır, M.D., Associate Professor, Department of Critical Care Medicine, Department
of Environmental and Occupational Health, University of Pittsburgh
J. Javier Provencio, MD, FCCM, Assistant Professor of Medicine, Lerner College of
Medicine, Cleveland Clinic
Thesis Director: Sheila Alexander, PhD, RN, Assistant Professor, Acute-Tertiary Care
Department, University of Pittsburgh School of Nursing

3
Copyright © by Ellen Kantor
2010
4
ABSTRACT
Background: Haptoglobin (Hp) binds hemoglobin (Hgb), thereby inhibiting free radical
production. It is presumed that Hp α2-α2 genotype is associated with worse functional outcome
after aneurysmal subarachnoid hemorrhage (aSAH) related to its isoform’s weaker affinity for
Hgb binding, decreased clearance of hemoglobin from the site of hemorrhage, and an associated
increase in secondary injury.
Objective: The objective is to describe the relationship between haptoglobin genotype and
mortality and gross functional outcome after aSAH.
Methods: A total sample of 268 subjects was narrowed down to a sample of 193 Caucasian
subjects (due to differences in allele frequency distribution among races), age 18-75 with a
diagnosis of aSAH, Fisher Grade ≥2, DNA and outcome data available and without pre-existing
chronic neurologic disease/deficit were enrolled into an ongoing study (NR004339).
Demographic and medical condition variables were extracted from medical records. Modified
Rankin Score (MRS) and Glasgow Outcome Score (GOS) were assessed at 3, 6, 12, and 24
months after hemorrhage. Data analysis included univariate analysis as well as multivariate
logistic regression analysis, controlling for covariates including age, sex, and severity of
hemorrhage (Fisher grade).
AN ANALYSIS OF HAPTOGLOBIN GENOTYPES AND RECOVERY FROM
ANEURYSMAL SUBARACHNOID HEMORRHAGE
Ellen Kantor, BSN
University of Pittsburgh, 2010
5
Results: The sample was primarily female (n=138; 71.5%) and Caucasian (n=237; 88.4%) with
a mean age of 54.45 years. This sample was further narrowed down to include only subjects of
Caucasian race due to differences in allele frequency distribution among other races previously
published in literature. Haptoglobin 2-2 genotype was significantly correlated with MRS at 3
months post aSAH during univariate analysis (p=.04) and after controlling for covariates in the
multivariate logistic regression analysis (p=.05). Univariate analysis produced a significant
(p=.02) relationship between subjects whose genotypes yielded at least one α-2 allele and
development of cerebral vasospasm (CV). Subjects whose genotypes had only one α-2 allele
were significantly (p=.01) associated with Fisher grade. Fisher grade and Hunt and Hess score
were both significantly associated with poor outcomes on MRS at all four time periods. Age was
significantly (p=.01) correlated with Hp 1-1 and Hp 1-2 genotypes—specifically, these patients
were younger than those with Hp 2-2 genotype. After controlling for covariates Fisher grade
was the only covariate that maintained significance in predicting outcomes after aSAH at all four
time periods.
Conclusions: Subjects whose genotypes contain at least one α-2 allele more often had poor
outcomes on MRS at 3 months post aSAH and were more likely to develop CV. Additionally,
haptoglobin genotype can be used as predictor of gross functional outcome when measured using
MRS at 3 months after aSAH. The Fisher grading scale and Hunt and Hess scoring system are
both significantly useful for predicting outcomes (GOS, MRS, mortality) at all four time periods
after aSAH.
6
TABLE OF CONTENTS
INTRODUCTION ....................................................................................................................... 12
1.1 SUBARACHNOID HEMORRHAGE ............................................................. 12
1.2 HAPTOGLOBIN ............................................................................................... 13
1.3 PURPOSE ........................................................................................................... 15
1.4 SPECIFIC AIMS ............................................................................................... 15
1.5 RESEARCH QUESTIONS/HYPOTHESIS .................................................... 16
2.0 BACKGROUND ........................................................................................................ 17
2.1 SUBARACHNOID HEMORRHAGE ............................................................. 17
2.1.1 Demographics ................................................................................................. 17
2.1.2 Secondary injury: Cerebral Vasospasm ...................................................... 18
2.1.3 Outcomes ........................................................................................................ 19
2.2 HAPTOGLOBIN ............................................................................................... 19
2.2.1 Gene to Protein .............................................................................................. 19
2.2.2 Protein Structure and Function ................................................................... 20
2.2.2.1 Haptoglobin in inflammation. ............................................................ 21
2.2.2.2 Haptoglobin as an anti-oxidant. ......................................................... 21
2.2.2.3 Haptoglobin in subarachnoid hemorrhage. ...................................... 21
2.3 SUMMARY ........................................................................................................ 22
7
3.0 METHODS ................................................................................................................. 24
3.1 DESIGN .............................................................................................................. 24
3.2 SAMPLE ............................................................................................................. 24
3.3 SETTING ............................................................................................................ 25
3.4 RECRUITMENT ............................................................................................... 26
3.5 STANDARD MEDICAL CARE ...................................................................... 26
3.6 DATA COLLECTION ...................................................................................... 27
3.7 MEASUREMENT ............................................................................................. 28
3.7.1 Independent variable: Haptoglobin genotyping ......................................... 28
3.7.1.1 DNA Extraction.. ................................................................................. 29
3.7.1.2 Genotyping procedure. ....................................................................... 29
3.7.1.3 Dichotomization of the sample.. ......................................................... 29
3.7.2 Dependent variable: Gross functional outcome .......................................... 29
3.7.2.1 Clinical outcome scales. ...................................................................... 30
(a) Glasgow outcome scale. ............................................................................. 30
(b) Modified Rankin Scale. ............................................................................. 31
(c) Mortality. .................................................................................................... 34
3.7.3 Covariate: severity of injury ......................................................................... 34
3.7.4 Covariate: demographic characteristics ...................................................... 37
3.8 DATA MANAGEMENT ................................................................................... 37
3.9 DATA ANALYSIS PLAN ................................................................................. 37
3.9.1 Preliminary data analysis ............................................................................. 38
3.9.2 Analysis of specific aims ................................................................................ 39
8
4.0 RESULTS ................................................................................................................... 41
4.1 SAMPLE DESCRIPTION ................................................................................ 41
4.1.1 α-2 allele presence and Fisher grade ............................................................ 44
4.1.2 α-2 allele presence and age. ........................................................................... 44
4.1.3 α-2 allele presence and CV ............................................................................ 45
4.2 VARIABLES ...................................................................................................... 46
4.2.1 Independent variable: Haptoglobin genotype ............................................. 46
4.2.2 Dependent variable: gross functional outcome ........................................... 52
4.3 RESEARCH QUESTIONS ............................................................................... 53
4.3.1 Research question #1 ..................................................................................... 53
4.3.1.1 Univariate analysis. ............................................................................. 53
(a) Hp genotype and MRS. ............................................................................. 53
(b) Hp genotype and GOS. ............................................................................. 54
(c) Hp genotype and mortality.. ..................................................................... 55
(d) Fisher grade and MRS. ............................................................................. 55
(e) Hunt and Hess score and MRS. ................................................................ 55
4.3.1.2 Multivariate Logistic Regression Analysis. ...................................... 56
(a) Gross functional outcome and Hp genotype. .......................................... 56
(b) Gross functional outcome and Fisher grade. .......................................... 56
(c) Age, sex, and gross functional outcome. .................................................. 58
4.3.2 Research question # 2 .................................................................................... 60
4.3.2.1 Univariate analysis. ............................................................................. 60
(a) α-2 allele presence and MRS. ................................................................... 60
9
5.0 DISCUSSION ............................................................................................................. 63
5.1 HAPTOGLOBIN GENOTYPE AND ALPHA-2 ALLELE PRESENCE .... 64
5.2 HAPTOGLOBIN GENOTYPE AND AGE .................................................... 65
5.3 HAPTOGLOBIN GENOTYPE AND GROSS FUNCTIONAL
OUTCOME ……………………………………………………………………………….66
5.4 ALPHA-2 ALLELE PRESENCE AND GROSS FUNCTIONAL
OUTCOME ......................................................................................................................... 67
5.5 CONCLUSIONS ................................................................................................ 68
5.6 IMPLICATIONS FOR FUTURE RESEARCH ............................................. 69
BIBLIOGRAPHY ....................................................................................................................... 71
10
LIST OF TABLES
Table 1. Severity of injury characteristics of entire sample: Fisher grade .................................... 42
Table 2. Severity of injury characteristics of Caucasian sample: Fisher grade ............................ 42
Table 3. Severity of injury characteristics of entire sample: Hunt and Hess grade ...................... 43
Table 4. Severity of injury characteristics of Caucasian sample: Hunt and Hess grade ............... 43
Table 5. Demographic information and severity of injury characteristics of the entire sample by
Hp genotype .................................................................................................................................. 47
Table 6. Hp genotype distribution by race of the Caucasian patient population .......................... 48
Table 7. Hp genotype and GOS .................................................................................................... 55
Table 8. Hp genotype and mortality ............................................................................................. 55
Table 9. Statistical significance (p) of univariate analysis of the relationship between MRS and
Hunt and Hess score and Fisher grade .......................................................................................... 56
Table 10. Statistical significance (p) of multivariate logistic regression analysis of the
relationship between gross functional outcome and Fisher grade ................................................ 57
Table 11. Statistical significance (p) of multivariate logistic regression analysis of the
relationship between gross functional outcome and Hp genotype ................................................ 58
Table 12. Statistical significance (p) of multivariate regression analysis of the relationship
between age, sex, and gross functional outcome (MRS, GOS, mortality) ................................... 59
11
LIST OF FIGURES
Figure 1. Hp protein structure ....................................................................................................... 20
Figure 2. Glasgow outcome scale ................................................................................................. 31
Figure 3. Modified Rankin Scale .................................................................................................. 33
Figure 4. Fisher grading scale. ...................................................................................................... 35
Figure 5. Hunt and Hess grading scale ......................................................................................... 36
Figure 6. Hp genotype by mean age in the caucasian population ................................................. 45
Figure 7. Distribution of the Caucasian sample by Hp genotype ................................................. 49
Figure 8. Distribution of the African American sample by Hp genotype ..................................... 50
Figure 9. α-2 allele presence in the Caucasian sample ................................................................. 51
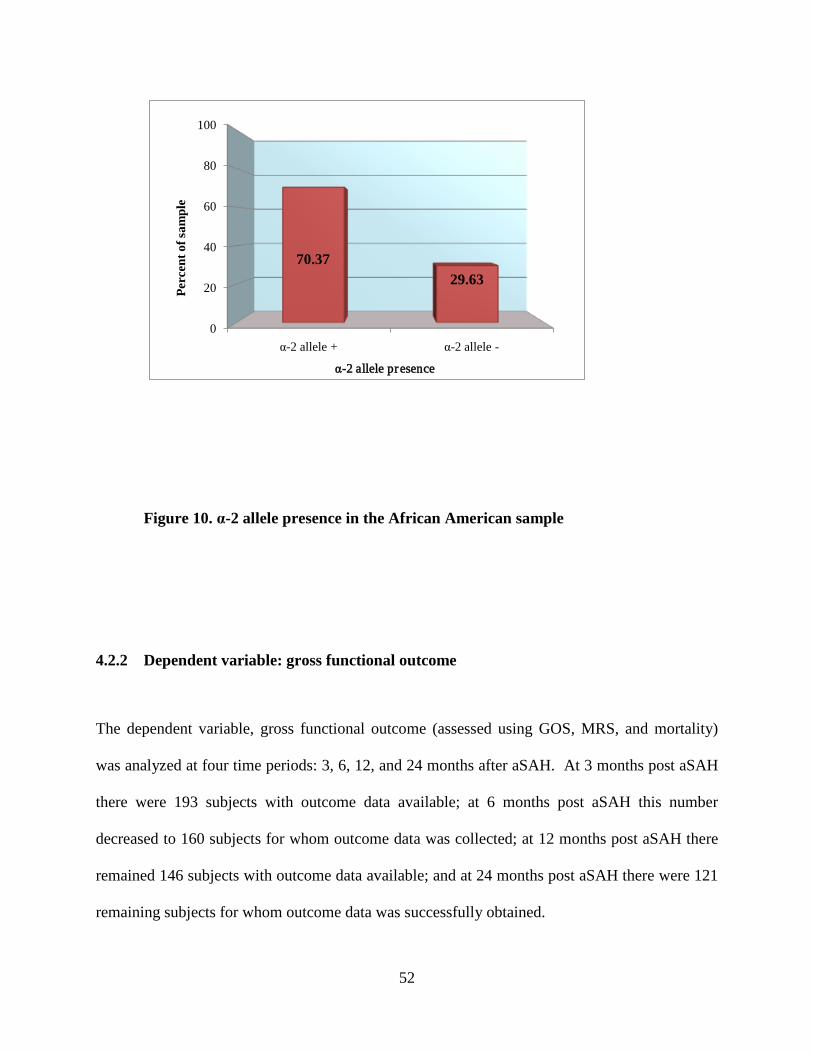
Figure 10. α-2 allele presence in the African American sample ................................................... 52
Figure 11. Hp genotype and mean MRS ....................................................................................... 54
Figure 12. Mortality of sample by Hp genotype ........................................................................... 60
Figure 13. Distribution of subjects by α-2 allele presence versus mean MRS ............................. 61
Figure 14. Mortality of sample by time period and presence of α-2 allele ................................... 62
12
INTRODUCTION
1.1 SUBARACHNOID HEMORRHAGE
Subarachnoid hemorrhage (SAH), the deposition of blood into the subarachnoid space,
affects approximately 30,000 Americans annually [1]. In approximately eighty percent of non-
traumatic SAH cases, intracranial aneurysmal rupture is the cause (aSAH) [2]. Typically, SAH
is associated with a 40-50% mortality rate [3, 4], while outcomes and complications such as
rebleeding, increased intracranial pressure (ICP), reduction of cerebral blood flow, brain edema,
vasospasm, hydrocephalus, and seizures in survivors are correlated with level of consciousness
on admission, age, and the amount of blood visible in the cranium by CT scan [5]. These
morbidities lead to poor outcome profiles. Delayed ischemia, a common result of aSAH is
ischemic brain damage often secondary to cerebral vasospasm and is principally responsible for
many of the cognitive and physical deficits after aSAH [6]. Kramer et al. found that patients
with lower serum concentrations of hemoglobin (Hgb) had poorer outcomes than those patients
with higher serum concentrations of Hgb in the first two weeks after aSAH [7]. It is
hypothesized that the breakdown process of accumulated red blood cells releases Hgb into the
cerebrospinal fluid (CSF) filled subarachnoid space and produces an environment that is
conducive to free radical production, inflammation, and secondary injuries including cerebral
vasospasm (CV) [8-14]. After aSAH, there is also nitric oxide deficiency that may promote
13
vasoconstriction, secondary injury and poor outcome after aSAH [15, 16]. CV is the leading
cause of morbidity and mortality after aSAH, affecting approximately 50% of aSAH patients
[13, 14, 17]. In those patients surviving the initial hemorrhage, physical disabilities and
cognitive deficits are common, with only 20% of patients returning to their pre-aSAH
functioning [17, 18].
1.2 HAPTOGLOBIN
Haptoglobin (Hp) is present in the human serum as an acute phase protein (APP) whose
chief action is to bind hemoglobin (Hgb), therefore inhibiting its interaction with nitric oxide
(NO) (which disables NO’s ability to vasodilate) and preventing an inflammatory response and
the oxidative activity that produces free radicals. Borsody and associates report that Hgb has a
decreased ability to produce prostaglandins as a result of the Hp-Hgb binding [9]. The
sequestration of free Hgb and, therefore, indirect disabling of prostaglandin synthesis inhibits
platelet aggregation and fluctuations in blood pressure. These fluctuations result in instability of
the vasoconstriction/vasodilation process, which often results in vasospasm [8-14]. In humans,
production of the Hp protein is a result of the transcription and translation of the Hp gene on
chromosome 16q22.1. [15, 19]. The Hp protein consists of a α-chain and a β-chain, both made
from the same gene, although only the α-chain contains genetic variance resulting in either a α-1
or α-2 allele [15, 20]. These alleles are transcribed into similar, yet structurally and functionally
different protein products. Genetic variability leads to three variations of the acute phase protein
isoform: these are α1-α1, α1-α2, and α2-α2. These three variations affect a human’s ability to
neutralize Hgb [9, 15]. The α-2 isoform , in comparison to the α-1 isoform, is associated with a
14
weaker affinity for Hgb, therefore generating poorer inhibition of free radical and prostaglandin
production [9]. Additionally, literature suggests that the α-2 isoform creates a larger Hp protein
[9]. Due to the increased size of the Hp-Hgb complex formed with the α -2 isoform, it is not
cleared as easily [9]. Hp is expressed in various tissues, although most prominently in hepatic
tissue [21].
Current literature establishes the Hp α-2 variant as one with the weakest ability to bind
Hgb and the more potent inducer of the inflammatory response, which may promote
vasoconstriction and CV [9]. Since it is hypothesized that the α-2 allele is less capable of
binding Hgb and therefore inhibiting prostaglandin synthesis and other inflammatory effects,
there appears to be an increased amount of red blood cells in the CSF filled subarachnoid space
in patients with at least one α-2 allele in their genotypes because the α-2 protein product is not
cleared as well from CSF. This produces an environment that is conducive to free radical
production and inflammation, both of which potentiate CV. CV may lead to delayed cerebral
ischemia (DCI) and its negative effects on physical and cognitive functioning. Rabinstein calls
for a larger study that incorporates clinical measures of functional outcomes of aSAH is before
Hp genotyping can be appropriated for use in clinical procedures[22]. We hypothesize that
patients with a Hp α2-α2 genotype will have poorer outcomes after aSAH. Additionally, we
hypothesize that patients whose genotype consists of at least one α-2 will have poorer outcomes
than patients who do not possess the α-2 allele in their genotypes and that these outcomes will
exhibit a dose-response type association with the presence of the α-2 allele.
15
1.3 PURPOSE
The purpose of this study was to determine the correlation between the varying Hp
genotypes and outcome from aSAH. Results of this study will serve multiple purposes such as
providing insight into the physiologic mechanisms influencing recovery and outcome after aSAH
and developing a genetic prognostic marker for use in the aSAH population.
1.4 SPECIFIC AIMS
In summary, aSAH occurs when an aneurysm ruptures and expels blood into the
subarachnoid space, leading to accumulation of this blood in the CSF. The degree to which
patients suffer depends on multiple factors, including size of bleed (upon initial presentation of
amount of blood on CT scan). Hp is an acute serum protein that functions mainly to bind Hgb,
thereby promoting its clearance from the aSAH site in order to alleviate the negative effects of
free Hgb such as inflammation and vasospasm. Hp genotype may influence clearance of the
Hgb, which may lead to differing outcomes in patients. In order to accomplish our purpose, we
established the following specific aims:
1. Describe the distributions of Hp genotypes in our aSAH population.
2. Describe the presence of Hp alleles among different races in our aSAH population.
3. Evaluate differences in gross functional outcomes after aSAH by Hp genotype in
Caucasians.
16
4. Evaluate differences in gross functional outcomes after aSAH by Hp α-2 allele presence
in Caucasians.
1.5 RESEARCH QUESTIONS/HYPOTHESIS
1. Is there a difference in gross functional outcome from aSAH based on Hp genotypes in
Caucasians?
2. Is there a difference in gross functional outcome from aSAH based on Hp α-2 allele
presence in Caucasians?
We hypothesized that Caucasians harboring at least one Hp α-2 allele will have poorer gross
functional outcomes after aSAH.
17
2.0 BACKGROUND
2.1 SUBARACHNOID HEMORRHAGE
Subarachnoid hemorrhage (SAH) occurs when the space between the arachnoid and pia
layers of the meninges becomes filled with extravasated blood, most commonly as a result of
aneurysmal rupture. An aneurysm is a weakening and bulging of a vessel, which resembles a
ballooning of the vessel. When an aneurysm ruptures, blood is released into the CSF filled
subarachnoid space. This influx of blood can also result from blunt trauma that causes
intracranial bleeding, however this source of SAH is associated with a different recovery profile
compared to aSAH. SAH affects approximately 30,000 Americans annually and carries a
mortality rate of 40-50% [1, 4]. Over half of those whom survive the initial injury go on to face
complications such as increased ICP, CV, cerebral edema, seizures or stroke [5]. These
complications are characterized by poor outcome profiles, and less than half of aSAH survivors
resume normal pre-hemorrhage function by the first year of recovery [17].
2.1.1 Demographics
Aneurysmal SAH is more common among females with a peak incidence at 55 years of age on
average [5]. Further risk factors for the development of aSAH are: the African-American race
18
[5, 23], cigarette smoking [24-27], hypertension [28], heavy alcohol use [4, 28, 29], and cocaine
use [5]. Patients with a family history of first-degree relatives with aSAH are also at a higher
risk [26, 28, 30-32]. Furthermore, patients who have a family history of aSAH are predisposed
to suffering from the injury at a younger age than those who have no family history [31].
However, in the same study it was found that there is a greater genetic component for aSAH
between siblings than between parents and children, although neither finding was significant
[31].
2.1.2 Secondary injury: Cerebral Vasospasm
CV is the leading cause of morbidity and mortality after aSAH, affecting approximately 50% of
aSAH patients [13, 14, 17]. The risk of CV is directly proportional to the concentration of blood
in the CSF, specifically in the subarachnoid space and ventricles [33]. The byproducts of
hemoglobin breakdown also affect the regulation of vasodilatation/vasoconstriction processes of
the cerebral vasculature [8-14]. CV can be defined angiographically and clinically.
Angiographic CV is defined as a narrowing of major cerebral arteries through which dye is
infused [10]. Clinical symptoms may result from regional brain ischemia and include headache,
increasing blood pressure, nausea, vomiting, photophobia, loss of consciousness, and/or new
onset of acute focal deficit. Therefore, aSAH patients can be separated into three categories: (1)
those who possess angiographic and clinical symptoms of CV (2) those who possess only signs
of angiographic CV (3) those who exhibit neither clinical symptoms nor angiographic signs of
CV (CV negative)[17, 34, 35]. CV occurs in two phases and in two presentations [17]. Acute
CV occurs within hours of the initial hemorrhagic injury, and the delayed CV usually presents
between four and twenty-one days later [17]. The delayed narrowing is associated with DCI and
19
the new onset of neurological deficits that can result from decreased delivery of oxygen to
cerebral matter.
2.1.3 Outcomes
Of all aSAH patients, approximately 30% die before reaching the hospital [2] and the one-year
survival rate after suffering an aSAH is 30% [28]. Only 20% of patients will return to their full
pre-aSAH physical and cognitive functional status, while the remaining patients will suffer from
physical disability affected activities of everyday living, as well as cognitive deficits in areas of
learning and long-term memory [2, 17, 18].
2.2 HAPTOGLOBIN
2.2.1 Gene to Protein
The Hp protein is coded for by a single gene on chromosome 16q22.1 and consists of two
isoforms, α and β. The α isoform can produce two alleles, α-1and α-2, while the β isoform is
common to all phenotypes and exhibits no genetic variance [9, 19]. The wild type α -1 allele can
be further differentiated into either a α -1F allele or α -1S allele, which differ by their speeds of
migration on an electrophoresis gel [19, 46]. The presence of a α -1F allele or α -1S allele results
in slightly different protein structure (amino acid charge) that does not impact functioning[46].
The variant type α-2 allele resulted from a crossing over of the α -1F and α -1S allele, and exists
only in humans [15, 46]. Variability in the three genotypes, α1- α1, α1- α2, α2- α2, leads to three
possibilities for the APP phenotype: Hp 1-1, Hp 1-2, and Hp 2-2.
20
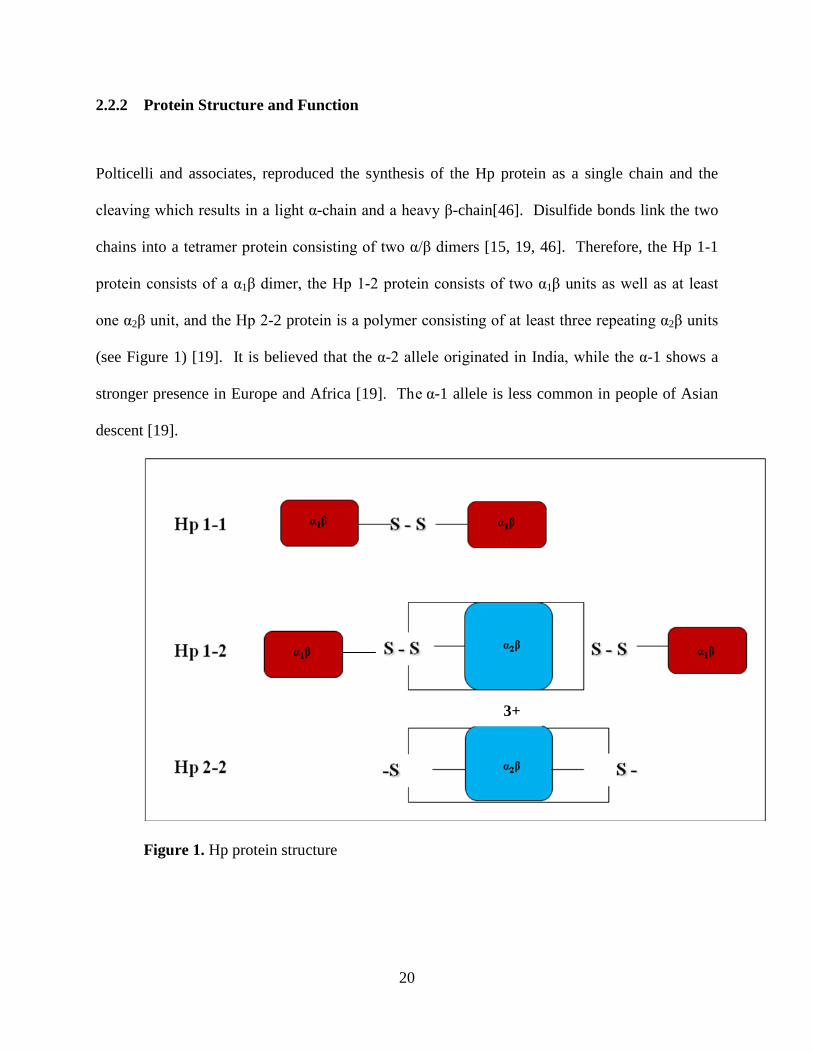
2.2.2 Protein Structure and Function
Polticelli and associates, reproduced the synthesis of the Hp protein as a single chain and the
cleaving which results in a light α-chain and a heavy β-chain[46]. Disulfide bonds link the two
chains into a tetramer protein consisting of two α/β dimers [15, 19, 46]. Therefore, the Hp 1-1
protein consists of a α1β dimer, the Hp 1-2 protein consists of two α1β units as well as at least
one α2β unit, and the Hp 2-2 protein is a polymer consisting of at least three repeating α2β units
(see Figure 1) [19]. It is believed that the α-2 allele originated in India, while the α-1 shows a
stronger presence in Europe and Africa [19]. The α-1 allele is less common in people of Asian
descent [19].
Figure 1. Hp protein structure
3+
21
2.2.2.1 Haptoglobin in inflammation. The Hp protein is a member of the family of APPs that
are expressed in the liver in response to the inflammatory response in order to restore
homeostasis and express their anti-inflammatory effects [19, 21]. Hp is a type 2 APP because it
is activated in response to these IL-6 cytokines, the primary responders to the inflammatory
response [21]. Prostaglandin synthesis is stimulated by free Hgb and this process leads to
platelet aggregation and blood pressure fluctuations. Hp’s binding affinity for Hgb inhibits the
prostaglandin synthesis, thereby indirectly inhibiting the secondary effects.
2.2.2.2 Haptoglobin as an anti-oxidant. Iron can act as a catalyst for the generation of free
radicals from free Hgb. Free radicals are capable of causing oxidative stress to the tissues and
vasculature in the body [19]. These highly reactive species are inhibited when Hp binds Hgb,
thereby Hp acts as an anti-oxidant. Hp 2-2 appears to have a decreased ability to act as an anti-
oxidant, in comparison with Hp 1-1 or Hp 1-2, most likely related to its decreased affinity for
hemoglobin binding [19]. Additionally, the larger Hp 2-2 protein may be unable to penetrate
vasculature and tissues and is associated with decreased Hgb clearance because of its larger size.
2.2.2.3 Haptoglobin in subarachnoid hemorrhage. Hp’s main job is to bind free hemoglobin
and facilitate its clearance via the CD163 pathway and the reticuloendothelial system,
specifically the spleen. The CD163 receptor is specific for the Hp:Hgb complex and is expressed
only by macrophage and monocytes during inflammation [46]. The CD163 receptor binds the
Hp:Hgb complex at Hp’s β-chain and has a binding affinity for the complex twice that of the
binding affinity for either Hp or Hgb individually, and the CD163 receptor exhibits the following
binding affinity for Hp proteins: Hp 2-2>Hp 1-2>Hp 1-1 [46]. The Hp 1-1 protein is the smallest
and exhibits the highest binding affinity for Hgb, unlike Hp 2-2, the largest of the three proteins
22
with the lowest binding affinity for Hgb [15, 19, 21]. Therefore, there may be a correlation
between α-2 alleles, phenotype, and outcomes in patients who suffer from injuries that result in
overwhelming amounts of free Hgb in the body, such as in aSAH. Although the α-1 allele
promotes increased clearance of Hgb from the CSF and diminishes the negative effects of free
Hgb such as inflammation and CV, the α-1 allele is associated with decreased surface area for
binding Hgb as compared to the α-2 allele and is also associated with an increased ability to pass
through the glomerulus and cause kidney damage, both due to the smaller size of the protein
generated by the α-1 allele [15, 21].
2.3 SUMMARY
In summary, aSAH occurs after an aneurysm ruptures leading to an influx of Hgb into the
CSF. The accumulation of blood in the CSF can lead to inflammation and CV. Hp is an APP
present in the serum of humans that is responsible for binding Hgb and inhibiting the oxidative
stress that can result from its interaction with vessels. Hp genotype may influence clearance of
Hgb, and therefore outcomes after aSAH.
The purpose of this study was to determine the correlation between the varying Hp genotypes
and outcomes after aSAH. Results of this study will serve multiple clinical purposes such as
providing insight into the physiologic mechanisms influencing recovery and outcome after aSAH
and will facilitate the development of a genetic, prognostic marker(s) for use in the aSAH
population. To accomplish this goal, we will address the following specific aims:
1. Describing the distributions of Hp genotypes in our aSAH population.
2. Describing the presence of Hp alleles among different races in our aSAH population.
23
3. Evaluating differences in gross functional outcomes after aSAH by Hp genotype in
Caucasians.
4. Evaluating differences in gross functional outcomes after aSAH by Hp α-2 allele
presence in Caucasians.
Furthermore, we will test the following research questions:
1. Is there a difference in gross functional outcome from aSAH based on Hp genotypes in
Caucasians?
2. Is there a difference in gross functional outcome from aSAH based on Hp α-2 allele
presence in Caucasians?
The review of literature as well as our own research questions led us to hypothesize that
Caucasians harboring at least one Hp α-2 allele will have poorer gross functional outcomes after
aSAH.
24
3.0 METHODS
3.1 DESIGN
This retrospective study used a between-group, within-subject design to examine gross
functional outcome at three, six, twelve, and twenty-four months after the aSAH in 193
individuals (with and without CV) who were classified by Hp genotype. This study was part of a
larger parent study funded by the NIH grant NR004339 (Co-PI’s Sherwood & Poloyac).
3.2 SAMPLE
The University of Pittsburgh Medical Center admits approximately 60 patients per year,
60% women and 9% African American, for treatment of severe aSAH. These demographics are
consistent with the general population of patients who are affected by aSAH. All patients
admitted to the Neurovascular Intensive Care Unit were screened for eligibility for this study
based on the following criteria.
Inclusion criteria:
1. 18-75 years of age
2. Diagnosis of aSAH (Hunt and Hess grade ≥3 or Fisher grade ≥2) verified by
CT scan
25
3. Placement of a CSF drainage catheter within 3 days of SAH
4. Outcome data and DNA available
Exclusion criteria:
1. Any pre-existing, chronic neurologic disease or deficit that was uncontrolled
or static.
2. SAH resulting from a non-aneurysmal source such as traumatic injury,
mycotic aneurysm, or arterio-venous malformation
3. Died within 72 hours after hospital admission, precluding evaluation of CV.
In order to accurately conduct this study, the parent study and any further analyses, it was
necessary to exclude children because the incidence of aSAH in children is <.001% [47].
Additionally, the study excluded patients with a pre-existing, neurological disease or deficit to
reduce the risk of any biased outcome assessments. Patients who had an aSAH graded as Hunt
and Hess ≥ 3 and/or Fisher grade ≥ 2 have an increased risk of CV. Exclusion of patients with
SAH from non-aneurysmal sources occurred because this population has a different course of
recovery.
3.3 SETTING
Subjects were recruited after admission to the Neurovascular Intensive Care Unit
(NVICU), Presbyterian University Hospital (PUH), University of Pittsburgh Medical Center
(UPMC), Pittsburgh, Pennsylvania. This 20 bed unit is specializes in acute care for patients after
neurological injury.
26
3.4 RECRUITMENT
This study was conducted as a retrospective, secondary analysis of data collected during a
parent study funded by NIH/NINR RO1 NR04339 (Co-PI’s Sherwood & Poloyac). Nursing staff
accompanied project personnel during daily rounds on the NVICU to review potential patients
for eligibility criteria. Once eligibility was established, the bedside nurse approached the patient
or the patients’ families and verified if the study personnel could present the study to them. If the
patient/representative was willing, the nurse would introduce the study personnel, after which the
study personnel would present the ongoing research study, and obtain informed consent. This
study as well as the parent study were both reviewed and approved by the University of
Pittsburgh Institutional Review Board. Removal of all patient identifiers from medical records
and samples was done to assure subject confidentiality. Furthermore, a nonidentifying study
number was provided to link the sample(s) obtained to the medical record data. The PI of this
study (Kantor) received de-identified data, labeled with the study ID number only, for the
purpose of statistical analysis.
3.5 STANDARD MEDICAL CARE
All individuals presenting to the UPMC PUH with aSAH are admitted to the NVICU.
Upon admission, a CT scan of the head is performed and Hunt and Hess grade and Fisher grade
are assigned by the neurosurgeon or a neuroradiologist. To identify aneurysm presence and
perform interventional procedures (such as coil embolization), cerebral angiography is
conducted. Depending on the preferred treatment for the patient (as determined by the attending
27
neurosurgeon) either embolization or surgical clipping is performed as soon as possible. In the
NVICU, monitoring of the SAH patient includes continuous arterial blood pressure (ABP),
central venous pressure (CVP), pulse oximetry, respiratory rate and cardiac rate and rhythm.
Mean arterial blood pressure (MAP) is maintained with anti-hypertensive or vasopressor
medications. Complete neurologic exam was conducted every 1-2 hours for the first 24 hours
after admission and then every 2-4 hours until discharge from the NVICU, as per clinical need.
Placement of an intraventricular drain occurs if ICP for continuous monitoring and/or CSF
drainage is necessary for clinical care. Temperature is monitored rectally or orally every two
hours. Maintaining fluid balance is accomplished by administering fluid bolus. The head of the
bed is elevated thirty degrees. Nimodipine (Nimotop) is administered at a dose of 60mg every 4
hours for 14 days as tolerated to decrease risk of CV as secondary injury. Anti-convulsants are
administered to decrease risk of seizure activity after a brain injury such as SAH. Sedatives are
administered as needed for agitation.
3.6 DATA COLLECTION
Data regarding demographics and medical condition of subjects were extrapolated from medical
records and recorded by project personnel onto data collection sheets. These sheets were
electronically transmitted directly into databases using Teleform, an automated data entry and
verification system. The project data was stored in a locked office in the University of Pittsburgh
School of Nursing. Cerebrospinal fluid (CSF) samples were drawn at least once daily using the
UPMC ventriculostomy drain bag change standard procedure. Specimens were drawn only while
the drainage catheter was in place for routine medical care. CSF was sampled from the bag

28
during bag exchange, and distributed evenly into three-1 ml tubes and placed into a -80°C freezer
located in the laboratory on the second floor of the Victoria Building, School of Nursing,
University of Pittsburgh. Blood samples (3 mL) were drawn upon enrollment and
deocyribonucleic acid (DNA) extracted. Specimens were analyzed and DNA extraction and
amplification (using polymerase chain reaction (PCR)) was performed by the laboratory
technicians in Dr. Conley’s molecular genetics laboratory under the supervision and guidance of
Dr. Conley.
3.7 MEASUREMENT
The study independent variable was the Hp genotype. Gross functional outcome was the
dependent variable. Data on the severity of injury and demographic characteristics (age, sex,
race) was collected for potential inclusion in the investigation as covariates.
3.7.1 Independent variable: Haptoglobin genotyping
The following DNA extraction and genotyping procedures were utilized to determined
Hp genotype from the CSF or blood samples.
29
3.7.1.1 DNA Extraction. The CSF specimens were quick thawed in small batches. Blood
specimens were processed within 48 hours of collection. DNA was extracted from blood using a
simple salting out procedure as described by Miller and colleagues [48]. DNA was extracted
from CSF using the Qiamp extraction kit and provided protocols from Qiagen Corporation.
3.7.1.2 Genotyping procedure. Quantitative real-time polymerase chain reaction (qRT-PCR)
was utilized to generate genotypes and evaluate relative copy number of the Hp α-2 allele.
Primers and probes were designed to multiplex amplify the region containing the duplication that
identifies the Hp α-2 allele as well as a region 5’ to the gene as a control measurement for
relative comparisons. qRT-PCR was conducted using Taqman technology using ABI7000 and
SDS 2.0 software (Applied Biosystems Incorporated, Foster City, CA). Raw data was analyzed
using the ∆∆Ct method.
3.7.1.3 Dichotomization of the sample. The sample was dichotomized based on Hp α-2 allele
presence in two ways. First, subjects were classified into two groups: the first was a Hp α-2
positive group, which included subjects with Hp 1-2 and Hp 2-2 genotype and the second was a
Hp α-2 negative group, which included only subjects with Hp 1-1 genotype. The second
dichotomization was done to separate subjects who possessed a α-1 allele in their genotypes.
Therefore, we again created two groups: one group consisted of subjects with Hp 1-1 and Hp 1-2
genotypes while the other group consisted of only those subjects with Hp 2-2 genotype.
However, we still used all three genotypes, Hp 1-1, Hp 1-2, Hp 2-2, in our analyses.
3.7.2 Dependent variable: Gross functional outcome
30
Outcomes were measured using the Glasgow Outcome Score (GOS), Modified Rankin Scale
(MRS), and mortality at 3, 6, 12, and 24 months after aSAH. Mortality was extracted from
medical records, attending physician communication, and/or MRS. A trained
Neuropsychological technician obtained all outcome data. Assessments were completed during a
face-to-face interview in the outpatient Neurosurgery clinic. If the subject was unable to travel,
GOS and MRS were obtained by telephone interview with the primary caregiver. As this data
was completed independently of the current project, the neuropsychological technician was
blinded to genotyping results.
3.7.2.1 Clinical outcome scales.
(a) Glasgow outcome scale. The Glasgow outcome scale (GOS), not to be
confused with the Glasgow coma score (GCS), is a clinical observation scale
used for assessing consciousness and categorizes functional outcomes into
five levels with a score of 1 meaning death and a score of 5 meaning good
recovery [40](see Figure 2). GOS was dichotomized into good outcomes
(scores 4, 5) and poor outcomes (scores 1-3). This scale has interrater
reliability established between 68% and 95% with kappa values from .62 and
.79 [41, 42]. This inter-rater reliability falls within the acceptable range when
assessment guidelines are followed, interviews are structured, and examiners
are trained [41].
31
Score Description
1
Dead
2
Persistent vegetative state. Patient exhibits no obvious cortical function.
3
Severe disability. (Conscious but disabled). Patient depends upon others
for daily support due to mental or physical disability or both
4
Moderate disability. (Disabled but independent). Patient is independent
as far as daily life is concerned. The disabilities found include varying
degrees of dysphasia, hemiparesis, or ataxia, as well as intellectual and
memory deficits and personality changes.
5 Good recovery. Resumption of normal activities even though there may
be minor neurological or psychological deficits.
Figure 2. Glasgow outcome scale
(b) Modified Rankin Scale. The Modified Rankin Scale (MRS), a seven grade
clinical observation scale, categorizes functional outcomes into levels that
describe disability or the level of dependence that patients exhibit during
32
activities of daily living. This scale ranges from a score of 0 meaning no
symptoms to a score of 6 meaning death [43](see Figure 3). MRS was
dichotomized into good outcomes (scores 0-3) and poor outcomes (scores 4-
6). Inter-rater reliability for MRS has been established at kappa value
between .25 and .71 [44, 45].
33
Score Description of symptoms
0
No symptoms
1
No significant disability. Able to carry out all usual activities,
despite some symptoms.
2
Slight disability. Able to look after own affairs without
assistance, but unable to carry out all previous activities.
3
Moderate disability. Requires some help, but able to walk
unassisted.
4 Moderately severe disability. Unable to attend to own bodily
needs without assistance, and unable to walk unassisted.
5 Severe disability. Requires constant nursing care and attention,
bedridden, incontinent.
6 Dead
Figure 3. Modified Rankin Scale
34
(c) Mortality. Mortality was defined as a MRS score of 6.
3.7.3 Covariate: severity of injury
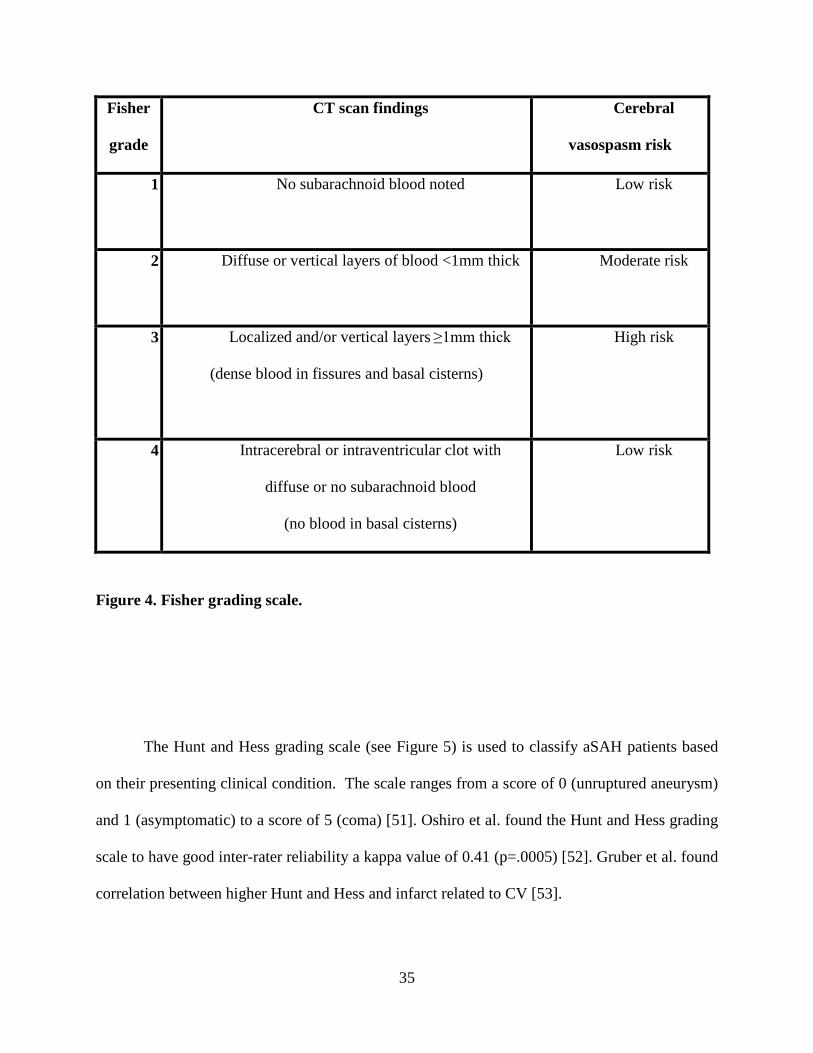
The Fisher Grade and the Hunt and Hess grading scale were used to determine severity of aSAH.
The Fisher grading scale (see Figure 4) is used to appreciate the presentation of blood from
aSAH on a CT scan. Although the scoring ranges from 1 (no hemorrhage evident) to 4 (any
thickness with intraventricular hemorrhage or parenchymal extension), this scale is nominal
because patients who are graded as a 3 using the Fisher grading scale at highest risk for
developing CV and poorer outcomes after aSAH [33]. Ogilvy and associates determined that the
Fisher has excellent interrater reliability with kappa value of 0.9 [49]. An association has been
found between higher Fisher scores and CV after SAH [50].
35
Fisher
grade
CT scan findings Cerebral
vasospasm risk
1
No subarachnoid blood noted Low risk
2
Diffuse or vertical layers of blood <1mm thick Moderate risk
3
Localized and/or vertical layers ≥1mm thick
(dense blood in fissures and basal cisterns)
High risk
4
Intracerebral or intraventricular clot with
diffuse or no subarachnoid blood
(no blood in basal cisterns)
Low risk
Figure 4. Fisher grading scale.
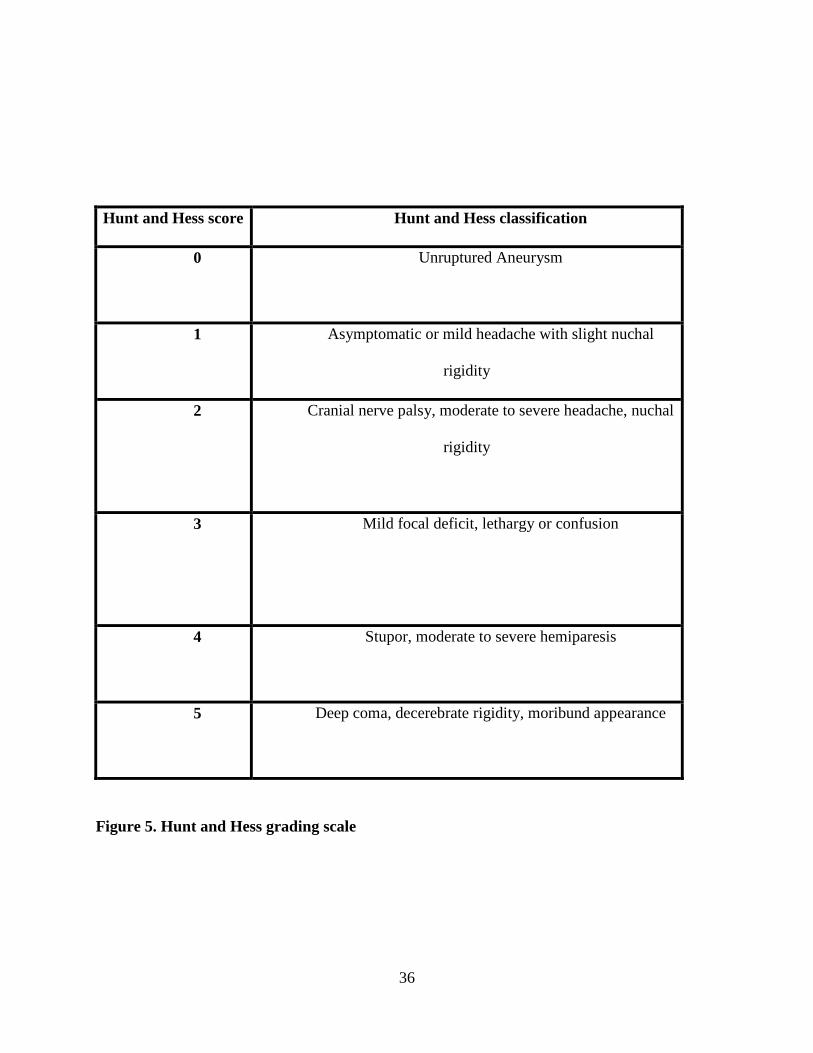
The Hunt and Hess grading scale (see Figure 5) is used to classify aSAH patients based
on their presenting clinical condition. The scale ranges from a score of 0 (unruptured aneurysm)
and 1 (asymptomatic) to a score of 5 (coma) [51]. Oshiro et al. found the Hunt and Hess grading
scale to have good inter-rater reliability a kappa value of 0.41 (p=.0005) [52]. Gruber et al. found
correlation between higher Hunt and Hess and infarct related to CV [53].
36
Hunt and Hess score Hunt and Hess classification
0
Unruptured Aneurysm
1
Asymptomatic or mild headache with slight nuchal
rigidity
2
Cranial nerve palsy, moderate to severe headache, nuchal
rigidity
3
Mild focal deficit, lethargy or confusion
4 Stupor, moderate to severe hemiparesis
5 Deep coma, decerebrate rigidity, moribund appearance
Figure 5. Hunt and Hess grading scale
37
3.7.4 Covariate: demographic characteristics
Demographics including age, sex, and race were recorded upon entry into the study and this
information was collected from the medical record.
3.8 DATA MANAGEMENT
To ensure confidentiality, each subject was assigned a unique identification code upon admission
to the parent studies. The unique identification code linked data were entered into SPSS and SAS
databases. Demographic data and severity of injury were entered electronically. CV status and
Hp genotype were hand entered and verified. Outcome data were entered and verified
electronically. Demographic data, severity of injury, and Hp genotype databases were merged
with outcome data (functional and neurological) at three, six, twelve, and twenty-four months
after aSAH (if available).
3.9 DATA ANALYSIS PLAN
All analyses were conducted using SPSS version 17.0 [SPSS Inc, Chicago, Ill.] or SAS version
9.2 [SAS Institute Inc, Cary, North Carolina].
38
3.9.1 Preliminary data analysis
For descriptive purposes, measures of central tendency and dispersion were obtained for all
variables at all time points. Exploratory data analytic techniques were completed for
identification of missing data (and specific patterns) and identification of potential confounding
variables. Preliminary analysis was done to [a] identify covariates(s) or predictor variables not
identified a priori; [b] explore distributions of variables and [c] describe demographic and
medical condition data. Although it was found that CV was significantly correlated with α-2
allele presence, CV was not included in our model because it was not found to predict outcome
in the univariate analyses (see results section 4.1.3). An alpha level of .05 was considered
significant for all analyses.
39
3.9.2 Analysis of specific aims
1. Specific Aim #1. Describe the distributions of Hp genotypes in our aSAH population.
To address specific aim #1, we obtained frequencies and percentages of Hp genotypes.
2. Specific Aim #2. Describe the presence of Hp alleles among different races in our aSAH
population.
To address specific aim #2, we obtained frequencies and percentages of Hp genotypes by race
and dichotomized the sample into groups based on Hp α-2 allele presence.
3. Specific Aim #3. Evaluate differences in gross functional outcomes after aSAH by Hp
genotype in Caucasians.
To address specific aim #3, we compared gross functional outcome (GOS, MRS, and mortality)
in different genotype groups with Chi-square analysis. After identification of covariates via
univariate analysis we conducted multivariate logistic regression analysis to determine the
relationship between Hp genotype and categorical outcome measures while controlling for
covariates.
4. Specific Aim #4. Evaluate differences in gross functional outcomes after aSAH by Hp α-
2 allele presence in Caucasians.
40
To address specific aim #4, we compared gross functional outcome (GOS, MRS, mortality) in
different genotype groups with Chi-square analysis. After identification of covariates via
univariate analysis, we conducted multivariate logistic regression analysis to determine the
relationship between Hp α-2 allele presence and categorical outcome measures while controlling
for covariates.
41
4.0 RESULTS
4.1 SAMPLE DESCRIPTION
The sample of 193 subjects included in specific aims 3 and 4 had a mean age of 54.45 years
(range 18 to 75; SD±11.1). For analysis of specific aims 3 and 4, the sample was limited only to
Caucasian subjects because of the differences in allele frequency distribution by race in
previously published literature and insufficient number of subjects of other races in our sample.
This narrowed down sample was primarily female (n=138; 71.5%), which is representative of the
general aSAH patient population. Severity of hemorrhage was assessed by the Fisher grade and
ranged from 2-4 with a mode of 3 (n=103; 53.4%) (See Table 2); clinical presentation upon
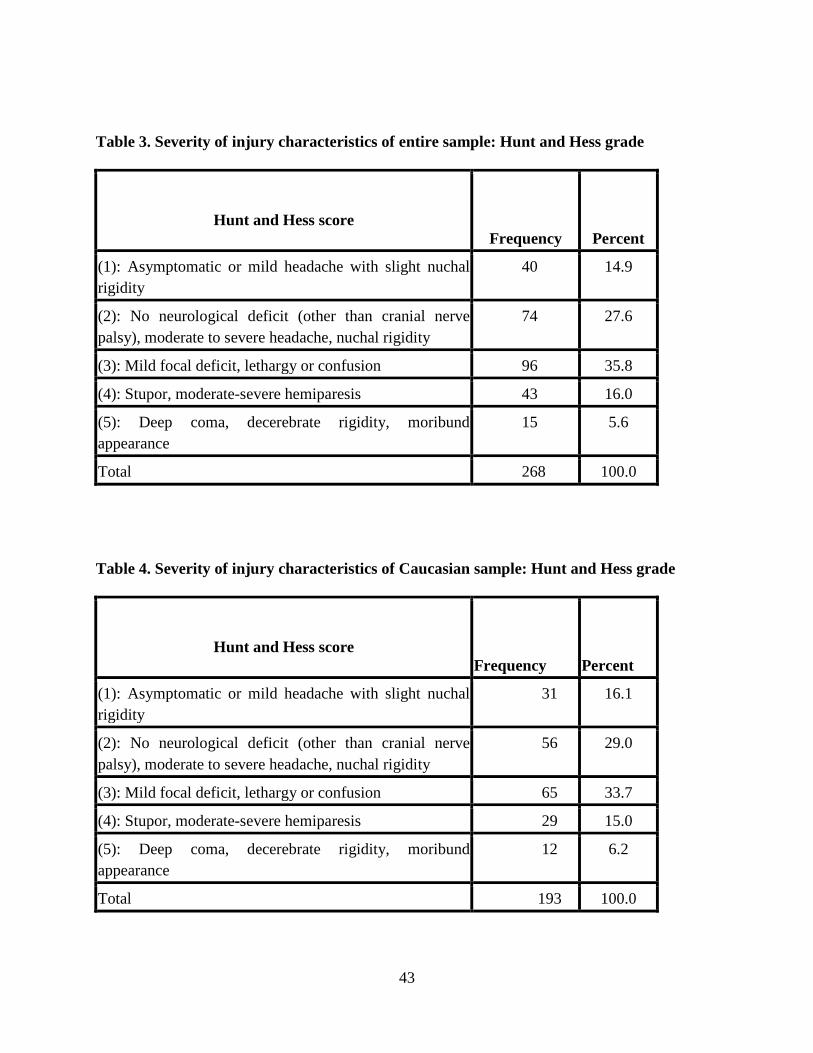
admission was measured using the Hunt and Hess score and ranged from 1-5 with a mode of 3
(n=65; 33.7%) (See Table 4). Table 1 and Table 3 represent Fisher grade and Hunt and Hess
score, respectively, in the entire patient population admitted into the study before excluding all
races except Caucasian.

42
Table 1. Severity of injury characteristics of entire sample: Fisher grade
Fisher grade Frequency Percent
(1): No subarachnoid blood noted 1 0.4
(2): Diffuse or Vertical Layers of Blood < 1 MM 83 31.0
(3): Localized Clot and / or Vertical Layers of Blood > 1 MM
134 50.0
(4): Interacerebral or Intraventricular Clot with Diffuse or No SAH
50 18.7
Total 268 100.0
Table 2. Severity of injury characteristics of Caucasian sample: Fisher grade
Fisher grade Frequency Percent
(2): Diffuse or Vertical Layers of Blood < 1 MM 54 28.0
(3): Localized Clot and / or Vertical Layers of Blood > 1 MM
103 53.4
(4): Interacerebral or Intraventricular Clot with Diffuse or No SAH
36 18.7
Total 193 100.0
43
Table 3. Severity of injury characteristics of entire sample: Hunt and Hess grade
Hunt and Hess score Frequency Percent
(1): Asymptomatic or mild headache with slight nuchal rigidity
40 14.9
(2): No neurological deficit (other than cranial nerve palsy), moderate to severe headache, nuchal rigidity
74 27.6
(3): Mild focal deficit, lethargy or confusion 96 35.8
(4): Stupor, moderate-severe hemiparesis 43 16.0
(5): Deep coma, decerebrate rigidity, moribund appearance
15 5.6
Total 268 100.0
Table 4. Severity of injury characteristics of Caucasian sample: Hunt and Hess grade
Hunt and Hess score Frequency Percent
(1): Asymptomatic or mild headache with slight nuchal rigidity
31 16.1
(2): No neurological deficit (other than cranial nerve palsy), moderate to severe headache, nuchal rigidity
56 29.0
(3): Mild focal deficit, lethargy or confusion 65 33.7
(4): Stupor, moderate-severe hemiparesis 29 15.0
(5): Deep coma, decerebrate rigidity, moribund appearance
12 6.2
Total 193 100.0
44
4.1.1 α-2 allele presence and Fisher grade
When conducting a univariate analysis of the sample, it was found that a statistically significant
(p=.01) relationship exists between Fisher grade and subjects who have a Hp genotype in which
at least one copy of the α-1 allele exists (Hp 1-1, Hp 1-2). Subjects who had two α-1 alleles most
often had a Fisher grade of 2, while those who harbored only one α-1 allele (Hp 1-2) more often
had a Fisher grade of 3.
4.1.2 α-2 allele presence and age.
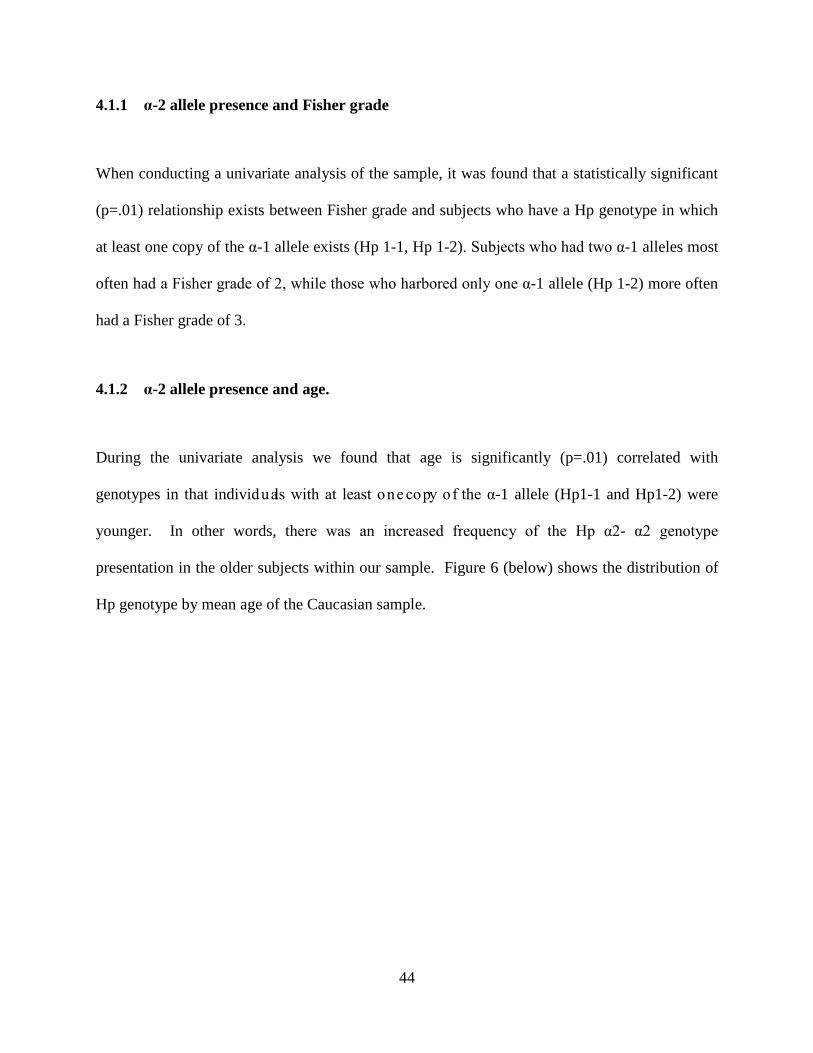
During the univariate analysis we found that age is significantly (p=.01) correlated with
genotypes in that individuals with at least one copy of the α-1 allele (Hp1-1 and Hp1-2) were
younger. In other words, there was an increased frequency of the Hp α2- α2 genotype
presentation in the older subjects within our sample. Figure 6 (below) shows the distribution of
Hp genotype by mean age of the Caucasian sample.
45
Figure 6. Hp genotype by mean age in the Caucasian population
4.1.3 α-2 allele presence and CV
Subjects whose genotypes contained at least one α-2 allele (Hp 1-2 and Hp 2-2) were
significantly (p=.02) more likely to develop CV. We selected subjects who exhibited moderate
or severe angiographic vasospasm for inclusion into the positive CV category.
46
4.2 VARIABLES
4.2.1 Independent variable: Haptoglobin genotype
In this sample 168 subjects (87.0%) had a α-2 allele present (see Figure 9). By comparing Figure
9 and Figure 10, disparities are seen between α-2 allele presence in Caucasians versus α-2 allele
presence in African Americans. The sample was dichotomized for analysis based on the
presence of the α-2 allele. There were no significant differences between individuals in
categories of sex or Hunt and Hess score neither based on Hp genotype nor on α-2 allele
presence. Refer to Table 6 for comparison of demographic and severity of hemorrhage scores by
the presence/absence of a α-2 allele in the Hp genotype in the Caucasian sample. Figure 7
provides the genotype distribution of the Caucasian sample. Figure 8 depicts the distribution of
the Hp genotype in the African American population to show that the African American
population has more subjects with Hp 1-1 genotype and less with Hp 2-2 genotype than the
Caucasian population does. See Table 5 for a comparison of genotype distribution by race in the
population of this study.
47
Table 5. Demographic information and severity of injury characteristics of the entire
sample by Hp genotype
Caucasian
n
(%)
African American
n
(%)
Hispanic
n
(%)
Asian/Pacific Islander
n
(%)
Hp 1-1
27
(11.39)
8
(29.63)
1
(33.33)
0
(0.00)
Hp 1-2
131
(55.27)
14
(51.85)
1
(33.33)
0
(0.00)
Hp 2-2
79
(33.33)
5
(18.52)
1
(33.33)
1
(100)
Total
(N=268)
237
(88.4)
27
(16.07)
3
(53.40)
1
(33.70)
48
Table 6. Hp genotype distribution by race of the Caucasian patient population
Age
Mean
(SD)
p=.01
F= 6.63
Gender: female
n
(%)
p=1.00
χ2=.99
Fisher grade
Mode
(%)
p=.05
χ2=.06
Hunt and Hess grade
Mode
(%)
p=.40
χ2=.41
Hp 1-1
(n= 25)
52.96
(10.86)
17
(68.00)
2/3
(40.00/40.00)
2
(44.00)
Hp 1-2
(n=109 )
53.26
(11.11)
78
(71.60)
3
(51.40)
3
(36.70)
Hp 2-2
(n= 59)
57.27
(10.96)
43
(72.90)
3
(62.70)
2/3
(25.40/25.40)
Total
(N=193)
54.45
(11.14)
138
(71.5)
3
(53.40)
3
(33.70)
49
0
20
40
60
80
100
Hp 1-1 Hp 1-2 Hp 2-2
13
56.5
30.6
Hp genotype
Perc
ent o
f sa
mpl
e
Figure 7. Distribution of the Caucasian sample by Hp genotype
50
0
20
40
60
80
100
Hp 1-1 Hp 1-2 Hp 2-2
29.6351.85
18.52
Hp genotype
Perc
ent o
f sam
ple
Figure 8. Distribution of the African American sample by Hp genotype
51
0
20
40
60
80
100
α-2 allele + α-2 allele -
87.04
12.96
α-2 allele presence
Perc
ent o
f sam
ple
Figure 9. α-2 allele presence in the Caucasian sample
52
0
20
40
60
80
100
α-2 allele + α-2 allele -
70.3729.63
α-2 allele presence
Perc
ent o
f sam
ple
Figure 10. α-2 allele presence in the African American sample
4.2.2 Dependent variable: gross functional outcome
The dependent variable, gross functional outcome (assessed using GOS, MRS, and mortality)
was analyzed at four time periods: 3, 6, 12, and 24 months after aSAH. At 3 months post aSAH
there were 193 subjects with outcome data available; at 6 months post aSAH this number
decreased to 160 subjects for whom outcome data was collected; at 12 months post aSAH there
remained 146 subjects with outcome data available; and at 24 months post aSAH there were 121
remaining subjects for whom outcome data was successfully obtained.
53
4.3 RESEARCH QUESTIONS
4.3.1 Research question #1
1. Is there a difference in gross functional outcome from aSAH based on
Hp genotypes?
4.3.1.1 Univariate analysis.
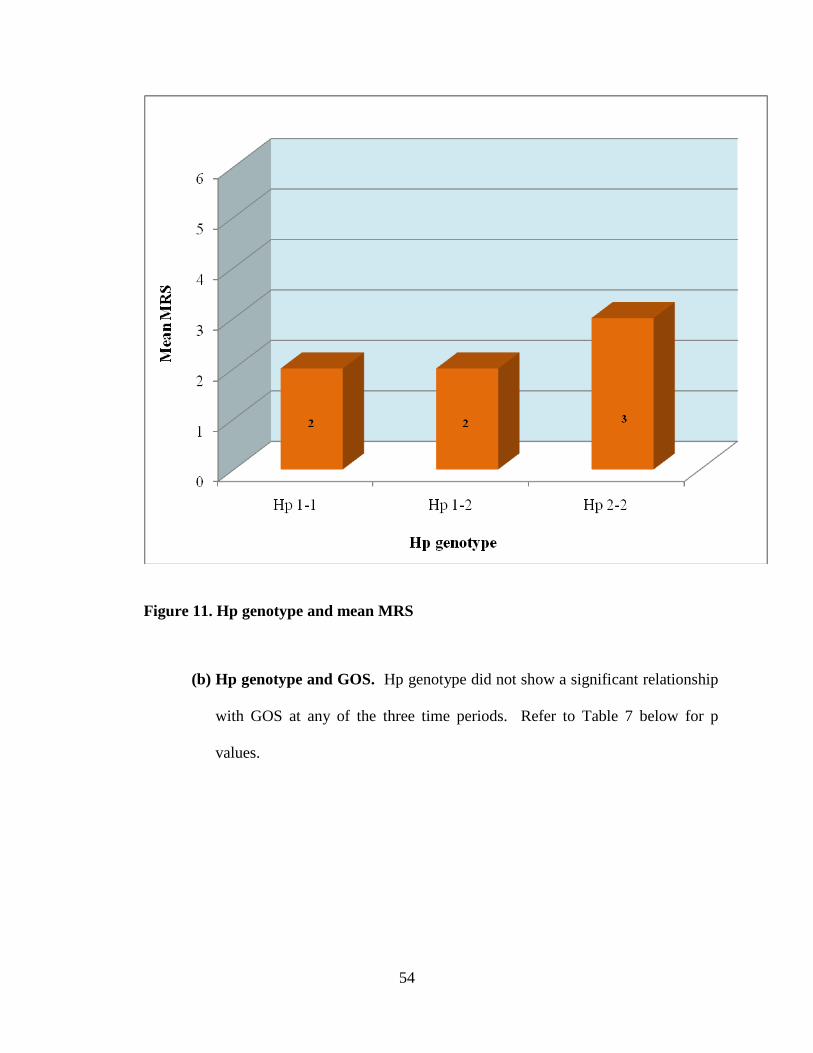
(a) Hp genotype and MRS. At 3 months after aSAH it was found that the
association between Hp genotype and MRS was statistically significant
(p=.04). Specifically, individuals with Hp 1-1 genotype less often had poor
outcomes on the MRS at 3 months post aSAH. Figure 11 below demonstrates
the dose-response type association between Hp genotype and mean MRS.
54
Figure 11. Hp genotype and mean MRS
(b) Hp genotype and GOS. Hp genotype did not show a significant relationship
with GOS at any of the three time periods. Refer to Table 7 below for p
values.
55
Table 7. Hp genotype and GOS
3 months 6 months 12 months 24 months
GOS p=.30 p=.43 p=.38 p=.34
(c) Hp genotype and mortality. Similar to the relationship between Hp
genotype and GOS, mortality was not significantly associated with Hp
genotype at any time period assessed. Table 8 displays p values for this
analysis.
Table 8. Hp genotype and mortality
3 months 6 months 12 months 24 months
Mortality p=.41 p=.43 p=.39 p=.34
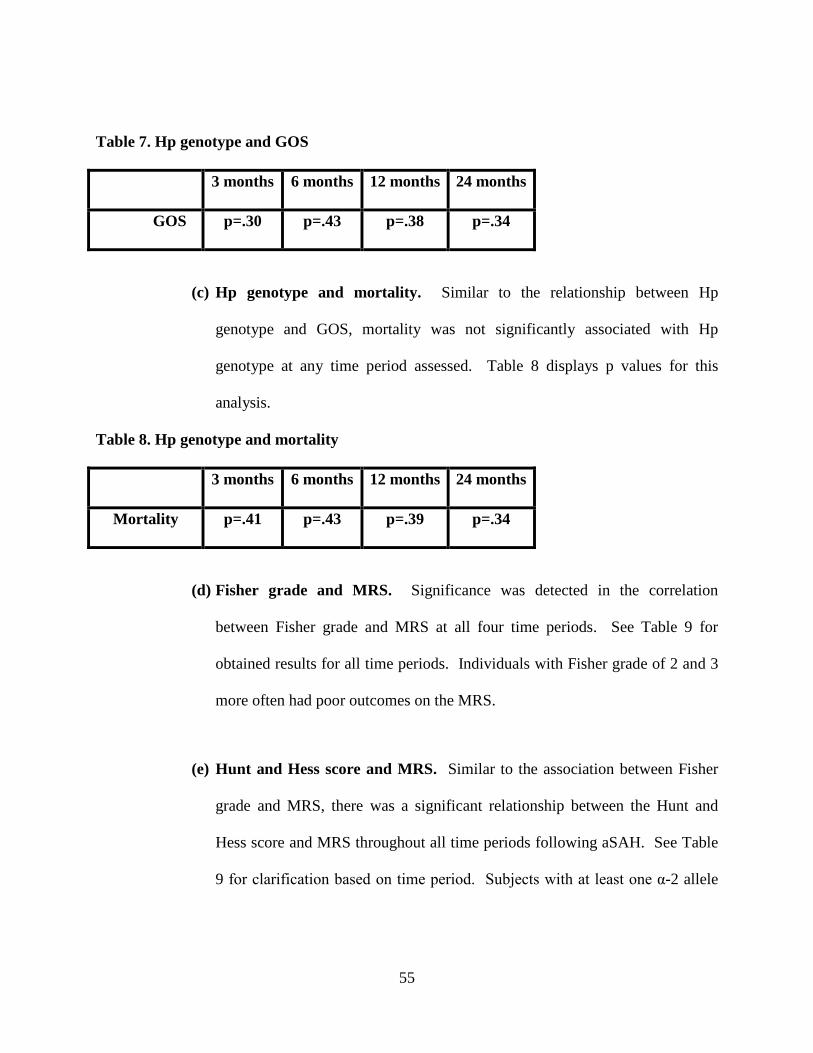
(d) Fisher grade and MRS. Significance was detected in the correlation
between Fisher grade and MRS at all four time periods. See Table 9 for
obtained results for all time periods. Individuals with Fisher grade of 2 and 3
more often had poor outcomes on the MRS.
(e) Hunt and Hess score and MRS. Similar to the association between Fisher
grade and MRS, there was a significant relationship between the Hunt and
Hess score and MRS throughout all time periods following aSAH. See Table
9 for clarification based on time period. Subjects with at least one α-2 allele

56
in their genotypes more often received a score of 3 on Hunt and Hess had poor
outcomes on the MRS.
Table 9. Statistical significance (p) of univariate analysis of the relationship between MRS
and Hunt and Hess score and Fisher grade
3 months 6 months 12 months 24 months
Hunt and
Hess
p=<.0001 p=<.0001 p=<.0001 p=.0003
Fisher p=<.0001 p=<.0001 p=.003 p=.03
4.3.1.2 Multivariate Logistic Regression Analysis.
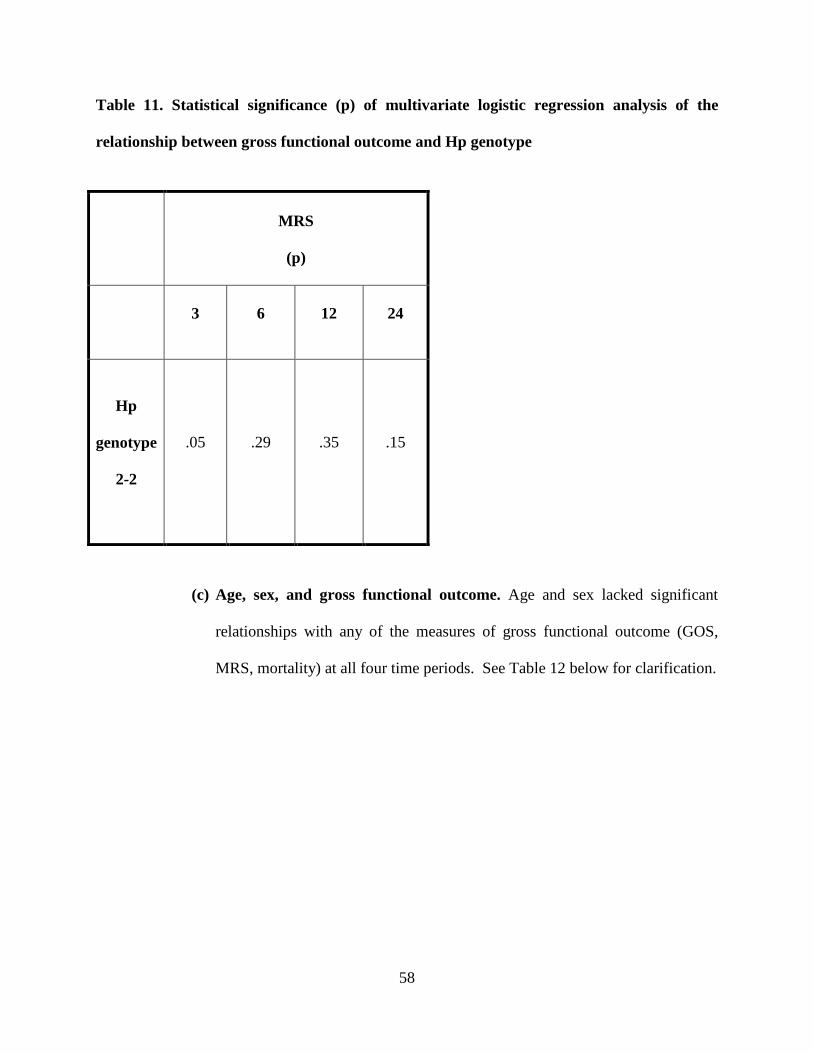
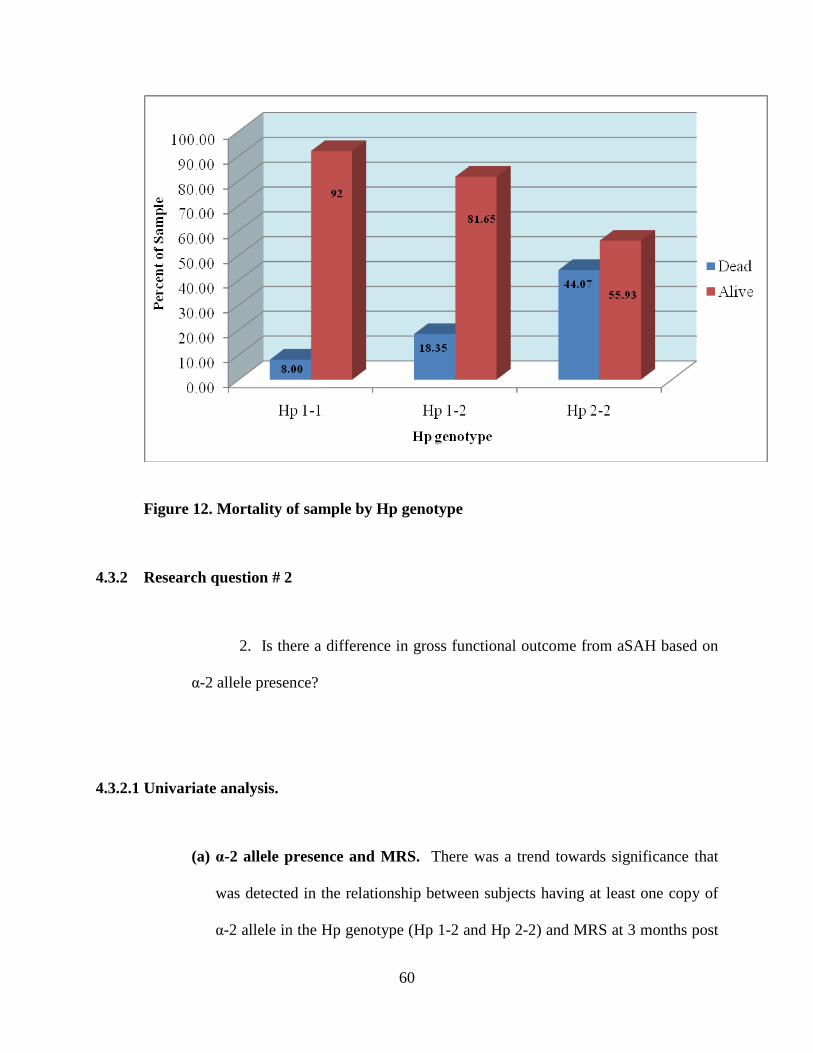
(a) Gross functional outcome and Hp genotype. At 3 months after aSAH it was
found that the association between Hp genotype and MRS was statistically
significant (p=.05). Specifically, individuals with Hp 2-2 genotype more
often had poor outcomes on the MRS at 3 months post aSAH when
controlling for covariates. See Table 11 for the multivariate logistic
regression analysis of the significant relationship between Hp genotype and
MRS at all four time periods. Refer to Figure 12 for mortality by Hp
genotype.
(b) Gross functional outcome and Fisher grade. After controlling for
covariates (age, sex, Fisher grade) all predictors of outcome dropped out of
significance in determining gross functional outcome (GOS, MRS, mortality)
57
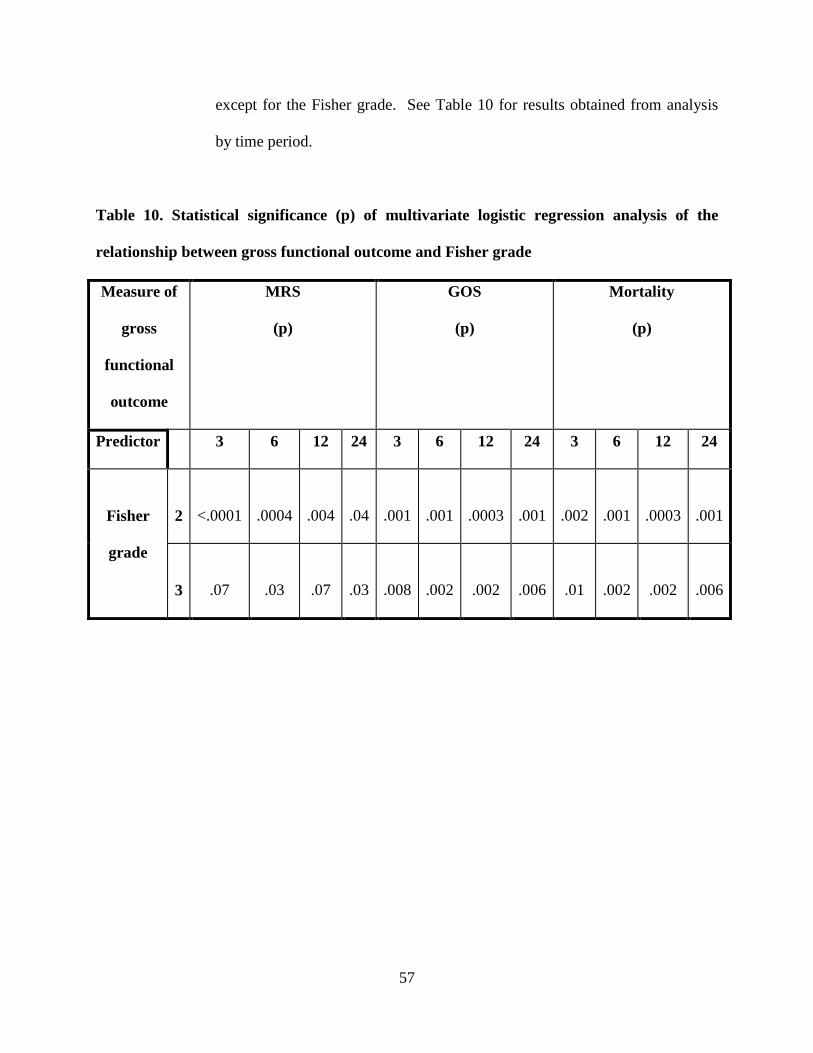
except for the Fisher grade. See Table 10 for results obtained from analysis
by time period.
Table 10. Statistical significance (p) of multivariate logistic regression analysis of the
relationship between gross functional outcome and Fisher grade
Measure of
gross
functional
outcome
MRS
(p)
GOS
(p)
Mortality
(p)
Predictor 3 6 12 24 3 6 12 24 3 6 12 24
Fisher
grade
2
<.0001
.0004
.004
.04
.001
.001
.0003
.001
.002
.001
.0003
.001
3
.07
.03
.07
.03
.008
.002
.002
.006
.01
.002
.002
.006
58
Table 11. Statistical significance (p) of multivariate logistic regression analysis of the
relationship between gross functional outcome and Hp genotype
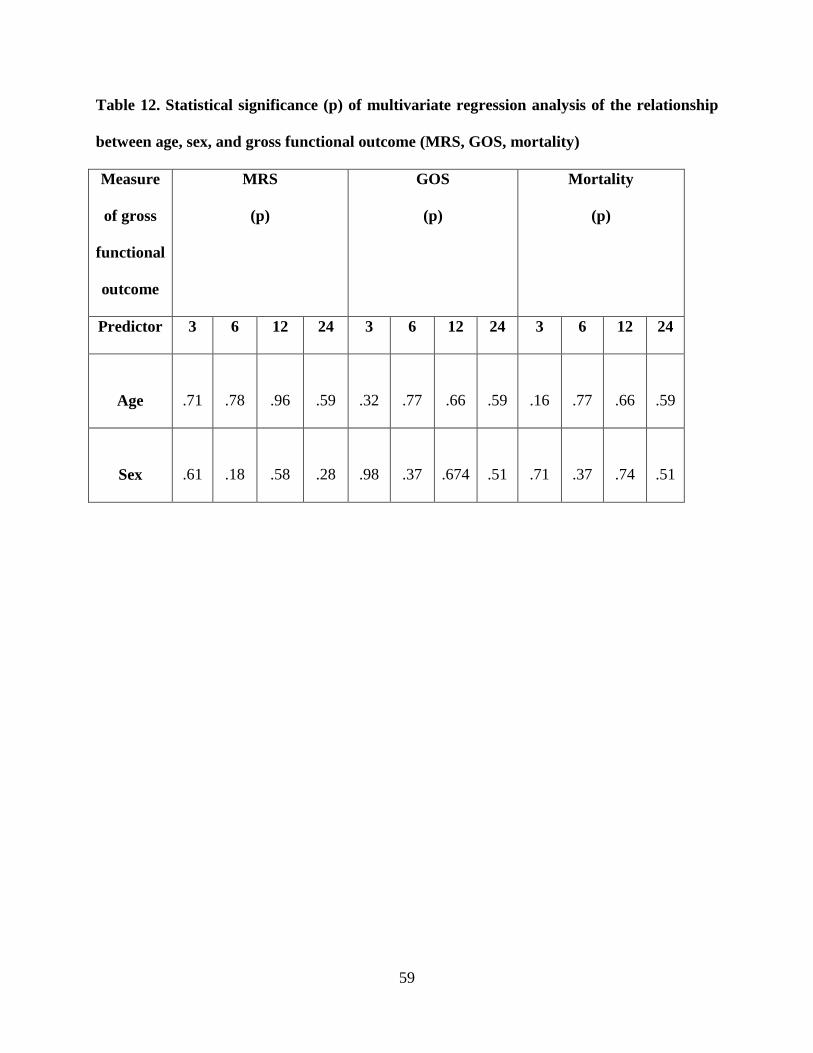
(c) Age, sex, and gross functional outcome. Age and sex lacked significant
relationships with any of the measures of gross functional outcome (GOS,
MRS, mortality) at all four time periods. See Table 12 below for clarification.
MRS
(p)
3
6
12
24
Hp
genotype
2-2
.05
.29
.35
.15
59
Table 12. Statistical significance (p) of multivariate regression analysis of the relationship
between age, sex, and gross functional outcome (MRS, GOS, mortality)
Measure
of gross
functional
outcome
MRS
(p)
GOS
(p)
Mortality
(p)
Predictor 3 6 12 24 3 6 12 24 3 6 12 24
Age
.71
.78
.96
.59
.32
.77
.66
.59
.16
.77
.66
.59
Sex
.61
.18
.58
.28
.98
.37
.674
.51
.71
.37
.74
.51
60
Figure 12. Mortality of sample by Hp genotype
4.3.2 Research question # 2
2. Is there a difference in gross functional outcome from aSAH based on
α-2 allele presence?
4.3.2.1 Univariate analysis.
(a) α-2 allele presence and MRS. There was a trend towards significance that
was detected in the relationship between subjects having at least one copy of
α-2 allele in the Hp genotype (Hp 1-2 and Hp 2-2) and MRS at 3 months post
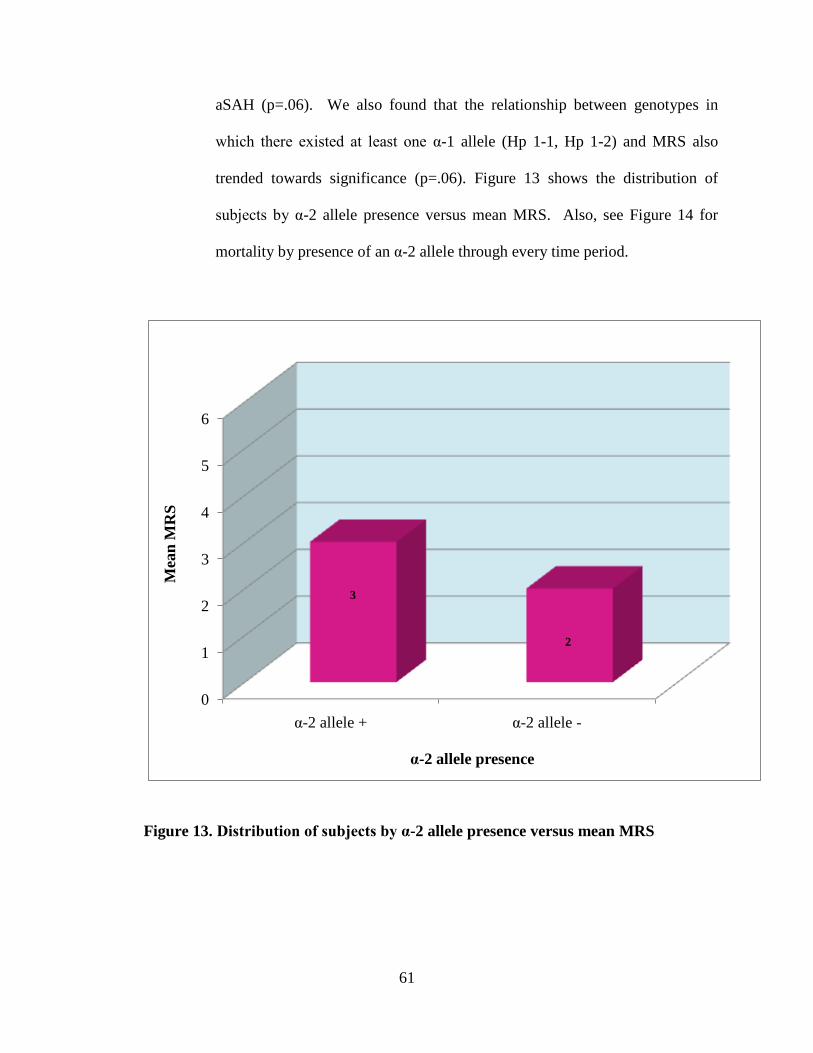
61
aSAH (p=.06). We also found that the relationship between genotypes in
which there existed at least one α-1 allele (Hp 1-1, Hp 1-2) and MRS also
trended towards significance (p=.06). Figure 13 shows the distribution of
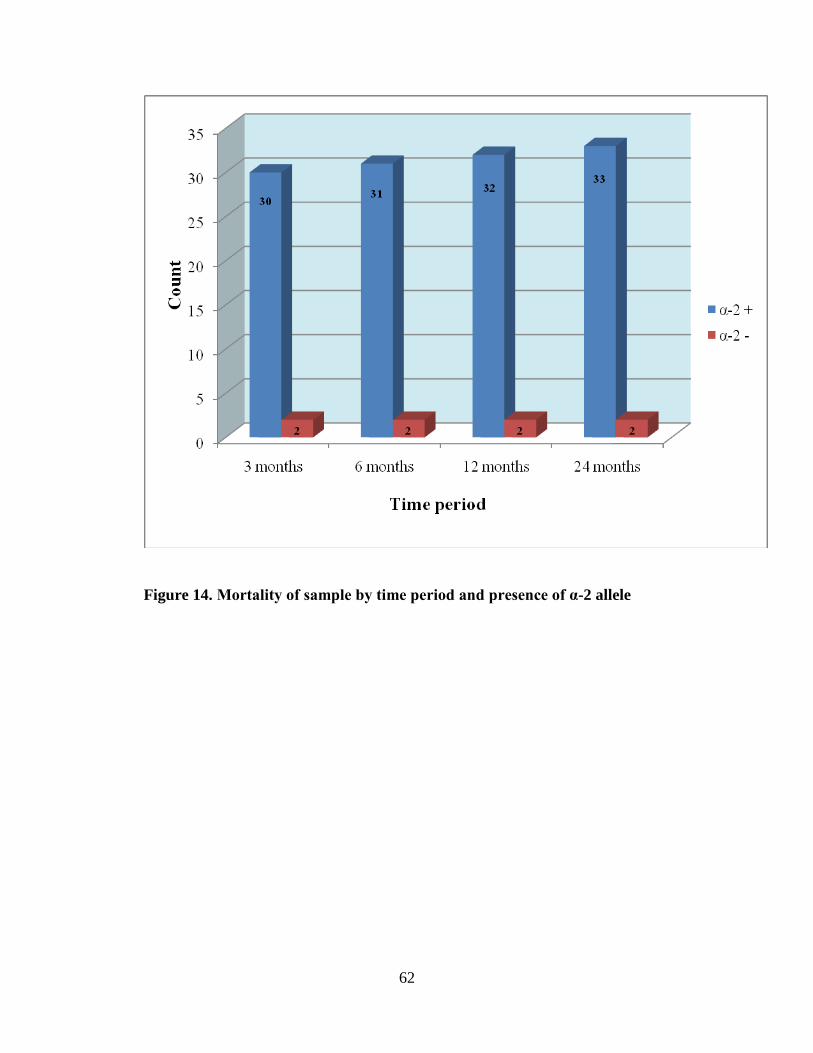
subjects by α-2 allele presence versus mean MRS. Also, see Figure 14 for
mortality by presence of an α-2 allele through every time period.
0
1
2
3
4
5
6
α-2 allele + α-2 allele -
3
2
α-2 allele presence
Mea
n M
RS
Figure 13. Distribution of subjects by α-2 allele presence versus mean MRS
62
Figure 14. Mortality of sample by time period and presence of α-2 allele
63
5.0 DISCUSSION
This study had the following major findings:
1. Subjects with at least one Hp α-2 allele were older.
2. Subjects with at least one Hp α-2 allele were more likely to have poorer outcomes.
This study examined the relationship between Hp genotype and gross functional outcome
(GOS, MRS, mortality) after aSAH. We hypothesized that patients with a Hp 2-2 genotype
will have poorer outcomes after aSAH. Additionally, we hypothesized that patients whose
genotype consists of at least one α-2 will have poorer outcomes than patients who do not
possess the α-2 allele in their genotypes and that these outcomes will exhibit a dose-response
association with the α-2 allele. We described the distributions of genotypes and alleles for
Hp among subjects in our study. Additionally, we described the distribution of Hp allele
frequencies among different races in our patient population. Evaluation of differences in
gross functional outcomes after aSAH was done by Hp genotype and by α-2 allele presence
in Caucasians. Results of this study serve multiple purposes such as providing insight into
the physiologic mechanisms influencing recovery and outcome after aSAH and developing a
genetic marker for use in the aSAH population.
64
5.1 HAPTOGLOBIN GENOTYPE AND ALPHA-2 ALLELE PRESENCE
Hp is an APP present in the human serum and is responsible for binding Hgb, therefore
inhibiting its interaction with NO and preventing an inflammatory response and the oxidative
stress that results from free radical production. Borsody and associates report that Hgb has a
decreased ability to produce prostaglandins as a result of the Hp-Hgb binding [9]. Langlois and
Delanghe, and Kasvosve et al. report that Hp is generally present in serum levels in the following
order of concentration: Hp 1-1> Hp 1-2> Hp 2-2[20, 54]. However, Caucasians in our study
exhibited the following Hp genotype distribution: Hp 1-2>Hp 2-2>Hp 1-1. Borsody and
collaborators report a similar distribution of Hp genotype (Hp 1-2> Hp 2-2> Hp 1-1), although
their sample size was only 32 patients [9]. There were several other similarities between the
study conducted by Borsody and associates and ours, including an imbalance of race and sex,
with Caucasians and females making up the majority of the samples [9]. Borsody et al. report an
overrepresentation of Caucasians in the groups whose genotypes contained at least one α-2 allele
[9]. Additionally, Borsody and associates report a predominance of the female sex in their
sample (21 of 32 patients), consistent with our findings and other investigations of aSAH [9].
The reason for this may be coinciding with knowledge presented previously in aSAH literature
regarding an increased risk of aSAH in women [5]. In our study, we had an imbalance in the
distribution of race in general, with the majority of the patient population being Caucasian (237;
88.4%). Therefore, due to differences in allele frequency distribution based on different ethnic
populations in previously published literature, we limited our study sample to only Caucasian
subjects in an attempt to control for population stratification when analyzing the distribution of
genotypes in correlation with gross functional outcome.
65
In our sample of Caucasians, 168 subjects (87.0%) possessed at least one α-2 allele in
their genotypes. This statistic coincides with the report by Teye et al., who report that the Hp α-2
allele was the most represented Hp allele in all three populations, but was significantly higher in
those of Chinese ethnicity [55]. It is believed in literature that the α-1 allele is less common in
people of Asian descent [19]. Th e α-2 allele is associated with a weaker affinity for Hgb,
therefore struggling to inhibit free radical production, oxidative stress, and CV, which is
associated with DCI and negative impacts on physical and cognitive functioning [9]. It is
believed that a relationship may exist between the α-2 allele’s inability to bind Hgb and an
increased amount of red blood cells in the CSF filled subarachnoid space in patients with at least
one α-2 allele in their genotype. Therefore, there may be a correlation between presence of at
least one α-2 allele and poorer outcomes in patients who suffer from injuries that result in
overwhelming amounts of free Hgb in the body, such as in aSAH. In our study there were no
significant differences between individuals in categories sex or Hunt and Hess score neither
based on Hp genotype nor on α-2 allele presence.
5.2 HAPTOGLOBIN GENOTYPE AND AGE
We found that age is significantly correlated with genotype in individuals with at least one copy
of the α-1 allele (Hp1-1 and Hp1-2). There was an increased frequency of the α-2 allele
presentation in the genotypes of older subjects within our sample. It is unknown why this
increase in frequency was present in our patient population, however, it may be possible that due
to the Hp α-1 allele’s associations with other diseases—such as infection, coronary artery
disease, and liver disease [56]—subjects with the α-1 allele in their genotypes have faced
66
mortality in larger numbers than those with only one α-1 allele or those without an α-1 allele in
their genotypes. Additionally, the increased age of the subjects with an α-2 allele in their
genotypes may play a role in the poorer outcomes post aSAH since we found that those subjects
who are older more often experienced poor outcomes.
5.3 HAPTOGLOBIN GENOTYPE AND GROSS FUNCTIONAL OUTCOME
In our study we found that the association between Hp genotype and MRS was statistically
significant at three months post aSAH. Specifically, individuals with a Hp 1-1 genotype less
often had poor outcomes on the MRS at this time period. Additionally, we detected a significant
relationship between Fisher grade and MRS at all four time periods, showing that individuals
with Fisher grade of 2 or 3 more often had poor outcomes on the MRS. Similar to the
association between Fisher grade and MRS, there was a significant relationship between the
Hunt and Hess score upon admission and MRS throughout all time periods following aSAH.
Subjects with at least one α-2 allele in their genotypes more often had a score of 3 on Hunt and
Hess had poor outcomes on the MRS. After controlling for covariates (age, sex, Fisher grade) all
predictors of outcome dropped out of significance in determining gross functional outcome
(GOS, MRS, mortality) except for the Fisher grade. These findings support the literature and the
continued use of the Fisher grade and Hunt and Hess score as clinical measures of prognosis [33,
49, 51-53].
Although Borsody et al. found that individuals with an α-2 allele in their genotypes
experienced worse outcomes (such as CV) in their study [9], Rabinstein calls for a larger study
that incorporates clinical measures of functional outcomes of aSAH is before Hp genotyping can
67
be appropriated for use in clinical procedures [22]. Kramer et al. found that subjects with lower
serum Hgb concentrations post aSAH experienced poorer outcomes [7]. This brings light upon
the importance of Hp in Hgb binding. One would think that patients with one or more α-2 alleles
would experience poorer outcomes related to the Hp α-2 isoform’s decreased affinity for Hgb
binding. This would allow for more Hgb to persist in the CSF for a longer time, with decreased
serum Hgb levels, and possibly leading to secondary injuries such as CV. Fisher found that the
risk of CV is directly proportional to the concentration of blood in the CSF, specifically in the
subarachnoid space and ventricles [33].
5.4 ALPHA-2 ALLELE PRESENCE AND GROSS FUNCTIONAL OUTCOME
We found that a significant relationship exists between Fisher grade and subjects who have a Hp
genotype in which at least one copy of the α-1 allele exists (Hp 1-1, Hp 1-2). Additionally, our
results show that individuals with at least one copy of the α-1 allele in their genotypes are more
likely to receive a Fisher grade of 3. It is possible that although this Fisher grade of 3 may
predict CV, the α-1 allele or the Hp 1-1 genotype could serve as protection from developing CV.
Previously it was stated in literature that, although the Fisher grading scale goes from 1 to 4, a
grade of 3 is most associated with poorer outcomes after aSAH [33]. However, in our study we
found that a Fisher grade of 2 is 15 times more likely to be associated with poorer outcomes than
a Fisher grade of 4. Surprisingly, a Fisher grade of 3 was only 2 times more likely to experience
poorer outcomes than a Fisher grade of 4. This suggests that a Fisher grade of 2 should be
considered just as, if not more, significant in predicting outcomes in patients that are admitted for
aSAH. Also, it is possible that the Fisher grade truly is ordinal and not nominal like previously
68
thought. Furthermore, if a Fisher grade of 2 may be more harmful than a Fisher grade of 3 in
predicting long-term gross functional outcome, it is possible that having a Hp 1-1 genotype could
be protective against risk of vasospasm and poor outcomes after aSAH.
Borsody et al. found that 20 of their 23 subjects with at least one α-2 allele developed CV
compared to only 2 of 9 patients with the Hp 1-1 genotype [9]. Similarly, Chaichana et al.
gathered that Hp 2-2 blood injected into mice led to an increased occurrence of CV when
compared to mice injected with Hp 1-1 blood [17]. To support this literature we found similar
results showing that subjects in our study whose genotypes contained at least one α-2 allele were
significantly more likely to develop CV at 3 months post aSAH. Additionally there was a trend
towards significance that was detected in the relationship between subjects with genotypes
having at least one copy of α-2 allele in the Hp genotype (Hp 1-2 and Hp 2-2) and MRS at 3
months post aSAH. Our findings support the idea that CV could be associated with α-2 allele
presence because of the α-2 allele’s impaired ability to clear Hgb from CSF after aSAH [9].
5.5 CONCLUSIONS
The most crucial finding of our study is that Hp genotype is significantly associated with gross
functional outcome when utilizing MRS to assess at three months post aSAH. Additionally, α-2
allele presence is significantly correlated with CV after aSAH. Furthermore, the finding of a
relationship between Hp α-2 allele presence and MRS at three months post aSAH lends to the
importance of this study and the thought of the possible correlation between α-2 allele presence
and poor outcomes after aSAH. Additionally, this study validated the use of the Fisher grading
scale and the Hunt and Hess score in clinical application for the prediction of prognosis in this
69
patient population. Our study’s sample size was large and showed these associations, which is a
vital step in the movement towards using α-2 allele presence and Hp genotype as biomarkers for
aSAH patients [22].
5.6 IMPLICATIONS FOR FUTURE RESEARCH
Previous literature has shown that the α-2 allele is associated with poorer binding affinity for
Hgb, leading researchers to postulate the outcomes of this decreased binding. It is thought that
the decreased Hp:Hgb binding leads to an increased level of Hgb in the CSF after aSAH. This
presence of Hgb is thought to lead to free radical and prostaglandin production, inflammation,
and oxidative stress. Our results show that the α-2 allele is associated with CV after aSAH, and
that Hp genotype is associated with gross functional outcome (MRS). It may be useful in future
research studies to avoid controlling for Fisher grade in analyses because of its correlation with a
Hp 1-1 genotype. It is possible that although these subjects experience a Fisher grade of 3 and a
large bleed more often, there are some protective mechanisms in patients with a Hp 1-1 genotype
that prevent the poor outcomes and/or CV more efficiently than in subjects with one or more α-2
alleles experience.
Due to the differences in allele frequency distribution among African Americans and
Asians/Pacific Islanders (previously published in literature) as well as a small number of subjects
in the Asian/Pacific Islander and Hispanic categories in our patient population, we were unable
to evaluate gross functional outcomes among these races. Future research should analyze the
associations between Hp genotype in these races in hopes of determining whether or not certain
populations, such as Asians, will suffer from increased morbidity after aSAH related to the
70
increased likeliness of the α-2 allele being present in their genotypes. However, before the α-2
allele should be evaluated as a possible biomarker for aSAH patients or as a risk factor for
development of CV and poor outcomes after the initial injury, more research is needed to
evaluate mechanisms before one should suggest Hp genotyping for clinical use. After these
mechanisms are explored and understood, it is possible that the use of the α-2 allele as a
biomarker could serve to predict the occurrence of CV, since it is currently largely
misunderstood and unpredictable. Rabinstein concludes that the ability to detect risk of CV after
SAH could improve treatment and prognosis in these patients [22]. We agree that many
treatments for aSAH and CV involve unfavorable side effects and the possible future
identification of patients who are most at risk for CV would allow for the administration of these
agents only to those patients in whom they are truly warranted [22].
71
BIBLIOGRAPHY
1. Diringer, M.N., Management of aneurysmal subarachnoid hemorrhage. Crit Care Med,
2009. 37(2): p. 432-40.
2. van Gijn, J., R.S. Kerr, and G.J. Rinkel, Subarachnoid haemorrhage. Lancet, 2007.
369(9558): p. 306-18.
3. Teunissen, L.L., et al., Risk factors for subarachnoid hemorrhage: a systematic review.
Stroke, 1996. 27(3): p. 544-9.
4. Qureshi, A.I., et al., Risk factors for subarachnoid hemorrhage. Neurosurgery, 2001.
49(3): p. 607-12; discussion 612-3.
5. Suarez, J.I., R.W. Tarr, and W.R. Selman, Aneurysmal subarachnoid hemorrhage. N
Engl J Med, 2006. 354(4): p. 387-96.
6. Dorhout Mees, S.M., et al., Calcium antagonists for aneurysmal subarachnoid
haemorrhage. Cochrane Database Syst Rev, 2007(3): p. CD000277.
7. Kramer, A.H., et al., Relationship between hemoglobin concentrations and outcomes
across subgroups of patients with aneurysmal subarachnoid hemorrhage. Neurocrit Care,
2009. 10(2): p. 157-65.
8. Schmidt, J.M., et al., Frequency and clinical impact of asymptomatic cerebral infarction
due to vasospasm after subarachnoid hemorrhage. J Neurosurg, 2008. 109(6): p. 1052-9.
72
9. Borsody, M., et al., Haptoglobin and the development of cerebral artery vasospasm after
subarachnoid hemorrhage. Neurology, 2006. 66(5): p. 634-40.
10. Kolias, A.G., J. Sen, and A. Belli, Pathogenesis of cerebral vasospasm following
aneurysmal subarachnoid hemorrhage: putative mechanisms and novel approaches. J
Neurosci Res, 2009. 87(1): p. 1-11.
11. Munakata, A., et al., Effect of a free radical scavenger, edaravone, in the treatment of
patients with aneurysmal subarachnoid hemorrhage. Neurosurgery, 2009. 64(3): p. 423-
8; discussion 428-9.
12. Nonaka, T., et al., Etiology and treatment of vasospasm following subarachnoid
hemorrhage. Neurol Med Chir (Tokyo), 1979. 19(1): p. 53-60.
13. Pyne-Geithman, G.J., et al., Glutathione peroxidase and subarachnoid hemorrhage:
implications for the role of oxidative stress in cerebral vasospasm. Neurol Res, 2009.
31(2): p. 195-9.
14. Weir, B., The pathophysiology of cerebral vasospasm. Br J Neurosurg, 1995. 9(3): p.
375-90.
15. Lim, S.K., et al., Role of haptoglobin in free hemoglobin metabolism. Redox Rep, 2001.
6(4): p. 219-27.
16. Pluta, R.M., et al., Cerebral vasospasm following subarachnoid hemorrhage: time for a
new world of thought. Neurol Res, 2009. 31(2): p. 151-8.
17. Chaichana, K.L., et al., Haptoglobin 2-2 genotype determines chronic vasospasm after
experimental subarachnoid hemorrhage. Stroke, 2007. 38(12): p. 3266-71.
18. Hop, J.W., et al., Case-fatality rates and functional outcome after subarachnoid
hemorrhage: a systematic review. Stroke, 1997. 28(3): p. 660-4.
73
19. Wassell, J., Haptoglobin: function and polymorphism. Clin Lab, 2000. 46(11-12): p. 547-
52.
20. Langlois, M.R. and J.R. Delanghe, Biological and clinical significance of haptoglobin
polymorphism in humans. Clin Chem, 1996. 42(10): p. 1589-600.
21. Wang, Y., et al., Haptoglobin, an inflammation-inducible plasma protein. Redox Rep,
2001. 6(6): p. 379-85.
22. Rabinstein, A.A., The blood and the vessel: prediction of cerebral vasospasm after
subarachnoid hemorrhage. Neurology, 2006. 66(5): p. 622-3.
23. Broderick, J.P., et al., The risk of subarachnoid and intracerebral hemorrhages in blacks
as compared with whites. N Engl J Med, 1992. 326(11): p. 733-6.
24. Ellamushi, H.E., et al., Risk factors for the formation of multiple intracranial aneurysms.
J Neurosurg, 2001. 94(5): p. 728-32.
25. Juvela, S., Risk factors for multiple intracranial aneurysms. Stroke, 2000. 31(2): p. 392-
7.
26. Kawachi, I., et al., Smoking cessation and decreased risk of stroke in women. JAMA,
1993. 269(2): p. 232-6.
27. Qureshi, A.I., et al., Risk factors for multiple intracranial aneurysms. Neurosurgery,
1998. 43(1): p. 22-6; discussion 26-7.
28. Kissela, B.M., et al., Subarachnoid hemorrhage: a preventable disease with a heritable
component. Stroke, 2002. 33(5): p. 1321-6.
29. Taylor, C.L., et al., Cerebral arterial aneurysm formation and rupture in 20,767 elderly
patients: hypertension and other risk factors. J Neurosurg, 1995. 83(5): p. 812-9.
74
30. Broderick, J.P., et al., Major risk factors for aneurysmal subarachnoid hemorrhage in the
young are modifiable. Stroke, 2003. 34(6): p. 1375-81.
31. Raaymakers, T.W., Aneurysms in relatives of patients with subarachnoid hemorrhage:
frequency and risk factors. MARS Study Group. Magnetic Resonance Angiography in
Relatives of patients with Subarachnoid hemorrhage. Neurology, 1999. 53(5): p. 982-8.
32. Selman, W.R., Vasospasm. J Neurosurg, 2004. 100(2): p. 208-9; discussion 209.
33. Fisher, C.M., J.P. Kistler, and J.M. Davis, Relation of cerebral vasospasm to
subarachnoid hemorrhage visualized by computerized tomographic scanning.
Neurosurgery, 1980. 6(1): p. 1-9.
34. Claassen, J., et al., Effect of cisternal and ventricular blood on risk of delayed cerebral
ischemia after subarachnoid hemorrhage: the Fisher scale revisited. Stroke, 2001. 32(9):
p. 2012-20.
35. Missler, U., Cerebral vasospasm in patients suffering from aneurysmal subarachnoid
hemorrhage: an unresolved diagnostic and therapeutic challenge. Crit Care Med, 2009.
37(3): p. 1150-1.
36. Dankbaar, J.W., et al., Relationship between vasospasm, cerebral perfusion, and delayed
cerebral ischemia after aneurysmal subarachnoid hemorrhage. Neuroradiology, 2009.
51(12): p. 813-9.
37. Roos, Y.B., et al., Complications and outcome in patients with aneurysmal subarachnoid
haemorrhage: a prospective hospital based cohort study in the Netherlands. J Neurol
Neurosurg Psychiatry, 2000. 68(3): p. 337-41.
75
38. Johnson, R. and H. Madder, Prevention and treatment of vasospasm following
subarachnoid hemorrhage. Advancement of clinical neuroscience and rehabilitation,
2008. 8(2).
39. Dreier, J.P., et al., Delayed ischaemic neurological deficits after subarachnoid
haemorrhage are associated with clusters of spreading depolarizations. Brain, 2006.
129(Pt 12): p. 3224-37.
40. Jennett, B. and M. Bond, Assessment of outcome after severe brain damage. Lancet,
1975. 1(7905): p. 480-4.
41. Pettigrew, L.E., J.T. Wilson, and G.M. Teasdale, Reliability of ratings on the Glasgow
Outcome Scales from in-person and telephone structured interviews. J Head Trauma
Rehabil, 2003. 18(3): p. 252-8.
42. Wilson, J.T., L.E. Pettigrew, and G.M. Teasdale, Structured interviews for the Glasgow
Outcome Scale and the extended Glasgow Outcome Scale: guidelines for their use. J
Neurotrauma, 1998. 15(8): p. 573-85.
43. Bonita, R. and R. Beaglehole, Recovery of motor function after stroke. Stroke, 1988.
19(12): p. 1497-500.
44. van Swieten, J.C., et al., Interobserver agreement for the assessment of handicap in
stroke patients. Stroke, 1988. 19(5): p. 604-7.
45. Wilson, J.T., et al., Reliability of the modified Rankin Scale across multiple raters:
benefits of a structured interview. Stroke, 2005. 36(4): p. 777-81.
46. Polticelli, F., et al., Human haptoglobin structure and function--a molecular modelling
study. FEBS J, 2008. 275(22): p. 5648-56.
76
47. Anderson, C.S., et al., Predicting survival for 1 year among different subtypes of stroke.
Results from the Perth Community Stroke Study. Stroke, 1994. 25(10): p. 1935-44.
48. Miller, S.A., D.D. Dykes, and H.F. Polesky, A simple salting out procedure for extracting
DNA from human nucleated cells. Nucleic Acids Res, 1988. 16(3): p. 1215.
49. Ogilvy, C.S. and B.S. Carter, A proposed comprehensive grading system to predict
outcome for surgical management of intracranial aneurysms. Neurosurgery, 1998. 42(5):
p. 959-68; discussion 968-70.
50. Lasner, T.M. and E.C. Raps, Clinical evaluation and management of aneurysmal
subarachnoid hemorrhage. Neuroimaging Clin N Am, 1997. 7(4): p. 669-78.
51. Hunt, W.E., Clinical assessment of SAH. J Neurosurg, 1983. 59(3): p. 550-1.
52. Oshiro, E.M., et al., A new subarachnoid hemorrhage grading system based on the
Glasgow Coma Scale: a comparison with the Hunt and Hess and World Federation of
Neurological Surgeons Scales in a clinical series. Neurosurgery, 1997. 41(1): p. 140-7;
discussion 147-8.
53. Gruber, A., et al., Evaluation of cerebral vasospasm after early surgical and
endovascular treatment of ruptured intracranial aneurysms. Neurosurgery, 1998. 42(2):
p. 258-67; discussion 267-8.
54. Kasvosve, I., et al., Reference range of serum haptoglobin is haptoglobin phenotype-
dependent in blacks. Clin Chim Acta, 2000. 296(1-2): p. 163-70.
55. Teye, K., et al., Haptoglobin gene promoter polymorphism and haplotypes are unique in
different populations. Hum Biol, 2006. 78(1): p. 121-6.
56. Carter, K. and M. Worwood, Haptoglobin: a review of the major allele frequencies
worldwide and their association with diseases. Int J Lab Hematol, 2007. 29(2): p. 92-110.