an analytical approach to activating demand elasticity …€¦ · an analytical approach to...
TRANSCRIPT

Energy Economics 52 (2015) 195–206
Contents lists available at ScienceDirect
Energy Economics
j ourna l homepage: www.e lsev ie r .com/ locate /eneco
An analytical approach to activating demand elasticity with a demandresponse mechanism
Cédric Clastres a,1, Haikel Khalfallah b,⁎a Univ. Grenobles Alpes, CNRS, PACTE, EDDEN, F-38000, and CEEM Research Fellow (University of Paris Dauphine), Franceb Univ. Grenoble Alpes, CNRS, PACTE, EDDEN, F-38000, France
⁎ Corresponding author.E-mail address: [email protected] (H
1 This paper has benefited from the support of the Chaiof the Paris Dauphine Foundation, supported by RTE, EDFCaisse des dépôts. The views and opinions expressed in tthe authors and do not necessarily reflect those of the par
http://dx.doi.org/10.1016/j.eneco.2015.10.0130140-9883/© 2015 Elsevier B.V. All rights reserved.
a b s t r a c t
a r t i c l e i n f oArticle history:Received 2 February 2015Received in revised form 30 September 2015Accepted 18 October 2015Available online 30 October 2015
JEL classification:C61L11Q41
Keywords:Demand responsePrice signalsWelfare analysis
The aim of this work is to demonstrate analytically the conditions under which activating the elasticity of con-sumer demand could benefit social welfare. We have developed an analytical equilibrium model to quantifythe effect of deploying demand response on social welfare and energy trade. The novelty of this research isthat it demonstrates the existence of an optimal area for the price signal inwhich demand response enhances so-cial welfare. This optimal area is negatively correlated to the degree of competitiveness of generation technolo-gies and the market size of the system. In particular, it should be noted that the value of unserved energy orenergy reductionwhich the producers could lose from such a demand response schemewould limit its effective-ness. This constraint is even greater if energy trade between countries is limited. Finally, we have demonstratedscope for more aggressive demand response, when only considering the impact in terms of consumer surplus.
© 2015 Elsevier B.V. All rights reserved.
1. Introduction
The deployment of smart grids is seen as heralding amajor change inelectricity markets. One of the main considerations, presented as a nec-essary condition to benefit from this development, is to be able pilot de-mand or make it respond to price or market constraints (Chao, 2011).Setting aside any improvements in network management, consumerbehaviour will have a key impact on uses and investment-planning inthe midstream (networks) and the upstream (generation) (Strbac,2008). The idea is to replace some of the heavy investment in infrastruc-ture by a reduction in consumption. This could be done by consumers oranother body (aggregators, suppliers, or distributors) on behalf of con-sumers. Experiments have shown that investing in smart-grid technol-ogy could be cheaper than heavier investments in infrastructure (Kema,2012).
The main feature of electricity demand is its inelasticity (Stoft,2002). Currently, most electricity consumers are captive in the shortterm. Industrial customers could be more volatile, but mainly in thelong term (Lijesen, 2007; Patrick and Wolak, 2001). However, the aimof deploying smart grids and demand response (DR) schemes is to
. Khalfallah).re European Electricity Marketsand EPEX Spot and the Groupehis Working Paper are those oftners of the CEEM.
introduce short-term elasticity into some uses. In this way, issuingprice signals to consumers will always reduce consumption.2 The liter-ature generally shows that demand is elasticwhen a dynamic tariff is in-troduced. However, the value of the elasticity varies depending onseveral factors, such as the period of consumption, household appli-ances, degree of deployment of smart-grid technologies, or the price dif-ferential between periods of consumption (Boisvert et al., 2004; DiCosmo et al., 2014; Faruqui and Sergici, 2010). Several papers have stud-ied the impact of dynamic pricing on consumers and markets design toremunerate curtailments. Chao (2011) has demonstrated that, in a per-fect competitive market, remuneration of curtailment is equivalent tothe difference between the retail rate and the real-time price shouldbe optimal for welfare. Orans et al. (2010) show that a three-part tariff,including time-of-use, a fixed fee, and DR remuneration, is an efficienttool for providing consumers with an incentive to change theirbehaviour.
We draw on these papers using analytical equilibrium in intercon-nected markets to study the cases in which an increase in tariffswould reduce consumption without jeopardizing social welfare.We use a deterministic optimization model with supply functions(Ventosa et al., 2005). As in other papers (Stoft, 2002), we assume per-fect competitive markets. Each producer bases its bids on its marginalcosts, as in Woo (1990) and De Jonghe et al. (2011). However, to our
2 This result could be overcome by extending the rebound effect (Muratori et al., 2014).

196 C. Clastres, H. Khalfallah / Energy Economics 52 (2015) 195–206
knowledge, only a few works have sought to analytically model the de-ployment of demand response in the context of interconnected electric-ity markets. Vespucci et al. (2013) is the model closest to ours. A largepart of their analysis focuses on the transformation of their optimizationproblem into a linear one, as electric supply and demand functions arediscontinuous.They also demonstrate, with application data, that adominant firm always has an incentive to use market power to achievehigher profit targets. Our model differs from theirs on two points. First-ly, we compute theoretical equilibriums in the context of two intercon-nected markets with several technologies in each market. Secondly, weintroduce an analysis of demand response (DR) linked to the degree ofthe elasticity of consumer demand. Léautier (2014) has also studied,using an analytical approach, the impacts on welfare of switchingfrom inelastic to elastic demand via the application of real-time pricingscheme.3 Our analysis extends thiswork by addressing the effectivenessof demand response when several markets, using different generationtechnologies, are interconnected. It adds to this literature on consider-ing the extent to which the effectiveness of a demand response shouldconsider the system’s interactionswith foreign systems through the en-ergy exchanges and the difference between the generation technologiesmix.
In our research work, we focus on the effectiveness of deploying ademand response scheme.Wemay assume thatwidespread applicationof DR would have several impacts on system equilibrium. The main ob-jective of this scheme is to make consumers sensitive to prices in theshort run.4 They could actively participate in managing system security,instead of relying only on supplymanagementwhen the system is closeto rationing. DR schemes offer consumers an incentive to adopt a degreeof flexibility in their consumption. Each part of the electricity supplychain would benefit from this flexibility, gaining in efficiency.
Deploying a mechanism of this sort would nevertheless have a highcost. Consumers need to adapt and modify their behaviour, switchingfrom being captive and non-elastic to being genuinely elastic. It isworth noting that under a DR scheme, demand becomes elastic for alarge range of consumers, independently of their own appliances. Asseveral pilot schemes in the US have shown (Faruqui et al., 2009), themain gains are obviously achieved at peak hours. Demand for electricalheating or air conditioning are the main categories of consumptionwhich could bemanaged under DR schemes. However, dynamic pricinggives a large share of consumers an incentive to reduce consumption,regardless of whether they own air conditioning, for example (DiCosmo et al., 2014). Information technology, such as home displays, in-creases such effects, providing continuous information to customers onconsumption and tariffs. The impact of DR schemes on price bids hasbeen studied in the literature. DR is a key factor in making smart gridswork because it allows efficient interaction between the segments ofthe electricity supply chain.5 The literature has studied a variety of DRtools (Bergaentzlé et al., 2014; Faruqui and Sergici, 2010; Horowitzand Lave, 2014), going from the simplestmechanismwhich involves di-viding periods of consumption into price blocks, in which the price in-creases in step with short-term system vulnerability (time-of-use orcritical peak pricing), tomore complex systems in which consumers re-spond to electricity prices in real time (real-time pricing).When severalcommunications technologies are developed, load management of
3 Léautier (2014) applies his results to the Frenchmarket. Asmarginal revenue of SGde-ployment is decreasing, current costs ofmarginal deployment of smartmeters are too highcompared to benefits. Thus, it should be not profitable to continue to install equipment forall consumers. Moreover, Crampes and Léautier (2015) have recently shown that underimperfect information, DR could reduce the welfare from the adjustment market as con-sumers could behave strategically.
4 Electricity consumers are recognized to be elastic only in the long run, even if in theshort run, some of them can bepartly elastic too.We also note thatwemakenodistinctionbetween residential and industrial consumers, who have different consumption profilesand would, in practice, react differently to an intensive DR scheme.
5 For instance, generators of conventional or intermittent energies could easily managevariations in their production and integrate renewable energies in the power system.
consumers by the supplier or the distribution system operator wouldallow a significant decrease in demand, higher than a reduction man-aged only by the consumer. All these tools imply an increase in electric-ity prices at times of high demand and lower prices at other times. Itseems realistic to assume that activating DR will result in an increasein electricity prices in peak periods. As prices increase, some consumerscould be worse off due to this increase (Horowitz and Lave, 2014). Asthe main gain from a DR scheme is a drop in peak-load demand, incen-tive prices or direct load control are used to make the volume effectgreater than the price effect; in other words, decreasing electricity con-sumption compensates for increasing prices. This should be done byminimizing the impact on consumer utility,6 as consumers must haveincentives to participate in a DR scheme. We shall therefore study twoeconomic indicators—social welfare and consumer surplus—to gaugethe efficiency of the DR schemes.
In our paper, we model a system in which generators, integratedwith suppliers or retailers, make bids (supply curves) to the system op-erator which maximizes the welfare balancing offer and demand. WithSG technologies, consumers could become active on the market; thus,their demand function becomes elastic. In this environment, we startby analysing the way the structure of generating technologies could af-fect merit orders in different countries and potential trade betweenthem. Our results show that the trade-off between producing locallyand exporting energy depends on the opportunity cost of the energyand the overall efficiency of generating technologies. Then, we demon-strate that there is an optimal level for the price signal at which DR in-creases social welfare. We use computed equilibria from our initialanalysis to show that this optimal level is negatively correlated to thedegree of competitiveness of the generating technologies and the sizeof the market. The value which producers could lose due to unservedenergy or energy reductions would limit the deployment of a schemeof this sort. Moreover, this constraint is greater if energy trade betweencountries is limited. However, the constraint is less acute if the consid-ered system is cost-inefficient, with only limited connections withneighbouring systems.
The paper is divided into five sections. Following this introduction,Section 2 presents the assumptions used in modelling the analyticalequilibriums and results of social-welfare analysis. Section 3 focuseson the effectiveness of DR with regard to consumer-surplus criteria.Section 4 analyses the sensitivity of the results to the elasticity of de-mand. Section 5 presents our conclusions.
2. A model for demand response
2.1. General assumptions
2.1.1. Trade between the systemsWe shall assume there are two interconnected countries7 (n=1,2).8
Each system operator balances total supply and demand, making allow-ance for possible trade between the countries. Such trade is limited byan interconnection capacity between country n and m, Capn,m, whichhas a price Pn,m when capacity is saturated.
2.1.2. Generation technologies and supplyEach country is characterized by the presence of t generation tech-
nologies, t= {1… k}. We assume perfect competition in both markets.9
6 One of themain fields of research by suppliers is for ways of convincing consumers toparticipate in DR schemes. To gain consumer acceptance, DR schemesmust minimize im-pact on both modern amenities and electricity bills.
7 The model could be enlarged to analyse more than two interconnected systems.8 Index m is also used.9 We disregard the strategic behaviour of producers by assuming that themerit order of
a given system is the result of aggregating themarginal costs of available generation tech-nologies. The model is a one-shot game with linear demand. To serve demand, all capac-ities are offered to the market through the aggregate supply function.

13 Several operators or actors could invest in smart technologies or smart appliances:suppliers/retailers, consumers, aggregators of flexibility, etc. Our model only considersthe investment made by suppliers. We do not capture those made by aggregators or di-rectly by consumers. Smart Grid investments can be seen as any other classical investmentin innovation. It’s firstly assumed by suppliers or grid companies and then passed throughto consumers via an increase in the regulated tariffs or directly in electricity prices. More-over, pilots on smart grids have shown that utilities make the investment that is more of-ten a private one (with a complement of public funds). An exception is on smart metersthat are supported by DSO (Gangale et al., 2013; Greening, 2010). We are grateful to an
197C. Clastres, H. Khalfallah / Energy Economics 52 (2015) 195–206
Each technology is characterized by a quadratic variable cost function,10
described as follows:
CVt;n xt;n� � ¼ at;n:xt;n þ 1
2:bt;n:xt;n2 ð1Þ
at,n and bt,n are parameters and xt,n is the quantity produced by technol-ogy t in a given country n.
By aggregating the marginal costs of the technologies available incountry n, we obtain the following inverse supply function:
Sn Xnð Þ ¼ an þ bnXn ð2Þ
an and bn are aggregate parameters and Xn =∑t = 1k (xt,n + xt,n,m) is the
total quantity produced in a given country n, with xt,n,m the quantityproduced by technology t in a given country n and exported towardscountrym. See Appendix 1 for more details on construction of the sup-ply function.
For simplicity’s sake, we shall rank the technologies from the least tothe most expensive.11 A linear relationship between the variable costsfunction of the technologies is made as follows:
at;n ¼ αt−1:a and bt;n ¼ αt−1:b
where α is a ranking parameter of the technologies12; a and b corre-spond to the parameters of the least expensive technology.
2.1.3. Demand and market equilibriumIn the first scenario, electricity demand in a given country is assumed
to be inelastic ( Dn ). In the second scenario, we assume thatimplementing a demand response mechanism will modify consumerbehaviour, so that demand becomes elastic. The inverse demand func-tion in the latter case is given by
Dn−1 Xnð Þ ¼ cn−dn:Xn ð3Þ
where cn and dn are the parameters of the inverse demand function.Market equilibrium is found at the intersection between the supply
and demand functions (Fig. 1). As long as consumers remain passiveplayers, their demand function just depends on prices and their elastic-ity. The supply function is the result of a minimization program bywhich the system operator determines the aggregate supply functionto be minimized to satisfy local demand. As in Vespucci et al. (2013),this minimization includes local generation technologies and potentialimport from the neighbour country (see Section 3).
Final consumption in a given country Qn will take this form:
Qn ¼ Dn if Demand is inelasticD−1n Qnð Þ if Demand is elastic
�ð4Þ
2.1.4. Modelling demand responseLet us assume that widespread application of DR will lead to at least
two consequences in the future. Firstly, wemay posit that the additionalcost of DRborne by supplierswillmodify and increase their supply func-tion. Investments inmetering, energy boxes, and sensorswill be neededto precisely assess energy consumption andmaximize the impact of DRschemes. Firms should also invest in people to manage big data andpilot the DR scheme. All these investments will need to be recoupedby the firms, leading to higher fixed and variable costs. Suppliers willundertake such investments after estimating their specific market
10 Assuming a perfect competitivemarket,fixedgeneration costs are disregarded, havingno impact on our results.11 The efficiency of generation technologies relies on input costs, yields, other variablecosts to produce one MWh, costs of emission trading system, the period of use, etc.12 We assume thatα is slightlyN1 to keep a rational homogeneity in the generation tech-nologies and avoid exponential disparity between them.
share whereas the cost will be transferred to consumers by a tariff in-crease. The case studied in our model, as in Crampes and Léautier(2015), could be seen as a supplier vertically integrated in generation.This supplier sends a price signal to the consumer, a signal composedby smart appliances costs and others features of the market. As perfectcompetition is assumed, the supply function of the integrated entityshould integrate supply costs plus the costs of smart appliances thatshould be recovered through its supply activity.13 Finally, these costsare paid by consumers. Thus, this could be modelled by assuming thatthe technology’s operational costs (Eq. (1)) will increase by a convexfunction, 1
2γn:xt;n2 where γn can be interpreted as a DR intensity
parameter.14 This parameter contains all costs of the DR program aswell as the intensity of the price signal given to consumers. We there-fore assume a positive correlation between the intensity of suppliers’ in-vestments in the smart-grid system and the opportunity for consumersto manage their consumption with a wide range of tools (in-home dis-play, direct load control, energy boxes, etc.). On the other hand, we canassume that consumers, now being price-sensitive, will becomedemand-elastic. Graphically, the electricity price shifts from point A topoint B, as shown in Fig. 1 above, as it moves from a no-DR scenario toa widespread-DR scenario. With deployment of smart grids, consumersreceive information, allowing them tomake decisions, change their pat-terns of electricity consumption and adapt their demand. DR schemeschange the cost of electricity for consumers: they receive new price sig-nals, given by their suppliers, and, with new SG technologies, they canrespond to them. The reserve price for consumers with DR, cn, is nowhigher than Volln. Indeed, when consumer demand is price-elastic, con-sumers are inclined to pay higher prices for electricity when the systemis rationed, so they attach a much higher value to electricity scarcitywhich implies an increase in the value of lost energy (Voll).15
We shall consequently study the impact of price-based DR on themarket equilibrium of two interconnected areas, with regard to socialwelfare and consumer surplus. We first consider the most the systemoperator can reduce demand without any loss in social welfare. We de-fineQn,min as theminimum consumptionwe can reachwithout decreas-ing social welfare. Then, we introduce analysis of consumer surplus toshow that some types of DR scheme may not degrade this surplus. Wealso carry out sensitivity analysis of key parameters and the level of de-mand elasticity.
2.2. Welfare-related analysis of the impact of demand response
2.2.1. Baseline caseWe start from the scenariowithout demand response. Since demand
is inelastic, optimal production and trade maximizing social welfare(5) are the solution of the following program:
Maxxt;n;xt;n;m
Z Dn
0Volln−Sn Xnð Þð ÞdXn ð5Þ
anonymous referee for this remark improving the understanding of the research.14 Themore the investment in smart appliances is, themore the demand response couldbe high. The degree of smart investment is positively correlated to the potential of DR.Thus, γn captures this relationship and its meaning could be analysed as the intensity ofthe DR program.15 In practice, the reserve price varies with the type of consumers, their elasticities aswell as the duration of the outage (Léautier, 2012).
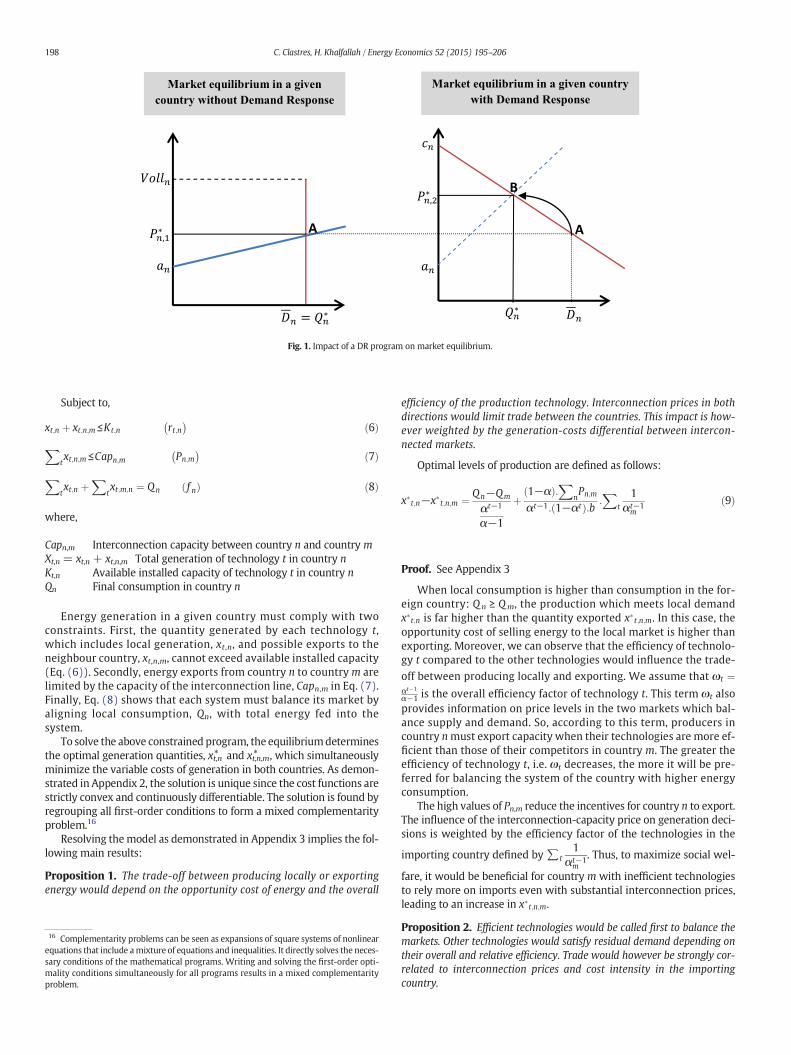
Fig. 1. Impact of a DR program on market equilibrium.
198 C. Clastres, H. Khalfallah / Energy Economics 52 (2015) 195–206
Subject to,
xt;n þ xt;n;m ≤Kt;n rt;n� � ð6Þ
Xtxt;n;m ≤Capn;m Pn;m
� � ð7ÞX
txt;n þ
Xtxt;m;n ¼ Qn f nð Þ ð8Þ
where,
Capn,m Interconnection capacity between country n and country mXt,n = xt,n + xt,n,m Total generation of technology t in country nKt,n Available installed capacity of technology t in country nQn Final consumption in country n
Energy generation in a given country must comply with twoconstraints. First, the quantity generated by each technology t,which includes local generation, xt,n, and possible exports to theneighbour country, xt,n,m, cannot exceed available installed capacity(Eq. (6)). Secondly, energy exports from country n to country m arelimited by the capacity of the interconnection line, Capn,m in Eq. (7).Finally, Eq. (8) shows that each system must balance its market byaligning local consumption, Qn, with total energy fed into thesystem.
To solve the above constrained program, the equilibriumdeterminesthe optimal generation quantities, xt,n⁎ and xt,n,m⁎ , which simultaneouslyminimize the variable costs of generation in both countries. As demon-strated in Appendix 2, the solution is unique since the cost functions arestrictly convex and continuously differentiable. The solution is found byregrouping all first-order conditions to form a mixed complementarityproblem.16
Resolving themodel as demonstrated in Appendix 3 implies the fol-lowing main results:
Proposition 1. The trade-off between producing locally or exportingenergy would depend on the opportunity cost of energy and the overall
16 Complementarity problems can be seen as expansions of square systems of nonlinearequations that include amixture of equations and inequalities. It directly solves the neces-sary conditions of the mathematical programs. Writing and solving the first-order opti-mality conditions simultaneously for all programs results in a mixed complementarityproblem.
efficiency of the production technology. Interconnection prices in bothdirections would limit trade between the countries. This impact is how-ever weighted by the generation-costs differential between intercon-nected markets.
Optimal levels of production are defined as follows:
x�t;n−x�t;n;m ¼ Qn−Qm
αt−1
α−1
þ1−αð Þ:
XnPn;m
αt−1: 1−αtð Þ:b :X
t
1αt−1m
ð9Þ
Proof. See Appendix 3
When local consumption is higher than consumption in the for-eign country: Qn ≥ Qm, the production which meets local demandx�t;n is far higher than the quantity exported x�t;n;m. In this case, theopportunity cost of selling energy to the local market is higher thanexporting. Moreover, we can observe that the efficiency of technolo-gy t compared to the other technologies would influence the trade-
off between producing locally and exporting. We assume that ωt ¼αt−1
α−1 is the overall efficiency factor of technology t. This term ωt alsoprovides information on price levels in the two markets which bal-ance supply and demand. So, according to this term, producers incountry nmust export capacity when their technologies are more ef-ficient than those of their competitors in country m. The greater theefficiency of technology t, i.e. ωt decreases, the more it will be pre-ferred for balancing the system of the country with higher energyconsumption.
The high values of Pn,m reduce the incentives for country n to export.The influence of the interconnection-capacity price on generation deci-sions is weighted by the efficiency factor of the technologies in the
importing country defined by ∑t1
αt−1m
. Thus, to maximize social wel-
fare, it would be beneficial for country m with inefficient technologiesto rely more on imports even with substantial interconnection prices,leading to an increase in x�t;n;m.
Proposition 2. Efficient technologies would be called first to balance themarkets. Other technologies would satisfy residual demand depending ontheir overall and relative efficiency. Trade would however be strongly cor-related to interconnection prices and cost intensity in the importingcountry.
199C. Clastres, H. Khalfallah / Energy Economics 52 (2015) 195–206
Each efficient technology twould offer all its installed capacity to theinterconnectedmarkets. Optimal quantities for local production and forexport are given as follows17:
x�t;n ¼ Kt;n
2þ Qn−Qm
2:ωtþ
XnPn;m:
Xt
1αt;m
b:ωtð10Þ
x�t;n;m ¼ Kt;n
2−
Qn−Qm
2:ωt−
XnPn;m:
Xt
1αt;m
b:ωtð11Þ
We define t as the index of inefficient technologies. They would onlyserve residual demand in the interconnected markets, with quantitieslower than their total installed capacity. Their optimal production levelsare given by18
x�t;n ¼ Resn−ϕt
ωtþ Pm;n
b:ωt:X
t
1αt;m
ð12Þ
x�t;n;m ¼ Resm−ϕt
ωt−
Pn;m
b:ωt:X
t
1αt;m
ð13Þ
where,
Resn ¼ Qn−X
tx�t;n−
Xtx�t;m;n
Resm ¼ Qm−X
tx�t;m−
Xtx�t;n;m
ωt ¼ αt−1
α−1 where t is the index of an inefficient technology
ϕt ¼ ∑t;n
at;n−at;n
bwhere t is the index of the other inefficient tech-
nologies apart from t
Proof. See Appendix 4
The call for a given technology to produce would depend on its effi-ciency compared to other technologies. When its efficiency is higherthan a certain threshold, as discussed in Appendix 4, all its available ca-pacity will be used to balance the systems. The other technologies willeither fulfil the efficiency conditions and will hence be called at full ca-pacity, or only serve residual demand, thus verifying the solution ofEqs. (12) and (13).
We shall now consider the efficient technologies. We can see thatthe share of capacity between local production and export is mainly de-termined by the energy-consumption differential,Qn− Qm. Generationis symmetrically shared between local generation and export, with aconstant slope which depends on the overall efficiency factor of thetechnology, 1
2:ωt; the total cannot exceed the available generation capac-
ity, Kt,n. If technology t of country n is efficient with respect to othertechnologies, its production increases to serve both local demand andexports to neighbouring country m until its full capacity Kt,n is reached.Generation sharing is impacted by the overall efficiency factor of thetechnology, ωt. An increase in αt − 1, which means that the technology
17 Providingx� t;n and x� t;n;m are non-negative, with x� t;n þ x� t;n;m bK. Otherwise, if x� t;n þx� t;n;m ≥Kt;n , the equilibrium is x� t;n þ x� t;n;m ¼ Kt;n and other technologies serve residualdemand.18 Providing x� t̄;n and x� t̄;n;m are non-negative and their sum does not exceed the tech-nology capacity Kt̄;n. Otherwise, inefficient technologies produce at full capacity and thereis a risk of an unbalanced market with no equilibrium.
tends to be more costly, leads to an increase in ωt, meaning that thetechnology becomes less efficient. In this case, the incurred inef-ficiency will be borne by the system facing low demand. This behav-iour should stop as soon as the overall inefficiency factor of efficienttechnology reaches a limit beyond which the technology becomesabsolutely inefficient and will hence be shared, given the solutionsto Eqs. (12) and (13).
As for inefficient technologies, their call is increasingly depen-dent on residual demand, as shown in Eqs. (12) and (13), and onthe overall, ωt , and relative, ϕt , efficiencies of the technology com-pared to the other inefficient ones. Not surprisingly, when choosingbetween inefficient technologies, the least inefficient ones are pre-ferred, so x�t;n and x�t;n;m decrease when ωt or ϕt increase. However,potential export is only impacted directly by the export capacityprice, Pn,m. System operators will only rely slightly on inefficient gen-eration technologies to balance their systems, so these technologieswill only serve as auxiliary capacity.
In the sections and subsections that follow, the analysis of welfare,consumer surplus and elasticity will use the results of the equilibriumcomputed in Eqs. (10)–(13) and also refer to Fig. 1. Indeed, this figureillustrates how the elasticity of demand, consumer surplus and welfarelevels could bemodified given different parameters of costs, the level ofmarket size and two configurations regarding the transmission capacitylimits.
2.2.2. Introducing demand responseTo assess the social efficiency of a DR scheme, we consider the max-
imum level of demand reduction the system operator can achievewith-out loss of social welfare. As we said previously, we define Qn,min as theminimum consumption above which social welfare does not decrease.As our model is on a single period, we could not capture the effect ofload-shifting across several periods when DR occurs.19
We assume that the efficiency of a DR schemewould also depend onthe competitiveness of the country concerned. We consequently con-sider two extremes cases separately: a cost-efficient country scenario;and a cost-inefficient country scenario.
The results of the previous sub-section highlight the impact of theopportunity cost of energy and the cost efficiency of technologies on en-ergy trade between countries, subject to interconnection-capacityprices. The trade-off between costs and volume efficiencies woulddrive decisions on trade and generation. In the following we applythese theoretical predictions by considering the particular case of elasticdemand with DR. The results of Propositions 1 and 2 will serve as theanalytical basis for the following efficiency study.
We defineΔn as the variation inwelfare after deploying a DR schemein country n as follows:
Δn ¼ SWn;2−SWn;1 ð14Þ
where,
SWn;1 ¼ ∫Dn0 ðVolln−SnðXnÞÞdXn social welfare at equilibrium before
deploying the DR scheme.SWn;2 ¼ ∫Q
�n
0 ðDn−1ðXnÞ−SnðXnÞÞdXn social welfare at equilibrium af-
ter deploying the DR scheme.
19 However, load-shifting leads to greater demand in other periods. In our model, thisimplies two cases. If load-shifting impactsDn, an increase in demand raisesQn,min becauseof an increase in SWn,1; thus shifting demand fromone period to another one could be det-rimental for welfare. If we consider that load-shedding only impacts elastic demand, thedemand function Dn
−1ðXnÞ ¼ cn−dn:Xn moves upward, increasing SWn,2. In our model,this increase in demand decreases Qn,min. Thus, thewelfare could be improved. The impacton consumers surplus is less obvious as load-shedding increases prices in other periods. Itsimprovement relies on the level of elasticity of demand, impacting the hierarchical orga-nization between price and volume effects.
200 C. Clastres, H. Khalfallah / Energy Economics 52 (2015) 195–206
Developing the above function,we obtain thatΔn ≥ 0, i.e. DR is social-ly efficient, when the equilibrium quantity is in the optimal area definedbelow:
Q �n≥Qn;min ¼ 2:SWn;1
cn−anð15Þ
Qn⁎ is the equilibriumeffectively reached according to the supply and
demand functions and the DR parameter, γn. Qn,min is the minimumequilibriumquantitywhich could be reachedwith a DR schemewithouta decrease in social welfare. This threshold exists for each equilibriumQn⁎, i.e. for all configurations of the supply and demand functions. Ac-
cording to the supply and demand parameters, some of these equilibri-ums will induce a positive variation in social welfare.
As we also know that at intersection point B in Fig. 1, Q�n ¼ cn−an
γnþbnþdn,
we can obtain a negative correlation between the intensity of the DRscheme, γn, and the probability of coping with Δn ≥ 0 as limγn→þ∞
Q �n ¼
0. This result makes sense, since the greater the intensity of DR, themore consumption is reduced. It being optimal for the DR scheme to
reach Q �n∈
hQn;min;Qn;max ¼ cn
dn
ito maintain social-welfare gains, inten-
sive DR should have a greater impact reducing both consumer surplusand the profits of firms which base their competitive strategy on theirmarginal costs. There is consequently no incentive to design a γn suchas Qn
⁎ b Qn,min because of social-welfare losses when the demand func-tion is elastic. As Δn is an increasing function of Qn, we could concludethat Qn
⁎ = Qn,min is the minimal condition the equilibrium must meetto keep the gains from DR schemes.
According to this initial result, we can see that theminimumquanti-ty is linked to the parameters of the supply function an and bn, reflectingthe marginal costs of supply, and reserve electricity prices before andafter changes in consumer behaviour due to the DR scheme, Volln andcn, respectively.
2.2.2.1. Efficient country results.
Proposition 3. If the country is efficient, there is an optimal area forwhicha demand response scheme does not reduce social welfare. This area is neg-atively correlated with the degree of competitiveness of the generationtechnologies and the size of the country’s market.
The intuition of Proposition 3 is the following. A large size of themarket increases Qn,min. Indeed, if Kt,n increases, cheap generationis then available to serve the demand. Thus, SWn,1 will increase too.In the same way, high levels of Dn increase SWn,1. As a result, Qn,min
increases, which implies difficulties to achieve the conditionSWn,2 N SWn,1. Moreover, in this case, a great DR deteriorates profitsof efficient generators because of the non-served energy. The priceeffect does not compensate losses in sales in the retail market (asDR reduces final demand). Consumers’ surplus is also damaged be-cause of rationing whereas cheaper generation is available to servetheir demand.20 Cheaper generation goes with higher SWn,1. Hereagain, the condition SWn,2 N SWn,1 is difficult to achieve. Thus, oppor-tunities to improve welfare with cheap generation capacities arereduced.
From the other side, DR reduces the demand in efficient countryn. Thus, efficient generators are willing to increase their exports to-wards inefficient countrym. However, if the costs of interconnectorsare high (or if transmission capacity is limited), they could not easilyincrease their export levels. Thus, Qn,min will increase. Moreover, theefficiency of the overall interconnected market is reduced, a large
20 Chao (2011) has shown similar results by considering the incentive policies of DR toconsumers. He concludes that if remuneration of DR is too high (called the “double remu-neration”), it could be detrimental for welfare because DR is over-evaluated, by replacingcheaper generation, which is more efficient.
part of the residual demand being served by inefficient or less effi-cient generation.
To sum up, DR programs could reduce the welfare when generationtechnologies are efficient. A high level of inelastic demand or large effi-cient generation capacities increase these losses (because of high initialvalues of SWn,1). High levels of DR could be implemented only if costsparameters bn are high or for low values of Dn (that have a decreasingimpact on SWn,1).
To demonstrate these results, we assume first that country n ismore efficient than country m. This means that with or withoutprice signals, only its generation technologies will be called to meetlocal demand.
Integrating our results from Proposition 2 into Eq. (15), the optimalminimum quantity is thus equal to:
Qn;min ¼
XtKt;n−α:Qm þ Pn;m
α−1ð Þ:b2−α
¼ 2:SWn;1
cn−anð16Þ
The left term (from cost-minimization programs (5–8)) and theright term (from Eq. (15)) are equal at equilibrium. Any change in a pa-rameter of one term will be accompanied by a proportional change inanother parameter in the other term, guaranteeing that the aboveequality always holds and equilibrium is still the one in which efficienttechnologies are predominant. The link between the two terms is ob-tained through parameter bn as detailed below.21
We can deduce fromEq. (16) that the borders of the optimal area de-pend on many parameters related to the configuration of the intercon-nected systems and technology specifications. We define three criteriato study the sensitivity of Qn,min to the main parameters. The first oneconcerns the market size of the efficient country; it is impacted by Kt,n
and Dn . Indeed, the greater these parameters become, the larger wemay assume the system to be. The second indicator is the level ofcost-efficiency of technologies. Supply-function parameters, such as anand bn, fall into this category. The third indicator reflects the impact ofthe limitation on transmission capacity.
2.2.2.1.1. Market size. From Eq. (16), we observe that an increase inthe size of the efficient country’s market, either due to an increase in∑tKt,n or inDn, causesQn,min to increase; consequently reducing the op-timal area of DR. Two reasons could explain this correlation. First, be-cause country n is cheap, any increase in its technology capacity willlead, on the one hand, to an increase in the level of exports to countrym and, on the other, will offer cheaper technologies to country n, reduc-ing the slope of its energymix (parameter bn) and boosting initial socialwelfare SWn,1. We thus obtain an identical increase on the left and rightsides of Eq. (16). The optimal area of a DR scheme, which does not de-grade social welfare, is therefore reduced.22 Secondly, the higher initialdemand is, Dn;
23 the greater the reduction in generation required tocope with the DR target (for lower consumption). The impact on theprofitability of producers is consequently negative, due to the highervalue of their unused capacity. As for consumers, a higher Dn meansthat captive demand is high enough to allow rationing of a large numberof users by a DR scheme, without impacting negatively on their welfare.
As a preliminary conclusion, we may assume that intensive DR isconstrained by the market size of the system because of the consider-able impact on producers of the value of non-served energy. Consumerrigidity would not only undermine the efficiency of DR, it would alsoimpact the producers, with a drop in profit. In this case, consumer ra-tioning is costly for society. There is no need for consumers to be
21 This analysis procedure is followed for all the scenarios below.
22d
�∑t Kt;n−α:Qm2−α
�dKt;n
N0 ifα: dQ n;min
dcnb 1, meaning that only part of the capacity increase will be
exported. At the same time, dSWn;1dKt;n
N0 because of decrease in bn.23 dSWn;1
dDnN0 because P�
n;1 ¼ an þ bnDnb Pn .

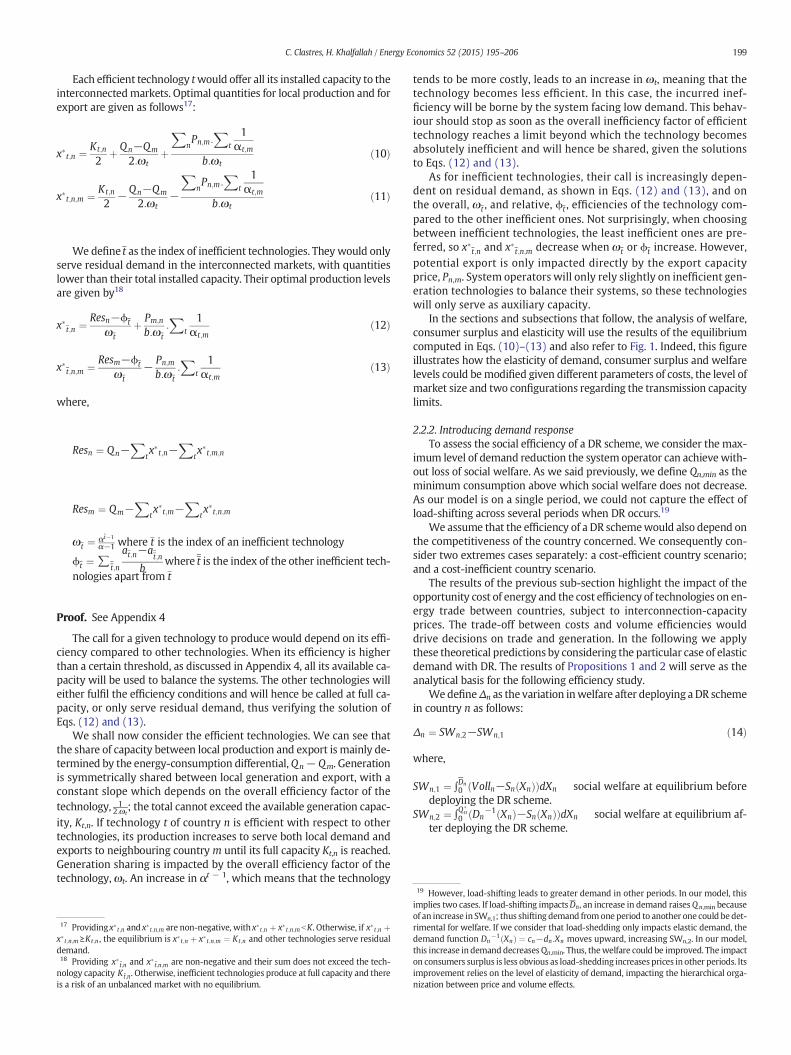
Fig. 2. Optimal regions of DR for efficient country.
24 We disregard extreme situations, i.e. when the country becomes inefficient comparedto its neighbour. Such a situation will be studied in the next subsection.
201C. Clastres, H. Khalfallah / Energy Economics 52 (2015) 195–206
rationed or adapt their consumption, generation being available andcheap. Indeed, the loss in terms of surplus could be very high in a situa-tionwhere generation is cheap but consumptionmust decrease becauseof the voluntary price increase. There is a kind of opportunity cost for ra-tioning consumers without constraining the system.
2.2.2.1.2. System-cost efficiency. The second group of parameters re-garding cost efficiency comprises parameters specific to the supplyfunction (an and bn). Again, when an or bn decreases, which alsomeans that technologies are increasingly efficient, we observe an in-crease in Qn,min. Indeed the cost of serving demand Dn with an efficientenergymix is now lower. Intensive DRwould entail a higher opportuni-ty cost which in turn would limit DR efficiency.
2.2.2.1.3. Transmission-capacity limit. Due to the constraint on inter-connection capacity, a capacity price effect associatedwith use of the in-
terconnection is represented by Pn;m
ðα−1Þ:b . The higher the value of
interconnection capacity, the smaller the optimal DR area becomes. In-tensive DR should encourage consumers to greatly reduce their con-sumption. Such a reduction in consumption will be accompanied by alarge drop in local generation. However, efficient producers, seeing ahuge reduction in the volume they generate, can export surplus produc-tion to the less efficient neighbouring country, thus reducing the nega-tive volume effect of such ameasure. Butwhen interconnection capacityis limited and access to it is more expensive, export becomes bothmorecostly and less feasible. Hence, the equilibrium at which the greatestpossible use is made of efficient technologies is much more difficult toreach. The cost of serving rationed demand will significantly increase,prompting the system operator to adopt a less intensive DR scheme toprevent system collapse.
2.2.2.1.4. Optimal system configuration for intensive demand response.To conclude we shall look at two indicators reflecting the cost structureand the market size of the studied country. The first one includes, asstated previously, parameters such as the supply-function parameters,an and bn. As we have shown, the impact of these parameters on Qn,min
is the same: the more cost-efficient technologies are, the higher Qn,min
becomes. So, for simplicity’s sake, we can focus exclusively on parame-ter bn, as a good indicator of the cost efficiency of the technologies.
Regarding the market size indicator, we should emphasize that thehigher initial captive demand Dn , or generation capacity ∑tKt,n, is, thehigher Qn,min becomes. For greater simplicity, we shall centre our con-clusion on the impact of Dn . Fig. 2 shows the variation in the optimalarea depending on the levels of bn andDn:
24 The curves are approximat-ed, based on our results from Eqs. (15) and (16).
Two zones can be identified. The first zone Ameans that with low bnand lowDn, it is not possible substantially to reduce demand. If bn is suf-ficiently low, rationing will lead to a high negative price effect on con-sumers. With low demand, the scheme would not yield a significantlypositive quantity effect. In the opposite case, if both parameters arehigh, the volume effect is considerable compared to the price effect. Inotherwords, the drop in generation yields an initial effect, with a secondeffect caused by the higher value of unused capacity. Finally, a slight re-duction in demand is also expectedwhen bn is low andDnhigh.Whereasthe positive volume effect for consumers would be offset by the highnegative price effect, producers would lose a large amount of their sur-plus, as in the previous case because of the significant drop in generationreduction and higher value of unused capacity. However, the positiveimpact of the price increase on producers would be limited, given theincreasing impact of the DR scheme on operating costs.
However, an aggressive DR scheme could only be deployed if bnwashigh andDn low (zone B in Fig. 2). Tomore reduce consumptionwithoutwelfare losses, the negative volume effect of the DR scheme on con-sumers and producers must be offset by the positive price effect, yield-ing an insignificant impact on total surplus.
2.2.2.2. Inefficient country.
Proposition 4. If a country is inefficient, the more it imports, the lesseffective intensive DR will be.
The intuitions of Proposition 4 are as follows. Costs and Dn have thesame impact as in the previous case (efficient country). However,

25 SG and DR pilots have shown that this risk exists but could be limited for consumerswho react to signals from utilities or DSOs (Faruqui et al., 2007, 2011; Faruqui and Sergici,2010).
202 C. Clastres, H. Khalfallah / Energy Economics 52 (2015) 195–206
imports are now playing amajor role. We could see that the DR intensi-ty is a decreasing function of imports from the efficient country. Indeed,if these imports are large, thus SWn,1 is great which makes it difficult tosatisfy SWn,2 N SWn,1. We could conclude that if interconnection pricesare high (or for low interconnection capacities), the DR could also behigh (SWn,1 is reduced and the condition SWn,2 N SWn,1 is easily satis-fied). A more aggressive DR could also be implemented if bn is high(reflecting high generation cost in country n) or for low values of Kt,m
(imports from efficient country are reduced). Indeed, in that case, con-sumers are served by costly generation. If they cannot import cheaperenergy, thus SWn,1 is reduced and Qn,min decreases, facilitating the satis-faction of SWn,2 N SWn,1.
To demonstrate these results, we shall now assume that country nis less efficient than countrym. This means that with or without pricesignals, it always relies on imports from country m to satisfy localdemand.
The minimum quantity for efficient DR is equal to:
Qn;min ¼X
tKt;m−α:Qm−
α2
α−1:b:
XmPm;n þ Resn
2−α¼ 2:SWn;1
cn−anð17Þ
Parameters an and bn (through SWn,1) have the same effect onQn,min. Any decrease in the inefficiency of the cost of the technologiespositively impacts Qn,min. Similarly, the market-size indicator of theinefficient country, Dn , through SWn,1, stills positively influencesQn,min. The optimal area is however significantly influenced by themarket size of the exporting country m, i.e. Kt,m, as we will seenext. As a preliminary interpretation, we can say that since the coun-try relies massively on imports, any local energy policy would besubject mainly to the attractiveness of imports.
2.2.2.2.1. Market size of the exporting country.When the level of gen-eration capacity in the exporting country, Kt,m, rises, so doesQn,min. DR inthe inefficient importing country becomes less effective. An increase inKt,m will relax the neighbouring system, therefore encouraging higherexports to the inefficient system. Two situations are consequently pos-sible. The inefficient technologies in country n may be more replacedby less costly ones, so that an increase in Kt,m will be accompanied bya decrease in the residual demand served by local producers, Resn,with quite limited impact on Qn,min. Alternatively, the growth in capac-ity in the exporting country will be transferred to country n, thus satis-fying more demand. Qn,min must increase because Resn will still beunchanged. In the latter case, rationing is more harmful for consumers.Indeed, when available capacity is competitive, consumers do not needto be rationed or adapt their consumption, generation being cheap. Theopportunity cost of rationing consumers without constraining the sys-tem is significant here.
2.2.2.2.2. Transmission-capacity limit. Eq. (17) shows that the great-er the cost of imports for the inefficient country, the more intensiveDR could be. Indeed, when Pm,n increases, there is less scope for rely-ing on imports to satisfy local demand. Inefficient local generationwill be used to balance the system. Given that the opportunity costof reducing generation is much lower for inefficient technologies(local producers) than efficient ones (exporters), the system opera-tor can deploy a more aggressive DR scheme without facing the so-cial cost of unserved generation entailed by relying only onefficient technologies.
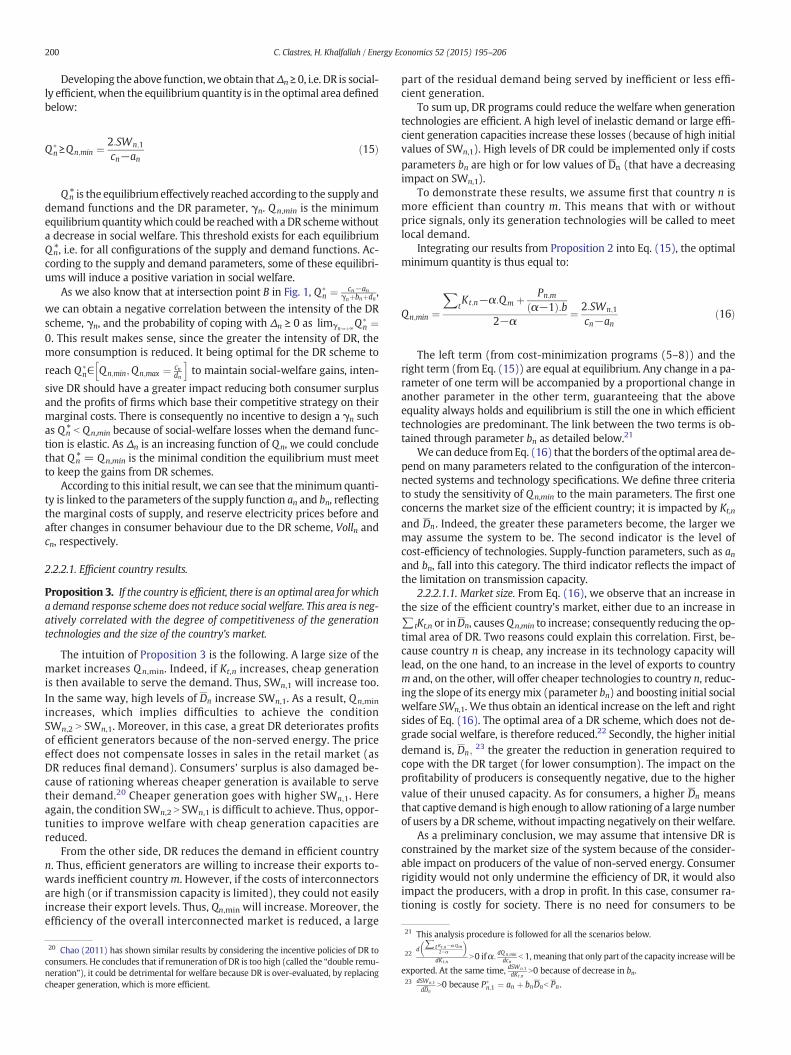
2.2.2.2.3. Optimal system configuration for intensive demand response.To conclude, we shall again focus on two criteria relating to the costlevel of technologies in the inefficient country and to the market size ofthe exporting country, given that it significantly influences equilibriumin the studied market. We consider the parameter bn as an indicator ofthe country’s efficiency. We look at the impact of Kt,m as an indicator ofthe market size of the neighbouring country counterbalancing the ineffi-ciency of the studied country. Fig. 3 shows the optimal area of DRwith re-gard to bn and Kt,m.
Here, three zones are identified. Zone Ameans that it is socially inef-ficient to target low demand-reductionwhen either bn or Kt,m are low oronly Kt,m is high. If bn and Kt,m are low, this means that the system is lessinefficient but cannot rely asmuch on imports. On the onehand, there isless scope for rationing consumers, generation being cheap. On theother, the system operator must rely on local producers to satisfy localdemand, so intensive demand-reduction would have a negative impactonwelfare due to the DR scheme’s high negative price effect on produc-er surplus, i.e. the large price differential between the initial situationand the target scenario. If Kt,m is high, imports could be abundant re-gardless of the system’s cost-intensity. DR is also limited. Whereas con-sumers could be less sensitive to demand rationing, the significantweight of cheap imports will induce a significant decrease in their sur-plus, making the large-scale demand reduction socially inefficient forall actors involved in a system of this sort. This result is very interestingand emphasizes the extent to which the development of interconnec-tions between countries could condition energy strategies in countriesheavily dependent on energy imports.
However, an aggressive DR scheme could only be deployed if bn ishigh andKt,m is low (zone B). In this case, a very inefficient system coex-ists with a low rate of imports. In such a case, consumerswould bemoreinclined to accept demand rationing, the electricity price already beingexcessive. On the other hand, local producers and importers wouldnot see a significant drop in their surplus, making aggressive demandreduction socially acceptable regarding the interests of the actors in-volved in such a system. This means that intensive DR could be de-ployed if the system was already extremely inefficient and alsorelatively isolated.
These results are summarized in Table 1.
3. Consumer-surplus analysis
We shall now study the extent to which the optimal area for DRschemes would vary if, instead of social welfare, we consider variationsin consumer surplus. Consumers are sensitive to financial losses thatcould occur with the adoption of a new technology (Park et al., 2014).In the case of a smart grid being deployed with demand responseschemes and dynamic pricing, these fears would be associated withlower surplus, because of the risk of higher electricity bills.25 This isone of the main risks that consumer groups fear when DR schemesare introduced. Indeed, a DR mechanismmust act mainly on consumerprofiles; its efficiency depends on their willingness to adapt and theelasticity the DR scheme can activate. The impact on consumer surplusis a major social constraint, which the authorities should take into ac-count when trying to modify the rational equilibrium of their energysystems.
Proposition 5. If variation in consumer surplus, rather than social welfare,was used as the key criterion, more aggressive DR could be adopted, unlessthe system was cost-inefficient and captive demand is low.
Intuitively, if consumer’s demand is high, they could reduce it easier.Moreover, for costly generation technologies, their energy bills are high.Thus, consumers would modify their consumption (they decrease it) toreduce their payments. Choosing greater values of γn would be optimal,as we made the assumption of the positive correlation between thelevel of investment costs in smart appliances and demand reduction.With a consumer’s surplus analysis, losses of the generators’ side arenot considered, leading then to sustain the benefits of greater demandresponse.
Fig. 3. Optimal regions of DR for inefficient country.
Table 1Impact of DR programs on welfare with efficient or inefficient country.
Welfare improvement with DR No welfare improvementwith DR
Efficient country(n)
Low values of Kt,n or Dn
High values of costs or Pn,mHigh values of Pn,m, Kt,n or Dn
Low values of costsInefficientcountry (n)
High values of Pn,mHigh values of costs and lowvalues of Kt,m
High values of Kt,m or lowvalues of Kt,n
Low values of costs and Kt,m
203C. Clastres, H. Khalfallah / Energy Economics 52 (2015) 195–206
To show these results,we defineΩn as the variation in consumer sur-plus after deploying a DR scheme:
Ωn ¼ CSn;2−CSn;1 ð18Þ
CSn;1 ¼ ∫VollnP�n
ðDnÞdPn consumer surplus at equilibrium beforedeploying a DR scheme.
CSn;2 ¼ ∫cnP�nðDnðPnÞÞdPn consumer surplus at equilibrium afterdeploying a DR scheme.
Developing the above function,26 we obtain that Ωn ≥ 0, i.e. DR is ef-ficient from the consumers’ point of view, when the equilibrium quan-tity falls within the optimal area below:
Q �n≥Qn;min ¼
ffiffiffiffiffiffiffiffiffiffiffiffiffiffiffi2:CSn;1dn
sð19Þ
It would be possible to reduce consumptionwithout decreasing con-sumer surplus as far as Qn,min in Eq. (19) above. We can verify that DRintensity is positively correlated to the elasticity of the demand functionand negatively correlated to captive-demand prices. If we assume thatthe authorities mainly consider the impact in terms of consumer sur-plus, we can demonstrate that a higher reduction in consumptioncould be obtained if the following condition was met27:
ffiffiffiffiffiffiffiffiffiffiffiffiffiffiffi2:CSn;1dn
s≤2:SWn;1
cn−anð20Þ
In what follows, we shall look at the additional reduction in con-sumption which could be achieved subject to a consumer-surplus con-straint by focusing on two parameters: the system’s cost efficiency
26 Ωn ≥ 0 if Qn:ðcn−Pn2 Þ≥CSn;2. Given that Pn = cn − dn. Qn, then Qn;min ¼
ffiffiffiffiffiffiffiffiffiffiffi2:CSn;1
dn
q.
27 If Qn,min subject to consumer-surplus criteria is higher than Qn,min subject to social-welfare criteria.
and market size, respectively, bn and Dn:28 The results shown in Fig. 4
confirm our previous results regarding the impact of consumer surpluson variation in social welfare, via the price and the volume effects of theDR scheme. The figure yields two main conclusions. First, when themarket size of the system is high, i.e. high Dn , as shown in the right-hand part of Fig. 4, and regardless of the level of cost efficiency, a higherreduction in consumption could be reached if only the impact on con-sumer surplus is considered (zone B in the right-hand part of Fig. 4).This additional reduction in quantity could also be obtained if demandwas moderate, but the system must be highly inefficient in terms ofcost (zone B in the left-hand part of the figure). Indeed, if demand isvery high, the negative price effect of intensive DR on consumerswould be offset by the positive volume effect. On the other hand, forproducers, the positive price effect being insignificant (price variationis low due to the additional cost of DR), the negative price effectwould substantially reduce their own surplus. DR could consequentlynot be intensive. Likewise, if demand was not high enough, DR couldonly be intensive if the systemwas expensive. Inwhich case, consumersalready paying high bills would be more inclined to accept aggressivedemand reduction, the volume effect being higher than the price effect.
28 Detailed analysis of the impact of the interconnection-capacity price is disregardedhere. As before, if interconnection capacity is constrained, the optimal area is reducedwhen the system is efficient and otherwise increased. This holds when subject to bothsocial-welfare and consumer-surplus criteria.
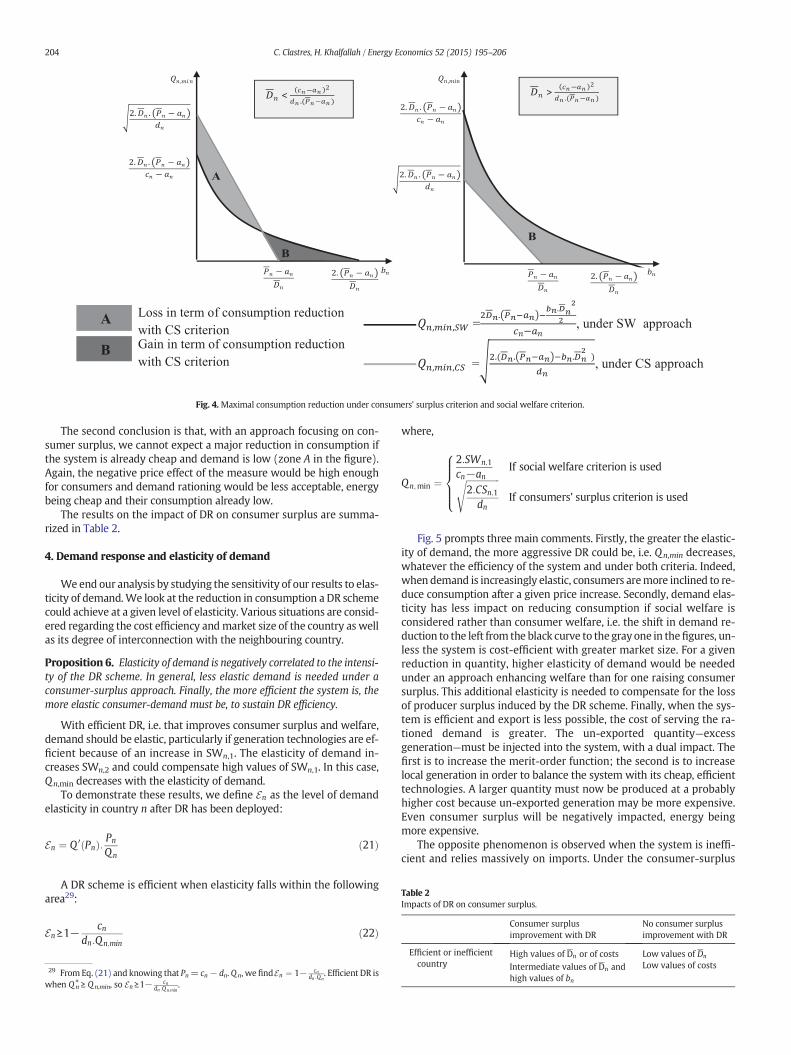
Table 2Impacts of DR on consumer surplus.
Consumer surplusimprovement with DR
No consumer surplusimprovement with DR
Efficient or inefficient High values of Dn or of costs Low values of Dn
Fig. 4. Maximal consumption reduction under consumers’ surplus criterion and social welfare criterion.
204 C. Clastres, H. Khalfallah / Energy Economics 52 (2015) 195–206
The second conclusion is that, with an approach focusing on con-sumer surplus, we cannot expect a major reduction in consumption ifthe system is already cheap and demand is low (zone A in the figure).Again, the negative price effect of the measure would be high enoughfor consumers and demand rationing would be less acceptable, energybeing cheap and their consumption already low.
The results on the impact of DR on consumer surplus are summa-rized in Table 2.
4. Demand response and elasticity of demand
Weend our analysis by studying the sensitivity of our results to elas-ticity of demand.We look at the reduction in consumption a DR schemecould achieve at a given level of elasticity. Various situations are consid-ered regarding the cost efficiency andmarket size of the country as wellas its degree of interconnection with the neighbouring country.
Proposition 6. Elasticity of demand is negatively correlated to the intensi-ty of the DR scheme. In general, less elastic demand is needed under aconsumer-surplus approach. Finally, the more efficient the system is, themore elastic consumer-demand must be, to sustain DR efficiency.
With efficient DR, i.e. that improves consumer surplus and welfare,demand should be elastic, particularly if generation technologies are ef-ficient because of an increase in SWn,1. The elasticity of demand in-creases SWn,2 and could compensate high values of SWn,1. In this case,Qn,min decreases with the elasticity of demand.
To demonstrate these results, we define En as the level of demandelasticity in country n after DR has been deployed:
En ¼ Q 0 Pnð Þ: Pn
Qnð21Þ
A DR scheme is efficient when elasticity falls within the followingarea29:
En≥1−cn
dn:Qn;minð22Þ
29 From Eq. (21) and knowing that Pn= cn− dn.Qn, wefindEn ¼ 1− cndn :Qn
. Efficient DR iswhen Qn
⁎ ≥ Qn,min, so En ≥1− cndn :Qn;min
.
where,
Qn;min ¼
2:SWn;1
cn−anIf social welfare criterion is usedffiffiffiffiffiffiffiffiffiffiffiffiffiffiffi
2:CSn;1dn
sIf consumers’ surplus criterion is used
8>>><>>>:
Fig. 5 prompts three main comments. Firstly, the greater the elastic-ity of demand, the more aggressive DR could be, i.e. Qn,min decreases,whatever the efficiency of the system and under both criteria. Indeed,when demand is increasingly elastic, consumers aremore inclined to re-duce consumption after a given price increase. Secondly, demand elas-ticity has less impact on reducing consumption if social welfare isconsidered rather than consumer welfare, i.e. the shift in demand re-duction to the left from the black curve to the gray one in thefigures, un-less the system is cost-efficient with greater market size. For a givenreduction in quantity, higher elasticity of demand would be neededunder an approach enhancing welfare than for one raising consumersurplus. This additional elasticity is needed to compensate for the lossof producer surplus induced by the DR scheme. Finally, when the sys-tem is efficient and export is less possible, the cost of serving the ra-tioned demand is greater. The un-exported quantity—excessgeneration—must be injected into the system, with a dual impact. Thefirst is to increase the merit-order function; the second is to increaselocal generation in order to balance the system with its cheap, efficienttechnologies. A larger quantity must now be produced at a probablyhigher cost because un-exported generation may be more expensive.Even consumer surplus will be negatively impacted, energy beingmore expensive.
The opposite phenomenon is observed when the system is ineffi-cient and relies massively on imports. Under the consumer-surplus
country Intermediate values of Dn andhigh values of bn
Low values of costs
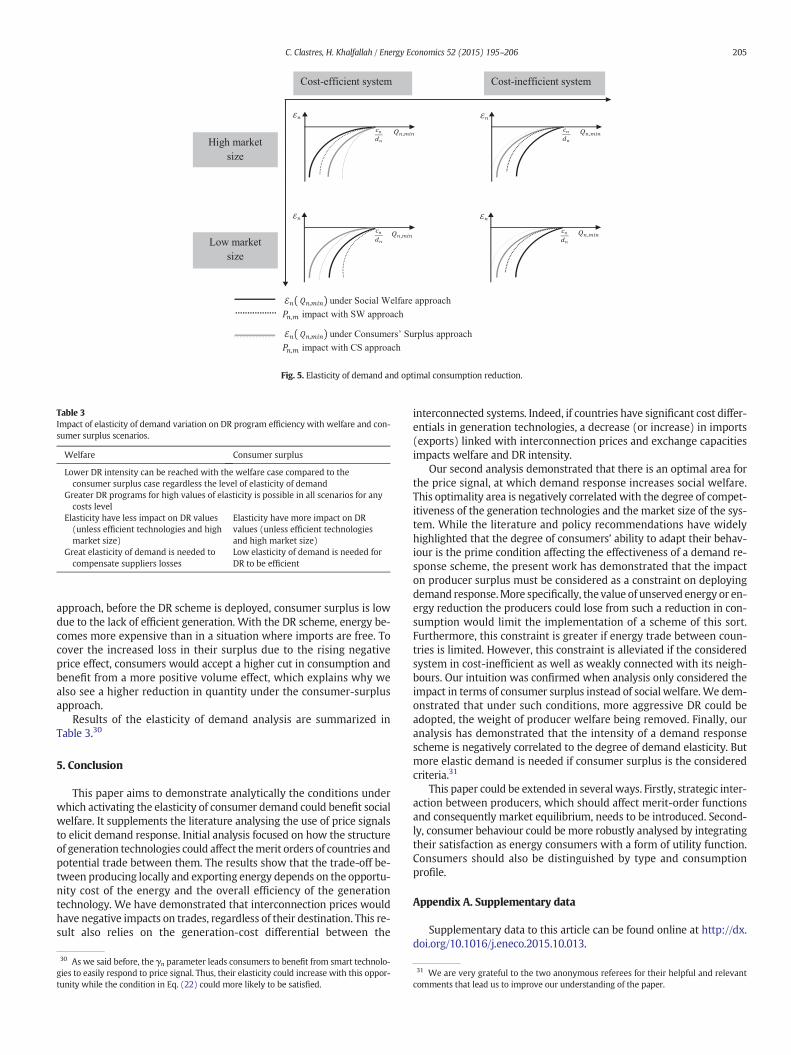
Table 3Impact of elasticity of demand variation on DR program efficiency with welfare and con-sumer surplus scenarios.
Welfare Consumer surplus
Lower DR intensity can be reached with the welfare case compared to theconsumer surplus case regardless the level of elasticity of demand
Greater DR programs for high values of elasticity is possible in all scenarios for anycosts level
Elasticity have less impact on DR values(unless efficient technologies and highmarket size)
Elasticity have more impact on DRvalues (unless efficient technologiesand high market size)
Great elasticity of demand is needed tocompensate suppliers losses
Low elasticity of demand is needed forDR to be efficient
Fig. 5. Elasticity of demand and optimal consumption reduction.
205C. Clastres, H. Khalfallah / Energy Economics 52 (2015) 195–206
approach, before the DR scheme is deployed, consumer surplus is lowdue to the lack of efficient generation. With the DR scheme, energy be-comes more expensive than in a situation where imports are free. Tocover the increased loss in their surplus due to the rising negativeprice effect, consumers would accept a higher cut in consumption andbenefit from a more positive volume effect, which explains why wealso see a higher reduction in quantity under the consumer-surplusapproach.
Results of the elasticity of demand analysis are summarized inTable 3.30
5. Conclusion
This paper aims to demonstrate analytically the conditions underwhich activating the elasticity of consumer demand could benefit socialwelfare. It supplements the literature analysing the use of price signalsto elicit demand response. Initial analysis focused on how the structureof generation technologies could affect themerit orders of countries andpotential trade between them. The results show that the trade-off be-tween producing locally and exporting energy depends on the opportu-nity cost of the energy and the overall efficiency of the generationtechnology. We have demonstrated that interconnection prices wouldhave negative impacts on trades, regardless of their destination. This re-sult also relies on the generation-cost differential between the
30 As we said before, the γn parameter leads consumers to benefit from smart technolo-gies to easily respond to price signal. Thus, their elasticity could increase with this oppor-tunity while the condition in Eq. (22) could more likely to be satisfied.
interconnected systems. Indeed, if countries have significant cost differ-entials in generation technologies, a decrease (or increase) in imports(exports) linked with interconnection prices and exchange capacitiesimpacts welfare and DR intensity.
Our second analysis demonstrated that there is an optimal area forthe price signal, at which demand response increases social welfare.This optimality area is negatively correlated with the degree of compet-itiveness of the generation technologies and the market size of the sys-tem. While the literature and policy recommendations have widelyhighlighted that the degree of consumers’ ability to adapt their behav-iour is the prime condition affecting the effectiveness of a demand re-sponse scheme, the present work has demonstrated that the impacton producer surplus must be considered as a constraint on deployingdemand response.More specifically, the value of unserved energy or en-ergy reduction the producers could lose from such a reduction in con-sumption would limit the implementation of a scheme of this sort.Furthermore, this constraint is greater if energy trade between coun-tries is limited. However, this constraint is alleviated if the consideredsystem in cost-inefficient as well as weakly connected with its neigh-bours. Our intuition was confirmed when analysis only considered theimpact in terms of consumer surplus instead of social welfare. We dem-onstrated that under such conditions, more aggressive DR could beadopted, the weight of producer welfare being removed. Finally, ouranalysis has demonstrated that the intensity of a demand responsescheme is negatively correlated to the degree of demand elasticity. Butmore elastic demand is needed if consumer surplus is the consideredcriteria.31
This paper could be extended in several ways. Firstly, strategic inter-action between producers, which should affect merit-order functionsand consequently market equilibrium, needs to be introduced. Second-ly, consumer behaviour could be more robustly analysed by integratingtheir satisfaction as energy consumers with a form of utility function.Consumers should also be distinguished by type and consumptionprofile.
Appendix A. Supplementary data
Supplementary data to this article can be found online at http://dx.doi.org/10.1016/j.eneco.2015.10.013.
31 We are very grateful to the two anonymous referees for their helpful and relevantcomments that lead us to improve our understanding of the paper.

206 C. Clastres, H. Khalfallah / Energy Economics 52 (2015) 195–206
References
Bergaentzlé, C., Clastres, C., Khalfallah, H., 2014. Demand-side management and Europeanenvironmental and energy goals: an optimal complementary approach. Energy Policy67, 858–869 (april).
Boisvert, R., Cappers, P., Neenan, B., Scott, B., 2004. Industrial and Commercial CustomerResponse to Real Time Electricity Prices. Neenan Associates.
Chao, H.-P., 2011. Demand response in wholesale electricity markets: the choice of cus-tomer baseline. J. Regul. Econ. 39 (1), 68–88.
Crampes, C., Léautier, T.O., 2015. Demand response in adjustment markets for electricity.J. Regul. Econ. 48 (2), 169–193.
De Jonghe, C., Delarue, E., Belmans, R., D’haeseleer, W., 2011. Determining optimal elec-tricity technology mix with high level of wind power penetration. Appl. Energy 88(6), 2231–2238 (June).
Di Cosmo, V., Lyons, S., Nolan, A., 2014. Estimating the impact of time-of-use pricing onIrish electricity demand. Energy J. 35 (2), 117–135.
Faruqui, A., Sergici, S., 2010. Household response to dynamic pricing of electricity: a sur-vey of 15 experiments. J. Regul. Econ. 38 (2), 193–225.
Faruqui, A., Hledik, R., Newell, S., Pfeifenberger, H., 2007. The power of 5 percent. Electr. J.20 (8), 68–77.
Faruqui, A., Hledik, R., Tsoukalis, J., 2009. The power of dynamic pricing. Electr. J. 22 (3),42–56 (April).
Faruqui, A., Harris, D., Hledik, R., 2011. Unlocking the €53 billion savings from smart me-ters in the EU: how increasing the adoption of dynamic tariffs could make or breakthe EU0s smart grid investment. Energy Policy 38 (10), 6222–6231.
Gangale, F., Mengolini, A., Oyeji, I., 2013. Consumer engagement: an insight from smartgrid projects in Europe. Energy Policy 60, 621–628 (september).
Greening, L.A., 2010. Demand response resources: who is responsible for implementationin a deregulated market? Energy 35 (4), 1518–1525 (April).
Horowitz, S., Lave, L., 2014. Equity in residential electricity pricing. Energy J. 35 (2), 1–23.Kema, 2012. Smart Grid Strategic Review: The Orkney Islands Active Network Manage-
ment Scheme. Prepared for SHEPD plc, 8th March 2012.Léautier, T.O., 2012. The Visible Hand: Ensuring Optimal Investment in Electric Power
Generation. TSE Working Paper, no. 10-153.Léautier, T.O., 2014. Is mandating smart meters smart? Energy J. 35 (4), 135–157.Lijesen, M.G., 2007. The real-time price elasticity of electricity. Energy Econon. 29 (2),
249–258.Muratori, M., Schuelke-Leech, B.-A., Rizzoni, G., 2014. Role of residential demand response
in modern electricity markets. Renew. Sustain. Energy Rev. 33, 546–553 (may).Orans, R., Woo, C.-K., Horii, B., Chait, M., DeBenedictis, A., 2010. Electricity pricing for con-
servation and load shifting. Electr. J. 23 (3), 7–14 (April).Park, C.-K., Kim, H.-J., Kim, Y.-S., 2014. A study factor enhancing smart grid consumer en-
gagement. Energy Policy 72, 211–218 (September).Patrick, R.H., Wolak, F.A., 2001. Estimating the Customer-Level Demand for Electricity
Under Real-Time Market Prices. NBER Working Paper N°8213 (April).Stoft, S., 2002. Power System Economics: Designing Markets for Electricity. IEEE Press,
Piscataway.Strbac, G., 2008. Demand side management: benefits and challenges. Energy Policy 36
(12), 4419–4426.Ventosa, N., Baillo, A., Ramos, A., Rivier, M., 2005. Electricity market modeling trends. En-
ergy Policy 33 (7), 897–913 (May).Vespucci, M.T., Innorta, M., Cervigni, G., 2013. A mixed integer linear programming model
of a zonal electricity market with a dominant producer. Energy Econ. 35, 35–41(January).
Woo, C.-K., 1990. Efficient electricity pricing with self-rationing. J. Regul. Econ. 2 (1),69–81.