an analytical assessment of nasa’s n+1 subsonic fixed … · an analytical assessment of nasa’s...
TRANSCRIPT

American Institute of Aeronautics and Astronautics
1 of 15
An Analytical Assessment of NASA’s N+1 Subsonic Fixed
Wing Project Noise Goal
Jeffrey J. Berton1 and Edmane Envia
2
NASA Glenn Research Center, Cleveland, Ohio 44135
and
Casey L. Burley3
NASA Langley Research Center, Hampton, Virginia 23681
The Subsonic Fixed Wing Project of NASA’s Fundamental Aeronautics Program has
adopted a noise reduction goal for new, subsonic, single-aisle, civil aircraft expected to
replace current 737 and A320 airplanes. These so-called “N+1” aircraft – designated in
NASA vernacular as such since they will follow the current, in-service, “N” airplanes – are
hoped to achieve certification noise goal levels of 32 cumulative EPNdB under current Stage
4 noise regulations. A notional, N+1, single-aisle, twinjet transport with ultrahigh bypass
ratio turbofan engines is analyzed in this study using NASA software and methods. Several
advanced noise-reduction technologies are analytically applied to the propulsion system and
airframe. Certification noise levels are predicted and compared with the NASA goal.
Nomenclature
AFE = altitude above field elevation
EPNL = effective perceived noise level
FAR = federal aviation regulations
ISA = international standard atmosphere
LSWT = NASA Glenn Research Center Low Speed Wind Tunnel
OASPL = overall sound pressure level metric
PNL = perceived noise level metric
PNLT = perceived noise level with tone weighting metric
SLS = sea level static
UHB = ultrahigh bypass
I. Introduction
ASA sets aggressive, strategic, civil aircraft noise reduction goals to improve the quality of life of millions of
people exposed to airport noise. NASA plays a critical role in reducing community noise exposure via
technology research and by providing an ambitious noise reduction roadmap for U.S. aerospace industry. Under
NASA’s Fundamental Aeronautics Program, the Subsonic Fixed Wing Project has adopted a community noise
reduction goal for new, subsonic, single-aisle, civil aircraft expected to replace current 737 and A320 airplanes.
These so-called “N+1” aircraft – designated in NASA vernacular as such since they will follow the current, in-
service, “N” airplanes – are hoped to achieve certification noise goal levels of 32 cumulative EPNdB under current
Stage 4 noise limits.1 NASA’s N+1 noise reduction goal is of national importance, having been accepted by the
Federal Aviation Administration for their Continuous Low Emissions, Energy, and Noise (CLEEN) initiative.
NASA has set N+1 goals for other aircraft system performance metrics as well. Relative to B737-800/CFM56-
7B performance levels, goals are set for block fuel burn and takeoff field length reductions of 33%. Additionally, a
1 Aerospace Engineer, Multidisciplinary Design, Analysis, and Optimization Branch, Mail Stop 5-11.
2 Associate Principal Investigator (Acoustics), Acoustics Branch, Mail Stop 54-3, AIAA Associate Fellow.
3 Senior Research Scientist, Aeroacoustics Branch, Mail Stop 461, member AIAA.
N
https://ntrs.nasa.gov/search.jsp?R=20090020454 2018-06-07T14:38:18+00:00Z

American Institute of Aeronautics and Astronautics
2 of 15
goal for oxides of nitrogen reduction is set to 60% below the landing and takeoff emission stringencies set in 2004
by the Committee on Aviation Environmental Protection (CAEP/6). Since these performance metrics are aggressive,
contrasting, and often conflicting, achieving goal levels for the noise, emissions, fuel burn, and field length metrics
simultaneously may not be possible. These goals therefore represent four distinct “corners” of the airplane design
trade space. A balanced, profitable, business-case airplane design may satisfy one or more of these goals, but is
unlikely to meet the goal of every metric at once. Even more challenging goals are set for future N+2 and N+3
aircraft.
The -32 cumulative EPNdB N+1 goal was set in 2005 based on an earlier, unpublished, internal NASA study
using the best methods and information available at the time. This paper documents a more rigorous investigation
conducted in 2008 for the Subsonic Fixed Wing Project using the latest technology data and higher-fidelity
analytical tools. It is an in-depth, self-consistent, systems analysis study of an engine and airplane system using
accepted NASA tools and methods. The intent of this study is to verify, document, and determine progress towards
the -32 EPNdB N+1 goal. This paper describes the analysis of a notional airplane located in the “low-noise corner”
of the design trade space. The airplane design showcases an inherently-quiet ultrahigh bypass ratio (UHB)
propulsion system combined with innovative, advanced, noise reduction technologies that perhaps would not be
used in a business-case design. This report is a more formal documentation of three presentations made at NASA
programmatic meetings in 2008.2, 3, 4
This assessment leverages results from a separate NASA system concept study conducted in 2008, in which
UHB turbofan engines were examined for a notional, N+1, single-aisle transport.5 The objective of the NASA UHB
engine concept study was to determine if the fuel consumption and noise benefits of engines having lower fan
pressure ratios (and correspondingly higher bypass ratios) translate into overall aircraft system-level benefits for a
737 class vehicle. This internal study provided independent guidance to NASA program management regarding the
new PurePower geared turbofans under development by Pratt & Whitney.6
In Ref. 5, the propulsion system design trade space was examined by designing a representative family of 48
N+1 UHB engines, analytically installing them on a common airframe model, and performing aircraft mission
performance and sizing analyses. The independent propulsion design parameters investigated were aerodynamic
design point fan pressure ratio, overall pressure ratio, fan drive architecture (i.e., direct- or gear-driven), bypass
nozzle architecture (i.e., fixed- or variable-geometry), booster compression work split, and cruise Mach number.
Engine and airframe technology projections commensurate with a 2015 entry-into-service date were assumed.
Aircraft performance characteristics, including properties of the NASA project goal metrics (fuel burn, emissions,
field length, and noise) were analytically computed for each vehicle and are reported in Ref. 5.
An interesting and important aspect of the aircraft-engine system not always considered in noise certification
predictions is the influence of airplane trajectory and engine throttling on noise. UHB turbofans have significantly
different thrust lapse characteristics than other turbofans having higher specific thrust, resulting in takeoff and
approach trajectories and throttle settings that must be modeled properly to correctly compute noise. Detailed
takeoff and approach trajectory calculations were made for each of the airplanes in Ref. 5. The same trajectory
modeling procedures are used to compute certification noise in this study.
One of the quietest propulsion systems investigated in Ref. 5 – a geared turbofan with an ultrahigh bypass ratio –
is selected for further, refined study and is the basis of this report. It is important to note that this UHB engine is not
the best performing propulsion system examined in Ref. 5. That is, of the 48 engine designs studied, it does not
result in an airplane having minimum block fuel or takeoff gross weight. Its low fan pressure ratio led to a relatively
high engine weight and a large nacelle diameter, resulting in propulsion-airframe integration penalties and poorer
overall mission performance. Instead, it is selected in this study because it represents the “low-noise corner” of the
design trade space, noting once again that meeting all of the NASA goals simultaneously may not be possible.
II. Method of Analysis
The low-noise propulsion system singled out from Ref. 5 for analysis of the noise goal is comparable in thrust
class to the CFM56-7B engines now in use on the 737. However, it is a more advanced, geared, UHB turbofan with
a lower design fan pressure ratio and lower fan tip speeds than the CFM56. The engine also has a higher overall
pressure ratio, better component performance levels, higher hot-section temperatures, lower exhaust velocities, and a
higher booster compression split than the CFM56. Once expected to enter service as early as 2015, it appears the
737 replacement aircraft will be delayed for several more years.7 Nonetheless, engine component and subsystem
performance, cooling levels, and material technologies appropriate for an approximate 2015 service entry date are
assumed. Key computed characteristics of the propulsion system at sea level static and standard day conditions are
shown in Table 1. The overall pressure ratio is aggressively high (42 at Mach 0.8/35,000 ft, and 32 at sea level static

American Institute of Aeronautics and Astronautics
3 of 15
Table 1. Key propulsion system
characteristics (SLS conditions,
maximum throttle, ISA+0).
Thrust 23000 lb
Airflow 1060 lb/s
Fan pressure ratio 1.30
Fan diameter 82 in
Fan tip speed 990 ft/s
Bypass ratio 16
Overall pressure ratio 32
conditions) for an engine of this thrust class and comparatively small core.
With the low-pressure fan spinning slowly at subsonic tip speeds (only 990
ft/s), a fan-drive gearbox is necessary to avoid low-pressure turbine design
complications. Such low-speed, low-pressure fans may have relatively large
diameters, presenting potential integration issues. Another consequence of
the fan’s low pressure ratio requires the engine cycle to have some means of
variable geometry in the bypass stream to maintain proper fan operability
and safety margins. A variable-area bypass nozzle is used to maintain a
constant surge margin throughout the operating envelope. The
thermodynamic engine cycle performance is analyzed using the Numerical
Propulsion System Simulator code (NPSS8, 9
). NPSS is a variable-fidelity,
object-oriented, engine cycle analysis tool developed jointly by NASA and
U.S. industry. It is currently the accepted, state-of-the-art software for
airbreathing engine cycle performance analysis for U.S. aerospace industry, academia, and NASA. A multiple
design point analysis is performed on the engine cycle in order to meet several performance requirements such as
airplane thrust demand at rolling takeoff and top-of-climb conditions, as well as to set flow rates, cycle
temperatures, pressures, spool speeds, and cooling levels. The bypass ratio is a fallout of the fan pressure ratio and
pressure levels in the bypass and core exhaust ducts at the cycle’s aerodynamic design point. Aeromechanical
design, flowpath, and engine weight analyses are performed with the Weight Analysis of Turbine Engines code
(WATE10
). WATE has been significantly upgraded since its initial introduction in the 1970s and is currently
implemented as a suite of NPSS interpretive analysis elements. At NASA, WATE is coupled with NPSS to provide
a complete modeling capability of turbofan engines. Additional details on the engine design may be found in Ref. 5.
The notional N+1 airplane is based on an analytical evolution of the currently-in-service Boeing 737-800 with
winglets. In Ref. 5, a reference 737 analytical model was developed based on publicly-available 737-800 geometry,
weight, and performance information; proprietary low-speed and clean-configuration aerodynamic data; and a
NASA NPSS representation of the CFM56-7B engine. The CFM56-7B was analytically modeled in NPSS using
data available from several public-domain sources, such as FAA type certification data sheets, manufacturer-
provided operating documents, technical reports, Jane’s Aero Engines, and manufacturer’s websites. No company-
proprietary data were used. The reference 737 carries 262 passengers in a single-aisle, two-class seating
arrangement. The aircraft synthesis was carried out using NASA’s Flight Optimization System (FLOPS11
) computer
program. Minor calibrations to the FLOPS-computed component weights and aerodynamics were performed to
match published operating empty weight and range capability of 3060 nm at a 32,400 lb payload. The FLOPS model
was set up to perform a basic wing-engine sizing analysis. Scaling the wing and engine sizes of the reference model
for minimum takeoff gross weight subject to active aircraft performance constraints led to results that were
consistent with the actual 737 aircraft. The 737 model was further developed to include detailed, low-speed takeoff
and landing assessments using FLOPS’s built-in, time-stepping trajectory analysis module. Compliance with the
airworthiness requirements described in Part 36 and 25 of the Federal Aviation Regulations (Refs. 1 and 12,
respectively) is observed. Takeoff and landing performance data13
for standard day, dry runway conditions were
used for validation of the FLOPS low-speed trajectory model. Takeoff and landing distances matched to within
approximately one percent of the reported values.
To evolve the reference 737 into the advanced N+1 vehicle
model, the design cruise Mach number is increased from 0.785 to
0.800, with an appropriate increase in wing sweep to reflect the
higher airspeed. The wing aspect ratio and taper ratio are
unchanged. The 262-passenger, mixed-class, single-aisle cabin
arrangement is maintained, but the design range at the 32,400 lb
payload point is increased from 3060 nm to 3250 nm. The
performance improvements in airspeed and range are considered
appropriate for a future vehicle in this class. Broad use of
composite structural materials is assumed relative to the all-metal
construction of the 737. Composite construction of primary
structures is assumed to result in a 15% reduction in the
component weights computed for the wing, fuselage, and
empennage. This is comparable to the structure of the new
Boeing 787, where as much as 50 percent of the primary structure
is made of composites.14
Additional technology improvements
Figure 1. Planform view of the N+1 airplane.

American Institute of Aeronautics and Astronautics
4 of 15
similar to those found on the 787 include an increase in hydraulic pressure to 5000 psi and a 1% reduction in drag
due to trailing edge variable camber and drag clean-up. A Vehicle Sketch Pad15
planform schematic of the N+1
vehicle (without engines) is shown to scale in Fig. 1.
Propulsion-airframe integration effects are important to address properly for large-diameter UHB engine
nacelles. Low-speed, low-pressure fans – such as the 82-inch diameter fan considered here – present unique
propulsion-airframe integration challenges. Nacelle drag, ground clearance, windmilling drag, vertical tail sizing,
thrust reverser operation, engine placement, and gear length and weight issues are considered. The methods used to
capture these effects are described in greater detail in Ref. 5. Like the reference 737 model, the N+1 vehicle model is
parametrically sized for minimum takeoff gross weight, and detailed takeoff and landing trajectories are computed.
The noise analysis approach, methods, assumptions, and tools used in this study have been examined by
acoustics experts at NASA Glenn, NASA Langley, U.S. industry, and academia as part of a comprehensive, multi-
fidelity, NASA acoustic tool benchmarking activity.16
Efforts to benchmark the accuracy of NASA’s aircraft-
system-level noise prediction code for airport community noise are also leveraged.17
This computer code – the
Aircraft Noise Prediction Program (ANOPP, Release Level 26)18, 19
– is a systems-level code used in this study to
compute certification noise for the N+1 vehicle. The certification noise predictions of the reference 737 described in
Ref. 17 serve as a validation of the methods and tools used in this N+1 vehicle study.
Freefield, lossless, 1/3rd
octave band frequency component source noise levels are computed using predictive
modules within ANOPP. The UHB engine’s thermodynamic, aeromechanical, and geometry data are used as inputs
to ANOPP’s propulsion source noise prediction methods. At NASA, the NPSS and WATE airbreathing component
element libraries have functions, viewers, and case files coded in interpretive language to produce engine data to be
used as ANOPP input parameters. These so-called “engine state tables” are the preferred method to transfer engine
state data to ANOPP’s source noise prediction modules. Engine state data – consisting of pressure, temperature,
flow area, spool speed, and fuel and air flow rates – are computed by NPSS for a range of airspeeds, altitudes, and
throttle settings at standard acoustic day (ISA+18°F) conditions. As the airplane traverses its flight path, engine data
at the appropriate airspeed, altitude, atmospheric conditions, and throttle setting are interpolated from the state tables
and are delivered to the source noise prediction modules.
The UHB engine’s jet noise sources are predicted using the Stone method.20
This method – implemented in
ANOPP’s “ST2JET” module – is perhaps the best semi-empirical jet noise prediction method developed to date. It
uses an innovative, physics-based, Bayesian regression of jet acoustic data that seamlessly spans various nozzle flow
and geometry regimes. It is calibrated against jet acoustic data collected from several types of axisymmetric nozzle
designs, such as single-flow and coannular nozzles, plug and plugless nozzles, and convergent and convergent-
divergent nozzles. The method is considered in the acoustic tool benchmarking activity described above to be
accurate.21
Coannular nozzles with bypass ratios of up to 15 are part of Stone’s calibration, and is therefore
considered quite applicable to UHB engines. The method accepts nozzle flow characteristics as input parameters
from the engine state tables described above. The Stone method also captures the noise-reduction effects of nozzle
perimeter-mixing devices, such as chevrons. This feature of the method is based on 1997 acoustic measurements of
chevron-equipped nozzles from NASA Glenn’s Aeroacoustic Propulsion Laboratory’s Nozzle Acoustic Test Rig
freejet facility.22
The Stone perimeter-mixing method predicts reductions in large- and intermediate-scale jet mixing
noise and an increase in small-scale (high frequency) jet mixing noise near the nozzle exit plane. Some inaccuracies
of the Stone perimeter-mixing method for certain nozzle
designs to which the method was not calibrated are noted in
Ref. 21. However, since the N+1 UHB nozzle is coannular
with an external plug, and is much the same as the chevron
nozzles used in Stone’s regression calibration (i.e., the “3IB”
and “3IC” coannular nozzle configurations of Ref. 22), the
method is considered accurate for use here. Chevrons are
assumed present for the UHB engine’s central core nozzle.
However, chevrons are not applied to the bypass nozzle due to
potential conflict with the actuation system needed for the
variable-area bypass nozzle design. The N+1 UHB nozzle is
proposed to be similar in architecture to the 3IB nozzle test
configuration (with a nominal bypass ratio of 5) shown in Fig.
2, but with a much higher bypass ratio. The 3IB nozzle has 12
in-flip core chevrons and – unlike the 3IC nozzle – no outer
bypass chevrons.
Figure 2. 3IB chevron coannular nozzle model.

American Institute of Aeronautics and Astronautics
5 of 15
The UHB engine fan noise source is modeled using
experimental acoustic data collected from a scale-model
fan test article in NASA Glenn’s 9 ft by 15 ft Low Speed
Wind Tunnel (LSWT).23
The fan tested is a 22-inch
diameter model of Pratt & Whitney’s Advanced Ducted
Propulsor, shown in Fig. 3. Ordinarily in an aircraft
system noise prediction problem, fan source noise would
be computed using one of ANOPP’s built-in methods.
Indeed, in the study upon which our engine is based
(Ref. 5), fan noise was modeled using ANOPP’s internal
General Electric empirical method,24
which is
considered to be generally accurate.25
Using a built-in
method is convenient in an aircraft systems study, since
system effects such as fan operation, speed, scale, and
convective amplification effects that vary with fan
design, engine throttle position, and flight condition are
properly accounted for by the model without need for
user intervention. A built-in method is particularly
helpful when performing a design space exploration of
an engine architecture such as in Ref. 5, where fan design parameters such as pressure ratio are parametrically
varied. However, while the method described in Ref. 24 may be appropriate to predict noise during a design space
exploration of many fans, greater accuracy may be obtained if the fan to be analyzed is very similar to a fan already
tested in an aeroacoustic facility. Moreover, the Advanced Ducted Propulsor “Fan 1” tested in the LSWT is
representative of modern, contoured, wide-chord fans for high-bypass engines, whereas the built-in ANOPP
methods are calibrated to older, narrow-chord, straight-bladed fans. Fan 1 is an 18-blade, high bypass, scale-model
fan with a low design pressure ratio of 1.29. This stage pressure ratio compares well with the 1.30 pressure ratio of
our N+1 UHB fan at similar conditions, and the blade count is also identical. Although the fan loadings are different
(the UHB fan of Ref. 5 and the scale model Fan 1 SLS corrected tip speeds are 990 ft/s and 840 ft/s, respectively),
spool speed in thermodynamic cycle analysis is only an artifice when scaled component performance maps are used.
To use the noise measured from the Fan 1 test article, the tacit assumption is that the N+1 UHB fan is operating at
the lower, 840 ft/s, corrected takeoff tip speed. There are, of course, aeromechanical, flowpath, and weight
implications that cannot be so easily ignored, but the engine cycle performance is unchanged.
The measured noise levels of Fan 1 were collected and reduced to lossless, freefield, 1/3rd
octave band spectra by
methods described in Ref. 23. These spectra must be modified further before they may be used in an aircraft system
noise problem. First, an atmosphere-dependent source strength correction is applied to bring the levels from facility
conditions to standard atmospheric pressure and temperature. Sources other than pure fan noise (such as low-
frequency airflow scrubbing and facility noise sources, and high-frequency measurement anomalies) are subtracted
from every spectrum. The levels are adjusted from model-scale, 22-inch fan diameter to full-scale, 82-inch diameter
by applying amplitude and frequency shifts. Finally, convective amplification Doppler effects are added as the
spectra are analytically “flown” at variable airspeed, ranging from static to Mach 0.4. The end result is a table of fan
noise levels, with discrete independent parameters consisting of 51 emission polar (yaw) angles, 8 shaft speeds, and
5 flight Mach numbers. The source is assumed to be symmetric in emission azimuthal (roll) angle. The spectra are
tabulated for interpolation and fed into the aircraft system noise simulation via ANOPP’s Acoustic Data Module; a
feature that allows users to create their own noise sources to be used instead of using ANOPP’s internal source noise
prediction methods.
Figure 3. Scale model Advanced Ducted Propulsor
“Fan 1” test article installed in the NASA LSWT.

American Institute of Aeronautics and Astronautics
6 of 15
The acoustic data collected from Fan 1
are hardwall; i.e., no acoustic treatment is
present. Conventional inlet, interstage, and
aft fan duct liners are applied to reduce fan
inlet and discharge noise. The benefits of
these liners are modeled by applying an
acoustic suppression performance “map” of
1/3rd
octave band sound pressure level
decrements to the hardwall fan source
spectra. This approach differs from the 737-
800/CFM56-7B validation study described
in Ref. 17 – where ANOPP’s built-in
treatment suppression prediction module
was used26
– since a more aggressive
treatment configuration would likely be
used in an advanced UHB engine. The liner
suppression map is based on measured wind
tunnel data from the 22-inch diameter Fan 1
rig in NASA’s LSWT.27
The most effective
treatment tested proved to be double degree
of freedom liners applied to the inlet,
interstage, and aft bypass duct areas. These
liners are tuned to attack the discrete
interaction tone’s second harmonic at
maximum takeoff-rated power. An initial
treatment suppression map is generated
based on the measured differences between
the treated and hardwall measurements.
This simple map is scaled from the 22-inch
model dimensions to 82-inch diameter full
scale using standard regulation frequencies.
The data are smoothed with a regression
technique to fit a modified Weibull
probability density function as shown in
Fig. 4. A Weibull-shaped curve is chosen
since liner effectiveness is small at low
frequencies and increases to a maximum near its tuned frequency. Low-frequency liner self noise – caused by air
flow and surface roughness, and can be seen in the Fig. 4 – is small and is ignored by this regression. The logarithm
of the ratio of inlet diameter to wavelength is an appropriate regression choice for the independent parameter. The
complete treatment suppression map is shown in Fig. 5. Maximum effectiveness is approximately 12 dB at an
emission polar (yaw) angle of 99 degrees from the inlet.
Further adjustments representing fan noise reduction technologies are made to the hardwall fan source noise
spectra prior to propagation. In addition to conventional fan liners, two advanced technologies are applied: soft vane
stators28
and over-the-rotor foam metal treatment.29
Both of these technologies are applications of acoustic treatment
in areas of the engine which currently do not have treatment: on the surface of the fan vanes and above the fan rotor
tips. Soft vane stators have small Helmholtz resonator chambers inside the airfoils and are covered by a porous
surface material. This single-degree-of-freedom treatment reduces the unsteady, noise-generating, pressure
fluctuations like other turbofan treatment panels, but acts directly on the vanes. Over-the-rotor foam metal is a bulk
sound-absorbing material situated over the fan rotor where, normally, conventional fan rub strips are located. The
metal foam is integrated with the fan casing containment structure and provides a greater effective treatment area.
An illustration of these two technologies is shown in Fig. 6.
-14
-12
-10
-8
-6
-4
-2
0
2
0.0 0.5 1.0 1.5 2.0 2.5
Logarithm of Inlet Diameter to Sound Wavelength Ratio
Tre
atm
ent
Suppre
ssio
n,
dB
Suppression Data
Regression Fit
Figure 4. Sample regression fit of acoustic liner performance
(emission yaw angle 95° from inlet).
Treatment
Suppression,
dB
50
150
100
0
-5
-10
Emission Polar (Yaw)
Angle, deg
0
1
2
Log of Inlet
Diameter to
Wavelength
Ratio
Figure 5. Overall acoustic liner suppression performance map.

American Institute of Aeronautics and Astronautics
7 of 15
Figure 6. Advanced fan noise reduction technologies: over-the-rotor foam metal bulk treatment (left) and soft
vane stators (right).
These technologies are anticipated to have matured enough for incorporation in the UHB engine assumed in this
study. These technologies are also assumed to be relatively lightweight, inexpensive, low-maintenance, and free of
aerodynamic performance penalties such that an engine manufacturer would be willing to make use of them on their
product. The treatment in these locations attenuates both fan broadband and interaction tone noise and are
anticipated to work together without conflict to produce additive fan noise reduction benefits. Acoustic tests of both
of these technologies were conducted at NASA Glenn in 2008. Based on these tests, a system-level decrement of -4
dB is applied to the freefield hardwall fan source noise levels. This adjustment is applied as a simple constant to the
fan sound pressure levels – already reduced by the conventional liners – across all 1/3rd
octave band frequencies,
directions, and throttle settings.
The remaining propulsion noise sources considered are combustion, turbine, and compressor noise; often
collectively known as core noise. Historically in noise certification, core noise tends to be significant only at the
approach certification point. Core noise is revealed at low, approach throttle settings when fan and jet noise are
reduced due to lower fan tip speeds and lower nozzle exhaust velocities. A fundamental turbine discrete interaction
tone may also fall under 10 kHz at approach throttle and may become problematic. In advanced UHB engines,
however, core noise may become significant at higher throttle settings as well, since jet and fan noise are lower due
to increased bypass ratio, low fan tip speeds, and modern, more effective noise reduction technologies. Accurate
core noise modeling for UHB engines is essential. Core noise is predicted using ANOPP’s built-in procedure (the
“GECOR” module) developed by Emmerling30
and later modified by Ho.31
Preliminary results from NASA’s
current acoustic tool benchmarking study (Ref. 16) indicate that the ANOPP method agrees well with static core
noise separated from the overall acoustic signature of the Honeywell TECH977 business-jet-class research engine.32
General Electric also evaluated the ANOPP core noise method favorably in 1996 based on static acoustic test
comparisons to CF6-80C2, QCSEE, and E3 engines, as well as comparisons with their own proprietary method
(Ref. 24). Like the Stone jet noise method, data are fed into ANOPP’s core noise module via engine state table data.
Key input parameters are maximum cycle pressure, temperature, and flow rate. A shortcoming of the ANOPP core
noise method is that the maximum overall pressure ratio allowed is 30. This is not unexpected since the method
dates to the 1970s and was calibrated against engines then having much lower overall pressure ratios. The N+1 UHB
engine produces a SLS pressure ratio of 32 (already over the ANOPP limit; see Table 1), and increases to
approximately 34 at an airspeed of 180 ktas; roughly corresponding to the flight condition just before the throttle

American Institute of Aeronautics and Astronautics
8 of 15
cutback beyond the lateral certification observer. The core noise therefore may be under predicted by an unknown
amount. No core noise reduction technologies are assumed.
Like engine core noise, airframe noise sources ordinarily tend to be significant only during approach, when
engine throttle settings are reduced. With advanced, quiet, UHB engines, however, airframe noise sources may be
expected to be more prominent at approach, and at higher throttle settings as well, since they may become audible
over the already-low fan and jet noise sources. In addition, for practical reasons and safety considerations, air traffic
on approach tends to fly over significant distances at comparatively low altitude. This is in sharp contrast to
departure trajectories, where the pilot’s intent is to gain altitude rather quickly. Remarkably, despite having much
louder noise signatures on departure than on approach, this behavior results in noise “footprints” that have roughly
equivalent enclosed areas on approach and departure. These considerations point to the need for aggressive airframe
noise reduction technologies for UHB-equipped aircraft. Freefield, lossless, 1/3rd
octave band spectra for flap, slat,
landing gear, and trailing edge airframe noise sources are predicted using a method developed in 1977 by M.R. Fink
of the United Technologies Research Center for the FAA.33
The Fink method – programmed into ANOPP’s
“FNKAFM” module – accepts gross airframe dimensions such as span, flap chord lengths, and gear configuration
and dimensions; all of which may be obtained from a simple, open-literature, three-view aircraft drawing. Scrutiny
of portions of the Fink method to date has not yet revealed any fundamental issues.34
The airframe noise reduction technologies applied to the N+1 airframe are aggressive and substantial – fair
game, since this study assesses the “low-noise corner” of the aircraft design trade space. These technologies are
currently considered somewhat immature, but with aggressive funding and development, they could become
available in time for the N+1 vehicle’s entry into service. The high-lift flap arrangement on the N+1 aircraft is
assumed to consist of retractable, inboard- and outboard-segmented, slotted flaps. Unlike conventional trailing edge
flaps, however, the N+1 flaps are assumed to be equipped with continuous moldline links. These links abate the
aerodynamic noise generated by airflow around the discontinuous flap side edge by extending and continuously
fairing a flexible moldline into the wing trailing edge. A
flow analysis35
illustrating the mechanism and the effect
on flap side-edge streamlines is shown in Fig. 7. The
ordinarily strong vortex system is diffused by the
moldline, thus reducing noise. The noise benefit of
continuous moldline links is modeled by subtracting 8
dB from the conventional flap noise computed by the
Fink method. Until this technology matures and its
impact is better understood, the benefit is assumed
constant across all 1/3rd
octave band frequencies,
directions, and airspeeds.
Another source of aerodynamic noise radiates from
the extended leading edge slat cove. Slat noise results
from complex flow patterns in the slat cove region. If
these turbulent, circulating, vortex-shedding flow
patterns are largely prevented from developing, while
still maintaining uniform flow through a slat slot,
substantial noise reduction benefits may be achieved. An
example of a flexible material filling the cove of a bench
top slat model is shown in Fig. 8. The noise benefit of
slat cove filler is modeled by subtracting 10 dB from the
conventional slat noise computed by the Fink method;
constant across frequency, direction, and airspeed.
The main gear and nose gear are assumed to have
spoilers for flow deflection and fairings to improve the
aerodynamic shape while still allowing easy access for
maintenance and inspection. In addition, trailing edge
treatment methods are assumed, such as serrated edges or
brushes, to reduce trailing edge noise. A graph of the
assumed benefits of these and the other airframe noise
reduction technologies are shown in Fig. 9.
Figure 8. Example of a pneumatic slat cove filler
technology concept (bench top model).
Figure 7. Flow analysis for continuous moldline link,
showing surface pressure and side-edge streamlines.

American Institute of Aeronautics and Astronautics
9 of 15
-12
-10
-8
-6
-4
-2
0
2
0.1 1 101/3 Octave Band Center Frequency, kHz
Technolo
gy S
uppre
ssio
n,
dB Trailing edge treatments
Main gear spoiler, fairing
Nose gear spoiler, fairing
Continuous moldline links
Slat cove filler
Figure 9. Airframe noise reduction technology benefits.
Using an assumption of acoustic superposition,
the freefield, lossless spectra for all of the noise
sources described above are analytically summed
in the vicinity of the aircraft. Real noise sources
are, of course, complex, distributed signals that are
affected by other acoustic sources, aircraft external
surfaces, and the environment. No provisions are
made to adjust the component spectra for acoustic
near-field phenomena such as source interactions,
reflections, refraction, diffraction, or other effects.
The summed spectra are propagated to the
three certification observers on the ground in
accordance to the specifications for certification
measurements. Noise propagation effects
accounted for include spherical spreading, Doppler
shift and convective amplification, atmospheric
attenuation, ground reflections based on data for
grass-covered ground, and extra ground attenuation. More complex propagation phenomena such as scattering,
weather effects, and terrain are unaccounted for. The airplane trajectory, computed as described earlier, is fed into
the ANOPP simulation. Vector geometry analyses for the airplane relative to the three certification microphone
measurement locations – shown in Fig. 10 – are performed within ANOPP as functions of source time. Note that in
the interest of international rulemaking terminology harmonization, the former “sideline” certification location term
has been deprecated in favor of “lateral,” as has “takeoff” to “flyover.” In any event, the propagated acoustic spectra
are predicted at half-second intervals at each of the three certification locations. From these spectra, ANOPP
computes OASPL, PNL, PNLT, and other noise metrics of interest as functions of observer time. The EPNL
certification noise metric is computed from the PNLT-time noise history at each observer as prescribed in Ref. 1.
Figure 10. Noise certification observer arrangement relative to hypothetical combined takeoff and landing
aircraft trajectories.
III. Results and Discussion
As noted, the UHB engine selected from those studied in Ref. 5 for refined study here represents the “low-noise
corner” of the airplane design trade space. As such, it has a very low design fan pressure ratio, exhaust velocities,
and it has quite different specific thrust characteristics than the turbofans used on present-day, next-generation 737s.
The CFM56-7B series turbofan, used on the next-generation 737-600, -700, -800, and -900 models, has a runway
ground roll net thrust lapse (i.e., from zero to 170 ktas at sea level) of about only 20%. The UHB engine analyzed
here has a runway thrust lapse of nearly 30%. Note that not all UHB engines would lapse this much in thrust; it may
2000 m (6562 ft)
Flyover (with cutback) reference
Lateral reference
Approach reference
6500 m (21 325 ft)
450 m (1476 ft)

American Institute of Aeronautics and Astronautics
10 of 15
0.0
0.5
1.0
1.5
2.0
2.5
-15 -10 -5 0 5 10 15 20 25 30
Distance from Brake Release, 1000 ft
Altitu
de
, 1
00
0 ft A
FE
0.0
0.5
1.0
1.5
2.0
2.5
-15 -10 -5 0 5 10 15 20 25 30
Distance from Brake Release, 1000 ft
Altitu
de
, 1
00
0 ft A
FE
B737-800/CFM56-7B26
N+1 Airplane
0.0
0.5
1.0
1.5
2.0
2.5
-15 -10 -5 0 5 10 15 20 25 30
Distance from Brake Release, 1000 ft
Altitu
de
, 1
00
0 ft A
FE
0.0
0.5
1.0
1.5
2.0
2.5
-15 -10 -5 0 5 10 15 20 25 30
Distance from Brake Release, 1000 ft
Altitu
de
, 1
00
0 ft A
FE
B737-800/CFM56-7B26
N+1 Airplane
Figure 11. 737 and N+1 trajectory comparison;
altitude.
0
50
100
150
200
250
-15 -10 -5 0 5 10 15 20 25 30
Distance from Brake Release, 1000 ftT
rue
Air
sp
ee
d, kta
s
0.0
0.5
1.0
1.5
2.0
2.5
-15 -10 -5 0 5 10 15 20 25 30
Distance from Brake Release, 1000 ft
Altitu
de
, 1
00
0 ft A
FE
B737-800/CFM56-7B26
N+1 Airplane
0
50
100
150
200
250
-15 -10 -5 0 5 10 15 20 25 30
Distance from Brake Release, 1000 ftT
rue
Air
sp
ee
d, kta
s
0.0
0.5
1.0
1.5
2.0
2.5
-15 -10 -5 0 5 10 15 20 25 30
Distance from Brake Release, 1000 ft
Altitu
de
, 1
00
0 ft A
FE
B737-800/CFM56-7B26
N+1 Airplane
Figure 12. 737 and N+1 trajectory comparison;
airspeed.
0.0
0.2
0.4
0.6
0.8
1.0
1.2
-15 -10 -5 0 5 10 15 20 25 30
Distance from Brake Release, 1000 ft
Th
rust / M
axim
um
Th
rust
0.0
0.5
1.0
1.5
2.0
2.5
-15 -10 -5 0 5 10 15 20 25 30
Distance from Brake Release, 1000 ft
Altitu
de
, 1
00
0 ft A
FE
B737-800/CFM56-7B26
N+1 Airplane0.0
0.2
0.4
0.6
0.8
1.0
1.2
-15 -10 -5 0 5 10 15 20 25 30
Distance from Brake Release, 1000 ft
Th
rust / M
axim
um
Th
rust
0.0
0.5
1.0
1.5
2.0
2.5
-15 -10 -5 0 5 10 15 20 25 30
Distance from Brake Release, 1000 ft
Altitu
de
, 1
00
0 ft A
FE
B737-800/CFM56-7B26
N+1 Airplane
Figure 13. 737 and N+1 trajectory comparison;
throttle setting.
be that a UHB engine design enabling a better business-case airplane design might not lapse much more than the
CFM56-7B. However, our low-noise UHB engine behaves significantly different, resulting in takeoff and approach
trajectories and throttle settings that must be modeled properly to correctly compute certification noise. This is in
contrast to many other certification noise estimates in the conceptual phase of aircraft design, where fixed
trajectories and throttle settings are often assumed based on previously-collected data from other representative
aircraft. Trajectory data computed for the N+1 airplane and the 737-800 for altitude, airspeed, and throttle setting are
shown in Fig. 11, Fig. 12, and Fig. 13, respectively. The trajectories shown are presented as “analytical touch-and-
go” operations with both takeoff and landing data shown
simultaneously. For presentation purposes, the
touchdown point on landing is coincident with the point
of brake release on takeoff. Calculations are made for a
sea level runway at standard acoustic day (ISA+18°F)
conditions. The airframe noise reduction technologies
noted above are assumed to have no impact on the low-
speed aerodynamic performance of the airplane. The
triangular markers on each plot denote the noise
certification measurement locations.
The approach microphone markers are shown in the
figures at 6562 ft (2000 m) behind the runway threshold
(i.e., behind the location of the 50 ft landing obstacle),
and 7518 ft from the touchdown point on the runway
centerline. Note that in Fig. 13, the UHB engine throttle
setting must be set higher than the CFM56-7B (in
percent thrust) in order to maintain a 3-degree approach
glide slope.
The lateral microphone markers are shown in the figures at 14,000 ft from brake release, on a lateral sideline
displacement distance of 1476 ft (450 m) from the runway centerline. The 14,000 ft location corresponds to the
distance from brake release where the airplane has reached 984 ft (300 m) AFE, as permitted – when approved – by
regulation B36.3.a.1 (Ref. 1). A check of other lateral locations less than and greater than 14,000 ft from brake
release confirms that peak lateral EPNL does in fact occur approximately at the 14,000 ft location. Note that in Fig.
12, the airspeed of the N+1 airplane is 12 ktas slower than the 737 at that point, leading to a longer dwell time for
the N+1 airplane and causing the duration component of the lateral EPNL to increase somewhat.
The flyover microphone markers are shown in the figures at 21,325 ft (6500 m) from brake release on the
runway centerline. A noise abatement throttle cutback is used. The engine climb thrust at this point is reduced to the
minimum level permitted by regulation (i.e., Ref. 1 requires a minimum climb gradient of four percent with both
engines operating, or level flight with one engine inoperative.). The throttle cutback takes place between 16,000 ft
and 17,000 ft from brake release. Note the power cutback takes place at approximately 1200 ft AFE. This is above
the minimum altitude permitted (i.e., 984 ft, or 300 m AFE for a twinjet), in an attempt to gain additional altitude

American Institute of Aeronautics and Astronautics
11 of 15
70
72
74
76
78
80
82
84
86
60 65 70 75 80 85
Observer Time, s
La
tera
l P
NL
T, P
Nd
B
66
68
70
72
74
76
78
60 65 70 75 80 85
Observer Time, s
La
tera
l O
AS
PL
, d
B
65
70
75
80
85
90
95
100
-45 -35 -25
Observer Time, s
Ap
pro
ach
PN
LT
, P
Nd
B
Fan
Jet
CoreTotal Airframe
Total
10 PNdB
Fan
Jet
Core
All Airframe
Total
10 PNdB
65
70
75
80
85
90
95
100
-45 -35 -25
Observer Time, s
Ap
pro
ach
PN
LT
, P
Nd
B
Fan
Jet
CoreTotal Airframe
Total
10 PNdB
Fan
Jet
Core
All Airframe
Total
10 PNdB
65
70
75
80
85
90
95
100
-45 -35 -25
Observer Time, s
Ap
pro
ach
PN
LT
, P
Nd
B
Fan
Jet
CoreTotal Airframe
Total
10 PNdB
Fan
Jet
Core
All Airframe
Total
65
70
75
80
85
90
95
100
-45 -35 -25
Observer Time, s
Ap
pro
ach
PN
LT
, P
Nd
B
Fan
Jet
CoreTotal Airframe
Total
10 PNdB
Fan
Jet
Core
All Airframe
Total
Figure 15. Lateral observer OASPL noise-time histories (left), and PNLT noise-time histories (right).
76
78
80
82
84
86
88
90
92
94
-45 -40 -35 -30 -25
Observer Time, s
Ap
pro
ach
PN
LT
, P
Nd
B
64
6668
70
7274
76
78
8082
84
-45 -40 -35 -30 -25
Observer Time, s
Ap
pro
ach
OA
SP
L,d
B
65
70
75
80
85
90
95
100
-45 -35 -25
Observer Time, s
Ap
pro
ach
PN
LT
, P
Nd
B
Fan
Jet
CoreTotal Airframe
Total
10 PNdB
Fan
Jet
Core
All Airframe
Total
10 PNdB
65
70
75
80
85
90
95
100
-45 -35 -25
Observer Time, s
Ap
pro
ach
PN
LT
, P
Nd
B
Fan
Jet
CoreTotal Airframe
Total
10 PNdB
Fan
Jet
Core
All Airframe
Total
10 PNdB
65
70
75
80
85
90
95
100
-45 -35 -25
Observer Time, s
Ap
pro
ach
PN
LT
, P
Nd
B
Fan
Jet
CoreTotal Airframe
Total
10 PNdB
Fan
Jet
Core
All Airframe
Total
65
70
75
80
85
90
95
100
-45 -35 -25
Observer Time, s
Ap
pro
ach
PN
LT
, P
Nd
B
Fan
Jet
CoreTotal Airframe
Total
10 PNdB
Fan
Jet
Core
All Airframe
Total
Figure 14. Approach observer OASPL noise-time histories (left), and PNLT noise-time histories (right).
72
74
76
78
80
82
84
86
88
85 90 95 100 105 110
Observer Time, s
Fly
ove
r P
NL
T, P
Nd
B
66
68
70
72
74
76
78
80
85 90 95 100 105 110
Observer Time, s
Fly
ove
r O
AS
PL
, d
B
65
70
75
80
85
90
95
100
-45 -35 -25
Observer Time, s
Ap
pro
ach
PN
LT
, P
Nd
B
Fan
Jet
CoreTotal Airframe
Total
10 PNdB
Fan
Jet
Core
All Airframe
Total
10 PNdB
65
70
75
80
85
90
95
100
-45 -35 -25
Observer Time, s
Ap
pro
ach
PN
LT
, P
Nd
B
Fan
Jet
CoreTotal Airframe
Total
10 PNdB
Fan
Jet
Core
All Airframe
Total
10 PNdB
65
70
75
80
85
90
95
100
-45 -35 -25
Observer Time, s
Ap
pro
ach
PN
LT
, P
Nd
B
Fan
Jet
CoreTotal Airframe
Total
10 PNdB
Fan
Jet
Core
All Airframe
Total
65
70
75
80
85
90
95
100
-45 -35 -25
Observer Time, s
Ap
pro
ach
PN
LT
, P
Nd
B
Fan
Jet
CoreTotal Airframe
Total
10 PNdB
Fan
Jet
Core
All Airframe
Total
Figure 16. Flyover observer OASPL noise-time histories (left), and PNLT noise-time histories (right).
and minimize the noise at the flyover observer. Note that the UHB engine throttle cutback is shallower than the
CFM56-7B (in percent thrust) in order to maintain the necessary minimum cutback climb gradient. The altitude that
the N+1 airplane is able to reach at the flyover observer is 80 ft lower than the 737, resulting in a noise increase of
perhaps 0.4 EPNdB. The N+1 airplane’s lower acceleration reduces flyover airspeed (by 16 ktas) and contributes to
an increased flyover EPNL duration component.
If the trajectory and throttle settings had been assumed from previous experience rather than calculated, the
effects noted above may result in under predicting each of the three EPNLs. If 737 trajectory and throttle settings
had been used for the N+1 UHB airplane, its certification noise would have been underestimated by nearly 2
cumulative EPNdB.
The computed trajectories and throttle settings are used to determine engine and aircraft state information. This
information in turn is used to predict component source noise spectra as described above for half-second time
intervals along the trajectory. The spectra are propagated, and the OASPL and PNLT noise-time histories are plotted
in Fig. 14, Fig. 15, and Fig. 16 for the approach, lateral, and flyover observers, respectively. Observer time relative

American Institute of Aeronautics and Astronautics
12 of 15
55
60
65
70
75
80
85
90
Fan
Jet
Cor
e
Tota
l Pro
pulsion
Main
Gea
r
Nos
e G
ear
Slats
Flap
s
Trai
ling
Edg
e
Tota
l Airf
ram
eTo
tal
EP
NL
, E
PN
dB
Approach
Lateral
Flyover
Figure 17. Predicted N+1 airplane certification noise levels.
to the point of brake release (or touchdown) is used as the independent parameter in each figure. In the analytical
world, it is easy to compute each noise source separately from the others simply by issuing appropriate commands to
ANOPP. Plotting the levels of each source as a function of time provides additional insight to the overall problem.
The OASPL metric is shown at the left in each figure because of its simplicity and its ability to clearly show the
smooth rise and fall of each noise source over time. The PNLT metric – shown at the right in each figure – has
qualities that capture level, frequency weighting, and tone annoyance penalties. Its time histories are therefore much
more irregular than the OASPL histories: as the airplane approaches and recedes, Doppler and convective
amplification effects have an effect on the PNLT metric’s frequency-weighting and tone penalties. The PNLT-time
histories within the integration region of 10 PNdB from the maximum PNLT (shown as a horizontal line in each
right-hand figure) are the regulatory bases for the EPNLs shown in Fig. 17.
The approach observer seems
to be clearly dominated by the
several airframe noise sources on
an OASPL basis (Fig. 14, left),
with core noise apparently
making a significant contribution
as well. However, when the
higher-frequency fan noise and
fan interaction tone contributions
are considered via the PNLT
metric (Fig. 14, right), fan noise
becomes the dominant approach
source. Another reason for the
fan’s strong showing is that the
acoustic signature of the
Advanced Ducted Propulsor “Fan
1” is dominated by strong aft-
quadrant noise levels (See Ref.
23.). This results in two PNLT
peaks within the area of
integration. The first peak
consists of fore-quadrant fan
noise increased by convective amplification, while the second, aft-quadrant fan noise peak rises despite the
favorable convection effects of the receding aircraft. The strong aft fan noise extends the PNLT trace for several
seconds beyond the airframe noise sources and increases the approach EPNL duration component. The airframe
noise sources – effectively muted by their noise reduction technologies – make a secondary contribution to the
approach EPNL. Core noise becomes a minor contributor on a PNLT basis, and jet noise at the approach power
setting is insignificant relative to the other sources with any metric. The overall approach EPNL is 86.2 EPNdB.
The lateral observer is dominated by jet noise, and – perhaps surprisingly – core noise, at least on an OASPL
basis (Fig. 15, left). But fan noise again rises to prominence on a PNLT basis when discrete interaction tones and
spectral content are considered (Fig. 15, right). Fan noise is once again enhanced due to its strong aft-quadrant noise
and twin PNLT peaks within the lateral observer area of integration. Jet noise and core noise, owing to their low-
frequency, broadband content, are favored by the PNLT metric. Even so, the levels of lateral core noise are notable,
rivaling even fan noise. Somewhat worrisome – as discussed earlier – is the core noise prediction method’s inability
to predict core noise at overall pressure ratios in excess of 30. The overall pressure ratio at lateral power and 180
ktas is approximately 34, resulting in perhaps an under prediction of lateral core noise by an unknown amount. The
contribution of jet noise to the lateral EPNL is very small. If the core nozzle chevrons are analytically removed,
lateral noise is predicted to increase by only 0.1 EPNdB. This suggests that – for this design – the core nozzle
chevrons may be omitted if their thrust performance penalty is unacceptable. The contributions of the airframe noise
sources to the lateral EPNL are negligible. Flap and trailing edge noise are nonzero, but make no significant
contribution to the lateral EPNL. Gear are retracted after use, and the slat gaps are effectively sealed on their
departure setting, resulting in no contribution to lateral noise at all. The overall lateral EPNL is 81.5 EPNdB.
The flyover observer has significant PNLT contributions of aft fan, core, and even airframe trailing edge noise
(Fig. 16, right, and Fig. 17). The throttle cutback effectively eliminates jet noise altogether. The overall pressure
ratio at the noise abatement cutback throttle setting is less than the core noise model maximum, so core flyover noise
may reasonably be expected to be accurate, according to early results from the acoustic tool benchmarking study
American Institute of Aeronautics and Astronautics
13 of 15
79
81
83
85
87
89
91
93
100 1000Maximum Takeoff Gross Weight, 1000 lb
Fly
ove
r E
PN
L, E
PN
dB Stage 3 limit (twinjets)
All certificated 737s
equipped with CFM56-7Bs
N+1 airplane; 81.6 EPNdB,-9.7 EPNdB below Stage 3
Figure 20. Flyover certification noise
80
82
84
86
88
90
92
94
96
98
100 1000Maximum Takeoff Gross Weight, 1000 lb
La
tera
l E
PN
L, E
PN
dB Stage 3 limit
All certificated 737s
equipped with CFM56-7Bs
N+1 airplane; 81.5 EPNdB,
-15.2 EPNdB below Stage 3
Figure 19. Lateral certification noise
84
86
88
90
92
94
96
98
100
100 1000Maximum Takeoff Gross Weight, 1000 lb
Ap
pro
ach
EP
NL
, E
PN
dB
All certificated 737sequipped with CFM56-7Bs
Stage 3 limit
N+1 airplane; 86.2 EPNdB,
-14.2 EPNdB below Stage 3
Figure 18. Approach certification noise
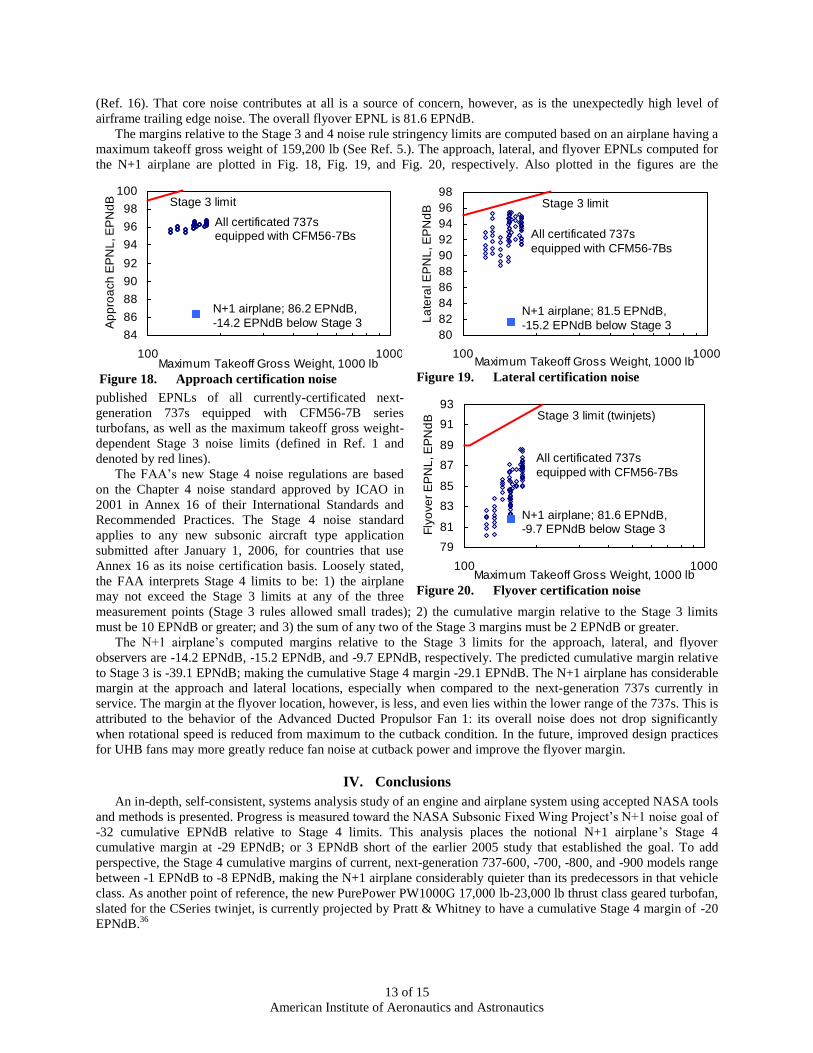
(Ref. 16). That core noise contributes at all is a source of concern, however, as is the unexpectedly high level of
airframe trailing edge noise. The overall flyover EPNL is 81.6 EPNdB.
The margins relative to the Stage 3 and 4 noise rule stringency limits are computed based on an airplane having a
maximum takeoff gross weight of 159,200 lb (See Ref. 5.). The approach, lateral, and flyover EPNLs computed for
the N+1 airplane are plotted in Fig. 18, Fig. 19, and Fig. 20, respectively. Also plotted in the figures are the
published EPNLs of all currently-certificated next-
generation 737s equipped with CFM56-7B series
turbofans, as well as the maximum takeoff gross weight-
dependent Stage 3 noise limits (defined in Ref. 1 and
denoted by red lines).
The FAA’s new Stage 4 noise regulations are based
on the Chapter 4 noise standard approved by ICAO in
2001 in Annex 16 of their International Standards and
Recommended Practices. The Stage 4 noise standard
applies to any new subsonic aircraft type application
submitted after January 1, 2006, for countries that use
Annex 16 as its noise certification basis. Loosely stated,
the FAA interprets Stage 4 limits to be: 1) the airplane
may not exceed the Stage 3 limits at any of the three
measurement points (Stage 3 rules allowed small trades); 2) the cumulative margin relative to the Stage 3 limits
must be 10 EPNdB or greater; and 3) the sum of any two of the Stage 3 margins must be 2 EPNdB or greater.
The N+1 airplane’s computed margins relative to the Stage 3 limits for the approach, lateral, and flyover
observers are -14.2 EPNdB, -15.2 EPNdB, and -9.7 EPNdB, respectively. The predicted cumulative margin relative
to Stage 3 is -39.1 EPNdB; making the cumulative Stage 4 margin -29.1 EPNdB. The N+1 airplane has considerable
margin at the approach and lateral locations, especially when compared to the next-generation 737s currently in
service. The margin at the flyover location, however, is less, and even lies within the lower range of the 737s. This is
attributed to the behavior of the Advanced Ducted Propulsor Fan 1: its overall noise does not drop significantly
when rotational speed is reduced from maximum to the cutback condition. In the future, improved design practices
for UHB fans may more greatly reduce fan noise at cutback power and improve the flyover margin.
IV. Conclusions
An in-depth, self-consistent, systems analysis study of an engine and airplane system using accepted NASA tools
and methods is presented. Progress is measured toward the NASA Subsonic Fixed Wing Project’s N+1 noise goal of
-32 cumulative EPNdB relative to Stage 4 limits. This analysis places the notional N+1 airplane’s Stage 4
cumulative margin at -29 EPNdB; or 3 EPNdB short of the earlier 2005 study that established the goal. To add
perspective, the Stage 4 cumulative margins of current, next-generation 737-600, -700, -800, and -900 models range
between -1 EPNdB to -8 EPNdB, making the N+1 airplane considerably quieter than its predecessors in that vehicle
class. As another point of reference, the new PurePower PW1000G 17,000 lb-23,000 lb thrust class geared turbofan,
slated for the CSeries twinjet, is currently projected by Pratt & Whitney to have a cumulative Stage 4 margin of -20
EPNdB.36

American Institute of Aeronautics and Astronautics
14 of 15
The 3 EPNdB discrepancy between the -29 EPNdB margin calculated in this assessment and the earlier 2005
study that established the -32 EPNdB goal may be explained by any or all of the following: 1) the incorporation of
new thrust lapse, trajectory, and throttle modeling; 2) the unexpectedly high level of fan noise at the flyover
condition; and 3) the use of improved analytical tools, methods, and assumptions. Despite this new result, the -32
EPNdB N+1 noise reduction goal remains the same. This 3 EPNdB shortfall indicates that a slightly greater reliance
on noise reduction technologies will be needed to achieve the goal. Some technologies under consideration that may
be used to close the gap may include scarfed inlets, low-count stator technologies, and advanced acoustic liners,
such as 3-degree of freedom, zero-splice, or nose lip liners.
As shown by this study, as the once-historically dominant noise sources such as jet noise and fan noise are
pushed lower by way of ultrahigh bypass ratio engine cycle design and innovative noise reduction technologies,
other noise sources become important and require attention. For example, airframe trailing edge noise is seen here to
perhaps now be a contributor to flyover noise. And engine core noise, in this case exacerbated by an engine design
incorporating a high overall pressure ratio, contributes to lateral and flyover noise. A need is foreseen for improved
engine core noise modeling methods at NASA that reflect the high overall pressure ratios of modern engines.
Lastly, this airplane represents the “low-noise corner” of the design trade space, and it may not be characteristic
of a balanced, profitable, business-case airplane design. In the interest of noise reduction, it has an engine cycle
design that would not result in minimum block fuel, takeoff gross weight, or cost. This design also uses highly
advanced engine and airframe noise reduction technologies to come within reach of NASA’s aggressive goal. An
actual 737 replacement aircraft may not be as quiet as the N+1 vehicle studied here. However, this study does
indicate that if an aggressive, noise-focused design is pursued, it is possible to come within reach of the noise goal.
References 1Code of Federal Regulations, Title 14, Chapter I, Part 36. Noise standards: Aircraft type and airworthiness certification. 2Berton, J.J., Bridges, J.E., Burley, C.B., Envia, E., Jones, M.G., and Khorrami, M.R.: “Subsonic Fixed Wing N+1 Noise
Goal Study,” Acoustics Technical Working Group Meeting, Williamsburg, VA, September 23-24, 2008. 3Envia, E., Berton, J.J., Bridges, J.E., Burley, C.B., Jones, M.G., Khorrami, M.R., and Rawls, J.R.: “Progress Toward SFW
N+1 Noise Goal,” 2nd Annual Fundamental Aeronautics Program Meeting, Atlanta, GA, October 7-9, 2008. 4Envia, E., Berton, J.J., Bridges, J.E., Burley, C.B., Jones, M.G., Khorrami, M.R., and Rawls, J.R.: “N+1 Generation: Noise
and Fuel Burn Reduction,” Fundamental Aeronautics Program, Subsonic Fixed Wing Project, 12-Month Program Review,
Washington, D.C., November 5-6, 2008. 5Guynn, M.D., Berton, J.J., Fisher, K.L., and Thurman, D.R.: “Engine Concept Study for an Advanced Single-Aisle
Transport,” Submitted for publication; NASA TP to be published, 2009. 6Perra, M.; and German, N.: “Pratt & Whitney Launches PurePower Engine Family,” United Technologies Corp., Pratt &
Whitney press release, 14 July 2008. 7Norris, G.; and Wall, R.: “Boeing Goes Back to Drawing Board for 737 Follow-on,” Aviation Week and Space Technology,
18 May, 2008. 8Lytle, J.K.: “The Numerical Propulsion System Simulation: An Overview,” NASA TM-2000-209915. 9NPSS User Guide Software Release: NPSS_1.6.4. 10Onat, E., and Klees, G.: “A Method to Estimate Weight and Dimensions of Large and Small Gas Turbine Engines,” NASA
CR 159481, 1979. 11McCullers, L.A.: “Aircraft Configuration Optimization Including Optimized Flight Profiles,” Proceedings of the
Symposium on Recent Experiences in Multidisciplinary Analysis and Optimization, NASA CP 2327, April 1984. 12Code of Federal Regulations, Title 14, Chapter I, Part 25. Airworthiness Standards: Transport Category Airplanes. 13737 Airplane Characteristics for Airport Planning, D6-58325-6, Boeing Commercial Airplanes, October 2005, URL:
http://www.boeing.com/commercial/airports/737.htm [cited 2/23/2009]. 14787 Dreamliner Program Fact Sheet, URL: http://www.boeing.com/commercial/787family/programfacts.html [cited
2/23/2009]. 15Gloudemans, J.R.; Davis, P.C.; and Gelhausen, P.A.: “A Rapid Geometry Modeler for Conceptual Aircraft,” AIAA-1996-
0052, January, 1996. 16Dahl, Milo D.: “A Process for Assessing NASA's Capability in Aircraft Noise Prediction Technology,” AIAA Paper 2008-
2813, NASA TM-2008-215268, 2008. 17Burley, C.L.; Rawls, J.W., Jr.; Berton, J.J.; and Marcolini, M.A.: “Aircraft System Noise Prediction,” NASA report to be
published, 2009. 18Gillian, R.E.: “Aircraft Noise Prediction Program User’s Manual,” NASA TM-84486, 1983. 19Zorumski, W.E.: “Aircraft Noise Prediction Program Theoretical Manual,” NASA TM-83199, 1981, Parts 1 and 2
(Currently maintained at NASA LaRC by the ANOPP team in electronic format and provided upon request; Latest revision:
January 2009).

American Institute of Aeronautics and Astronautics
15 of 15
20Stone, J.R., Krejsa, E.A., Clark, B.J., and Berton, J.J.: “Jet Noise Modeling for Suppressed and Unsuppressed Aircraft in
Simulated Flight,” NASA TM-2009-215524, 2009. 21Hunter, C.A.; Bridges, J.E.; Khavaran, A.: “Assessment of Current Jet Noise Prediction Capabilities,” AIAA Paper 2008-
2933; NASA TM-2008-215275, 2008. 22Janardan, B.A.; Hoff, G.E.; Barter, J.W.; Martens, S.; Gliebe, P.R.; Mengle, V.; and Dalton, W.N.: “AST Critical
Propulsion and Noise Reduction Technologies for Future Commercial Subsonic Engines – Separate-Flow Exhaust System Noise
Reduction Evaluation,” Final Report: NAS3–27720, Area of Interest 14.3, General Electric Report R98AEB152, May 1998. 23Dittmar, J.H.; Elliott, D.M.; and Bock, L.A.: “Some Acoustic Results from the Pratt and Whitney Advanced Ducted
Propulsor – Fan 1,” NASA TM-1999-209049, 1999. 24Kontos, K.B.; Janardan, B.; and Gliebe, P.R.: “Improved NASA-ANOPP Noise Prediction Computer Code for Advanced
Subsonic Propulsion Systems Volume 1: ANOPP Evaluation and Fan Noise Model Improvement,” NASA CR-195480, 1996. 25Envia, E.; Woodward, R.P.; Elliott, D.M.; Fite, E.B.; Hughes, C.E.; Podboy, G.G.; Sutliff, D.L.: “An Assessment of
Current Fan Noise Prediction Capability,” NASA TM-2008-215415, 2008. 26Kontos, K.B.; Kraft, R.E.; and Gliebe, P.R.: “Improved NASA-ANOPP Noise Prediction Computer Code for Advanced
Subsonic Propulsion Systems. Volume 2: Fan Suppression Model Development,” NASA CR-202309, 1996. 27Neubert, R.; Bock, L.; Malmborg, E.; and Owen-Peer, W.: “Advanced Low Noise Research Fan Stage Design,” NASA CR
97-206308, 1997. 28Jones, M.; Parrott, T.; Sutliff, D.; Hughes, C.: “Assessment of Soft Vane and Metal Foam Engine Noise Reduction
Concepts,” 15th AIAA/CEAS Aeroacoustics Conference, AIAA-2009-3142, 2009. 29Sutliff, D.; Jones, M.; and Hartley, T.: “Collaboration with Williams International to Demonstrate the Characteristics of a
Foam-Metal-Liner Installed Over-the-Rotor of a Turbofan Engine,” Acoustics Technical Working Group Meeting, 23-24 Sep.
2008, Williamsburg, VA, United States. 30Emmerling, J.J.; Kazin, S.B.; and Matta, R.K.: “Core Engine Noise Control Program. Volume III, Supplement 1 -
Prediction Methods,” FAA-RD-74-125, III-I, Mar. 1976 (Available from DTIC as AD A030 376.) 31Ho, P.Y.; and Doyle, V.L.: “Combustion noise prediction update,” 5th AIAA Aeroacoustics Conference, Seattle, WA,
AIAA Paper 1979-0588, 1979. 32Weir, D.S., editor: “Engine Validation of Noise and Emission Reduction Technology, Phase I,” Honeywell Report No. 21-
13843, Honeywell Aerospace, Phoenix, AZ; also NASA CR-2008-215225, 2008. 33Fink, M.R.: “Airframe Noise Prediction Method,” FAA-RD-77-29, March, 1977. 34Humphries, W.M.; Burley, C.L.; and Brooks, T.F.: “Scale-Model Landing Gear Noise Spectra and Directivity,” Acoustics
Technical Working Group Meeting, 23-24 Sep. 2008, Williamsburg, VA, United States. 35Streett, C.L.; Casper, J.H.; Lockard, D.P.; Khorrami, M.R.; Stoker, R.W.; Elkoby, R.; Wenneman, W.F.; and Underbrink,
J.R., “Aerodynamic Noise Reduction for High-Lift Devices on a swept Wing Model,” 44th AIAA Aerospace Sciences Meeting
and Exhibit, Reno, NV, AIAA Paper 2006-212, 2006. 36“Pratt & Whitney PurePower PW1000G Engines: This Changes Everything,” Pratt & Whitney fact sheet, 2008, URL:
http://www.pw.utc.com/StaticFiles/Pratt%20&%20Whitney%20New/Media%20Center/Assets/1%20Static%20Files/Docs/comm
ercial_purepower_july08.pdf [cited 3/19/2009]