an analytical network process (anp) approach for the ... · an analytical network process (anp)...
TRANSCRIPT
An Analytical Network Process (ANP) approach for the development of a reverse supply chain performance index in
consumer electronics industry
[004-0069]
Srikanth Yellepeddi * (PhD candidate) Department of Industrial & Manufacturing Systems Engineering
The University of Texas at Arlington, Arlington, Texas, 76019, USA *Corresponding Author Email: [email protected]
Dr. Donald H. Liles Chair, Department of Industrial & Manufacturing Systems Engineering The University of Texas at Arlington, Arlington, Texas, 76019, USA
Email: [email protected]
Santhanam Rajagopalan (PhD candidate) Department of Industrial & Manufacturing Systems Engineering
The University of Texas at Arlington, Arlington, Texas, 76019, USA Email: [email protected]

Abstract Reverse logistics (RL) activities are becoming imperative in today�s world of significant uncertainties. One of the major problems faced by management in consumer electronics industry is the development of a measurement tool to evaluate and improve their current RL performance. Developing accurate and consistent performance measures is critical in any system as it directly reflects its quality and effectiveness. The key goal, however, is to translate the performance measures into a single index that measures the RL progress of the entire organization along its established goals and strategies. The Analytical Network Process (ANP) based framework provides a holistic approach in developing the performance index by linking the various qualitative and quantitative, strategic, tactical and operational, financial and non-financial factors, and considering the various inter-dependencies among the various levels of decision elements. The model in this paper provides organizations a tool to assess and benchmark their current returns management performance with their competitors. Keywords: Reverse Logistics, Fuzzy ANP, Performance Evaluation 1. Introduction Returns management has evolved from being a forgotten child to a value recovery process to a strategic competitive advantage. In today�s world of high uncertainties and stiff market competition, returns are inevitable and need to be considered while managing the business supply chain. RL has gained tremendous importance over the past few years in industries such as consumer electronics due to inherent complexities involved in handling the returns. The consumer electronics industry in U.S is dynamic with ever shrinking product lifecycles, increasing electronic wastes and tougher environmental legislations. Returns can happen anytime during the product lifecycle, and as the problems and costs of consumer product returns are projected to grow, many firms are just beginning to develop strategies and tactics to reduce the overall costs and improve performance (Reiss, 2003). Most returns processes in place today were developed for an earlier environment in which returns rates were low and the value of the asset stream was insignificant. While the cost efficient logistics processes designed earlier may be desirable for collection and disposal of products when return rates are low and profit margins are comfortable, this approach can actually limit a firm�s profitability in today�s business environment. This is typically the case of short life cycle, time sensitive products where these losses can exceed 30% of the product value (Souza et. al, 2005). Consumer electronics represents an average of 1.7% of the municipal waste stream currently (EPA, 2001). This is not good news if we look at the U.S sales trends. The consumer electronics association (CEA) reports that the total 2005 sales increased by 11% in 2005 to $126 billion (IAER, 2005). To tackle this mounting waste and returns problem, policy and business entrepreneurs are promoting product recovery as an environmentally and economically preferable alternative to disposal, and product recovery infrastructure and strategy has begun to develop in recent years (White, Rosen, & Beckman, 2003). In light of increasing profit making opportunities and larger cost cutting initiatives, coupled with changing customer attitudes and stricter legislations, return handling of electronic products has become a daunting challenge. Performance measurement and metrics have an important role to play in setting objectives, evaluating performance, and determining future courses of actions (Gunasekaran, et. al, 2004). Performance measurement and metrics pertaining to reverse supply chains have not received adequate attention from researchers or practitioners. Although a number of performance measures appropriate for traditional supply chains have been developed, these existing measures are insufficient for use in the closed loop environment. The existing measures are inadequate in capturing the dual extended supply chain objectives of economic efficiency and environmental protection (Beamon, 1999). This research aims to fill this gap by developing a composite reverse logistics performance index for the consumer electronics industry, to aid the management in measuring their RL performance, based on their goals and strategies, and benchmark with their competitors. The remainder of the paper is structured as follows: section 2 deals with the background of this research and the nomenclature, section 3 provides a brief introduction of Fuzzy ANP methodology, section 4 deals with the �PEARL� framework and the methodology in developing the index, section 5 concludes the paper and suggests future research opportunities.

2. Literature review 2.1 Reverse logistics and the dynamic electronics industry Rogers and Tibben-Lembke (1999) defined reverse logistics as �the process of planning, implementing, and controlling the efficient, cost effective flow of materials, in-process inventory, finished goods and related information from the point of consumption to the point of origin for the purpose of recapturing value or proper disposal�. RL is an integral component of supply chain management systems because of the cost and service dimensions associated with the process. Closely monitoring RL operations greatly enhances efficiencies within the entire company as well as the entire supply chain network (Stock, 1998). The incorporation of return flows is easier said than done, as the behavior of consumers introduces uncertainties in the quality, quantity, and timing of product returns. Stock (1992) and Murphy (1986) both recognized the field of reverse logistics as being relevant for business and society in general. Dowlatshahi (2000) argues that from design through manufacture to consumer, firms should explore and integrate reverse logistics as a viable business option in the product life cycle. Unlike forward logistics, RL operations are complex and prone to a high degree of uncertainty (Kokkinaki et al., 2001), affecting collection rates, the availability of recycled production inputs, and capacities in the reverse channel. Differences include the supply chain composition and structure, additional government constraints, rapid timing and uncertainty in the environment (Daugherty et al., 2002). Due to shortening of product life cycles for products like consumer electronics, the recovery of value after use is becoming a necessity (Hillegersburg, Zuiwijk, van Nunen, & van Eijk, 2001). IAER research highlights that about 3 million consumer electronic units will be scrapped by 2010, and the total generation of consumer electronics waste in the US municipal waste stream is well over 2 million tones per year. Consumer electronics represents an average of 1.7% of the municipal waste stream currently (EPA, 2001). Pro-active companies that incorporate RSC practices could use discarded products as a valuable source of components and materials, and develop an effective product recovery management policy (Thierry et. al, 1995). Electronics is the basic technology for many new products in the industry. Due to the increasing product variety and shorter life cycles many electronic products end up in disposal sites. The development in the electronics sector is geared towards growing miniaturization, more complex and compact products, all of which stand in the way of economical and ecological recycling (Muller et. al, 1997). Electronics industries have started to realize that RSC can be used to gain competitive advantage (Marien, 1998). Thus, U.S electronics manufacturers and other players in the RL chain need to know what strategies to incorporate and how to structure their reverse logistics systems. Electronic equipment collection, remanufacturing and distribution were assessed by Jayaraman et al. (1999). Fleischmann et al. (2000) devised a framework of three typical RL networks structures and presented a continuous optimization model for RL network design. One of the major bottlenecks in RL systems is the lack of accurate data, which complicates the management of RSC systems (Nagal & Meyer, 1999). The only information currently available is historical data on aggregate yearly returns, making it difficult to use more sophisticated RL forecasting methods such as those developed by Toktay et al. (2004). Data on product returns is often non existent or of poor quality making it rather than the technology the limiting factors for coordinating RL supply chains (Brito et al., 2002). Efficient RL programs that take these factors into consideration can proactively minimize the threat of government regulation and can improve the corporate image of the companies (Carter & Ellram, 1998). According to consumer electronics industry survey by the RLEC, the average returns rate is 8.46%. Returns have become endemic in electronics industry with rates as high as 20% in some sectors. As depicted in table 1, the value of returned goods was around $104 billion in 2004, with the cost of managing their returns running about $8 billion. This high rate of return is only going to rise � with an increase in low cost, but low contact distribution channels like web, customer uncertainty that emerges from a dramatic expansion if product choices; and shorter product life cycles. Therefore a significant impact on the corporate bottom line is inevitable (Thrikutam and Kumar, 2004). Developing a comprehensive and cost effective approach to handling returns is a daunting challenge that reaches well beyond the operational level. It is also a source of customer retention and competitive differentiation. Thus a well honed returns management plan can be a vital strategic asset.

Table 1 Value of returned goods in the electronics industry (Adapted from �Turning returns management into a competitive advantage in hi-tech
manufacturing�; Thrikutam and Kumar, 2004) Product Category Indicative return rate Sales- 2004
(US $ Billion) Value of returned goods (US $ Billion)
Computers 15 % 281.6 42.2 Office equipment 6 % 57.7 3.5 Household equipments 10 % 24.5 2.5 Semiconductor chips 15 % 216.9 32.5 CDs 20 % 30.7 6.1 Cameras 4 % 6.2 0.2 Software 20 % 85.1 17 Total 702.7 104
2.2 Performance measurement within RL Effective performance management is an important aspect of RSC initiative, and is the key to recognize the benefits and achieve efficient supply chain management systems. An evaluation framework for decision making provides a basis to evaluate alternatives and introduce measures. One of the prime issues in this context is the assessment of various strategies for delivering objectives and developing measures, and how the organization should prioritize the determinants and the initiatives that impact them (Wheelwright, 1978). The electronics industry is now slowly recognizing that management of RSC enhances the competitive edge of all players therein (Berry et. al, 1994). Performance measurement drives actions in two aspects. First monitored measures get high visibility with an organization, and people strive to achieve high performance with respect to these measures. Second, metrics drive organizational actions by identifying areas of improvement (Andersen, 2002). RL being a relatively new concept demands some kind of performance measurement tool. One such approach is the balanced scorecard that allows managers to look at the business from four divergent important perspectives: customer, internal business, innovation and learning, and finance (Kaplan & Norton, 1992). Brewer and Speh (2000) had used the concept of balanced scorecard to measure the forward supply chain performance. The balance scorecard has been recognized for some time now, as a leading tool for performance measurement in both research and industry. The four perspectives in the balanced scorecard help managers the translate strategies into specific measures that can monitor the overall impact of the strategy on the enterprise (Ahmed and Abdalla, 2002). The BSC approach provides a comprehensive picture of the enterprise performance at a glance. It provides insight into whether an improvement is based on actual process improvement or by reducing the performance of other processes (Kaplan and Norton, 1992). It is imperative that measures must be selected for situations where they are appropriate. This is particularly true in changing times as boundaries among the firm�s various functional areas dissolve, and effective supply chain management requires evolving responsibilities and accountabilities. Measures must be consistent with the specific needs of the firm and be capable of communicating to those within the organization what type of performance is desired (Griffis, Cooper, Goldsby and Closs, 2004).There are innumerable methods and measures in the Forward Supply Chain (FSC) that helps design, plan, manage and control the various FSC activities. But in the case of its� return counter-part, namely the Reverse Supply Chain (RSC) / RL, there aren�t much. Unlike FSCs, design strategies for RSCs are relatively unexplored and underdeveloped (Blackburn, 2004). This research considers the specific problem from the perspective of a manufacturer of electronic products that is required to handle the product returns in today�s changing environment. The electronics industry is more complex than other industries in terms of the uncertainty of product returns. Due to the rapid technological progress, these products have shorter life cycles and high variability of returns as compared to other consumer durable goods. The consumer electronics reverse logistics systems may hold one of the most important promises due to the volume of product available to reuse, but at the same time, these types of reverse logistics networks represent some of the greatest challenges due to its complexity in time and variability in the rate of returns (Serrato, et. al, 2003). In addition to these difficulties, product acquisition is very difficult due to the global diffusion of products. Although, there has been extensive research in

understanding the complexities of handling returns in the electronics industry, there seems to be a gap in developing effective performance measurement tools for the reverse supply chains. With the growing amount of electronic waste the development of a reverse supply chain performance measurement methodology for the electronics industry is vital. This research investigates the performance measurement of the reverse supply chain and tries to address the �gap� in research, which renders the following questions unanswered:
1. For electronic products what are the various strategies and measures for effectively measuring the performance of reverse supply chain processes?
2. How can the various attributes be synthesized and quantified to indicate the overall capability of handling returns within the consumer electronics industry?
3. How can the methodology be implemented in the electronics industry to achieve the goals of maximizing revenue and environmental regulations conformance?
2.3 Analytical Hierarchy and Analytical Network Process Since the AHP has been proposed by Saaty (1980), it has been widely used to deal with the dependence and the feedback decision making. One of the main advantages of this method is the relative ease with which it handles multiple criteria, both qualitative and quantitative. It involves the principle of decomposition, pair-wise comparisons, priority vector generation and synthesis. AHP has been extensively applied in many fields including performance evaluation in manufacturing (Wabalickis, 1987; Canada and Sullivan, 1989; Weber, 1993; Lee et al., 1995; Rangone, 1996). ANP or system with feedback (Saaty and Takizawa, 1986), a generalization of AHP, can be used as an effective tool in those cases where the interactions among the elements of a system form a network structure (Saaty, 1996). ANP differs from AHP in a way that it does not impose strict hierarchical structure, and models the decision problem using a system with feedback approach. The ANP approach, though not so widely used as AHP, has also been used in performance evaluation and other applications (Hamalainen and Seppalainen, 1986; Azhar and Leung, 1993; Meade et al., 1997; Meade and Sarkis, 1999; Ravi et al., 2005). The ANP approach is capable of capturing feedback and interdependent relationships among and within the levels of components. Both the AHP and ANP approaches use Saaty�s 1-9 scale similar to Likert scales to express the decision maker�s subjective assessment of the relative contribution of components to their immediate higher level component in the hierarchy and structure pair-wise comparison matrices (Saaty and Alexander, 1981). The relative importance of component i compared to component j with regard to the parent component in the hierarchy is determined using Saaty�s scale and assigned to the (i. j) th position of the pair-wise comparison matrix. The local weights are then calculated by solving for the eigen vector as described by Cheng and Li (2001). The process is repeated for each level of hierarchy to complete the decision making process. The super matrix is then constructed based on the eigen vectors and raised to limiting powers to achieve convergence (column stochastic or column sum equal to 1) and calculate overall priorities. The super matrix is a partitioned matrix, where each submatrix is composed of a set of relationships between two clusters in the graphical model (Meade and Sarkis, 2002). ANP has some other advantages over AHP such as (Saaty, 1999):
• Allowance for interdependency and complex relationships • Looser and non linear network structure • Real world representation of the problem by making use of clusters • Allows consideration of tangible as well as intangible criteria in decision making
ANP relies on the process of eliciting managerial inputs, thus allowing for a structured communication among decision makers, thereby acting as a qualitative tool for strategic decision making problems (Sarkis and Sunderraj, 2002). This feature makes it superior from AHP which fails to capture interdependencies among different enablers, criteria, and sub-criteria (Agarwal and Shankar, 2003). Although ANP incorporates major relationships, it still has some disadvantages such as
• Identifying attributes requires extensive brainstorming sessions • Data acquisition is a time intensive process • ANP requires a lot of calculations compared to the AHP process, and • Subjectivity of the comparisons is not considered

Though the purpose of AHP/ANP is to capture the expert�s knowledge, the conventional version still cannot reflect the human thinking style and therefore, fuzzy AHP/ANP was developed. The decision maker can specify preferences in the form of natural language expressions about the importance of each attribute over another (Kahraman et al., 2004). There are many fuzzy AHP methods proposed by various authors. Decision makers are usually more confident to give interval judgments than fixed value judgments. This is because usually he/she is unable to explicit about his/her preferences due to the fuzzy nature of the comparison process (Bozdag et al., 2003). Some of the early pioneers in applying fuzzy AHP for a number of applications were Laarhoven and Pedrycz, (1983); Buckley, (1985); Deng, (1999); Zhu et al., (1999); Cheng et al., 1999; and Leung and Cao, (2000). In fuzzy ANP, the weights are simpler to calculate than for conventional ANP. Several authors have applied the fuzzy ANP based approach recently to solve complex decision making scenarios (Lee and Kim, 2000; Emblemsvag and Tonning, 2003; Buyukozkan et al., 2004; Tran et al., 2004; Chung et al., 2005; and Lefley and Sarkis, 2005).
2.4 Nomenclature
Nomenclature ANP Analytical Network Process CO Collection AHP Analytical Hierarchy Process TACD Total average collection deviation PEARL Performance evaluation analytic for reverse
logistics RBR Returns inventory build up rate
RLOPI Reverse logistics overall performance index RR Rejection rate RL Reverse logistics CA Cost accuracy RSC Reverse Supply Chain ERL Employees devoted to RL BSC Balanced Scorecard RV Return volumes TFN Triangular Fuzzy Number NET Number of employees under training
)(xMµ Membership function of M TFN SO Sorting Mi TFN showing scale similar to Saaty�s scale
of 1-9 RPU Return products resource utilization %
li Lowest limit of the TFN CU Capacity usage by returned products mi Most likely value of the TFN RCT RMA processing cycle time ni Highest limit of the TFN PCD Packaging costs for disposition
iS Fuzzy synthetic extent value RIT Return inventory turns
d Intersection point between two fuzzy numbers
PT Product traceability
W ′ Weight vector CAL Costs of additional labor W Non-fuzzy (normalized) weight vector ST Storing
PRX Performance Rating across electronics industry
IFA Inventory forecasting accuracy
WmX Measure Weight INT Investment in new technologies and infrastructure WFX RL Function Weight HSE Health and safety expenditures SmX Performance score at the measure RWIP Work in progress of returned products IN Introduction SCR Storage costs of returns GR Growth RCC Returns carrying costs MA Maturity AR Asset Recovery DE Decline ECAR Environmental conformance of asset recovery OB Obsolete RF Recycling fraction CS Customer satisfaction OR Obsolescence ratio NT New technology VR Value recovered EC Eco-compatibility PTA Processing time accuracy SA Strategic alliances NPA Number of products accuracy KM Knowledge management AD Amount of disposal VR Value recovery QR Quality of rework GK Gate-keeping RDT Re-distribute and transport GKP Gate-keeping percentage RSCO Return shipment cost GKE Gate-keeping efficiency CR Cost of re-transport IDP Idle time of products at gate-keeping SI Standardization index IDT Idle time of trucks at gate-keeping CAWT Cost of additional warehouse and transportation DFA Demand forecasting accuracy RSA Required space accuracy RCR Returning customer ratio OTDR On time delivery ratio RPP Return percentage by product

3. Fuzzy ANP methodology 3.1 Fuzzy theory To deal with vagueness and uncertainty of human thought, Zadeh (1965) first introduced the fuzzy set theory. Fuzzy theory enables decision makers to tackle the ambiguities involved in the process of the linguistic assessment of the data. The theory also allows mathematical operations and programming to be applied to the fuzzy domain (Dubois and Prade, 1979; Kauffmann and Gupta, 1988; Kahraman et al., 2004). A fuzzy set is a class of objects with a continuum of membership grades, where the membership grade can be taken as an intermediate value between 0 and 1. Fuzzy set theory is a perfect means for modeling uncertainty arising from mental phenomena which are neither random nor stochastic. Human beings are heavily involved in decision making and hence a rational approach should take into account human subjectivity, rather than employing only objective probability measures (Kahraman et al., 2006). In essence, fuzzy logic provides numerous methods to represent the qualitative assessment of the decision maker as quantitative data (Mohanty et al., 2005). 3.2 Triangular fuzzy numbers A fuzzy subset M, of a universal set X, is defined by a membership function µM (x) which maps each element x in X to a real number in the [0, 1] interval (Karsak and Tolga, 2001). The function value µM (x) denotes the grade of membership of x in M; hence larger values imply higher degrees of set membership. In this research, triangular fuzzy numbers are used as membership functions to assess the preferences of decision makers. The reason for using a triangular fuzzy number (TFN) is that it is intuitively easy for the decision makers to use and calculate. A fuzzy number is a TFN if its membership function can be denoted as follows (Kauffmann and Gupta, 1991):
µM (x) =
>≤≤−−
≤≤−−<
uxuxmmuxu
mxllmlxlx
0)()()()(
0
(1)
A triangular fuzzy number, Mi, is shown in Fig.1. It is simply represented as (li, mi, ui), where li ≤ mi ≤ ui. The parameters l, m, and u, respectively, denote the smallest possible value, the most promising value, and the largest possible value that describe a fuzzy event. When l=m=u, the TFN becomes just another non-fuzzy number by convention.
0.0
1.0
µM (x)
l m u
X
Fig. 1. Membership function of a triangular fuzzy number
Consider two triangular fuzzy numbers M1 and M2, M1 = (l1, m1, u1) and M2 = (l2, m2, u2), their operational laws are as follows (Chang, 1996):
1. (l1, m1, u1) ⊕ (l2, m2, u2) = (l1 + l2, m1 + m2, u1 + u2) (2) 2. (l1, m1, u1) ⊗ (l2, m2, u2) = (l1l2, m1m2, u1u2) (3) 3. (λ, λ, λ ) ⊗ (l1, m1, u1) = (λl1, λm1, λu1) (4) 4. (l1, m1, u1)-1 = (1/u1 ,1/m1 ,1/l1 ) (5)

3.3 Linguistics assessment A linguistic variable can be defined as a variable whose values are not numbers, but are words or sentences in natural or artificial language. The relative importance weights in the decision making process can be evaluated by linguistics terms such as very low, low, medium, high, and very high and so on. These linguistics terms can be quantified and expressed as TFNs using fuzzy set theory (Lin et al., 2006). The process of assigning membership functions to fuzzy variables is either intuitive or based on some algorithmic or logical operations. Intuition is simply derived from the capacity of experts to develop membership functions through their own intelligence and judgment (Ross, 1995). The successful use of a linguistics variable is highly dependent on the determination of a valid membership function. A number of different membership functions have been used in different applications such as robot selection (Liang and Wang, 1993), and measuring manufacturing competence (Azzone and Rangone, 1996) to name a few. Similar to the scale of 1-9 suggested by Saaty (1980), a scale of M1 to M5 has been defined in this research to represent triangular fuzzy numbers. This scale is tabulated in table 2 and depicted in figure 2.
Table 2 Linguistic terms for the importance weight of each criterion
Linguistic scale for importance Notation Triangular fuzzy scale
Triangular fuzzy reciprocal scale
Equally important M1 (1,1,1) (1,1,1) Weakly more important M2 (1, 3/2, 2) (1/2,2/3,1) Strongly more important M3 (3/2,2, 5/2) (2/5,1/2,2/3) Very strongly more important M4 (2,5/2,3) (1/3,2/5,1/2) Absolutely more important M5 (5/2,3,7/2) (2/7,1/3,2/5)
1 M1 M2 M3 M4 M5 µM (x) 0.5 X 0 1 3/2 2 5/2 3 7/2
Fig. 2. Membership functions of the linguistic values
3.4 Extent analysis Chang�s (1992, 1996) extent analysis: This analysis provides a general method of using crisp mathematical concepts to address fuzzy quantities. It determines the image of the object on the goal.
Let X = { 1x , 2x ,�, nx } be an object set, and U={ 1u , 2u ,�, nu }is a goal set. According to Chang�s method, each object is taken and extent analysis for each goal is performed, respectively. Now, if there are m objects for pair-wise comparison in a matrix, m extent analysis values for each object can be obtained as follows 1
giM , 2giM ,�, m
giM , i= 1,2,..,n, where all the jgiM (j = 1, 2� m) are triangular fuzzy numbers.
Step 1: In extent analysis, a synthetic evaluation of the hierarchy is made. The term �synthetic� denotes the process of evaluation, where several individual elements and components of a matrix are synthesized into an aggregate form. The value of fuzzy synthetic extent with respect to the ith object is defined as:

iS =
1
1 1 1
−
= = =∑ ∑∑
⊗
m
j
n
i
m
j
jgi
jgi MM , (6)
To perform jgi
m
j
M∑=1
, perform the fuzzy addition operation of m extent analysis values for a particular
matrix such that
jgi
m
j
M∑=1
=
∑ ∑∑
= ==
m
j
m
jj
m
jjj uml
1 11
(7)
and to obtain
1
1 1
−
= =
∑∑
n
i
m
j
jgiM , perform the fuzzy addition operation of j
giM (j=1,2,�,m) values such
that
∑∑==
m
j
jgi
n
i
M11
=
∑ ∑∑= ==
n
i
n
ii
n
iii uml
1 11
(8)
and then compute the inverse of the vector such that
1
1 1
−
= =
∑∑
n
i
m
j
jgiM =
∑ ∑∑= ==
n
i
n
ii
n
iii lmu
1 11, /1,/1,/1 (9)
Step 2: The degree of possibility of 1M ≥ 2M is defined as:
V ( 1M ≥ 2M ) = yx≥
sup )(),(min(21
yx MM µµ . (10)
When a pair ( x , y ) exists such that x ≥ y and )(1
xMµ = )(2
yMµ , the equality equation V ( 1M ≥ 2M ) =1 holds. Since 1M and 2M are convex fuzzy numbers (6) and (7) can be expressed as below:
V ( 1M ≥ 2M ) =1 if 1m ≥ 2m , (11) V ( 1M ≥ 2M ) = hgt ( 1M ∩ 2M ) = )(
1dMµ , (12)
where d is the ordinate of the highest intersection point D between 1Mµ and
2Mµ (see figure 3).
When 1M = ( 111 ,, uml ) and 2M = ( 222 ,, uml ), the ordinate of D is given by the following equation:
V ( 2M ≥ 1M ) = hgt ( 1M ∩ 2M ) =)()( 1122
21lmum
ul−−−
− (13)
Fig .3. Intersection point �d� between two fuzzy numbers M1 and M2
M1M2
l2 m2 l1 d u2 m1 u1
V (M2 ≥ M1)
1

To compare 1M and 2M we need both values of V ( 1M ≥ 2M ) and V ( 2M ≥ 1M ).
Step 3: The degree possibility of a convex fuzzy number to be greater than k convex fuzzy numbers iM (i= 1,2,�,k) can be defined by
V ( M ≥ 1M , 2M ,�, kM ) = V [( M ≥ 1M ) and ( M ≥ 2M and�and ( M ≥ kM )]
= min V ( M ≥ iM ) i= 1, 2, 3,..., k. (14)
Assume that: )( iAd ′ = min V ( iS ≥ kS ) (15)
For k=1,2,..,n; k ≠ i. Then, the weight vector is given by:
W ′ = TnAdAdAd ))(),...,(),(( 21 ′′′ , (16)
where iA (i=1,2,�,n) are n elements. Via normalization, the normalized weight vectors are:
W = ( TnAdAdAd ))(),...,(),(( 21 , where W is a non-fuzzy number. (17)
4. Performance Evaluation Analytic for Reverse Logistics (PEARL) Development 4.1 �PEARL� Framework The PEARL framework is shown in figure 4. The various elements in the framework are
1. Product information repository 2. Market information warehouse 3. Manager�s decision hub 4. Reverse supply chain Balanced scorecard (RSC-BSC) 5. RL key performance indicators database 6. RL process information repository 7. Performance analytic engine
Product information (lifecycle stage, sales data, latest return data and physical attributes data) and the market data (customer survey, environmental and regulatory data, and market status data) are inputs to manager�s decision hub which is responsible for developing the appropriate strategies based on the organizational goals and objectives. The decision hub interacts with the balance scorecard to develop measures and set targets from the four perspectives namely: Financial, Customer, Internal business and Innovation and Learning. Based on the feedback from the scorecard decision hub interacts with RL performance measurement database to develop and store some key performance indicators from the focus, basis, type, source and frequency dimensions. The RSC analytics together with the RL process information are supplied to the analytical engine to develop the RLOPI. Once the overall score is obtained, a sensitivity analysis (optional) can be performed to analyze how the system parameters are interacting with one another and benchmark with the competitors. The performance evaluation is fed back is to the manager�s decisions hub which takes the process improvement decisions and redesigns the strategies to improve the overall RL performance and reduce the gap in weak areas as compared to the competitors. The �PEARL� performance measurement system developed here is applied in three stages: 1. construction of the performance measurement hierarchy including the lifecycle stages, RL competitive strategies, RL process functions and the performance metrics; 2. developing the methodology and the steps of the algorithm to calculate RLOPI; 3. calculation of the relative importance weights of the interdependencies between the attributes; and calculating the RLOPI; 3. rating the firm�s performance across the industry and setting benchmarking standards. The following sections explain the above steps in building the model.

RL Performance Analytic Engine
Reverse Logistics Overall
Performance Index (RLOPI)
Product Attributes
data
Product Lifecycle
data
Product sales data
Latest return data
Product Information Repository
Customerperception
data
EnvironmentRegulatory
data
Market Information Warehouse
Market status data
Customer Perspective
Objective:Target:Initiatives:Measures:
Financial Perspective
Objective:Target:Initiatives:Measures:
Internal Business Perspective
Objective:Target:Initiatives:Measures:
Innovation and Learning Perspective
Objective:Target:Initiatives:Measures:
RSC-BSC
Firm�s RL mission
statement/goal
Managerial Decisions Hub
Firm�s RL objectives
Firm�s RL enabling strategies
Sensitivity Analysis and Performance Improvement Decisions
Sortin
g and S
toring
RL Process Information Repository
RL Key Performance Indicators (RLKPI)
Strategic
Operational
Responsive
Efficient
Internal
External
Subjective
Diagnostic
Monitoring
Objective
Focus
Basis
Frequency
Source
Type
Re-
distribution &
Transportatio
Gate-K
eeping
Collection
Asset
Recovery
Fig. 4. Performance Evaluation Analytic for Reverse Logistics (PEARL) Architectural Framework 4.2 Construction of the decision structure for the performance analytic engine Level 1: Of the complex and dynamic circumstances surrounding a consumer electronic firm, market and product characteristics provide the starting basis in developing the performance measurement model. Depending on the lifecycle stage of the product, the company must adopt competitive RL strategies to guide their priorities in their decisions, which are often complicated by the uncertainty of the product returns. Determining the lifecycle stage of a product and the variability of the returns are difficult. However, if this challenge is faced adequately, it becomes a critical piece for an adequate RL performance measurement system management (Serrato et al., 2003). The stage where a product is located in its lifecycle is significantly related to the product return rates. Competitive environments in consumer electronics have caused product lifecycle to continuously shrink, and hence it�s imperative that these companies consider the length of the product lifecycle and the variability of the returns to adopt appropriate strategies (Guide and Wassenhove, 2003). Level 2: Economic factors, legislation, corporate citizenship (de Brito and Dekker, 2003), and environmental and green issues (Rogers and Tibben-Lembke, 1999) are considered as the four main drivers of reverse logistics. Based on the importance of these drivers to an organization and their goals and objectives, the company must adopt a number of strategies to be successful in RL operations. This is easier said than done, and this aspect of developing the right strategy has been dealt by a number of authors in

recent years. This research is to measure the performance once the strategies are developed and implemented. For this study, some of the strategies identified, to be competitive in RL as 1. Improve customer satisfaction during returns; 2. New technology implementation; 3. Eco-compatibility; 4. Strategic alliance formation; 5. Knowledge management; and 6. Improve the value recovery process.
Reverse Logistics Functions
Overall Goal
RL Success Strategies
Gate keeping(GK)
Collection(CO)
Sorting(SO)
Storing(ST)
Asset Recovery (AR)
Re-Distribute &Transport (RDT)
• Gate-keeping percentage (GKP)
•Gate-keeping efficiency (GKE)
•Idle time of products at gatekeeping (IDP)
•Idle time of trucks at gatekeeping (IDT)
•Demand Forecasting accuracy (DFA)
•Returning customer ratio (RCR)
•Return percentage by product (RPP)
• Total average collection deviation (TACD)
• Number of employees under training (NET)
• Returns inventory build up rate (RBR)
• Rejection rate (RR)
• Cost accuracy (CA)
• FTE devoted to RL (ERL)
• Return volumes (RV)
•Costs of additional labor ( CAL)
•% of resources utilized by return products ( RPU)
•Capacity usage by returned products (CU)
•RMA processing cycle time (RCT)
•New packaging costs for disposition (PCD)
•Return inventory turns (RIT)
•Product traceability (PT)
•Inventory forecasting accuracy (IFA)
•Investment in new technologies and infrastructure (INT)
•Health and safety expenditures (HSE)
•Work in process of returned products (RWIP)
•Additional storage costs of returns (SCR)
•Returns carrying cost (RCC)
• Environmental Conformance of AR (ECAR)
• Recycling Fraction (RF)
• Obsolescence ration (OR)
• Value recovered (VR)
• Processing time accuracy (PTA)
• Number of products accuracy (NPA)
• Amount of disposal (AD)
• Quality of rework (QR)
• Return Shipment Cost (RSCO)
• Cost of retransport (CR)
• Standardization Index (SI)
• Cost of additional warehouse and Transportation (CAWT)
• Required Space accuracy (RSA)
• On time delivery ratio (OTDR)
Customer Satisfaction
(CS)
Reverse Logistics Performance Metrics
New Technology Implementation
(NT)
Eco-Compatability
(EC)Strategic
Alliances (SA)
Knowledge Management
(KM) Value Recovery
(VR)
Introduction(IN)
Growth(GR)
Maturity(MA)
Decline(DE)
Obsolete(OB)
Product Lifecycle Stage
Measure reverse logistics performance of a consumer electronics company (RLOPI)
Fig. 5. Graphical representation of the AHP/ANP model for developing RLOPI An argument could be made for various other strategies that can be adopted and the ANP model is flexible to incorporate other strategies. The lifecycle stage and the strategy are inter-dependent. The lifecycle stage determines what strategies to adopt and their relative importance. Similarly, the strategy adopted will determine which lifecycle stage needs more consideration. The ANP model is illustrated in figure 5. Level 3: The RL process functions include Gate-keeping, Collection, Sorting, Storing, Asset Recovery, and Re-distribute and transport. The strategies and functions are also interdependent. The importance of strategies differs for each RL function and vice versa. Moreover, there is an inter cluster relationship within

the RL process, as for each strategy the relative importance of the functions varies. The various clusters and their relationships are depicted in figure 6.
Fig. 6. Graphical representation of clusters and influence relationships of decision framework for measuring the reverse logistics performance in an electronics company
Level 4: The performance measures form the last level of the ANP model and these directly tie into their respective RL process. It should be born in mind that metrics should be dynamic, as they need to be updated and changed when needed. Once processes are improved, the frequency and type of metric measurement might change; possibly the metric will become unnecessary as improvements are institutionalized. The presence of good performance measures represents a major step in adopting a holistic approach to RL management. The organization cannot control its RL processes efficiently and effectively without having proper metrics. This research develops some performance measures from various dimensions as discussed in the PEARL framework. The relationship between the functions and their respective performance indicators can be represented in a two-level unidirectional hierarchical structure. Development of these measures varies as per the organizational goals and strategies. Most of the measures developed for this study are self-explainable and are included in the nomenclature. 4.3 �PEARL� Methodology (figure 7) Steps of the algorithm Step1: Construct a decision makers committee and determine the goals and objectives of the organization pertaining to reverse logistics Step2: Identify the lifecycle stages of the product mix of the organization, and determine the market status of the products (through market survey) Step 3: Identify the main drivers of returns in the consumer electronics industry, and analyze your current returns to evaluate your returns policy (through brainstorming and Delphi sessions) Step4: Identify the strategies to implement in order to be successful in reverse logistics Step 5: Develop the RSC-BSC and set targets and initiatives from four BSC perspectives Step 6: Determine appropriate performance measures supporting the overall goal and strategies from all dimensions (focus, basis, type, frequency, and source) Step 7: Determine the various RL functions within the organization and classify measures into each process Step 8: Establish the hierarchical AHP/ANP decision framework of various attributes depicting the various clusters and their interdependencies

Step 9: Develop super matrix using fuzzy AHP/ANP decision making approach 9.1 Choose the appropriate linguistics terms and express the opinion of the decision maker in linguistic form 9.2 Convert the linguistic information into fuzzy numbers using TFN 9.3 Form pair-wise matrices with respect to the inter and intra dependencies between the clusters 9.4 Evaluate the weights of each attribute based on their relationships in the hierarchy 9.5 Calculate the aggregate weights for each criterion 9.6 De-fuzzify the aggregate weights into crisp values 9.7 Form the super matrix and converge it to a high power to make it column stochastic
Step 10: Develop reverse logistics overall performance index 10.1 Determine the performance values at the measures for each RL function within the organization 10.2 Collect performance values at the measures for other firms within the industry 10.3 Categorize the performance within the electronics industry in the form of scales to assign performance ratings at the measures using �Likert� scales 10.4 Calculate the performance rating of the firm at the measures reflecting its relative position within the electronics industry 10.5 Calculate the performance score at the measure by using equation SmX = PRX * WmX * WFX 10.6 Determine RLOPI using equation RLOPI = ∑ PRX
Step 11: Sensitivity Analysis (Go back to step 9) Step 12: Identify strength and weakness areas Step 13: Benchmark with industry competitors (Go to Step 4 with the performance feedback and process improvement decisions) Step 14: Stop

1. Construct a decision makers committee and determine the goals and objectives of the organization
pertaining to reverse logistics
2. Identify the lifecycle stages of the product mix of the organization, and determine the market status of the
products
4. Identify the strategies to implement in order to be successful in reverse logistics
3. Identify the main drivers of returns in the consumer electronics industry, and analyze your current returns to
evaluate your returns policy
5. Develop the RSC-BSC and set targets and initiatives from the four perspectives
6. Determine the appropriate performance measures supporting the overall goal and strategies from all
dimensions (focus, basis, type , frequency, and source)
7. Determine the various RL functions within the organization and classify measures into each process
8. Establish the hierarchical AHP/ANP decision framework of various attributes depicting the various
clusters and their interdependencies
9. Develop super matrix using fuzzy AHP/ANP decision making approach
9.1 Choose the appropriate linguistics terms and express the opinion of the decision maker in linguistic form 9.2 Convert the linguistic information into fuzzy numbers using TFN 9.3 Form pair-wise matrices with respect to the inter and intra dependencies between the clusters 9.4 Evaluate the weights of each attribute based on their relationships in the hierarchy 9.5 Calculate the aggregate weights for each criterion 9.6 De-fuzzify the aggregate weights into crisp values9.7 Form the super matrix and converge it to a high power to make it column stochastic
10. Develop reverse logistics overall performance index
10.1 Determine the performance values at the measures for each RL function within the organization 10.2 Collect performance values at the measures for other firms within the industry 10.3 Categorize the performance within the electronics industry in the form of scales to assign performance ratings at the measures using �Likert� scales 10.4 Calculate the performance rating of the firm at the measures reflecting it�s relative position within the electronics industry 10.5 Calculate the performance score at the measure by using equation S mX = PRX * WmX * WFX10.6 Determine RLOPI using equation RLOPI = ∑ PRX
11. Sensitivity Analysis (by changing weights at different or within levels of the
hierarchy
Stop
12. Identify strength and weakness areas
13. Benchmark with industry competitors
Performance feedback and process
improvement decisions
Conducting market survey
Conducting Delphi process
Fig. 7. Methodology for the proposed PEARL framework
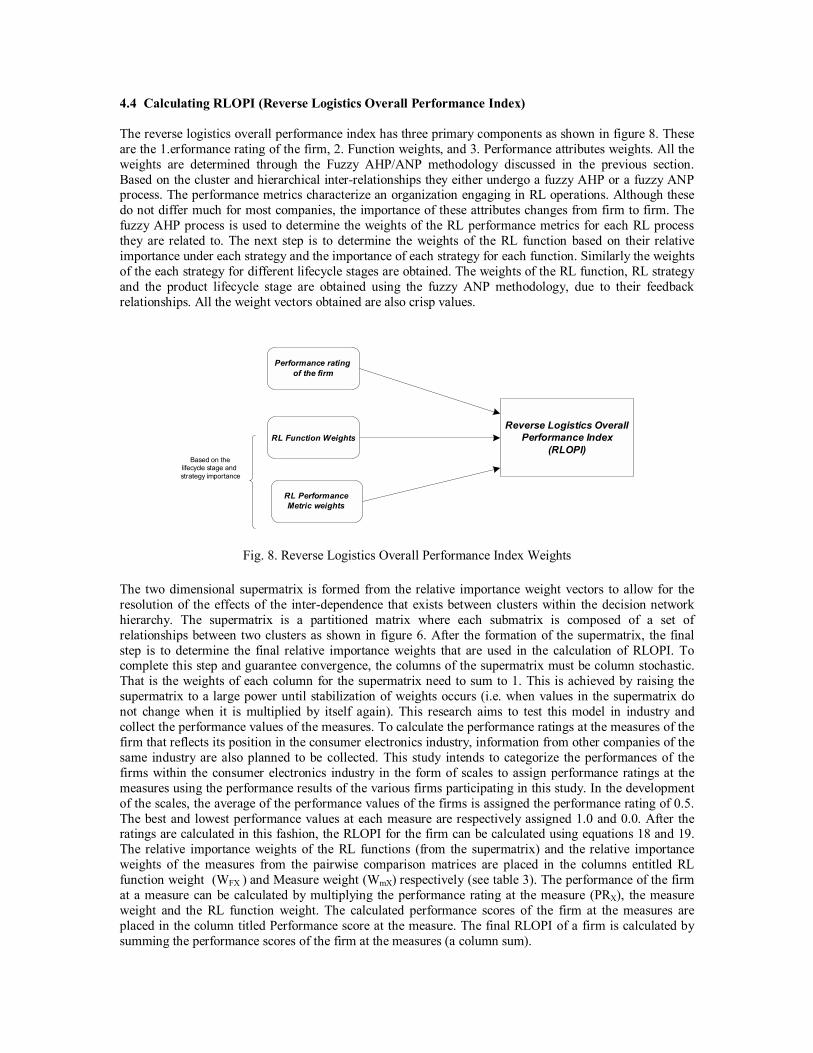
4.4 Calculating RLOPI (Reverse Logistics Overall Performance Index) The reverse logistics overall performance index has three primary components as shown in figure 8. These are the 1.erformance rating of the firm, 2. Function weights, and 3. Performance attributes weights. All the weights are determined through the Fuzzy AHP/ANP methodology discussed in the previous section. Based on the cluster and hierarchical inter-relationships they either undergo a fuzzy AHP or a fuzzy ANP process. The performance metrics characterize an organization engaging in RL operations. Although these do not differ much for most companies, the importance of these attributes changes from firm to firm. The fuzzy AHP process is used to determine the weights of the RL performance metrics for each RL process they are related to. The next step is to determine the weights of the RL function based on their relative importance under each strategy and the importance of each strategy for each function. Similarly the weights of the each strategy for different lifecycle stages are obtained. The weights of the RL function, RL strategy and the product lifecycle stage are obtained using the fuzzy ANP methodology, due to their feedback relationships. All the weight vectors obtained are also crisp values.
Reverse Logistics Overall Performance Index
(RLOPI)
Performance rating of the firm
RL Function Weights
RL Performance Metric weights
Based on the lifecycle stage and strategy importance
Fig. 8. Reverse Logistics Overall Performance Index Weights
The two dimensional supermatrix is formed from the relative importance weight vectors to allow for the resolution of the effects of the inter-dependence that exists between clusters within the decision network hierarchy. The supermatrix is a partitioned matrix where each submatrix is composed of a set of relationships between two clusters as shown in figure 6. After the formation of the supermatrix, the final step is to determine the final relative importance weights that are used in the calculation of RLOPI. To complete this step and guarantee convergence, the columns of the supermatrix must be column stochastic. That is the weights of each column for the supermatrix need to sum to 1. This is achieved by raising the supermatrix to a large power until stabilization of weights occurs (i.e. when values in the supermatrix do not change when it is multiplied by itself again). This research aims to test this model in industry and collect the performance values of the measures. To calculate the performance ratings at the measures of the firm that reflects its position in the consumer electronics industry, information from other companies of the same industry are also planned to be collected. This study intends to categorize the performances of the firms within the consumer electronics industry in the form of scales to assign performance ratings at the measures using the performance results of the various firms participating in this study. In the development of the scales, the average of the performance values of the firms is assigned the performance rating of 0.5. The best and lowest performance values at each measure are respectively assigned 1.0 and 0.0. After the ratings are calculated in this fashion, the RLOPI for the firm can be calculated using equations 18 and 19. The relative importance weights of the RL functions (from the supermatrix) and the relative importance weights of the measures from the pairwise comparison matrices are placed in the columns entitled RL function weight (WFX ) and Measure weight (WmX) respectively (see table 3). The performance of the firm at a measure can be calculated by multiplying the performance rating at the measure (PRX), the measure weight and the RL function weight. The calculated performance scores of the firm at the measures are placed in the column titled Performance score at the measure. The final RLOPI of a firm is calculated by summing the performance scores of the firm at the measures (a column sum).

Performance Score at the RL measure: SmX = PRX * WmX * WFX where X refers to the company (18) Reverse Logistics Overall Performance Index: RLOPI = ∑ SmX (19) Figure 9 is a graphical representation of an input/output model of the RLOPI. Once the RLOPI is computed several analysis calculations are computed. This research aims to use excel in developing a package for ease of use in organizations to compute the index. The firms can perform a sensitivity analysis to determine which RL function or performance metric when changed in weights yields the largest positive or negative impact on the RLOPI. The firm can assess its strength and weakness areas and prioritize process improvement projects on the weak areas. Since the results are quantitative, managers can evaluate how each attribute level affects the performance most significantly. The system has built in flexibility to allow any attributes changes, or weights changes and recalculate the RLOPI, which is a numerical score representing an organization�s overall reverse logistics capabilities. All data development and calculations are planed to be accomplished in Microsoft Excel to automate the matrix algebra steps and provide dynamic formulas that are easy to change. This will allow the tool to be developed in a package that is accessible to all and with utmost ease of use. A facilitator�s interview guide is in the process of development to collect the necessary information to complete the RLOPI. The questionnaire will be used to collect information required to weight the different strategies, lifecycle stages, functions and the metrics. The Excel file will contain all the necessary pairwise comparison matrices and calculations required to compute and optimize the RLOPI. Data collected during the interview process will be fed into the Excel spreadsheets to perform all the required matrix manipulations. This arrangement allows a facilitator to work through the RLOPI, with little background knowledge of the fuzzy AHP/ANP process theory.
Input Process Input/ Process Output/ Output Input
Product Lifecycle stagesReverse Logistics
Drivers
Reverse Logistics Balanced
Scorecard Reverse Logistics Functions
Reverse Logistics Competitive Strategies
Reverse Logistics Performance
Metrics
Reverse Logistics Goal(s)
Fuzzy Analytical Network process
Fuzzy Analytical Network process
Fuzzy Analytical Hierarchy processMarket Data
Reverse Logistics
Performance Index
Strategy and RL function weights
RL Metric weights
Strength and weakness areas
Benchmarking within industry
Process Improvement areas
Sensitivity Analysis
Fig. 9. Reverse Logistics Overall Performance Index Input/Output diagram

Com
pani
es
Perf
orm
ance
Rat
ing
acro
ss e
lect
roni
cs
indu
stry
(PR
X)
Mea
sure
Wei
ght
(Wm
X)
RL
Fun
ctio
n
Wei
ght (
WFX
) Pe
rfor
man
ce sc
ore
at th
e m
easu
re
(S m
X)
C-1
C-2
C-3
C-4
PR-1
PR
-2
PR-3
PR
-4
G
K
G
KP
G
KE
ID
P
IDT
D
FA
RC
R
RPP
C
O
TA
CD
RB
R
RR
C
A
ER
L
RV
N
ET
SO
RPU
CU
RC
T
PCD
RIT
PT
CA
L
ST
IF
A
IN
T
HSE
RWIP
SCR
RC
C
AR
ECA
R
RF
O
R
VR
PT
A
N
PA
A
D
Q
R
RD
T
RSC
O
CR
SI
C
AW
T
RSA
OTD
R
R
LO
PI =
∑ S
mX
Tabl
e 3
Cal
cula
tion
of th
e Re
vers
e Lo
gist
ics O
vera
ll Pe
rfor
man
ce In
dex
(RLO
PI)

5. Conclusions and Future Research The complexities associated with handling reverse supply chain operations are multi-faceted � namely uncertainties associated with the quality, quantity and the timing of returns. These coupled with stringent environmental regulations are making companies struggle in handling their reverse logistics operations. But, on the flip side there are a lot of profit making and corporate image development opportunities that cannot be neglected. This research intends to develop a methodology/framework for improving the overall performance in reverse logistics. The proposed PEARL framework is an integrated performance evaluation model incorporating qualitative assessment tools such as BSC and also quantitative tools such as ANP to develop a single overall performance index that aids top management in measuring their RL performance towards their organizational goals and strategies. The application of ANP in the model provides the user with a more accurate and realistic performance score by considering all the interdependencies and feedbacks associated with the decision making process. Moreover, the application of fuzzy logic in the decision making process helps in negating the vagueness associated with the human assessment in real world. In a possible application of the model, a firm engaging in reverse logistics operations can gauge its overall performance, detect its strength and weakness areas through a sensitivity analysis, benchmark with its competitors, and develop necessary programs to close the performance gaps in the weak areas. The model will help the managers in assessing which measures and RL functions are supporting the strategies and the overall goals of the organizations. The advantages of this approach are its flexibility in introducing different kinds of measures and strategies that are applicable at different lifecycle stages of the products in the market. On the other hand, a disadvantage of the ANP approach is that the identification of relevant attributes, determining their relative importance in the selection process and combining them to get a single RLOPI requires extensive brainstorming sessions and the accumulation of expertise within the organization. Moreover, it requires numerous calculations and formation of pair-wise comparison matrices, and hence one has to keep track of the comparisons carefully. Future research propositions can be to incorporate the framework into a software tool like excel for ease of use in organizations, extend the framework to incorporate more feedbacks and interdependencies. The model is still conceptual at this time and a lot of further analysis is needed. Moreover, the model is not complete until tested in industry and plans are being made to complete this phase of the research. This template was developed specifically to suit the likes of consumer electronics industry. There are some features that could possibly be applicable to another industry. Research should be undertaken to develop and corroborate the template across a range of industries. Also field studies / surveys can be undertaken to extend the list of performance measures to capture more specific indicators in consumer electronic industry. References Agarwal, A., & Shankar, R. (2003), �On-line trust building in e-enabled supply chain�, Supply Chain Management: An International Journal, 8(4), 324�334 Ahmed, A., and Abdalla, H., (2002), �An intelligent system for performance measurement selection�, Proceedings of the Institution of Mechanical Engineers, 216(4), pp 591-606 Andersen, A. (2002), �Performance management: Don�t build your own�, Manufacturing Systems (MSI), 20(11), pp 15-18 Azhar, T. M., and Leung, L. C., (1993), �A multi-attribute product life-cycle approach to replacement decisions: an application of Saaty's system-with feedback method�, Engineering Economist, 38, pp. 321 344 Azzone, G. and Rangone, A., (1996), �Measuring manufacturing competence: a fuzzy approach�, International Journal of Production Research, 34 (9), pp. 2517-2532 Beamon, B. M. (1999), �Designing the green supply chain�, Logistics Information Management, 12(4), pp.332-342 Berry, D., Towill D.R., and Wadsley, N. (1994), �Supply chain management in the electronics products industry�, International Journal of Physical Distribution and Logistics Management, 24(10), pp. 20-32

Blackburn, J.D., Guide, V.R., Souza, G.S., and Vassenhove, V. L. (2004), �Reverse Supply Chains for commercial returns�, California Management Review, 46(2), pp. 6-22 Bozdag, C.E., Kahraman, C. and Ruan, D., (2003), �Fuzzy group decision making for selection among computer integrated manufacturing systems�, Computers in Industry, 51, pp. 13�29 Brewer, P. C., & Speh, T. W. (2000), �Using the balanced scorecard to measure supply chain performance� Journal of Business Logistics, 21(1), pp. 75�93. Buckley, J.J., (1985), �Fuzzy hierarchical analysis�, Fuzzy Sets and Systems, 17 (3), pp. 233�247 Buyukozkan, G., Kahraman, C., Ruan, D., (2004), �A fuzzy multi-criteria decision approach for software development strategy selection�, International Journal of General Systems, 33 (2�3), pp. 259�280 Canada, J. R. and Sullivan, W. G., (1989), �Economic and Multi-Attribute Evaluation of Advanced Manufacturing Systems�, Englewood Cliffs: Prentice-Hall Carter, C., & Ellram, L. (1998), �Reverse logistics: A review of literature and framework for future investigation�, Journal of Business Logistics, 19(1), pp 85�102. Chang, D.Y., (1992), �Extent Analysis and Synthetic Decision, Optimization Techniques and Applications�, World Scientific, Singapore, 1, pp. 352 Chang, D.Y., (1996), �Applications of the extent analysis method on fuzzy AHP�, European Journal of Operational Research, 95, pp.649�655. Cheng, C.-H., Yang, K.-L., Hwang, C.-L., (1999), �Evaluating attack helicopters by AHP based on linguistic variable weight�, European Journal of Operation al Research, 116 (2), pp. 423�435 Cheng, E. W. L. and Li, H., (2001), �Analytic hierarchy process an approach to determine measures for business performance�, Measuring Business Excellence, 5, pp. 30-36 Chung, S.H., Lee, A.H. and Pearn, W.L., (2005), �Product mix optimization for semiconductor manufacturing based on AHP and ANP analysis�, The International Journal of Advanced Manufacturing Technology, 25, pp. 1144�1156 Daugherty, P. J., Myers, M. B., & Richey, R. G. (2002), �Information support for reverse logistics: The influence of relationship commitment�, Journal of Business Logistics, 23(1), pp. 85�106. de Brito, M.P. and Dekker, R. (2003), �A framework for reverse logistics�, ERIM report series research in Management, https://ep.eur.nl/retrieve/439/ERS-2003-045-LIS.pdf de Brito, M.P., Flapper, S.D., and Dekker, R. (2002), �Reverse logistics: A review of case studies�, White Paper, Erasmus University, Rotterdam. Deng, H., (1999), �Multi-criteria analysis with fuzzy pairwise comparison�, International Journal of Approximate Reasoning, 21 (3), pp. 215�231 Dowlatshahi, S. (2000), �Developing a theory of reverse logistics�, Interfaces, 30(3), pp. 143�154. Dubois, D. and Prade, H. (1986), �Fuzzy sets and statistical data�, European Journal of Operational Research, 25, pp. 345-356 Electronics Recycling Industry Report (2005), International Association of Electronics Recyclers http://www.electronicsrecycling.com Emblemsvag, J. and Tonning, L., (2003), �Decision support in selecting maintenance organization�, Journal of Quality in Maintenance Engineering, 9, pp. 11�24 Environment protection Agency (EPA) (2001). Electronics: A new opportunity for waste prevention, reuse, and recycling. http://www.epa.gov/epr Fleischmann, M., Krikke, H.R., Dekker, R., Flapper, S.D. (2000), �A characterization of logistics networks for product recovery�, Omega, 28, pp 653-666 G.S. Liang, M.J.J. Wang, (1993), �A fuzzy multi-criteria decision making approach for robot selection�, Robotics & Computer - Integrated Manufacturing, 10 (4), pp. 267-274 Griffis, E. Stanely, Cooper, Martha, Goldsby, J. Thomas and Closs, J., (2004), �Performance Measures: Measure Selection based upon firm goals and information reporting needs�, Journal of Business Logistics, 25(2), pp. 95 � 118 Guide, D. R. and van Wassenhove, L. N. (2003), �Business Aspects of Closed-Loop Supply Chains�, Business Aspects of Closed-Loop Supply Chains. Exploring the issues. pp. 17-42. Gunasekaran, A., Patel, C., McGaughey, R. E., (2004), �A framework for supply chain performance measurement�, International Journal of Production Economics, 87, pp. 333-347 Hamalainen, R.P., Seppalainen, T.O., (1986), �The analytic network process in energy policy planning�, Socio-Economic Planning Sciences, 20 (6), pp. 399�405 Hillegersburg, J., Zuidwijk, R., van Nunen, J., and van Eijk, D. (2001), �Supporting return flows in the supply chain�, Communications of the ACM, 44(6), pp. 74�79.

Jayaraman, V., Guide, V. D. R., & Srivastava, R. (1999), �A closed-loop logistics model for use within a recoverable manufacturing environment�, Journal of Operational Research Society, 50(5), pp. 497�509. Kahraman, C., Cebeci, U. and Ruan, D., (2004), �Multi-attribute comparison of catering service companies using fuzzy AHP: the case of Turkey�, International Journal of Production Economics, 87, pp. 171�184 Kaplan, R. S., and Norton, D. P. (1992), �The balanced scorecard�Measures that drive performance� Harvard Business Review, 70(1), pp. 71�79. Karsak, E. E. and Tolga, E., (2001), �Fuzzy multi-criteria decision making procedure for evaluating advanced manufacturing system investments�, International Journal of Production Economics, 69, pp. 49-64 Kaufmann, A. and Gupta M. M., (1991), �Introduction to fuzzy arithmetic theory and applications�, New York: Van Nostrand Reinhold Kaufmann, A. and Gupta, M. M., (1988), �Fuzzy mathematical model in engineering and management science�, Elsevier: Amsterdam Kokkinaki, A. I., Dekker, R., Lee, R., & Pappis, C. (2001), �Integrating a web-based system with business processes in closed loop supply chains�, Econometric Institute EI 2001-31, http://hdl.handle.net/1765/607 Laarhoven, P.J.M., Pedrycz, W., (1983), �A fuzzy extension of Saaty�s priority theory�, Fuzzy Sets and Systems, 11 (3), pp. 229�241 Lee, H., Kwak, W., and Han, L., (1995), �Developing a business performance evaluation system: an analytic hierarchical model�, Engineering Economist, 40, pp. 343-356 Lee, J.W., Kim, S.H., (2000), �Using analytic network process and goal programming for interdependent information system project selection�, Computers & Operations Research, 27, pp. 367�382 Lefley, F. and Sarkis, J., (2005), �Applying the FAP model to the evaluation of strategic information technology projects�, International Journal of Enterprise Information Systems, 1, pp. 69�90. Leung, L.C., Cao, D., (2000), �On consistency and ranking of alternatives in fuzzy AHP�, European Journal of Operational Research, 124, pp.102�113 Lin, H. Y., Hsu, P. Y., and Sheen, G. J., (2006), �A fuzzy based decision making procedure for data warehouse system selection�, Expert Systems with applications Marien, E. J. (1998), �Reverse logistics as competitive strategy�, Supply Chain Management Review, 34(2), pp. 43�52. Meade, L., and Sarkis, J. (2002), �A conceptual model for selecting and evaluating third-party reverse logistics providers�, Supply Chain Management: An International Journal, 7(5), pp. 283-295 Meade, L.M., Liles, D.H., and Sarkis, J., (1997), �Justifying strategic alliances and partnering: a prerequisite for virtual enterprising�, Omega, 25, pp. 29-42 Meade. L. M. and Sarkis, J., (1999), �Analyzing project alternatives for agile manufacturing processes: an analytical network approach�, International Journal of Production Research, 37, pp. 241-261 Mohanty, R. P., Agarwal, R., Choudhury, A. K., and Tiwari, M. K., (2005), �A fuzzy based approach to R&D project selection: a case study�, International Journal of Production Research, 43(24), pp. 5199-5216 Muller, J., Griese, H., Middendorf, A., and Reichl, H. (1997), �Towards a better closed loop economy for electronic products: information management between manufacturers and recyclers�, Proceedings from IEEE symposium on electronics and the environment, pp. 167-171 Murphy, P., (1986), �A preliminary study of transportation and warehousing aspects of reverse distribution�, Transportation Journal, 34(1), pp. 48�56. Nagel, C., & Meyer, P. (1999), �Caught between ecology and economy: End-of-life aspects of environmentally conscious manufacturing�, Computers and Industrial Engineering, 36(4), pp 781�792. Rangone, A., (1996), �An analytical hierarchy process framework for comparing the overall performance of manufacturing departments�, International Journal of Operations and Production Management, 16, pp. 104-119 Ravi, V., Shankar, R., Tiwari, M.K. (2005), �Analyzing alternatives in reverse logistics for end of life computers: ANP and balanced scorecard approach�, Computers and Industrial Engineering. 48, pp 327-356 Reiss, H. (2003) Personal communication with the authors, Vice-President and General Manager, Equipment Manufacturing and Remarketing, Hewlett-Packard Co. Rogers, D. S., & Tibben-Lembke, R. S. (1999), �Going backwards: Reverse logistics trends and practices�, Reverse Logistics Executive Council, University of Nevada, Reno, NV, pp.14 Ross, T. J, (1995), �Fuzzy Logic with Engineering Applications�, McGraw-Hill, New York Saaty, T. L. (1999), �Fundamentals of the analytic network process�, Kobe, Japan: ISAHP

Saaty, T. L. and Alexander, J. M., (1981), �Thinking with Models: Mathematical Models in the Physical, Biological and Social Sciences�, Oxford: Pergamon Saaty, T.L., (1980). �The Analytic Hierarchy Process�, McGraw-Hill, New York. Saaty, T.L., (1996), �Decision Making with Dependence and Feedback: The Analytic Network Process�, RWS Publications, Pittsburgh. Saaty, T.L., Takizawa, M., (1986), �Dependence and independence: From linear hierarchies to nonlinear networks�, European Journal of Operational Research, 26, 229�237 Sarkis, J., & Sunderraj, R. (2002), �Hub location at Digital Equipment Corporation: A comprehensive analysis of qualitative and quantitative factors�, European Journal of Operational Research, 137, pp. 336�347 Serrato, M., Ryan, S. M., and Gaytan, J. (2003), �Characterization of reverse logistics networks for outsourcing decisions�, White paper, Iowa State University. Souza, C. G., Guide, V. D. R., Wassenhove, L. N. V., and Blackburn, J. D. (2005), �Time value of commercial product returns�, Decision and Information Technology Research Works. Stock, J. (1992), �Reverse logistics�, Oak Brook, IL, Council of Logistics Management. Stock, J. R. (1998), �Development and implementation of reverse logistics programs�, Council of Logistics Management, Oak Brook, IL. Thierry, M. C. (1997). An analysis of the impact of product recovery management on manufacturing companies. PhD thesis. The Netherlands: Erasmus University Rotterdam. Thrikutam, P. and Kumar, S., (2004), �Turning returns management into a competitive advantage in hi-tech manufacturing�, Infosys Viewpoint. Toktay, L.B., Van Der Laan, E., de Brito, M.P. (2004), �Managing product returns: the role of forecasting�, REVLOG, pp 45-64 Tran, L.T.C., Knight, G., O�Neill, R.V. and Smith, E.R., (2004), �Integrated environmental assessment of the mid-Atlantic region with analytical network process�, Environmental Monitoring and Assessment, 94, pp. 11�24 Wabalickis, R. N., (1987), �Justification of FMS with the analytic hierarchy process�, Journal of Manufacturing Systems, 7, pp. 175 182 Weber, S. F., (1993), �A modified analytic hierarchy process for automated manufacturing decisions�, Interfaces, 23, pp. 75-84 Wheelwright, S. C. (1978), �Reflecting corporate strategy in manufacturing decisions�, Business Horizons, 21, pp. 57�66. White, C. D., Masanet, E., Rosen, C. M., and Beckman, S. L. (2003), �Product recovery with some byte: An overview of management challenges and environmental consequences in reverse manufacturing for the computer industry�. Journal of Cleaner Production, 11, pp. 445�458. Zadeh, L., (1965). �Fuzzy sets�, Information Control 8, pp. 338�353. Zhu, K.J., Jing, Y. and Chang, D.Y., (1999), �A discussion on extent analysis method and applications of fuzzy AHP�, European Journal of Operational Research, 116, pp. 450�459