an analytical study of selected fruit and vegetable …explains the selection of four representative...
TRANSCRIPT

An Analytical Study of Selected Fruit and Vegetable Value Chains in Samoa
Edwin Tamasese
December 2009
AAACP Paper Series – No. 11
ALL ACP AGRICULTURAL COMMODITIES PROGRAMME
Food and Agriculture Organization of the United Nations

2
Acknowledgements
This document has been prepared as a contribution to the All ACP Agricultural Commodities Programme with funding from the European Union. The author would like to acknowledge: The Food and Agriculture Organization of the United Nations (FAO), for commissioning this study as a contribution to the development and implementation of the Samoan Fruit and Vegetables Sector Strategy. The Samoa Ministry of Agriculture for the valuable gross margin information and provision of time for interviews and insights into the status of the sector. Women in Business Development Inc. for allowing the survey of their farmers and the provision of transport in this regard. Jamie Morrison and Federica Angelucci of FAO’s Trade and Markets Division, Rome, for their contribution, reviews and assistance in compiling this study.
List of Acronyms AAACP All ACP Agricultural Commodities Programme CBS Central Bank of Samoa CIF Cost, Insurance, Freight DBS Development Bank of Samoa FVSS Fruit and Vegetable Sector Strategy HTFA High Temperature Forced Air ITC International Trade Centre MAF Ministry of Agriculture and Fisheries PITIC Pacific Islands Trade and Investment Commission PSSF Private Sector Support Facility SBEC Small Business Enterprise Sector SPBD South Pacific Business Development SROS Scientific Research Organisation Samoa UNDP United Nations Development Programme USP University of the South Pacific

3
Table of Contents Acknowledgements .......................................................................................... 2 List of Acronyms .............................................................................................. 2 Table of Contents ............................................................................................. 3 Executive summary .......................................................................................... 4 1. Introduction ............................................................................................... 6 2. Selecting representative fruit and vegetable products .............................. 8
2.1 Overview of key trends in production, consumption, trade, and prices ... 8 2.2 Categorising representative fruit and vegetable products .................... 15
3. Mapping the value chains .......................................................................... 17 4. Analysis of selected value chains .............................................................. 19
4.1 Papaya ................................................................................................. 19 4.2 Breadfruit .............................................................................................. 32 4.3 Head Cabbage .................................................................................... 43 4.4 Tomatoes ............................................................................................. 48
5. Categorisation of priority constraints ......................................................... 57 6. Informing the design of implementable activities ....................................... 61
6.1 Input supply .......................................................................................... 61 6.2 Production ............................................................................................ 61 6.3 Processing ............................................................................................ 61 6.4 Marketing .............................................................................................. 62 6.5 Finance................................................................................................. 62
7. Links to the FVSS implementation plan ..................................................... 62

4
An analytical study of selected fruit and vegetable value chains in Samoa
Executive summary This study was commissioned to identify and evaluate the relative importance of the key constraints faced by stakeholders involved in the development of representative fruit (papaya and breadfruit) and vegetable (head cabbage and tomatoes) value chains in Samoa. It is intended to serve as a basis for developing implementable activities in support of the Fruit and Vegetable Sector Strategy (FVSS) initiated under the EU funded All ACP Agricultural Commodities Programme (AAACP). Although an original objective of the study was to consider the constraints facing different categories of farmers, the absence of data on key areas of production and marketing made this impossible. Therefore, the study attempts to describe and analyse “generic” chains for each of four representative fruits and vegetables, which are conceptualised on the basis of a set of assumptions related to the costs and returns associated with new investments in the production of the key crops on a relatively small, albeit commercial scale Utilizing a combination of value chain mapping techniques and gross margin analysis, the study attempts to identify the relative importance of the different constraints by estimating the value lost to the chain as a result of the existence of these constraints. Although the estimated values are conditioned by the assumptions made, when supplemented with targeted surveys of key stakeholders, they provide a guide to the categories of constraint that are most likely to hinder the development of the respective value chains. The relative importance of the different constraints within each category differs by crop type and this gives an indication as to where to target initial activities so as to ensure an appropriate and sequential alleviation of constraints. For the fruits (papaya and breadfruit) export markets have the potential to provide an opportunity for increased returns to production. However, these opportunities are severely constrained by (i) the lack of consistent quality volumes of fruit to take advantage of sea freight options which would significantly reduce costs, and (ii) the lack of current capacity to treat fruit for export. For breadfruit, significant value added opportunities exist in domestic markets and for papaya, potentially in substituting for temperate fruit imports especially to tourism related market segments. These domestic market opportunities may provide a more viable option for increasing returns in the short run while initiatives to address the significant constraints to export are
5
addressed. However, constraints to production (land suitability for papaya, availability of seedlings and harvest equipment) require further assessment, particularly in light of the difficulties in securing financing to cover investment and working capital requirements. For the vegetable products (head cabbage and tomatoes) by contrast, significant returns to investment for supply to domestic markets are suggested by gross margin analysis. Although financing may prove to be a less demanding constraint than for the fruit crops, success is however, reliant upon adequate supply of production inputs and upon the market price achieved. Both aspects require improved provision of information and a degree of coordination. On the basis of these findings, the study suggests activities that are in line with the Fruit and Vegetable Sector Strategy designed under the EU funded All ACP Agricultural Commodities Programme. In presenting detailed and up to date gross margin analyses, the study also contributes to filling the significant data gap identified during the process of strategy development and could serve as a basis for more in depth feasibility studies of activities foreseen in the FVSS implementation plan. The gross margin analyses used in this study are attached as embedded spreadsheets in Annex 1. This allows the reader to alter assumptions and to conduct further analysis as required.

6
1. Introduction During the first half of 2009, stakeholders involved in the production, processing and marketing of fruits and vegetables in Samoa participated in a process of sector diagnosis and strategy development. The output of the process was a strategy document and associated implementation plan which listed priority areas for interventions aimed at alleviating critical constraints to the further development of the sector. A critical deficiency, recognised throughout the development of the strategy and associated implementation plan, is the limited understanding of the current functionality of individual fruit and vegetable product value chains, a deficiency made more problematic by the dearth of available information of key parameters such as production levels, prices, and on domestic and overseas market demand. In order for specific activities to be developed in support of the operationalisation of the implementation plan, a much improved understanding of the existing value chain structure and the constraints to their improved functionality, and in particular how the chains involve and affect smallholder producers, is required. Specifically, and in line with the implementation plan, this improved understanding will be required to:
(i) determine key market intelligence requirements (ii) contribute to the assessment and appropriate design of post harvest
service provision (iii) support the assessment of financing requirements of chain
stakeholders and the determination of appropriate mechanisms for improving access to finance
(iv) identify other key constraints to the improved functioning of these chains.
The objectives of this study are therefore to:
• identify representative fruit and vegetables for analysis • develop product specific value chain maps, depicting key activities and
actors and populated with available information on production, trade and marketing activities
• on the basis of the maps, to identify critical constraints to value chain development, including key deficiencies in information availability
• assess alternative potential activities in support of the implementation of specific components of the Fruit and Vegetables Sector Strategy (FVSS) and which address the key constrains to sector development.
7
This report is structured in line with the objectives specified above. Section 2 explains the selection of four representative fruit and vegetable products for further analysis, first providing an overview of the current patterns of fruit and vegetable production and trade, and then developing a basic categorisation of products from which representative products are selected for further analysis. In Section 3, the rationale for the approach taken to value chain mapping, and the use of gross margin analysis in identifying the relative importance of selected constraints is set out. In Section 4, maps are developed for each of the selected products with a view to providing a visual description of the key activities and the relationships between the activities and actors involved. A series of “decision diamonds” are used as the basis for discussing key activities and relationships in the chains and for utilising the results of the gross margin analyses. Section 5 attempts to highlight generic constraints to chain development, and to elaborate some of the more specific issues related to constraints to service provision in support of improved sector performance. On the basis of the analysis, Section 6 provides suggestions as to the types of activities that need to be implemented and finally, Section 7 provides initial indications as to how these could be developed within the framework of the FVSS implementation plan.

8
2. Selecting representative fruit and vegetable products In this section, the rationale for the selection of four representative fruit and vegetable products is explained. Publicly available data on production levels and on the quantities and values of imports and exports are used to provide a brief overview of the structure of the fruits and vegetables sector, with a view to allowing a categorisation of individual products in terms of their production, trade and market status.
2.1 Overview of key trends in production, consumpti on, trade, and prices
2.1.1 Data availability and quality The data used in this section are subject to significant limitations, but are deemed sufficient to provide a rough guide to the selection of representative products for further study.
• Production data on selected fruit and vegetable products are available from FAOSTAT. However, it should be noted that in the absence of recent data collection, official data has not been provided since 2002. All values provided in FAOSTAT post-2002 are therefore estimates or forecasts.
• Trade data, since it is easier to collate, is available for a greater
range of products and for more recent years. Import data from customs is available on each consignment of fruit and vegetables (by tariff line and country of origin). It is also available on a monthly basis by tariff line. Export data in the FAOSTAT and ITC Trade Maps data sets is limited to aggregate tariff lines (eg Fruit juices, or Vegetables not otherwise specified) and is only available to 2005. More recent data from the Central Bank of Samoa is therefore used to illustrate trends in exports and imports for specific products.
• Although central market (Fugalei) data on prices and quantities
supplied are available on a monthly basis from 2000, these are only collated for selected vegetables (not fruits) in CBS publications. The vegetables monitored are: Chinese Cabbage, Head Cabbage, Cucumber, Tomatoes and Pumpkin.
2.1.2 Production Data on the production, yields and area harvested of fruits and particularly of vegetables in Samoa is limited. The most recent comprehensive data collection exercise from which data was reported was the 2002 Agricultural

9
census1. Since then, the data in the FAOSTAT database have been estimated/forecast using technical judgement. However, in most cases, as illustrated in the following graph of production levels of selected fruits, data for 2002-2007 are identical to data provided in 2002. In other words an assumption of no production growth (or decline) has been made. In addition, there is no systematic information available on the proportion of production that is marketed as opposed to home consumed. Data from the 1999 Agricultural census suggest that although 75% of the population belong to just under 15000 agriculturally active households, only 6.5% were classified as commercial producers. The remaining households produced mainly or entirely for home consumption. Figure 1: Estimates of Fruit and Vegetable Product ion (FAOSTAT – Available products)
Fruit and Vegetable Production
0
1000
2000
3000
4000
5000
6000
7000
8000
9000
10000
Year
Ton
nes
Avocados - Production (tonnes) 800 800 800 800 900 1000 1000 1000 1000 1000 1000 1000 1150
Citrus fruit, nec - Production (tonnes) 625 625 650 650 650 650 650 650 650 650 650 650 690
Fruit, nec(618) - Production (tonnes) 6000 7000 8000 8700 9000 9000 9000 9000 9000 9000 9000 9200 9300
Guavas, mangoes, mangosteens - Production (tonnes) 4000 5000 5200 4000 4000 4000 4000 4000 4000 4000 4000 4000 4000
Papayas - Production (tonnes) 4400 3900 3600 3600 3500 3600 3600 3600 3600 3600 3600 3700 3800
Pepper (Piper spp.) - Production (tonnes) 6 6 6 6 6 6 7 7 7 7 7 7 7
Pineapples - Production (tonnes) 4000 4500 4500 4500 4500 4000 4300 4600 4600 4600 4600 4600 4600
Vegetables, nec(462) - Production (tonnes) 760 760 810 810 850 900 1000 1000 1000 1000 1000 1000 1000
1995 1996 1997 1998 1999 2000 2001 2002 2003 2004 2005 2006 2007
Source: FAOSTAT (2008)
1 A new census is currently underway and should provide markedly improved data on agricultural production levels

10
2.1.3 Trade Significant amounts of fruit and vegetables are currently imported into Samoa. This has resulted in the substitution of imports by local production being identified as a possible growth opportunity for the fruit and vegetable sector. The following graphs illustrate the extent to which both the quantity and value of imports has increased since 2002. Figure 2 – Total Vegetable Imports (2002 – 2007)
Total Vegetable Imports
0
200000
400000
600000
800000
1000000
1200000
1400000
1600000
1800000
2002 2003 2004 2005 2006 2007
Year
kg
0
500000
1000000
1500000
2000000
2500000
3000000
3500000
4000000
4500000
S$ Quantity
Value CIF
Figure 3 – Total Fruit Imports (2002-2007)
Total Fruit Imports
0
50000
100000
150000
200000
250000
300000
350000
400000
450000
500000
2002 2003 2004 2005 2006 2007
Year
kg
0
200000
400000
600000
800000
1000000
1200000
1400000
1600000
1800000
2000000
S$ Quantity
Value CIF
Source: Samoan import data

11
Tables 1 and 2 provide a ranking of individual fruit and vegetable products in terms of the average annual CIF value of imports over the period January 2002 to June 20082. Although the most significant import (onions) is not currently produced in Samoa, the majority of products (or close substitutes to these products) averaging more than S$50,000 per year are widely grown. Similarly for fruits, significant quantities are imported annually. While the import of tropical fruits is relatively insignificant, there is potential for substitution of domestically grown temperate or tropical fruits for imported temperate fruit. It should be noted that, as with the production data, there are significant limitations in terms of the data collected at customs in Samoa. For example, the import of fresh pineapples is known to significantly exceed the annual average of S$406 indicated in Table 2. In aggregate, import quantities and values have trended upwards and this is also the case for most individual products. For the most important (in terms of import value) product, onions, imports have grown consistently since 2002. Not all imports are increasing however. For example, the quantity of avocado imports fell sharply from about 450kg/year in 2002 to about 15kg/year in 2007. Using the trade data, it is also possible to identify seasonality in imports which can provide useful insights as to import substitution possibilities. For example, apples are the leading import and although not grown in Samoa, there may be a possibility of substituting local fruit for the consumption of apples. Monthly data indicate that apples are imported throughout the year, but in low volumes in November, January and February (perhaps indicating off season in the main exporting country).
2 Note, that a cross check with New Zealand export data reveals that there are a number of discrepancies in the data. However, for the purposes of identifying the representative fruits and vegetables, the values used are considered to provide a sufficient guide.

12
Table 1: Average annual quantity and CIF value of v egetable imports (Jan 2002 – Jun 2008)
Product (tariff definition) Quantity (kg)
CIF value
(S$) Onions and shallots, fresh or chilled 534561.6 1004140 Potatoes, frozen 131972.4 514877.1 Cabbage lettuce,(head lettuce) fresh or chilled 93128.01 382836.6 Carrots and turnips, fresh or chilled 102327.2 287143.4 Garlic, fresh or chilled 158918 224320.6 Mixtures of vegetables, frozen 77715.08 215887.5 Tomatoes, fresh or chilled 27037.6 100410.2 Cauliflowers and headed broccoli, fresh or chilled 35422.3 73441.23 Celery other than celeriac, fresh or chilled 37505.42 65408.92 Fruits of genus capsicum or pimento, fresh or chilled 19080.96 62553.69 Lettuce, fresh or chilled, (excl. cabbage lettuce) 7592.58 43715.54 Mushrooms, fresh or chilled 13676.02 41049.23 Sweet corn, frozen 8423.966 17722 Other vegetables, fresh or chilled, not elsewhere specified. 4154.683 12430.15 Vegetables, frozen, other 4726.726 12372 Beetroot...radishes and other similar edible roots, fresh or chilled 5632.277 12197.23 White,red,Savoy, Chinese cabbages, collards,kohlrabi, kale...etc, fresh or chilled
2940.778 12169.85
Brussels sprouts, fresh or chilled 3743.697 7917.846 Beans, fresh or chilled 3266.358 7105.846 Other vegetables; mixtures of vegetables, whole, cut, sliced, but not further prepared
2121.758 7082.462
Other vegetables; mixture of vegetables provisionally preserved,unsuitable for immediate
2335.809 6398.308
Onions provisionally preserved, unsuitable in that state for immediate consumption
3163.206 6104.462
Shelled or unshelled peas, frozen 4923.812 5443.231 Peas, fresh or chilled 1690.217 5337.846 Shelled or unshelled beans, frozen 4260.283 3751.385 Chicory, fresh or chilled, (excl. witlof) 1913.603 3460.923 Asparagus, fresh or chilled 626.1785 3006.615 Spinach,New Zealand spinach and orache spinach, frozen 707.1385 2391.077 Dried mushrooms and truffles,whole,cut,sliced,broken or in powder,not further prepared
1596.197 2388.154
Cucumbers and gherkins, fresh or chilled 813.6062 2355.846 Leeks and other alliaceous vegetables,fresh or chilled 664.2631 2182.615 Olives provisionally preserved, unsuitable in that state for immediate consumptionle
732.7031 1612
Spinach, NZ spinach and orache spinach,fresh or chilled 503.7446 969.0769 Leguminous vegetables, fresh or chilled,other 77.48308 602.6154 Dried onions,whole,cut,sliced,broken or in powder,but not further prepared 194.1169 502.6154 Truffles, fresh or chilled 36.07692 417.5385 Cucumbers and gherkins provisionally preserved, unsuitable for immediate consumption
91.54308 409.8462

13
Table 2: Average annual quantity and CIF value (Jan 2002 – Jun 2008) of fruit imports
Product (tariff definition ) Quantity (kg)
CIF Value (S$)
Apples, fresh 124660.3 513005.7 Oranges,fresh 85537.82 399238.9 Coconuts,not fresh,not desiccated 96579.42 203099.1 Dried prunes 26468.01 114582.6 Other nuts, fresh or dried, nes 9968.914 83679.23 Pears and quinces, fresh 33705.31 83577.85 Other dried fruit, nes 10291.7 60132 Fresh grapes 29000.01 59443.54 Mixtures of nuts or dried fruits,not containing added salt 4788.214 43276.77 Mixtures of nuts or dried fruits,containing added salt 3806.146 23526.62 Kiwifruit, fresh 12203.52 17561.38 Mandarins, clementines, wilkings...etc, fresh or dried 4831.586 17525.23 Peaches, including nectarines, fresh 4620.551 10343.54 Dried grapes 7946.094 9157.846 Strawberries, fresh 1551.758 8619.538 Melons, fresh, (excl.watermelons) 11640.41 8521.538 Plums and sloes, fresh 2038.495 8311.538 Watermelons, fresh 2309.154 6084.308 Coconuts, desiccated 6094.657 5734 Peel of citrus fruit or melons, fresh,frozen, dried...etc. 2206.343 4054.308 Other fruit, fresh, nes 815.3938 3812 Guavas, mangoes and mangosteens, fresh or dried 1181.323 2922.308 Walnuts without shells, fresh or dried 637.6277 2377.538 Lemons and limes, fresh or dried 451.2215 2148.154 Other fruits and nuts,frozen,containing added sugar and other sweetening matter 375.2308 1881.692 Cherries, provisionally preserved, not for immediate consumption 185.2308 1860.308 Cashew nuts, without shell, fresh or dried 263.7323 1755.385 Grapefruit, fresh or dried 680.0569 1734.462 Black, white or red currants and gooseberries, fresh 305.9585 1689.692 Fruit and nuts, provisionally preserved, not for immediate consumption 1630.978 1664.462 Raspberries, blackberries, mulberries and loganberries, fresh 255.1154 1645.077 Apricots, fresh 301.7031 1572.769 Oranges,dried 1197.329 1408.615 Cherries, fresh 247.2262 1192.923 Other fruits and nuts,frozen,not containing added sugar or other sweetening matter 27.29231 1161.385 Strawberries,frozen,not containing added sugar or other sweetening matter 95.73077 984.6154 Dates, fresh or dried 272.1923 861.2308 Almonds without shells, fresh or dried 933.9246 799.5385 Strawberries, provisionally preserved, not for immediate consumption 62.76923 789.3846 Avocados, fresh or dried 132.9985 786.6154 Cashew nuts, in shell,fresh or dried 171.0277 719.6923 Walnuts in shell, fresh or dried 312.1354 701.3846 Dried apricots 203.2185 507.6923 Almonds in shell, fresh or dried 104.7969 468.4615 Pineapples, fresh or dried 139.0492 406 Hazlenuts in shell, fresh or dried 110.7692 252.6154 Raspberries,blackberries,etc,containing added sugar or other sweetening matter 62 250

14
2.1.3 Exports The range of agricultural products currently exported from Samoa is much narrower than those imported. Although there have been some exports of fresh tropical fruits in the past, in more recent years exports have generally been restricted to noni and coconut derivatives.
2.1.4 Domestic market sales A further source of information relates to the sale of domestically produced product on local markets. Although the CBS publishes price and quantity data in selected products passing through Fugalei market, the sale of product in this market is recognised as being a relatively small proportion of the total amount sold to all domestic market segments. Information on sales to other market segments is essentially unavailable. However, in addressing the hospitality and tourism segments of the market, a recent USP survey (2008) provides some insights. The USP survey indicates that the demand for local agricultural products by both restaurants and hotels is significant. Hotels and restaurants purchase coconuts, bananas and papayas only from the local market, while apples, oranges and avocadoes are all imported. Vegetable products are characterized by mixed purchases (locally and imported). With the exception of eggplants and pumpkins, other vegetables: cabbages, carrots, tomatoes, lettuce are both purchased locally and imported. The inconsistency of domestic supplies is compensated by importing fruit and vegetables. Quality is the main concern for buyers and constitutes. This, together with the erratic domestic supply, is the main reason why imported products are purchased on a regular basis. The high price of produce is not the primary concern if quality is assured. The required quality standards for fruit and vegetables are basic: grading, packaging, and post-harvest treatment. These requisites are not widely respected by domestic suppliers. On the side of the buyers there is often too short a period of notification of required supplies of products. Most of respondents indicated 1 to 3 days as their period of notification. Only a minority of the buyers give a week of notification of their needs. Importantly, however, 85% of restaurants and hotels surveyed would stop purchasing imports completely if a consistent supply of locally produced produce were to be available.
15
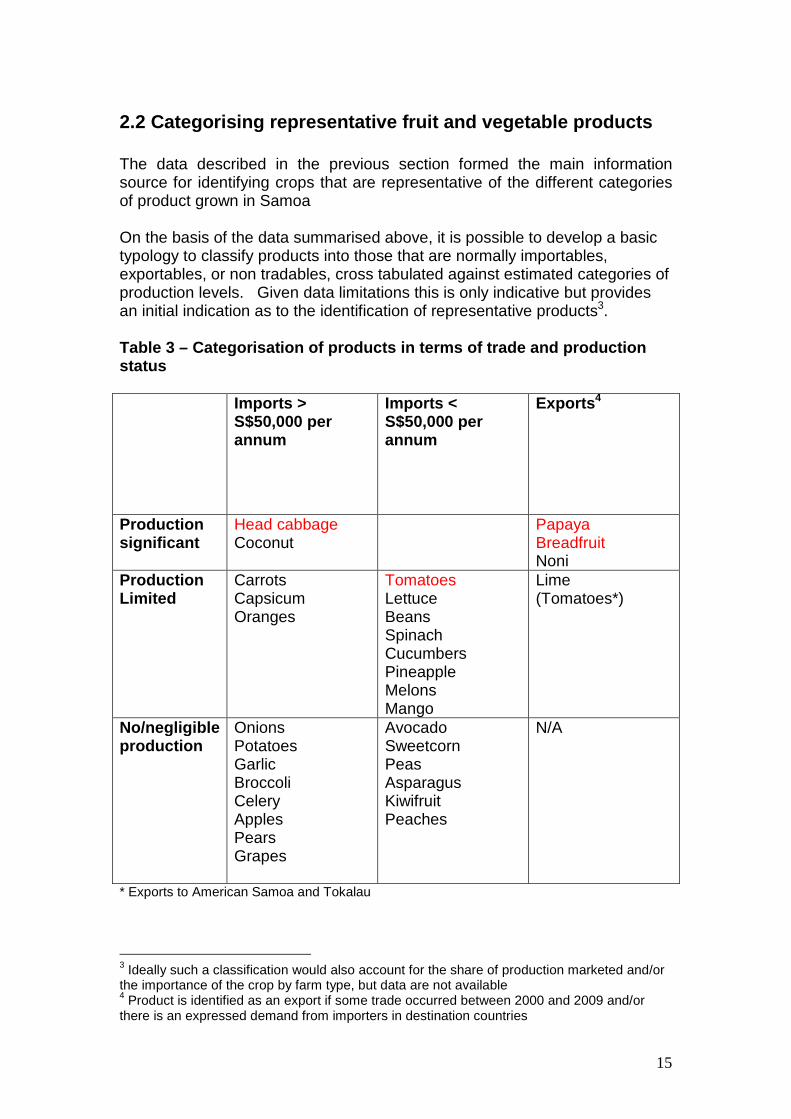
2.2 Categorising representative fruit and vegetable products The data described in the previous section formed the main information source for identifying crops that are representative of the different categories of product grown in Samoa On the basis of the data summarised above, it is possible to develop a basic typology to classify products into those that are normally importables, exportables, or non tradables, cross tabulated against estimated categories of production levels. Given data limitations this is only indicative but provides an initial indication as to the identification of representative products3. Table 3 – Categorisation of products in terms of tr ade and production status Imports >
S$50,000 per annum
Imports < S$50,000 per annum
Exports 4
Production significant
Head cabbage Coconut
Papaya Breadfruit Noni
Production Limited
Carrots Capsicum Oranges
Tomatoes Lettuce Beans Spinach Cucumbers Pineapple Melons Mango
Lime (Tomatoes*)
No/negligible production
Onions Potatoes Garlic Broccoli Celery Apples Pears Grapes
Avocado Sweetcorn Peas Asparagus Kiwifruit Peaches
N/A
* Exports to American Samoa and Tokalau
3 Ideally such a classification would also account for the share of production marketed and/or the importance of the crop by farm type, but data are not available 4 Product is identified as an export if some trade occurred between 2000 and 2009 and/or there is an expressed demand from importers in destination countries

16
On the basis of the categorisation, a representative selection of products across the spectrum of trade status, but for which non-negligible production is assumed, was made. In addition, a range of considerations were used to validate the crops selected, notably the current commercial propagation of the fruit or vegetable type and the capacity to encompass a broad range of similar products. For example, head cabbage is a member of the family of Brassica’s which utilize similar growing systems and packaging, with crop care requirements that are similar to lettuce or Chinese cabbage etc, while tomatoes are a fruit bearing vegetable with similar crop tending requirements to capsicum varieties, egg plant etc. The crops chosen as representative for the vegetable sector were Tomatoes and Head Cabbage. The justification for the selection of Tomatoes and Head Cabbage is the following:
a. These crops are planted and grown in all current vegetable production areas and their input, output and production methodologies form a representative base for the majority of vegetable crops grown in Samoa5.
b. These crops are currently grown commercially in Samoa and account for approximately 20%6 of local vegetable sales in the central Fugalei market
c. These crops are currently imported, indicating both a potential for increased production and the existence of inefficiencies in local production systems
d. The import value of these crops is increasing at a steady rate e. Tomatoes have the opportunity to exploit export potential to American
Samoa all year round and to New Zealand in the winter months. This provides the opportunity to evaluate/assess factors and implications of exporting this product.
The two fruit types to be evaluated in this study are Papaya and Breadfruit. These crops have been chosen for the following reasons: a. Papaya and Breadfruit are amongst the most consumed fruits in
Samoa (Nuu Crops Division). b. Papaya fruits are available all year round making it a particularly
consistent fruit type to work with. c. Breadfruit has widespread cultivation in Samoa with approximately
89,000 producing trees in 2000 (Samoa Government) d. Export pathways using HFTA are already established for these crops. e. Progressive Enterprises Ltd, a food retailing network in New Zealand
with 200 retail outlets, is keen to pursue the development of these crops.
5 “Manual for Vegetable production in Samoa,”Hou Xiaoping 2007/2008. 6 Central Bank of Samoa Fugalei Market Reports

17
3. Mapping the value chains To understand the relationship of the value chains to the broader market it is important to know the various actors and the direct and indirect influence that they have on chain performance. The following generic layout provides the baseline framework from which the chains for the individual crops have been developed. Figure 1: Generic Layout of Actors and linkages in the Chain
The value chain maps that follow in Section 4 have been structured into a series of activities leading from production to eventual distribution into the market. Decision “diamonds” are used to identify steps in the chain that are further evaluated. Each of these diamonds is numbered, breaking the value chain map into logical “process groups” or “business units”. Each one of these numbers therefore classifies the activity according to a specific type of task and is structured as detailed in Table 4.

18
Table 4 – Decision diamonds
Diamond Number
Value Chain S tep Definition
1 Input Supply 2 Farm Production 3 Post harvest treatment 4 Logistics 5 Processing 6 Marketing
For each product analysed in Section 4, a gross margin analysis is presented as a basis for estimating the relative loss in value to the chain resulting from the identified constraints at each stage in the chain. The gross margin calculations are based on original estimates developed by MAF. These are updated, and some assumptions altered as explained in the relevant sections. As well as providing an indication of the minimum scale of production required for a viable enterprise, the gross margin analyses are used to estimate potential losses associated with each constraint. For constraints at the production level, the estimates represent the potential loss to the individual producer on a per area basis and can be compared to the gross margin estimate to prove an indication of the relative importance of the constraint. For post-production constraints, the estimates are generally aggregated up to provide an indication of the loss to the chain as a whole. Although the assumptions made result in estimates that are highly indicative, constraints that are likely to prevent chain development can be distinguished in terms of their relative importance.
19
4. Analysis of selected value chains
4.1 Papaya
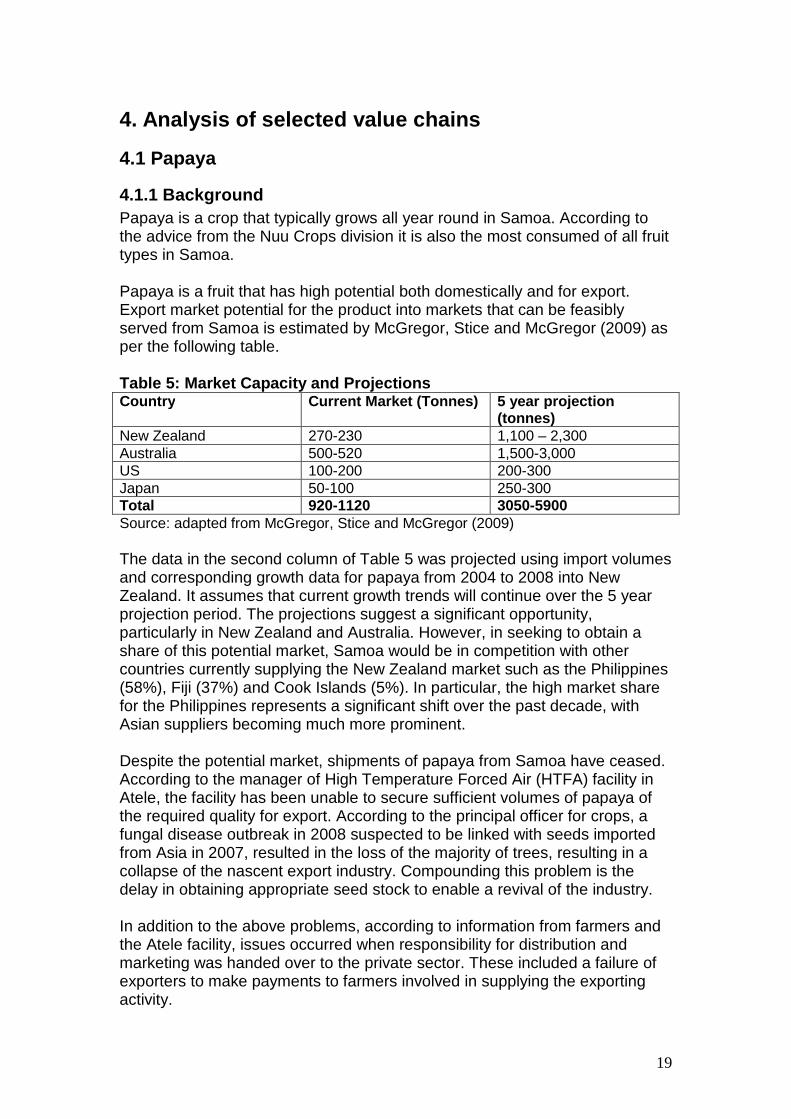
4.1.1 Background Papaya is a crop that typically grows all year round in Samoa. According to the advice from the Nuu Crops division it is also the most consumed of all fruit types in Samoa. Papaya is a fruit that has high potential both domestically and for export. Export market potential for the product into markets that can be feasibly served from Samoa is estimated by McGregor, Stice and McGregor (2009) as per the following table. Table 5: Market Capacity and Projections Country Current Market (Tonnes) 5 year p rojection
(tonnes) New Zealand 270-230 1,100 – 2,300 Australia 500-520 1,500-3,000 US 100-200 200-300 Japan 50-100 250-300 Total 920-1120 3050-5900 Source: adapted from McGregor, Stice and McGregor (2009) The data in the second column of Table 5 was projected using import volumes and corresponding growth data for papaya from 2004 to 2008 into New Zealand. It assumes that current growth trends will continue over the 5 year projection period. The projections suggest a significant opportunity, particularly in New Zealand and Australia. However, in seeking to obtain a share of this potential market, Samoa would be in competition with other countries currently supplying the New Zealand market such as the Philippines (58%), Fiji (37%) and Cook Islands (5%). In particular, the high market share for the Philippines represents a significant shift over the past decade, with Asian suppliers becoming much more prominent. Despite the potential market, shipments of papaya from Samoa have ceased. According to the manager of High Temperature Forced Air (HTFA) facility in Atele, the facility has been unable to secure sufficient volumes of papaya of the required quality for export. According to the principal officer for crops, a fungal disease outbreak in 2008 suspected to be linked with seeds imported from Asia in 2007, resulted in the loss of the majority of trees, resulting in a collapse of the nascent export industry. Compounding this problem is the delay in obtaining appropriate seed stock to enable a revival of the industry. In addition to the above problems, according to information from farmers and the Atele facility, issues occurred when responsibility for distribution and marketing was handed over to the private sector. These included a failure of exporters to make payments to farmers involved in supplying the exporting activity.

20
In interviews with farmers there is a general fear that another disease outbreak could result in a loss of entire crops as occurred in 2008. There is also concern regarding the ability of the current HTFA facility to handle adequate volumes of fruits and more importantly in ensuring that payment for product by the agents distributing the product actually occurs. Figure 2: Papaya Value Chain Map The current structure of the papaya chain map is as follows:
21
4.1.2 Gross Margin Data for Papaya In order to determine the relative importance (in terms of value lost to the chain) of the constraints related to the decision diamonds and discussed in the next subsection, results from a gross margin analysis are drawn upon. The gross margin data sourced from the Ministry for Agriculture details the estimated cost of setting up farm level papaya production in Samoa, on a small, albeit commercial basis. It is designed to reflect the propagation of the Hawaiian Solo variety of papaya which is one of two varieties currently grown for export in Samoa (Sunrise being the other). The reason for the differentiation is that the Hawaiian Solo is a smaller fruit meaning that more can be packed per box therefore reducing the packaging price per fruit. The costing for packaging has been added to the Government data as it is ordinarily recognised as one of the highest costs. The assumption for packaging is relevant to both domestic and export bound product as either method will require a purchase requirement (for boxes) or a labour time component (for cutting leaves and weaving to make the traditional basket used for domestic market sales). Another change from the Government data is the inclusion of all labour types into the gross margin costing, whether it is hired or family labour. The rationale behind this is that labour must be costed irrespective of whether the owner of the farm is performing the tasks or whether hired labour is performing the task. This ensures that minimum wage considerations are taken into account to ensure that pre-harvest and selling cost requirements are sufficient to sustain labour intensive activities. It also assists in verifying reasons why agriculture has become less attractive compared to other potential sources of employment for Samoan families. For calculating the gross margin for two acre plot of papaya, it is assumed that 50% of production will be exported and 50% will be sold on the domestic market. It should be noted that the domestic market for local varieties of papaya is currently saturated. This assumption is made considering the consistency of pricing for papaya over time which typically retails on the domestic market for S$15.00 per basket according to domestic consumers, a price which has been consistent for 5 years for the local varieties. Hawaiian Papaya on the other hand typically varies in price depending on availability moving in a range from S$1.00 to S$2.00 per fruit commanding a price premium. S$ 0.65 is used as the local price in the gross margin on the assumption that increased and consistent supply may result in the stated price minimum similar to the indigenous varieties of this fruit. The export price on the other hand is taken from the current export pricing into the New Zealand market.

22
The analysis indicates that under these assumptions (and the assumptions regarding husbandry indicated in Table 6), a Gross Margin of S$12,433.25 is generated over a three year rotation on two hectares of land.
Table 6: Gross Margin and Net Income Costing for P apaya production

23
4.1.3 Evaluation of the Papaya Value Chain Using the decision diamond approach a series of potential constraints to chain development have been identified for papaya. The constraints associated with each “diamond” are discussed in turn and an attempt is made to quantify, on the basis of the gross margin analysis, the value lost per acre of papaya grown if the constraint is not alleviated.
Decision Diamond 1: Input Supply
Seedling Supply Since the collapse of the industry in 2008 due to a fungal disease outbreak and payment issues, no new seedlings have been produced by the Government run nursery. There is also hesitation to continue breeding from the current stock as breeding from successive generations is creating a prevalence of male plants estimated by the Government nursery to be approximately 40% of total seedlings produced. New seed stock is currently being sourced from Hawaii to avoid the disease issues suspected to have come from seeds sourced from Asia. Assuming that a farmer wanted to begin planting of a papaya farm and considering the unavailability of seedlings the loss can be calculated at an average of the total income forecast for a 2 acre plantation divided by the number of days that production is being delayed. For example as per the Gross Margin figures the total income expected over 3 years of production is S$49116.38. The daily rate of loss therefore is this total amount divided by 3 years or S$44.86 per day. For every year therefore that a delay in commencement of planting is caused by lack of seedlings the farmer losses S$16327.27 Estimated loss to value chain if seedlings not available: $5442.52 per acre per annum.
Fungicides and Pesticides Fungicides in particular are of critical importance to the propagation of papaya with feedback from farmers stating estimated losses of up to 95 -100% of their trees due to the disease outbreak in 2008. Considering the availability of copper based fungicides which have been proven to be effective against these diseases7 establishing whether the die off was caused by a lack of knowledge on the farms, capacity to source a fungicide, or availability of an effective product at the time from input suppliers needs to be verified. Estimated Gross Margin result after 3 years if fungicide is not available: -$29,985.44 (assuming 95% mortality).
7 Source: http://daweb.da.gov.ph/tips/papaya.html

24
Miscellaneous tools, planter bags etc Equipment availability was one of the issues highlighted during the FVSS working groups. The discussion regarding these inputs was largely centred on affordability and availability to farmers. Interviews with input suppliers (Agriculture Store) and MAFF Nuu Crops division identified that there is no working link between Nuu and the Agriculture Store to ensure the stocking of the required equipment. In an interview with the Agriculture Store purchasing officer, it seems that there is a lack of coordination in the sector. For example, she was very open to purchasing as required for the sector, although this was restricted by volumes and frequency of ordering based on capacity to fill a container with imported product to reduce costs. Although lack of equipment will have an impact on the value of this stage of the process, data is unavailable to quantify the cost in terms of value lost and will require a more in-depth production based study.
Decision Diamond 2: Primary Production
Technical Skill The direct link between technical skill/training and value chain performance is difficult to ascertain. In the previous attempt at the development of the Papaya industry, all farmers were required to register with the Samoa Farmers Association. As part of the registration process, farmers were given a briefing on papaya tending requirements and also a link to the Nuu Crops Division through Jeff Atoa, the secretary of the Samoa Farmers Association. The fact that 95% of the papaya on Jeff Atoa’s8 land died as a result of the 2008 fungal infection signifies that this arrangement did not lead to success. The direct relationship between the failure of the crop and technical knowledge cannot be quantified and would require an extended study of an appropriate working operation.
Land Issues Land issues span the following:
1. Capacity to crop on extremely rocky, shallow 15-20 cm topsoils, which are not ideal for planting papaya. Papaya ideally requires a one metre, well drained alluvial soil.9
2. Securing access to sufficient land to grow an economically sufficient volume of trees. According to the gross margin data and taking into consideration the minimum wage for Samoa, a minimum of two acres would be required to make a fair income from this product. This becomes a problem for farmers in general due to 85% of land in Samoa being customary10. The inability to farm customary land securely is a major problem faced by village farmers as it is common practice for farmers to lose their rights to the land once a project becomes successful.
8 According to a discussion with Jeff Atoa. 9 Source: http://www2.dpi.qld.gov.au/horticulture/5324.html 10 Customary land is land owned by extended families in village community groups

25
This is due to higher ranking chiefs in an extended family claiming rights to it. Moves by the Samoan government to permit the use of customary land as collateral and legal leasing of customary land are underway, although this is a lengthy process.
3. Fencing of properties to prevent animal damage and theft. 4. Access roads to farms
Therefore, land issues fall into the following value chain components:
a. Estimated costs to prepare land if it is extremely rocky and requires heavy machinery range from S$2450.00 to S$3150.00 per acre.
b. The amount of land available to farm. Considering that 10% of land is freehold and 10% is Government owned, from an arable land area of 86,000 hectares, 17,200 hectares is not restricted by customary issues. Estimating that half of this land area may be occupied by residential or commercial buildings, then 8600 hectares may be available to farm. If 5% of available land or 480 hectares is converted to papaya farming, average annual income over the total cropped area would be S$5,675,767, demonstrating that land capacity in the industry, despite customary land issues, in not a significant constraint.
c. Costs to fence land to prevent animal damage and theft: S$3000.00 per acre.
d. Costs to build access roads to improve efficiency of access to and from farm and to reduce post harvest damage to fruit: S$250,000.00 per kilometre11
Of the four mentioned points, roads at S$250,000.00 per kilometre are an area outside the capacity of the Gross Margin analysis and would require Government intervention. In addition to this, allocation of lease land under government control for this activity would also be required.
Finance Availability The cost to finance a project of two acres would require an initial financial commitment of a minimum of SAT$18146.25 which includes fixed and variable costs for the first year based on the gross margin data. Should a farmer decide to borrow this amount using an SBEC (Small Business Enterprise Centre) guarantee and assuming that he is able to provide a 10% deposit to secure a loan, the cost to the farmer is calculated as follows based on the gross margin analysis.
11 Based on quote from Silver Construction, Samoa.

26
Table 7 : Cost of financing a two acre plot of papa ya Amount Loaned $18146.25
SBEC Guarantee (90% of Amt Loaned)
$16331.31
Farmer Contribution (Fixed Deposit at 10% of Amt Loaned)
$1,814.63
Funding Bank ANZ
Interest Rate: 13.50%
Loan Term** 3 years
Monthly Repayment: $615.80
Total Repayment + Interest* $22168.74
Cost of financing $4022.49 *final amount does not cover fees **repayment is structured over 3 years as this is the life of the crop. With mono-cropping issues creating disease problems and environmental damage added to limited land availability, a farmer will very likely not have enough land to rotate a crop therefore requiring recovery of investment in one crop cycle of 3 years. In the above scenario, with a projected nett income over 3 years of S$7203.13 for 2 acres, if loan repayments are taken into account (not including loan service fees) then potential return from the crop is reduced by S$4022.49 (or more than half) Estimated Loss to the value chain over 3 years due to cost of finance including interest: $4022.49 per two acre plot.
Diamond 3: Post Harvest Treatment
Capacity of the HTFA machine 12 All papaya bound for the export market requires treatment to eliminate potential fruit fly contamination. Currently, there is one High Temperature Forced Air (HTFA) treatment plant with a capacity of 300kg per run. The following table estimates the performance capacity of the Atele HTFA machine using the papaya gross margin production data as the basis. It assumes that only the product from the two hectare plot is available for treatment. In other words, it is assumed that there is no coordination in supply to the HTFA and only product from the two acre plot is treated. The value chain loss to the sector in this scenario is related to the unfilled capacity of the HTFA machine in a two acre scenario. Atele data shows that the processing cost to run the current HTFA machine is S$165.00 tala per cycle or approximately S$ 0.55 per kg capacity of the HTFA
12 The capacity of the HTFA and how it relates to sea freight export is discussed under “Packaging”

27
Table 8: Losses resulting from unused capacity of H TFA Year 1 2 3 Number of harvests 17 52 52 Qty per Harvest (fruit) 89.34 140.19 116.83 Capacity of HFTA (kg) 300 300 300 Unused Capacity 210.66 159.81 183.17 Loss per harvest at $0.55 SAT per kg
$ 115.86 $ 87.89 $ 100.75
Total Loss to HFTA for year $ 1,969.69 $ 4,570.50 $ 5,238.75 Total Loss for 3 year crop cycle: $ 11,778.94 Estimated Loss on export potential in relation to capacity of machine: minimum: $11,778.94 over the three year crop cycle. Ultimately, this cost would be bourne by the producer in terms of a higher per kg treatment cost. This issue of treatment capacity is returned to below.
Harvesting, Packaging Material and Shelf Life Stora ge
Harvesting Harvesting practices to minimise damage and therefore losses are assumed to result in a 10% loss of fruit according to the gross margin figures. This equates to S$5457.38 per crop cycle (Income increased by 10% yield). Activities to either ensure that the calculated 10% is maintained or improved on would require key performance reporting to assess harvest training, harvesting tool handling related to fruit damage, field to packaging house systems and packaging house sorting and grading systems. Due to the current status of the Samoan Papaya industry, this would be an activity that would need to be performed once other areas of the value chain are addressed and production comes back online.
Packaging Packaging comes into the equation for the processing facility and the farmer, but more significantly in terms of export. The reason that it plays such an important part in the export of the product is not only in terms of product quality (bruising and presentation) but more importantly in terms of shelf life. As has been stated previously, the Philippines have taken over 58% of the New Zealand market. Although the literature cites consistency of supply and quality as the two major factors behind this, the fact that the Philippines use ocean freight over air-freight (which was used in the previous Samoan export experience) would indicate a significant pricing advantage for the Philippines product as indicated in Table 9. Table 9 Freight costs – sea-freight vs air-freight Sea freight Cost /kg* Airfreight Cost / kg* Cost differential .1875 per kg 2 per kg** 1.8125 per kg *Based on shipping rates out of Samoa, costs sourced from Polynesian Shipping. **If load is more than 250kg but less then 500kg

28
In terms of shipping efficiency, the value chain cost of freight by air for the quantity of fruit from a two acre block exporting 50% of production, compared to sea freight is calculated in table 10. Table 10 – Effect of freight costs Cost of Freight Scenarios * Year 1 Year 2 Year 3 Total Fruit Yield in kg 1,688 8,100 6,750 16,538 Freight Cost Air (S$2/Kg) 3,375.00 16,200.00 13,500.00 33,075 Freight Cost Sea (S$.1875/Kg)
316.40625 1518.75 1265.625 3,101
Cost Differential (SAT) 3,058.59 14,681.25 12,234.38 29,974.22 *Fruit yield is calculated based on half of production being exported from a 2 acre plantation. The cost to the value chain assuming that all fruit intended for HTFA treatment is treated and airfreighted is S$33,075 which is significantly higher than the gross margin at production level and would therefore require a significant mark-up between producer and exporter price. By contrast, the projected cost if sea freight is utilized is S$3101, a net improvement of S$29.974.22 on this quantity of fruit. Considering the cost implications, it would be prudent to design a strategy that utilizes sea freight. An important note at this point is that total harvest yields that would be required would be in the order of 8-9 tonnes of fruit to have the capacity to enable sea freight shipments.
Sea freight packaging and the relationship to HFTA treatment This relationship is discussed further as it adds a new scenario to the HFTA process and therefore the value chain as a whole. In the sea freight packaging scenario 8-9 tonnes of treated fruit would need to be available for shipment at one time. This is the total requirement to pack out a 20ft sea freight container. Considering that the average time to treat papaya is approximately 4 hours, the HTFA machine would require the capacity to treat a minimum of 4 tonnes per treatment (if assumed to be available) in order to minimise storage times and complete processing within a working day. Assuming that an adequate crop is planted to cater for this scenario, the lack of capacity of the HTFA machine considering shipping schedules capable of shipping 3 containers per month or 36 containers per year will mean an annual loss of S$295,200.00 in potential income to the chain which is the total potential of 36 containers per annum at 8500 kg per container minus the current capacity of the HTFA of 300 kg per treatment multiplied by 36 shipments.
Shelf Life Storage This relates to the cold chain for domestic product only as export fruit are harvested and exported without the need for cold storage.

29
Assuming that fruit are harvested every seven days in a volume of 387.93 fruit per 2 acre plot, this would pack out to 25 baskets of fruit per harvest. The farmer has three options for harvest: A. They can either harvest the fruit according to the expected sales rate in
the domestic market and minimise post harvest loss in this manner B. Harvest all fruit in one lot, transport to market and sell according to the
shelf life capacity of the fruit of 7-8 days13. C. Harvest all fruit in one lot, transport required volumes according to daily
market demand, while keeping the remainder of the product in cold storage to extend shelf life.
For option A and B, the difference in the impact on the value chain would be convenience to the farmer as in option A, repeated trips would be required to the field whereas in option B the farmer will require both adequate transport to handle larger loads and the higher possibility of transit and handling damage due to higher volumes. Option C on the other hand would mean significantly increased costs in terms of electricity for cool storage (required at an average of 11 degrees Celsius). For example, in an interview with a farmer who uses refrigerated containers for the storage of eggs, the monthly electricity cost for a container is approximately S$1500. Considering that the value of an individual fruit is S$0.65 or S$9.75 per basket it would be uneconomical to cold store the fruit considering the volume and that fruit has an ambient shelf life on average of 7 to 8 days.
Diamond 4: Logistics Assumptions for logistics are based on the different forms that transport can take in the domestic market and are primarily targeted toward the transport from farm to the various markets. The following table estimates the cost of public or hire transport and has been obtained in interviews with users of these transport systems. Table 11 Transport costs Transport Method
Cost per Load/Basket
Cartons per harvest*
Total Cost
Public Bus $5 27 $135 Hire Truck** $7 27 $200 *Cartons per harvest is based on gross margin data for 2 acres at 50% **Hire Truck cost is based on transporting Papaya from Aleipata District to Fugalei Market and should be adjusted according to farm location where relevant. The following table estimates the cost to maintain and run a private vehicle for transport of produce to either the HTFA facility or central Fugalei market
13 Source: University of Hawaii http://www.ctahr.hawaii.edu/fb/papaya/papaya.htm

30
Table 12 – Costs purchase and running of transport vehicle
Transport Method 1 Ton Toyota Truck
1.5 Ton Toyota Dyna
Monthly loan Repayment* $800 $1,500 Monthly Fuel costs $500 $500 Monthly Maintenance Costs $150 $180 Total Cost to run vehicle mthly $1,450 $2,180 Cost per load of papaya $28 $42 *Monthly loan repayments are based on the market price of a second hand Toyota pick-up at S$30,000 and Dyna truck at S$52,000.
Diamond 6: Marketing
Knowledge of potential markets One of the key concerns raised by farmers during the Fruit and Vegetable Sector Strategy workshops was the capacity to access markets. From the discussions held, the most prevalent issue was how to gain access to overseas markets. Due to the proximity and geographical isolation issues, potential to gain contact with overseas buyers presents additional limitations. However, in the previous export experience, the Agriculture Store was able to make contact with overseas markets and establish a working relationship with them. Despite the relationship developed by the Agriculture Store, the market collapsed soon after handover to the private sector. This was primarily due to the distributors failing to make payments to the supplying farmers. It would seem therefore that the main issue to resolve for the papaya value chain is identifying distributors who will ensure that payments are made to the farmers who are providing the product for export. The impact in terms of value lost per 2 acre plot would be estimated at 50% of potential output of a 2 acre block or S$11,025 in income per annum if 50% of production was intended for export.
Markets’ knowledge of product availability The issue of market awareness of product availability is discussed from two perspectives. The first perspective is the communication between producers and domestic distribution outlets in Samoa. The current distribution network is set up as follows:
a. Direct farm gate sales b. Farmer to Fugalei Market c. Farmer to established on-sellers such as Fugalei
Market re-sellers, roadside markets, etc d. Farmer to hotels, restaurants and catering businesses
The second is awareness from the perspective of export markets. In the case of domestic markets, the major issue from the perspective of the wholesalers, retailers etc, based on the findings in the working groups in the
31
FVSS process, is the lack of communication between farmers and their prospective customers. There is also a “disconnect” between the quality, quantity and delivery frequencies of farmers to the potential retail market or direct sales consumers. In evaluation of the market there is no use of product branding or advertising to increase market penetration. Probably the only activity to increase marketability of the product is a distribution of papaya selling points to areas outside the central Fugalei market in Upolu to increase the ease of access for customers. This is done by moving away for the heavy traffic area around the main market. The impact of branding and packaging has not been assessed as part of this study and would be a valuable activity to evaluate possible interventions to improve value chain performance in this area. In the case of export markets, recent activities have been conducted by the Pacific Islands Trade and Investment Commission (PITIC) to fly in individuals interested in sourcing from Samoa. These included a marketing manager from Progressive Foods Ltd which is one of New Zealand’s largest fruit and vegetable outlets. These activities demonstrate that on a regional basis there are positive activities occurring to increase the markets knowledge of the export potential of Samoa. According to the Progressive Foods representative there is definitely a desire to import products from Samoa due to the marketing benefits of showing a loyalty to a relatively large Pacific Island community in New Zealand. As far as exports are concerned the value chain loss of not taking advantage of this potential due to the current status of the industry is estimated at $1675.52 per annum per two acre plot.
Summary The interrelated nature of the export component of the papaya chain makes it difficult to determine the relative importance of individual constraints to value chain development. Clearly, the export price and hence gross margin is significantly affected by (i) the ability to treat adequate quantities of fruit to keep treatment costs per unit to a minimum and (ii) the ability to produce and treat sufficient quantities to allow sea freight to be taken advantage of. The alleviation of these constraints would add significant value to the industry as a whole and through potentially higher sale prices at the producer level, a significantly higher return on the initial investment. It would require (i) a significantly larger treatment plant, and (ii) a mechanism through which to secure guaranteed, consistent supplies of fruit for treatment. Assuming that a mechanism ensuring adequate payments to farmers could be established in the post harvest chain14, a series of farm level constraints would need to be alleviated, namely, seedling and fungicide availability, land clearance and security against theft, financing and transportation.
14 The success of the Natures Way Cooperative in Fiji suggests that this is possible
32
4.2 Breadfruit
4.2.1 Background Information Breadfruit (Artocarpus altilis) is one of the most important domestically grown carbohydrates in Samoa15. The origins of the breadfruit are from the eastern Pacific region (Papua New Guinea up to Western Micronesia) and the fruit is believed to have been spread throughout the Pacific by migrating Polynesians (Morton 1987). In terms of a commercial crop, breadfruit is typically grown by default, spread through its sucker roots or occasionally harvested in this format and transplanted. Breadfruit plantations as such do not exist due to the widespread dispersion of this crop (estimated 89,000 trees16 for a population of 180,000) which saturates the domestic market during peak seasons. Despite this situation, breadfruit is an important domestic market product. In addition to local market demand, the development of HTFA technology and an agreement with New Zealand quarantine for an export pathway for this product provides access to a new market of approximately 30,000 Samoans as well other Pacific Island migrant people living in New Zealand. Another area that is gaining momentum is new product development using breadfruit as a flour to substitute or to reduce the use of wheat flours. With the increasing problem of celiac disease (related to intolerance to gluten), breadfruit flour is being highlighted as a viable alternative as it does not contain this protein. In some countries, it is also being promoted as a flour to offset the dependence on imported wheat flours17.
15 MAFFM Fruit Tree Development Project 2002 16 Government Samoa Census 2002 17 African Journal of Food Science, pp 020, 023

33
Figure 3: Breadfruit Value Chain Map

34
Table 13: Gross Margin Figures for Breadfruit Produ ction

35
4.2.2 Assumptions for Gross Margin Data for Breadfr uit The gross margin analysis for breadfruit is based on a three acre plot. This area was selected as a result of a sensitivity analysis showing that this scale would be required to provide a gross margin capable of yielding sufficient income per acre to provide reasonable support to the farmer and their family. Sale price figures for breadfruit have been assumed at S$2.00 per kilo for export quality product. This level would be required to ensure that minimum wage rates are covered. Yield figures are based on the study by Andrew McGregor (2006).
4.2.3 Evaluation of the breadfruit value chain
Decision Diamond 1: Input Supply
Seedling Supply Unlike papaya, breadfruit readily produces off-shoots which can be used to replicate planting material. Estimating the cost to the value chain if seedling availability would become an issue would depend on the size of the planned plantation and the number of available seedlings at the time of planting. According to the Atele facility that typically provides the seedlings to the farmers, it would take two months to attain the number of seedlings required to plant three acres. The cost to the value chain of a two month delay for seedling preparation would mean an opportunity cost of S$5443.20 over the 15 year crop cycle, significantly less than in the case for papaya. This is calculated by dividing the income from the 3rd year by 12 and multiplying this by 2 to show the loss caused by the delay in yield to the end of year income.
Equipment supply The following equipment would be required to produce breadfruit on a commercial basis:
• Stick pickers • Pruning saws • Pruning loppers • Ladders • Bait sprayer • Bait spray
Considering the length of time between the planting of the crop and the first harvest, there are unlikely to be delays in the availability of equipment. The key issue is to ensure that the Agricultural Supplies stores provide this equipment. If the equipment is not available from these domestic suppliers, the cost of options for farmers to source them enters the equation. Considering the capacity of farmers in Samoa to source such equipment in a geographically isolated area this could become a major impediment to production.

36
Of the six equipment items listed, the bait spray is the most critical. This is due to a New Zealand import requirement stating that registered exporting planters must have a verified bait application procedure. Therefore, should bait supply cease for any reason this would disqualify the farmer from producing for export. From a risk standpoint, the cost to the value chain in terms of income lost as an example taken from the 5th year of maturity of the plantation can be estimated at S$16,329.60. This is measured assuming delays that will be caused trying to source bait and the process to re-register a farm at approximately six months.
Decision Diamond 2: Primary Production
Technical Skills As with the papaya industry, the direct value chain link of technical skill/training to a value chain output is difficult to quantify. It should be noted however that incorrect plant spacing, pruning, weed control, incorrect or no feeding, or poorly planned inter-cropping will reduce yields in the breadfruit orchard type set-up. For example, fruit yields can vary from 50 to 200 fruits per year18. As there are no commercial type orchards in Samoa this would need to be an evaluation carried out once these are established.
Land Issues Land issues for breadfruit are practically the same as for papaya. The main difference between the two is that breadfruit does not require the same deep well drained soil that papaya requires and is found growing in a wide range of soil conditions19. Taking this into consideration the main issue is access roads if these are not available.
Finance Availability Using the papaya example and mapping it to the breadfruit gross margins, the financial scenario for breadfruit is structured as shown in Table 14, assuming that all fixed and direct costs including family labour of establishment during the first three years need to be financed: Table 14: Cost of financing breadfruit production ( 3 acre orchard) Loan Amount $ 26,871.00 Annual Interest Rate 13.5%
Term of Loan (in Years) 7
Mthly $ 496.17
Annual Payments $ 5,954.04
Total Interest $ 14,807.29
Total Repayment $ 41,678.29
18 http://www.hort.purdue.edu/newcrop/morton/breadfruit.html#Harvesting and Yield 19 http://www.hort.purdue.edu/newcrop/morton/breadfruit.html#Harvesting and Yield
37
The above finance scenario assumes full financing by financial institution based on the farmers’ capacity to borrow against the collateral of the land. This scenario is typical of the lending format used by the Development Bank of Samoa. Using this scenario for finance which reflects the typical lending structure for commercial banks, the loan repayment significantly contributes to the sensitivity of returns from the breadfruit orchard for the first 7 years of the project. The above lending would only be possible using a 3 year grace period until marketable harvest starts. As with the papaya scenario, high interest rates and short repayment times combine to make funding based on bank loans a challenging option for farming.
Diamond 3: Post Harvest Treatment
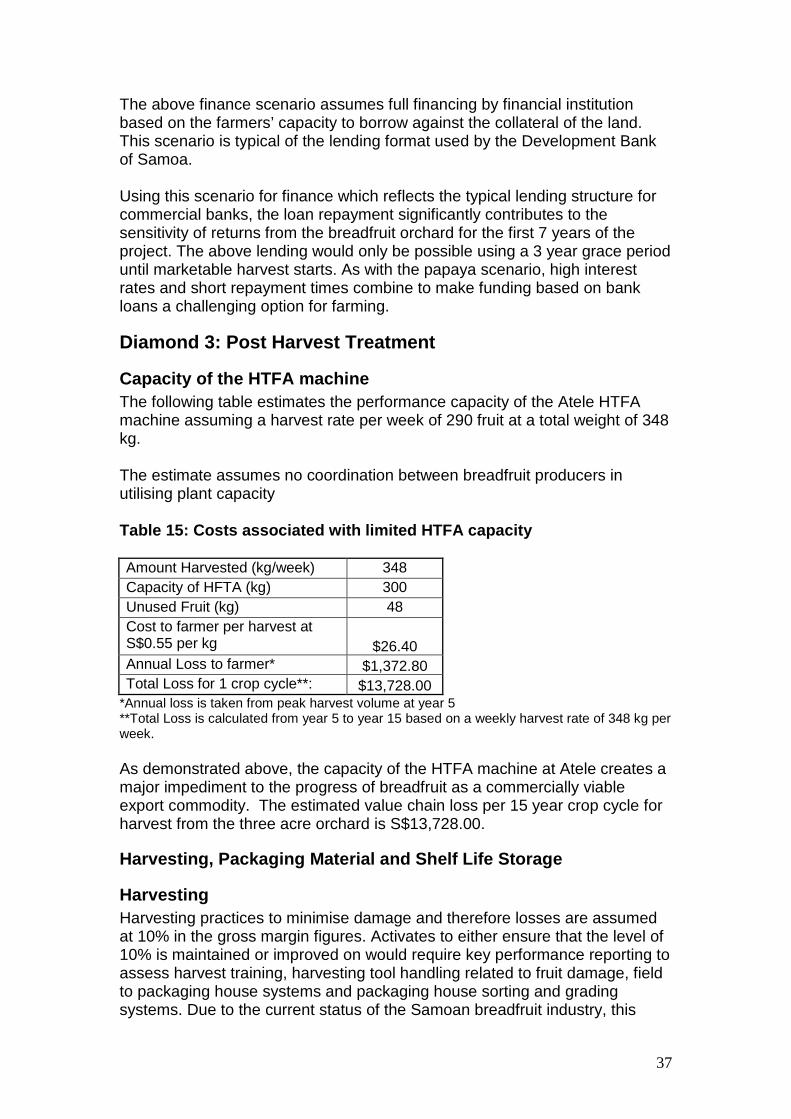
Capacity of the HTFA machine The following table estimates the performance capacity of the Atele HTFA machine assuming a harvest rate per week of 290 fruit at a total weight of 348 kg. The estimate assumes no coordination between breadfruit producers in utilising plant capacity Table 15: Costs associated with limited HTFA capaci ty Amount Harvested (kg/week) 348 Capacity of HFTA (kg) 300 Unused Fruit (kg) 48 Cost to farmer per harvest at S$0.55 per kg $26.40 Annual Loss to farmer* $1,372.80 Total Loss for 1 crop cycle**: $13,728.00
*Annual loss is taken from peak harvest volume at year 5 **Total Loss is calculated from year 5 to year 15 based on a weekly harvest rate of 348 kg per week. As demonstrated above, the capacity of the HTFA machine at Atele creates a major impediment to the progress of breadfruit as a commercially viable export commodity. The estimated value chain loss per 15 year crop cycle for harvest from the three acre orchard is S$13,728.00.
Harvesting, Packaging Material and Shelf Life Stora ge
Harvesting Harvesting practices to minimise damage and therefore losses are assumed at 10% in the gross margin figures. Activates to either ensure that the level of 10% is maintained or improved on would require key performance reporting to assess harvest training, harvesting tool handling related to fruit damage, field to packaging house systems and packaging house sorting and grading systems. Due to the current status of the Samoan breadfruit industry, this
38
would be an activity that would need to be performed once other areas of the value chain are addressed and production from a three acre orchard, for example, begins.
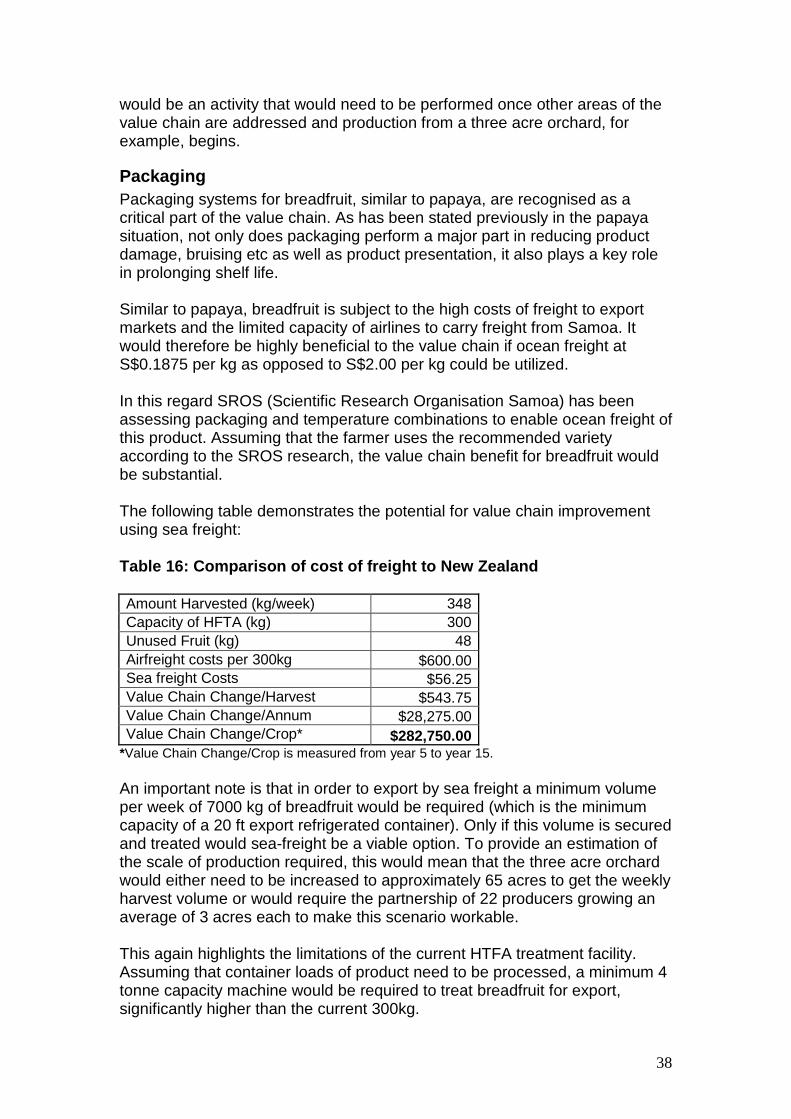
Packaging Packaging systems for breadfruit, similar to papaya, are recognised as a critical part of the value chain. As has been stated previously in the papaya situation, not only does packaging perform a major part in reducing product damage, bruising etc as well as product presentation, it also plays a key role in prolonging shelf life. Similar to papaya, breadfruit is subject to the high costs of freight to export markets and the limited capacity of airlines to carry freight from Samoa. It would therefore be highly beneficial to the value chain if ocean freight at S$0.1875 per kg as opposed to S$2.00 per kg could be utilized. In this regard SROS (Scientific Research Organisation Samoa) has been assessing packaging and temperature combinations to enable ocean freight of this product. Assuming that the farmer uses the recommended variety according to the SROS research, the value chain benefit for breadfruit would be substantial. The following table demonstrates the potential for value chain improvement using sea freight: Table 16: Comparison of cost of freight to New Zeal and Amount Harvested (kg/week) 348 Capacity of HFTA (kg) 300 Unused Fruit (kg) 48 Airfreight costs per 300kg $600.00 Sea freight Costs $56.25 Value Chain Change/Harvest $543.75 Value Chain Change/Annum $28,275.00 Value Chain Change/Crop* $282,750.00
*Value Chain Change/Crop is measured from year 5 to year 15. An important note is that in order to export by sea freight a minimum volume per week of 7000 kg of breadfruit would be required (which is the minimum capacity of a 20 ft export refrigerated container). Only if this volume is secured and treated would sea-freight be a viable option. To provide an estimation of the scale of production required, this would mean that the three acre orchard would either need to be increased to approximately 65 acres to get the weekly harvest volume or would require the partnership of 22 producers growing an average of 3 acres each to make this scenario workable. This again highlights the limitations of the current HTFA treatment facility. Assuming that container loads of product need to be processed, a minimum 4 tonne capacity machine would be required to treat breadfruit for export, significantly higher than the current 300kg.

39
Shelf life storage of product Apart from the shelf life considerations as per the exported product discussion, the capacity to preserve product by the same methods for domestic sales is an option. As with the example given with papaya, the farmer would need to calculate the cost of refrigeration against the sale price of the product. In this regard, as Samoa has very expensive electricity costs (S$0.64 per unit) it very quickly becomes uneconomical to store fruit in refrigeration. Should refrigeration be an option that the value chain would like to pursue, alternative energy solutions would need to be assessed. As these energy options are capital intensive it would require a funding agency that could provide a grant to cover these costs, with the resulting lowering in costs of energy.
Diamond 4: Logistics As has been demonstrated for papaya, it is uneconomical and logistically inefficient to use public buses as transport for breadfruit. The options that present themselves as viable are therefore the following:
a. Hire Trucks b. Purchase a vehicle
It is estimated that the cost to purchase or to hire a vehicle should work out to be relatively similar. For example, if a farmer should purchase a vehicle, he will be required to take on the maintenance, insurance, registration and loan repayment costs to own a vehicle. The following table demonstrates the cost considerations between the two options: Table 17: Loan to purchase vehicle valued at S$30,0 00 over 5 years* Loan amount S$30000 Loan term 5 years Interest rate 13.5% Monthly Repayments S$690.3
*The loan scenario above assumes that a farmer has enough collateral to borrow funds. This loan scenario works out to approximately S$159.00 per week. The assumption is that approximately S$40 tala per week in fuel will be used for the vehicle bringing the cost to around the same level to hire a vehicle at S$200.00 per week.
Diamond 5: Processing 20 The processing decision diamond for breadfruit is discussed in two categories. The first is the existing processed market for breadfruit while the other is a brief discussion on potential unexploited processed markets for breadfruit.
20 Processing data is presented to demonstrate value increases based on gross retail income. Further assessment of the processing side for breadfruit would be required to determine net income after expenses.

40
Processing for breadfruit takes the following forms in the Samoan market: 1. Baked fruit for direct sale to consumers 2. Boiled fruit for sale to consumers (typically in coconut cream). 3. Chipped and deep fried fruit sold in snack packs
Potential processing options for breadfruit are the following:
1. Breadfruit flour 2. Frozen breadfruit in quarters
Baked fruit for direct sale to consumers Baked fruit for direct sale to consumers is mainly sold at the main Fugalei market, but is also commonly found in several specialist shops providing customers’ access to the traditional “Sunday Umu Market21”. In addition, there are some stores that allow retailers to use their storefronts to sell to the public. Due to the proliferation of breadfruit, retailers are able to either source from their own stocks or buy from the markets as required. This trend covers the typical purchase arrangements for boiled fruit. In relation to the value chain the increase in value as a result of baking ranges from S$2.00 to S$3.00 per fruit.
Chipped and deep fried fruit sold in snack packs. The average weight of a snack pack of breadfruit chips is 100 grams. Average retail price of a snack pack is S$2.00 Therefore the gross added value per fruit considering the reduction in mass related to removal of the outer skin and seed core, estimated at approximately 1.2 kg per fruit, is S$24 per fruit.
Breadfruit flour Breadfruit flour is a current project at the SROS (Scientific Research Organisation Samoa). Despite breadfruit flour being advertised as an option for commercial development by SROS, yield data is as yet unavailable. Considering the rise in prominence of gluten free options for consumers, there is a potential market available. In conversation with the owner of two gluten free bakeries in New Zealand, Mark Stevenson, trading as Marx Bakery, the price of gluten free flours is typically 7 to 8 times higher per pound then wheat flours. This is verified on the web, with prices for tapioca flour retailing at S$8.48 per lb22 compared to wheat flour which retails at S$1.20 to S$1.30 per lb. Assuming that breadfruit can command the same prices as tapioca flour it would be reasonable to suggest that a business plan or value chain study focused in this specific area is performed once the SROS study is completed.
21 Samoa has traditional feasts on Sundays for which a traditional Umu or rock oven feast is prepared. 22 http://www.vitacost.com/Bobs-Red-Mill-Gluten-Free-Tapioca-Flour?csrc=GPF-039978025357

41
Frozen Breadfruit quarters 23 Frozen breadfruit quarters are typically sold in 12 ounce bags. These are sold for the equivalent of S$11.70 per bag24. Frozen breadfruit quarters therefore have a gross increase of S$2.00 per fruit assuming that 0.3 kg of fruit is lost during processing. Costs associated with packaging, freezing and other general costs would need to be calculated into this processing to determine the net value added.
Diamond 6: Marketing
Markets’ knowledge of the product
Domestic market Breadfruit is generally well known to the average consumer on the domestic market. It has also gained a presence in New Zealand, Australia and the US with migration from both the Pacific and in the case of the US, the Caribbean region. In terms of increasing the efficiency of this stage of the value chain, the main issue raised by stakeholders is communication between the growers and wholesalers, retailers, hotel owners etc. As has been mentioned previously for papaya, there is no branding and there have been no changes in packaging or presentation methods to improve market penetration over the past 20 years.
Export market Probably the greatest impact for communication between the market and growers is in relation to export product. There is no awareness of “brand Samoa” for example. The facility that was previously provided by the Agriculture Store Corporation as a marketing arm is also no longer in existence. This means that activities to get into contact with the export market are left to farmers or exporters that have the expertise to set up these arrangements individually. In the gross margin data for breadfruit there is no allowance for sales and marketing costs. In consideration of the financially thin margins already projected for a three acre breadfruit crop, it is highly unlikely that a farmer will have the capacity to fund such activities themselves. In relation to markets interested in developing this product, an activity by PITIC in 2009 with a tour by buyers is the only positive activity identified. Despite this tour, there is still the lack of a coordinated body in Samoa with a mandate to progress the development of breadfruit as an export product. It is estimated that should a facility/marketing arm restart the activity of the Agriculture Store cooperation that was exporting this product at 3488.7 kg of fruit per month, the annual value resulting would be S$83,728.80 assuming each kg of fruit is worth S$2.00.
23 Figures taken from product packaged in Fiji and sold on the Fiji domestic market 24 http://www.sams247.com/detail.aspx?ID=11580

42
Summary As with papaya, viable exports of breadfruit are constrained by volumes required to take advantage of the cheaper sea freight option. In turn, this is constrained by the current HTFA capacity and even in the event that a larger capacity were in operation, the ability to secure a constant supply for treatment. Unlike papaya, the study indicates a number of potentially more viable opportunities for adding value to the fruit through further processing for the domestic market which could increase returns to a similar level as potential export prices per fruit. In terms of constraints to increased production, these are relatively less important than in the papaya chain, although equipment supply is indicated as a potential constraint if not locally available. The cost of financing remains a potential constraint to setting up commercially viable operations.

43
4.3 Head Cabbage Note: Due to the similarities in the relative importance of constraints to the production and marketing of tomatoes and head cabbage, the evaluations of these chains are treated together in section 4.4.3. In the preceding sections of 4.3 and 4.4, the background information, chain structure and gross margin analyses are first presented.
4.3.1 Background Information Cabbage is a product imported in increasingly significant quantities, but also grown in not insignificant quantities in Samoa. Figure 4: Imports of Cabbage (2002 – 2007)
Cabbage Imports
0
20000
40000
60000
80000
100000
120000
Year
kg
0
100000
200000
300000
400000
500000
600000
S$
Cabbage lettuce,(head lettuce) fresh orchilled - Quantity
103641.99 68089.43 76916.89 93424.63 101523.63 109072.3
Cabbage lettuce,(head lettuce) fresh orchilled - Value CIF
351260 363215 363222 341196 355619 495873
2002 2003 2004 2005 2006 2007
However, local market data suggest that prices on the Fugalei market are volatile. Prices have trended upwards since 2000, but there is a significant seasonal effect, with limited quantities sold in the period November to March and resulting increases in prices during this period. Prices range between S$1.00 and S$3.00 per kg within a 12 month period. The market data also indicate that even in growing seasons, the volumes entering the Fugalei market are relatively small, falling below 0.5 tonnes per month in the off season and rising to a peak of 3 tonnes per month in season. Indications are therefore of a thin domestic market with volatile prices.

44
Figure 5: Monthly cabbage price and volumes on Fuga lei Market (2000 – 2008)
Chinese Cabbage - Fugalei Market
0
0.5
1
1.5
2
2.5
3
3.5
JA
N F
EB
MA
R A
PR
MA
Y J
UN
JU
L A
UG
SE
P O
CT
NO
V D
EC
JA
N F
EB
MA
R A
PR
MA
Y J
UN
JU
L A
UG
SE
P O
CT
NO
V D
EC
JA
N F
EB
MA
R A
PR
MA
Y J
UN
JU
L A
UG
SE
P O
CT
NO
V D
EC
JA
N F
EB
MA
R A
PR
MA
Y J
UN
JU
L A
UG
SE
P O
CT
NO
V D
EC
JA
N F
EB
MA
R A
PR
MA
Y J
UN
JU
L A
UG
SE
P O
CT
NO
V D
EC
JA
N F
EB
MA
R A
PR
MA
Y J
UN
JU
L A
UG
SE
P O
CT
NO
V D
EC
JA
N F
EB
MA
R A
PR
MA
Y J
UN
JU
L A
UG
SE
P O
CT
NO
V D
EC
JA
N F
EB
MA
R A
PR
MA
Y J
UN
JU
L A
UG
SE
P O
CT
NO
V D
EC
JA
N F
EB
MA
R A
PR
MA
Y J
UN
JU
L A
UG
SE
P O
CT
NO
V D
EC
2000 2001 2002 2003 2004 2005 2006 2007 2008
Year
tonn
es
0
0.5
1
1.5
2
2.5
3
S$/
kg Chinese Cabb - Price
Chinese Cabb - Quantity
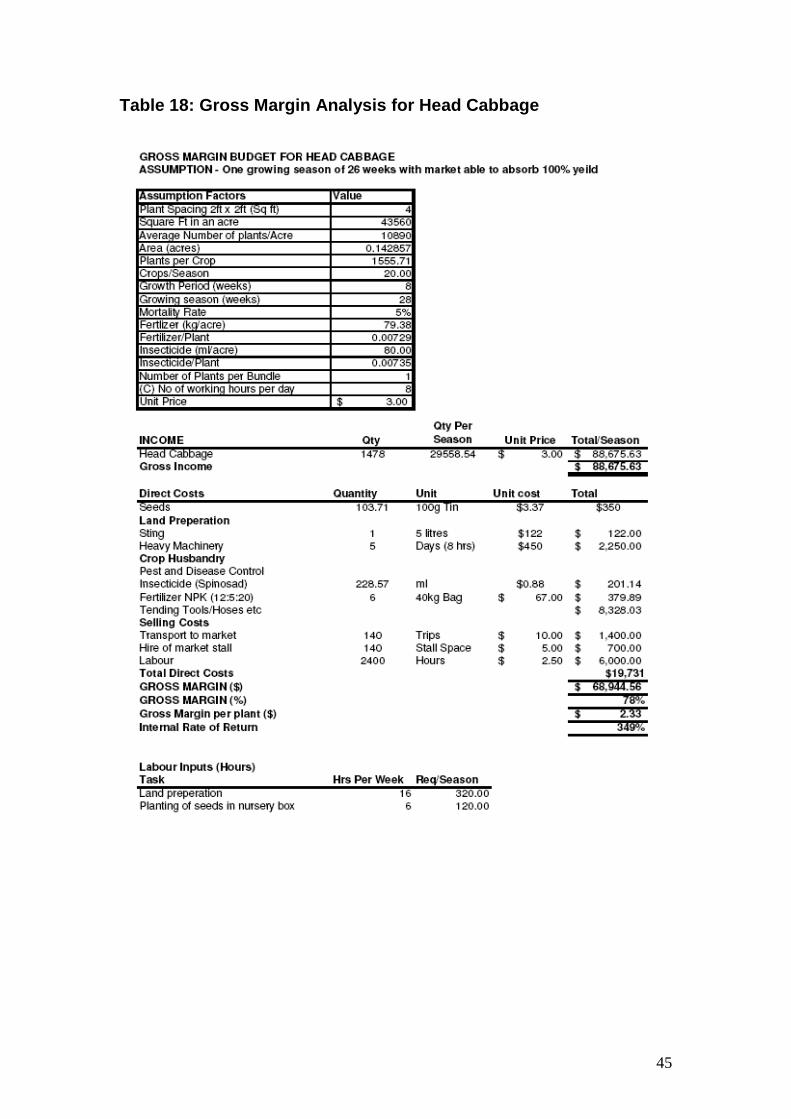
45
Table 18: Gross Margin Analysis for Head Cabbage

46
4.3.2 Assumption made in the gross margin analysis In adapting the gross margin analysis for head cabbage, a target of approximately 1500 head of cabbage per crop (equivalent to 0.14 acres) providing 20 crops per 28 week growing season was assumed. The price per head was set at S$3.00 as a price achievable on the domestic market. Although this is at the high end of the range observed at the Fugalei market between 2000 and 2008 (Figure 5), accounting for alternative domestic market segments such as supermarkets, hotels etc this unit value is considered feasible. Nevertheless, given the high level of volatility, a sensitivity analysis was conducted in which it was demonstrated that at a lower price (and higher mortality level) the gross margin is still significant and that this product should provide good returns to investment on the basis of local market opportunities.

47
Figure 6: Cabbage Value Chain Map

48
4.4 Tomatoes
4.4.1 Background Information Tomatoes are another product where imports have recently increased sharply. Figure 7: Tomato imports (2002-2007)
Tomato Imports
0
5000
10000
15000
20000
25000
30000
35000
40000
45000
Year
kg
0
20000
40000
60000
80000
100000
120000
140000
160000
$S
Tomatoes, fresh or chilled - Quantity 17979.13 17948.88 16743.25 30707.21 42680.04 38098.9
Tomatoes, fresh or chilled - Value CIF 101977 116730 147218 86649 57746 106690
2002 2003 2004 2005 2006 2007
Although imported throughout the year, most imports (2006) were in the period March to September. This is a period when supply to domestic markets of tomato produced in Samoa is at its lowest, indicating that targeted planting may result in lower competition and higher prices for product sold outside this period. Figure 8: Monthly tomato imports (2006)
Tomato Imports Monthly 2006
0
1000
2000
3000
4000
5000
6000
7000
Year
kg
0
1000
2000
3000
4000
5000
6000
7000
8000
9000
10000
S$
Tomatoes, fresh or chilled - Quantity 3001.1 2641.5 6019.1 4669.4 3051.7 4294.9 3900.1 4256.3 4864.1 1765.2 3108.8 1412.1
Tomatoes, fresh or chilled - Value CIF 6286 6518 5731 5448 6279 4487 8833 3685 2782 1377 3539 2781
Jan Feb Mar Apr May Jun Jul Aug Sep Oct Nov Dec

49
As with cabbage, the local market has low volumes transacted in many months, with peaks of seven tonnes per month in season, and resulting sharp falls in prices. Figure 9: Monthly tomato price and volumes on Fuga lei Market (2000 – 2008)
Tomatoes - Fugalei Market
0
1
2
3
4
5
6
7
JA
N F
EB
MA
R A
PR
MA
Y J
UN
JU
L A
UG
SE
P O
CT
NO
V D
EC
JA
N F
EB
MA
R A
PR
MA
Y J
UN
JU
L A
UG
SE
P O
CT
NO
V D
EC
JA
N F
EB
MA
R A
PR
MA
Y J
UN
JU
L A
UG
SE
P O
CT
NO
V D
EC
JA
N F
EB
MA
R A
PR
MA
Y J
UN
JU
L A
UG
SE
P O
CT
NO
V D
EC
JA
N F
EB
MA
R A
PR
MA
Y J
UN
JU
L A
UG
SE
P O
CT
NO
V D
EC
JA
N F
EB
MA
R A
PR
MA
Y J
UN
JU
L A
UG
SE
P O
CT
NO
V D
EC
JA
N F
EB
MA
R A
PR
MA
Y J
UN
JU
L A
UG
SE
P O
CT
NO
V D
EC
JA
N F
EB
MA
R A
PR
MA
Y J
UN
JU
L A
UG
SE
P O
CT
NO
V D
EC
JA
N F
EB
MA
R A
PR
MA
Y J
UN
JU
L A
UG
SE
P O
CT
NO
V D
EC
2000 2001 2002 2003 2004 2005 2006 2007 2008
Year
tonn
es
0
0.2
0.4
0.6
0.8
1
1.2
1.4
1.6
1.8
2
S$/
kg Tomatoes - Price
Tomatoes - Quantity
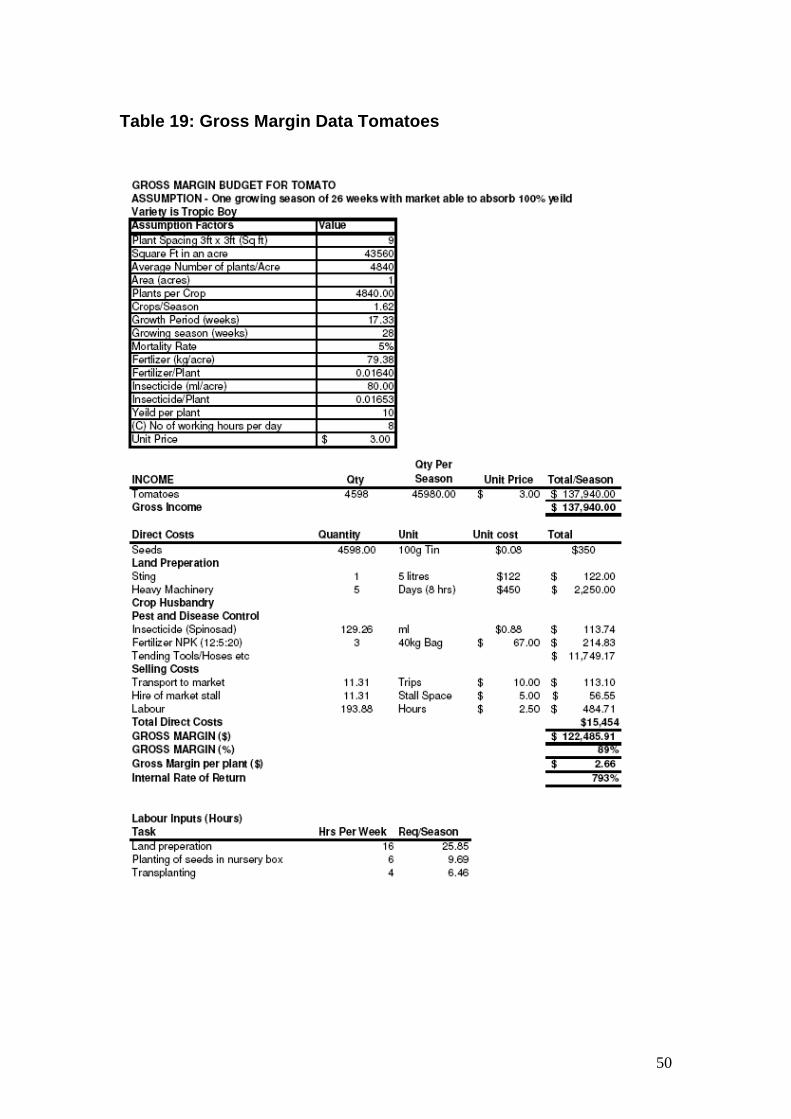
50
Table 19: Gross Margin Data Tomatoes

51
4.4.2 Assumptions made in the gross margin analysis In developing the gross margin analysis for tomatoes a one acre planting was assumed giving approximately 5000 plants or 45,0000 tomatoes over a 26 week season. A unit price of S$3.00 per kg was assumed based on an expected production rate of 10kg per plant. The production rate is based on an industry yield expectation of 25 lbs (approx 11 kg per plant). This has been reduced by 1 kg to 10kg per plant. Again, the sensitivity of the results to the market price is captured in a sensitivity analysis. Even so, as with head cabbage, given domestic market conditions, the production of tomatoes for the domestic market appears to be a viable option

52
Figure 10: Tomato Value Chain map

53
4.4.3 Assessment of the Head Cabbage and Tomato val ue chains
Diamond 1: Input Supply
Seeds, fertilizers, fungicides, pesticides and herb icides Issues raised by stakeholders in regard to input supply mentioned lack or inconsistent supply of seeds, fertilizers, herbicides, pesticides and technical support particularly in terms of training. In a discussion with the purchasing officer for the Agriculture Store Corporation, it was revealed that there is no formal line of communication between farmers and the Agriculture Store for the planned purchasing of inputs. This would align with farmer complaints during the FVSS stakeholder meetings that inputs such as seeds, fertilizers, etc are often unavailable. In order to test how this scenario would impact a cabbage farmer a call was made to the Agriculture Store to find out if they had any KK Cross Head Cabbage seeds. On this day, the seeds were not available and a confirmed date on when seeds would be available could not be ascertained. Considering the gross margin figures for head cabbage, the impact of unavailability of seeds on income is calculated at S$485.89 per day (total income divided by 182.4 days which is the total days in the growing season). The lack of availability of each input would have its own respective impacts on the output of the farm. This is a common occurrence with seed supplies for tomatoes. For example the recommended variety of tomatoes for propagation in Samoa is the Heat Master. This variety is however unavailable through the seed suppliers in Samoa. The key consideration therefore is to ensure coordinated purchasing of inputs according to the forecast requirements of farmers.
Diamond 2: Primary Production
Technical Skill One of the clearly evident issues with production identified during the farm surveys was the lack of technical expertise on the majority of farms visited. The methods used in production were largely incomplete with many commonly known techniques for production not used in the field. Few if any farmers had a clear understanding of the nutritional requirements of their crops, the husbandry methods and techniques to use for planting, control of pests etc. The variation in crop performance on even the best farms showed a lack of technical expertise in maximising yields demonstrated by significant variations in crop uniformity. Despite these limitations an interesting event was created in 2007 during the South Pacific Games in Samoa. Farmers were supplied with a series of enabling factors including free inputs, free access to government tooling (tractor), a set market and a coordinated marketing/supply chain. During this period significant volumes of produce was supplied. Therefore, it would seem

54
that despite the technical limitations seen in the field, there is still the capacity to significantly improve output if other factors are addressed.
Land Issues As has been mentioned for papaya and breadfruit, the land issue in Samoa is not a prominent issue for these crops.
Finance Supply In order to finance production on the scale assumed in the gross margin analysis, the following tables demonstrate the expected repayment structure for a loan taken to cover the required investment and working capital: Table 20: Cost of financing requirement for tomato production* Loan Amount $ 15,454.00 Annual Interest Rate 13.5% Term of Loan (in Years) 5 Monthly repayments $ 355.59 Annual Payments $ 4267.13 Total Interest $ 5881.65 Total Repayment $ 21335.65 *Loan structure based on typical Development Bank terms for Agriculture Projects. Table 21: Cost of financing requirement for cabba ge production Loan Amount $ 19,731.00 Annual Interest Rate 13.5% Term of Loan (in Years) 5 Monthly repayments $ 454.01 Annual Payments $ 5,448.09 Total Interest $ 7,509.44 Total Repayment $ 27,240.44 As per the above calculations the finance structure should enable a farm to access capital under the current market conditions and would be feasible given the calculated gross margins. The main issue would be securing capital for enabling the finance, although using the SBEC model this should be feasible. It should be noted however that the gross margin from which this forecast is taken is based on a consistent production yield. Should weather challenges, input challenges, market changes (volume demands), etc affect the project, there will definitely be challenges due to the high cost of finance and lack of tools available to mitigate such events.

55
Diamond 3: Post Harvest Treatment
Grading and Sorting Grading and sorting of cabbage and tomatoes for distribution to the market is done initially on-farm. All produce is harvested for immediate supply to the market. Cabbage and tomatoes are typically graded on size and priced accordingly. In terms of the value chain, the impact of grading and sorting as a value chain cost was not evident, but becomes significant further down the value chain when assessing impact in diamond 6 for marketing.
Storage In terms of head cabbage, the product has a naturally longer shelf life in ambient temperature and will typically last for three weeks. As with the examples demonstrated for papaya and breadfruit, the significant cost of electrical energy negates the value of storing cabbage in cold rooms. This is also the case for tomatoes.
Diamond 4: Transport (Logistics)
Domestic Market Transport As has been demonstrated for papaya and breadfruit, the most economical method of transport for these products to market is either purchasing a vehicle or hiring one.
Export Market Transport Head cabbage and tomatoes are currently exported to both American Samoa and the Tokelau Islands. Both of these destinations have a transit time of less then 24 hours which suits the shelf life of both these products. There were no clearly evident constraints to the value chain in regard to transport to these markets. If the export of the product is considered for markets further afield, the scenario would change significantly as shelf life and associated freight costs would need to be accounted for.
Diamond 6: Markets
Marketing capacity Cabbage and tomatoes have typically volatile relationship with supply as per the data that is compiled by the Central Bank. Variations in production due to weather and seed supplies, as well as seasonal planting to meet festive days are very common. There is also a poorly coordinated relationship between producers, large wholesalers and retailers which has led to a significant import market. For example, during the FVSS stakeholder meetings, the larger importers cited the need for farmers to improve their capacity to supply quality produce in consistent volumes with consistent pricing. The cost of this lack of coordination as well as the inability to achieve market expectations is estimated at S$109,000.00 per annum for head cabbage and S$58,000.00 for tomatoes on the basis of import volumes. Surprisingly, the cropping requirements to meet this imported demand is relatively small with a

56
properly managed single acre of each crop type capable of replacing the imported volumes.
Summary On the basis of the gross margin analysis, there are clear positive returns to production for the local market. In evaluating the constraints to improved chain performance for both head cabbage and tomatoes, the analysis suggests that providing that financing for start up can be obtained, the main constraint to ensuring adequate returns is in ensuring that the domestic market is adequately coordinated to ensure that consistent supplies are available without saturating market segments to the extent that prices are significantly depressed.

57
5. Categorisation of priority constraints In each of the four crops assessed the five categories of critical areas to address from a value chain standpoint and which are closely aligned with the decision diamond layout are observed:
1. Input supply 2. Production in field (methodologies including technical expertise) 3. Processing 4. Marketing 5. Finance
On the basis of the identified constraints in terms of service provision to the value chain, further investigations were undertaken through informal interviews with key service providers and users involved in these activities. The constraints identified in the value chain mapping can be broadly related to the following service providers:
1. Finance Suppliers 2. Insurance Suppliers 3. Planting/Processing Research and Development suppliers 4. Agricultural tooling suppliers 5. Market intelligence suppliers
Finance Suppliers The finance structure in Samoa is made up of commercial and developmental lending institutions. Four commercial banks (ANZ, WESTPAC, Samoa Commercial Bank and National Bank) make up the formal commercial lenders. These are governed by the Central Bank. In addition to this there is the Development Bank of Samoa (DBS), which despite its development mandate, lends on commercial industry standard terms. Smaller lenders have also begun to become active in the market such as Federal Pacific Finance and SPBD. Generally, commercial finance in Samoa is expensive when compared to that available in industrialised country financial markets. The following table provides the lending rates and deposit rates of the four major banks. Table 22 Average interest rates on loans (Source: Central Bank Samoa)

58
On the developmental side there are a range of products available through aid donor agencies such as AusAid, NZ Aid, FAO, UNDP, Canada Fund, EU Micro-projects etc and mainly comprise of grants or loan guarantee support. These are managed through the National Project Coordinator of the Ministry of Agriculture channelled through the Government Treasury. On the 16th of June 2008, a combined funding approach was been taken by UNDP and NZ Aid to fill a vacuum in funding available to the Private Sector using what is called the Private Sector Support Facility or PSSF.
Issues raised by sector for finance
1. High interest rates limiting capacity for borrowing are due to high official Central Bank Rates. Agriculture, due to its high risk nature often attracts the higher end of the rates of the commercial rates. Oddly enough, guaranteed funds provided by Small Business Enterprise Centre which pose practically no risk to lenders is still subject to extremely high interest rates in the range of 13.5%. In interviews with one lender, there was little interest in considering a review of the rates in this scenario.
2. The lack of collateral to secure funding due largely to land being customary or lease land
3. There is considerable difficulty in accessing aid grants/funds due to the complicated application process and limited capacity of many producers to follow this process
4. There is a limited amount of funding available in terms of grants for large capital intensive projects since many of the funding options are limited to values of S$100,000 or less.
SBEC, with funding from FAO under the EU AAACP is currently undertaking an assessment of the financing needs of different categories of producer of the products analysed in this study, to obtain a better appreciation of the types of financing products required. This will be a first step in better tailoring products to the needs of agricultural producers as a way of overcoming the financing constraint.
Insurance suppliers Samoa has several insurance companies. In interviews with National Pacific Insurance, Tugaga Insurance and Samoa Life Assurance Corporation, none of these groups provide specialist insurance for the agricultural sector in terms of yield insurance, adverse weather against crops etc. Insurance in Samoa is largely focused on buildings (fire, flood, cyclone), theft of fixed assets etc with no insurance for crops. This severely restricts the capacity to use insurance as a form of collateral when seeking finance, as the crop holds the majority of the value. Despite insurance providers’ interest in being involved in the sector this is dependant on the capacity of farmers to afford the insurance costs. Due to the nature of the risk assessments that have been performed, according to Talofa Insurance Services, the cost of the insurance is extremely high.
59
Separate to the commercial insurance companies, Samoa has a guarantee scheme known as Samoa Small Business Enterprise Centre or SBEC. This provides an insurance type guarantee to lenders at S$50,000 for individuals and S$75,000 for companies. In effect it takes up the market gap in collateral caused by the land tenure system. According to the management of SBEC, there has been good uptake and low default rates.
Issues raised by sector regarding insurance
1. The lack of insurance is further increasing risks of investment in the sector, dissuading commercial lenders
2. The small amounts guaranteed by SBEC which exclude costly, yet required capital investments
3. Development bank using the same financial risk models of the commercial banks (debt to asset ratios) which are more suited to developed economies.
Planting/Processing Research and Development Suppli ers Research and development has largely been performed from a crops standpoint by the Nuu Crops Research Centre (a government funded arm of the Agriculture Ministry) and the University of the South Pacific Agriculture arm based in Samoa. A relatively recent addition to these has been the Scientific Research Organisation of Samoa (SROS) in 2006. Recently the Ministry of Agriculture has taken the initiative of publishing crop tending information in the Samoa Observer newspaper. R&D in the agricultural sector is summarised quite accurately by the following statement: “While the institute undertakes useful research, its recommendations and findings are rarely communicated by agricultural extension, which is rarely market-oriented”25
Issues raised by sector on R&D
1. Information on research and development is hard to find and access 2. Extension officers in some cases know less then the people they are
training 3. It is very difficult to get extension officers to visit the farms on a regular
basis 4. Growing techniques promoted by Extension officers do not yield the
expected results. 5. Tools such as tillers and tractors are too light to plough the extremely
rocky soils.
25 Source ADB: http://www.adb.org/Documents/Reports/PSA/SAM/PSA-SAM.pdf

60
Agricultural tooling suppliers The main supplier of agricultural tooling to the sector is the Agriculture Store Corporation run by Government as a state owned enterprise. In addition to this there is “Farm Supplies” which is a privately owned agricultural equipment supplier, and approximately six hardware stores supplying mainly tools such as spades, picks, wheelbarrows, fencing etc. The Agriculture Store Corporation has also participated in the sector as a marketing arm for agricultural produce although this role has since been scaled back and no longer runs.
Issues raised by sector on Agricultural Tooling Sup pliers
1. Seed supplies often run short. 2. The fertilizers supplied do not create the expected yields 3. Only conventional agricultural fertilizers and chemicals available, with
very limited organic options available 4. Fertilizer supplies often run short, e.g. Lime. 5. There are no packaging options for produce sold or marketed by
agricultural suppliers 6. The very high cost of tools at the government run Agriculture Store
compared to other suppliers, indicating either high mark-ups or poor product sourcing compared to other suppliers.
Market Intelligence Suppliers Market intelligence in Samoa is spread over two ministries and the Central Bank. The Central Bank collates a daily market report on volumes and prices on a set range of the highest produced agricultural commodities. The Customs Department collects data on the CIF value of all imports which is collated by the Statistics Department. In addition the Ministry of Agriculture broadcasts daily information on what is available at both of the two main markets (one based in Upolu the main island and the other on Savaii).
Issues raised by sector on market intelligence supp liers
1. No buyers of produce interviewed used the market reports developed by the Agriculture Ministry. The typical method of sourcing supplies is to either call established suppliers, visit retail outlets or order based on visits or phone calls from suppliers notifying availability.
2. Statistics on imports are not readily available and are restricted to those who are aware of their existence.
3. There is no readily available market intelligence for farmers or manufactures to use as a guide for production
4. There is no interface for buyers to purchase goods that may be available.

61
6. Informing the design of implementable activitie s With reference to the different categories of constraint, the following activities are suggested:
6.1 Input supply A coordinated approach to input supply between farmers, manufacturers, processors and input suppliers needs to be created. According to one input supplier there is no formal link between farmer requirements and themselves. Stock replenishment decisions are based on replacing stock as it runs out. There is no formal avenue that farmers can use to order stock. There is also a limitation that stock replenishment is only done once a sufficient volume is available to fill a container load of supplies to reduced freight costs. A useful activity therefore would be to create and trial a system of coordinated purchase to improve the value chain performance in this area.
6.2 Production Field production is a major issue for both small scale and commercial farmers. Yield variations, crop size variations and cropping variations all combine to influence the output in the field. Despite this as has been mentioned in the value chain for tomatoes and cabbage, suboptimal field yields were overcome in the past when input supply and market coordination were addressed. It would therefore be a useful exercise (i) to better understand the features of this successful case study and (ii) to concentrate activities into domestic market coordination and into input supply for breadfruit and papaya, for example, to identify if the similar results could be achieved.
6.3 Processing Processing in regard to the two fruits is particularly restricted at the HTFA stage of the process. As has been demonstrated the requirement for addressing this for these two fruits is a minimum 4 tonne capacity HFTA unit. Given the inadequate current levels of supply of individual fruits, it would be a useful activity for a forecast capacity requirement to be undertaken considering all fruit types to be processed, their volumes and the frequency of harvest to ensure delays/waste at this stage are minimised through appropriate coordination. In the initial stages a 4 tonne capacity machine needs to be put in place to allow development of viable export of fresh fruit. A detailed cost benefit analysis of an investment in such capacity would be required to demonstrate to potential funders, the likely impact. Given the current situation, it is unlikely

62
that the private sector would invest in this facility, requiring public sector investment for start up.
6.4 Marketing Marketing requires coordination for all crop types studied. As has been suggested in the workshops held as part of the Fruit and Vegetable Sector Strategy, the formation of a structure to coordinate the linkage between the markets and the producers is a significant and critical requirement. This claim is backed up by the current study. As an initial activity, piloting a coordinating platform including building communications links between suppliers and buyers would be a useful activity (e.g., website, text messaging etc) in (i) generating consistent supply and (ii) minimising the threat of market saturation. In addition to this an ethical platform for coordinating payments to farmers needs to be put in place to prevent a repeat of the experience with export product under the HFTA where farmers were not paid for their produce.
6.5 Finance Finance under the fruit tree scenarios in particular, clearly requires an improved structure to allow it to become a useful tool in the sector. The creation of a finance package workable under the yield levels assumed needs to be created. Creating a pilot package to be offered to sector actors is critical to giving the sector the required cash flow to operate. The current survey by SBEC would form the basis of this activity
7. Links to the FVSS implementation plan This study is a first step in providing the type of information required to efficiently and effectively address the constraints to value chain development that have been identified during the process of the FVSS development. In the absence of available data production and price data, it uses gross margin analysis approach in an attempt to highlight the relative importance of constraints to value chain development. In doing so, it points to the need for improved coordination in (i) the provision of market information to allow producers to better assess the viability of investing in the production of specific crops and (ii) ensuring adequate and affordable supplies of required production inputs, (iii) in ensuring a consistent supply to the domestic market and potentially for export and (iv) in the provision and operation of higher capacity treatment plants.

63
As an initial step the first activity is to identify the volumes of crop that are required to meet market demand. In this respect a “Hub” has been suggested in the FVSS as a mechanism for collating and providing this market information. Once this information is collated predicted cropping volumes need to be established to determine input requirements and land area required. This would require a dual activity of identifying farmers and coordinating with input suppliers to provide the required tooling to enable the activity. It is suggested than an evaluation of the costs and benefits (how costs would be recouped) is performed prior to initiating this component of the FVSS. Concurrently, a pilot finance package run through an existing partner finance institution and matched to the gross margin yields of each crop type needs to be initiated. Under the FVSS, SBEC is conducting an assessment of the financing needs of different categories of farmers. This will provide a basis for follow up activities by FAO in designing pilotable finance packages. Once mechanisms are in place for ensuring that market volumes, farmers and input suppliers are coordinated, the second tier of development needs to come into play. This is in terms of coordinating the logistics for supply between the suppliers and the market. Production schedules of farms need to match contracted volumes according to market requirements to ensure consistent market supply. Timing crop propagation to yields requirements will ensure bottlenecks do not occur and create waste/losses along the chain. Again the FVSS suggests that a “Hub” could play a critical coordination role in this respect. Similarly, decisions need to be taken as to how treatment plant constraints can be overcome. The information contained in this study could provide an initial basis for ensuring that the design of such activities is viable and fully accounts for the key identified constraints to sector development.

64
ANNEX 1 – Gross Margin Analysis Spreadsheets. Double click to Spreadsheet to open
Acres Planted 2Plant Spacing (m2) 9Growth period (mths) 36Land prep costs /acre 3150Fencing 3000No, of fruit/tree Harvested:Year 1 2.5 6750Year 2 3 32400Year 3 2.5 27000Fruit Mortality 0%Proportion Sold Export 50%Proportion Sold Domestic 50%Export Price ($/fruit) 1.00$ Average Weight per fruit 0.50Domestic Price ($/Fruit) 0.65$ Packaging Cost (6 fruit per box) 0.30$ Income ($) Year 1 Year 2 Year 3Export MarketNo. of Fruit Sold 3,375 16200 13500Sale of Papaya 3,375.00$ 16,200.00$ 13,500.00$ Local MarketNo. of Fruit Sold 3,375 16,200 13,500Weight Sold (kg) 1,688 8,100 6,750Sale of Papaya 2,193.75$ 10,530.00$ 8,775.00$ Total Income 5,568.75$ 26,730.00$ 22,275.00$
Direct Costs ($)Planting Material (450 seedling @ $0.50 450 0 0Land preparation 6300Sting (1 litre@$24.40/Litre) 48 0 0Fencing 6000Crop HusbandryFertilizer (NPK 12:5:20@ $67/40kg Bag) 1072 804 804MarketingTransport to market ($10 per trip) 240 520 520Transport to HTFA facility ($30 per trip) 720 1560 1560Hire of market stall ($5.00/Day) 60 260 260Packaging Costs 1,012.50$ 4,860.00$ 4,050.00$ Labour 1,600.00$ 4,720.00$ 4,720.00$ Total Direct Costs 17,502.50$ 12,724.00$ 11,914.00$
GROSS MARGIN (4) 11,933.75-$ 14,006.00$ 10,361.00$
FIXED COSTS ($)Bins (5 @ $25/Bin) 125Ladders (2@ $300/Ladder) 600Registration for export Association 20 10 10Total Fixed Costs 745 10 10NET INCOME ($) 12,678.75-$ 13,996.00$ 10,351.00$
Labour Inputs (Days)Task Year 1 Year 2 Year 3Land Preperations -Spraying & Slashing 8 0 0Planting 12 0 0Weed Control 12 12 12Fertilizing 4 4 4Fruit thinning 8 12 12Havesting and packing 12 104 104Marketing 24 104 104Total labour requirements - days 80 236 236Total Number of full time labour 0.33 0.98 0.98Average Wage Rate ($/unit)(Days) 20 20 20Total Cost of labour 1600 4720 4720Nett Income 12,678.75-$ 13,996.00$ 10,351.00$ Crop Income: 11,668.25$
Capacity Of HFTA 300
Year 1 2 3Number of harvests 17 52 52Qty per Harvest (kg) 99.26 155.77 129.81Capacity of HFTA (kg) 300 300 300Unused Capacity 200.74 144.23 170.19Capacity loss at $0.55 SAT per kg 110.40$ 79.33$ 93.61$
Total Loss to HFTA for crop 1,876.88$ 4,125.00$ 4,867.50$
Total Loss for 1 crop cycle: 10,869.38$ 2
Cost of Freight Scenarios Year 1 Year 2 Year 3 TotalFruit Yield in kg 1,688 8,100 6,750 16,538Freight Cost Air ($2SAT/Kg) 3,375.00 16,200.00 13,500.00 33,075Freight Cost Sea ($.1875/Kg) 316.40625 1518.75 1265.625 3,101Cost Differential (SAT) 3,058.59 14,681.25 12,234.38 29 ,974.22