an assessment of field-portable x-ray fluorescence
TRANSCRIPT

Geochemistry: Exploration, Environment, Analysis Online First
10.1144/geochem2012-159, first published February 4, 2014; doiGeochemistry: Exploration, Environment, Analysis
Thomas Quiniou and Valérie Laperche iron in laterite ore (New Caledonia)An assessment of field-portable X-ray fluorescence analysis for nickel and
serviceEmail alerting to receive free e-mail alerts when new articles cite this article hereclick
requestPermission to seek permission to re-use all or part of this article hereclick
SubscribeAnalysis or the Lyell Collection
to subscribe to Geochemistry: Exploration, Environment,hereclick
How to citearticles
for further information about Online First and how to citehereclick
Notes
© The Geological Society of London 2014
at Bureau De Recherches Geologiques Et Minieres BRGM, FRANCE on February 5, 2014http://geea.lyellcollection.org/Downloaded from at Bureau De Recherches Geologiques Et Minieres BRGM, FRANCE on February 5, 2014http://geea.lyellcollection.org/Downloaded from

Geochemistry: Exploration, Environment, Analysishttp://dx.doi.org/10.1144/geochem2012-159Published Online First
© 2014 AAG/The Geological Society of London
During all phases of the mining process, from exploratory screening to the quality control of final products, the mining industry has a wide array of testing and analysis needs. Ele-mental and mineral analyses are usually performed in the laboratory. The actual workload, which involves several steps such as sampling, drying, grinding and analysis, takes time (from several hours to days). Having access to metal content and concentration data in real time, directly in the field, would help geologists in making decisions and save time, effort and also money. In recent years, portable analytical tools have emerged. They can be classified into two catego-ries depending on the analytical information provided, molecular or atomic. The first, based on infrared or Raman technologies, is dedicated to mineral identification (e.g. the Agilent FlexScan, Thermo Scientific TruDefender, Intevac RockHound), whilst the second, based on XRF (e.g. Thermo Scientific XL3t, Olympus Innov-X) or LIBS (Ivea MobiLIBS) technologies (Fortes & Laserna 2010), allows multi-elemental chemical analysis to be performed.
Field-Portable X-ray fluorescence (pXRF) is currently used in many different disciplines, for example: environmen-tal remediation (Kalnicky & Singhvi 2001; Laperche et al. 2008; Higueras et al. 2012), recycling, archaeological applica-tions (Cesareo et al. 2009), health and geology/mining (Houlahan et al. 2003). Thanks to the commercialisation of
miniature X-ray tubes and the development of cost-effective Silicon Drift detector (SDD) technology, pXRF technology is becoming more affordable. Because the technique is non-destructive, multi-elemental, fast and cost-effective and can be directly applied to certain types of samples without any preparation, it is ideally suited for a number of applications. A good example is archaeology, where pXRF allows in-situ analysis of historical objects that cannot be easily moved to the laboratory. In the mining context, one would expect a similar revolution but, at least in New Caledonia, miners are cautious because analysis is often inaccurate and imprecise on natural samples when no preparation is envisaged or pos-sible in the field. Whatever the XRF device used, the sample (standards as well as unknowns) must always be prepared with strictly the same protocol. Chemical and physical matrix effects (Markowicz 2008) are sources of error unless meth-ods to correct for them are put in place.
Although processors and embedded signal processing devices are becoming more sophisticated and efficient, no instrument can fully compensate for all chemical and physical effects. All operators should keep this limitation in mind and analyse results with a critical eye (e.g. measurement uncer-tainty), especially when analysing raw samples in the field. Therefore, knowledge of capabilities and limitations of the instrument and sample features is critical. Portable XRF
An assessment of field-portable X-ray fluorescence analysis for nickel and iron in laterite ore (New Caledonia)
Thomas Quiniou1 & Valérie Laperche2*1Pôle Pluridisciplinaire de la Matière et de l’Environnement, PPME EA 3325, Université de la Nouvelle-Calédonie, BP
R4, 98851 Nouméa Cedex, New Caledonia2Bureau de Recherche Géologique et Minière, D3E/BGE,3 Avenue Claude Guillemin, 45060 Orléans, France
*Corresponding author (e-mail: [email protected])
AbsTrACT: The aim of this work was to determine how in-situ portable XRF (pXRF) analysis of ores (in this study, nickel and iron) may be consistent with data obtained from well-prepared samples analysed by conventional XRF methods, and to investigate potential sources of error in field measurements due to different chemi-cal composition, moisture content and particle size. For this study, 201 samples of saprolite and laterite, sieved at 125 μm, were selected for their Ni and Fe contents (from 0.119 to 5.225 % Ni and from 4.7 to 37.2 % Fe for saprolite samples and from 0.38 to 2.94 % Ni and from 21.5 to 55.55 % Fe for laterite samples), compressed to make powder pellets and used to calibrate the pXRF. It is shown that for these two elements, pXRF can correlate extremely well (r2 > 0.98, relative standard error <7 %) with conventional laboratory results when samples are suitably prepared (dried, pul-verized and pelletized). Laboratory analysis of a few artificially wetted samples shows that both Ni and Fe estimated concentrations are directly proportional to moisture content. In the field, two experiments were conducted, one on an air-dried drill-core and the second directly on the pit face. The results indicate that because of sample heterogeneity, Ni and Fe contents are better estimated in the laterite layer than in the saprolite layer. Despite the many challenges associated with field conditions, pXRF can provide useful benefits for a number of applications in the mining sector.
Keywords: portable XRF, nickel ore, iron, in-situ analysis, mining, moisture, granulometry
2012-159 research-articleThematic set: portable XrFXXX10.1144/geochem2012-159T. Quiniou & V. LapercheFPXRF Analyzer for Ni and Fe content of Laterite Soils2014
at Bureau De Recherches Geologiques Et Minieres BRGM, FRANCE on February 5, 2014http://geea.lyellcollection.org/Downloaded from

T. Quiniou & V. Laperche 2
instruments are more than a simple point-and-shoot technol-ogy and this knowledge can only be obtained if time has been devoted to methodology and data quality objectives.
The aim of this work is to study potential error sources in field measurements due to different chemical composition, moisture content and particle size. Because measurements by pXRF are influenced by these factors, it is important to inves-tigate their impact and determine the best adjustment factors in order to achieve results comparable to laboratory analyses (e.g. ICP-MS, ICP-AES).
sTudy siTeNew Caledonia, lying just north of the Tropic of Capricorn, is an island group located in the SW Pacific, 2000 km east of Australia. It comprises one main mountainous island, known as the ‘Grande Terre’, surrounded by a barrier reef, and several smaller islands. New Caledonia is the world's third largest pro-ducer of nickel ore, after Russia and Canada, and yields c. 25 % of the world's lateritic nickel reserves. With increasing nickel mining by both private and public companies, the nickel indus-try is becoming even more important to New Caledonia's economy than in the past.
New Caledonia’s nickel resources come from the tropical weathering of ultramafic rocks (peridotites) that cover about one third of the Grande Terre. These rocks were tectonically emplaced (obducted) over New Caledonia during the Late Eocene (c. 34 Ma; Cluzel et al. 2001) and are referred to as ‘Peridotite Nappe’. Peridotites mainly outcrop in the south-eastern part of the island (Massif du Sud) and in smaller massifs distributed along the west coast (Fig. 1).
Four main horizons are recognized in weathering profiles developed upon peridotites (Fig. 2), with, from the base to the top: (1) coarse saprolite (S1) developed over the bed-rock (P) where Ni is concentrated in residual and neoformed hydrous silicates (nickeliferous serpentine, talc and smectite, referred to as garnierite); (2) fine-grained yellow laterite (L1) mainly composed of Ni-bearing Fe oxy-hydroxides; (3) red laterite (L2), a granular material mainly composed of Ni-poor
Fe oxy-hydroxides; and (4) ferricrete on top (F1 and F2). On some profiles, a thin discontinuous layer of granular cobalt (Co) ore (asbolane; S2) often enriched in chromium (Cr) and manganese (Mn) oxides, appears on top of the coarse sapro-lite horizon. This sub-layer is named fine saprolite.
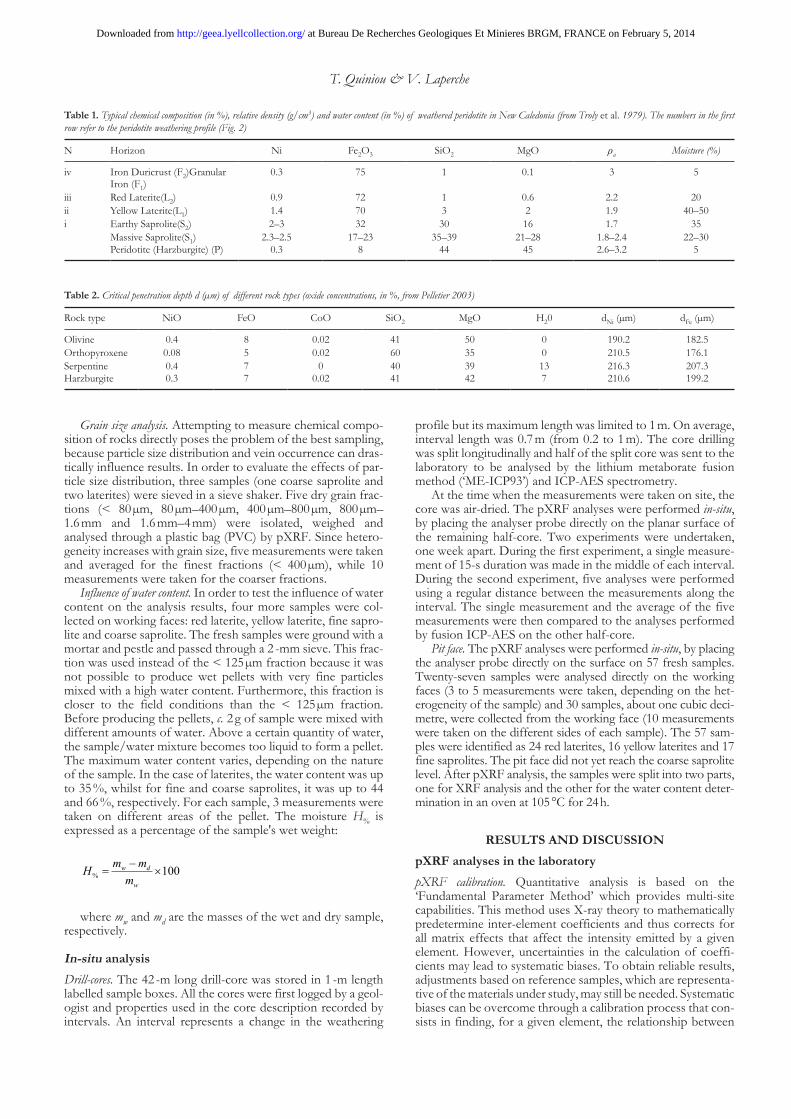
The typical composition of a theoretical profile is given in Table 1 (from Troly et al. 1979). It shows that Fe content increases along the weathering profile from base to top while silica and magnesia decrease. Silica and Fe are major chemical elements in saprolites and laterites, respectively.
Nickel ore in New Caledonia is worked in open pit mines and c. 9 Mt of wet ore was produced in 2010, which consists of 70 % saprolitic and 30 % lateritic ore. Two different processes have been developed for extracting Ni from saprolite (silicate ore), or laterite (oxidised ore). Low-Fe saprolite ore is pro-cessed by pyrometallurgy to be transformed into ferro-nickel and matte in a smelter plant, Société Le Nickel (SLN) and Koniambo Nickel SAS (KNS). Laterite processing is based on hydrometallurgy (Vale NC), which allows Ni to be extracted by acid leaching (sulphuric acid).
MATeriALs ANd MeThodsDifferent types of samples were used for this study, such as well-prepared samples for the calibration of the pXRF in the laboratory, core samples to test the calibration on-site and fresh samples analysed directly on the working face. The chemical analyses of all the samples, used in this study to be compared to our pXRF data, were performed by XRF spec-trometry (PW 1606, Panalytical) on glass beads by borate fusion (1 g of sample for 9 g of Li2B4O7).
pXrFAll pXRF analyses were performed using the Niton XL3t-900 GOLDD model. This energy dispersive pXRF is fitted with a 50 kV X-ray tube (max. 50 kV, 100 μA, 2 W) with an Ag anode target excitation source and a Large Drift Detector (LDD). The analysed spot had an average diameter of 8 mm. As part of
Fig. 1. Simplified geological map of New Caledonia (Figure courtesy of Dr D. CLUZEL, UNC, New Caledonia).
at Bureau De Recherches Geologiques Et Minieres BRGM, FRANCE on February 5, 2014http://geea.lyellcollection.org/Downloaded from

FPXRF Analyzer for Ni and Fe content of Laterite Soils 3
the standard set-up routine, the analyser was initially energy calibrated using the embedded silver target to avoid contami-nation. The source count time for the analysis was set at 30 sec-onds for the main filter (for Ni and Fe field determination) and 120 s for the total analysis using the 4 filters of the pXRF in the laboratory (to also determine lighter elements such as Si and Al). All analyses were carried out using the mining mode cali-bration performed by the manufacturer. The limit of detection (LOD) of Ni in a Fe matrix is c. 0.05 %.
Laboratory analysisFor this study, 98 samples of saprolite and 103 samples of laterite, sieved at 125 µm, were retrieved from the sample archives of mining companies. In addition, borate fusion XRF reference val-ues were also delivered for all samples. The choice of these sam-ples was based on Ni and Fe contents from 0.119 to 5.225 % Ni and from 4.7 to 37.2 % Fe for saprolite samples and from 0.38 to 2.94 % Ni and from 21.5 to 55.55 % Fe for laterite samples.
The samples (c. 3 g) were then placed in a press to produce pellets. In order to evaluate the minimum thickness of the pel-lets, the penetration depth of X-rays has been calculated (Potts et al. 1997) for different rocks. As can be seen from Table 2, the critical penetration depth is limited to a few hundred µm. In this study, all samples were prepared so that their thickness exceeds 2 mm (average 3 mm).
pXRF calibration. All the pellets were analysed with the pXRF and the results used to determine two sets of XRF cali-bration factors for Ni and Fe elements, one for the saprolites and the other for the laterites. The calibration was performed on pulverized and pelletized samples. Since the number of samples is large, each sample was measured once with 30 s duration. In the particular case of laterites, two additional anal-yses were performed by placing a Kapton or a PVC foil between the instrument head and the sample. In both cases, the foils had a thickness of 110 µm.
Temporal and spatial standard deviation. In order to evaluate the temporal and spatial standard deviation of raw concentrations, four pelletized samples were selected. Temporal dispersion is a measure of instrument precision while spatial dispersion is a measure of both instrument precision and sample heterogene-ity. For each sample, a total of 18 pXRF analyses were carried out on 6 different zones (p=6) on both sides of the pellet. Each zone was then measured 3 times (q=3), leaving the head instrument at exactly the same place. Ci,j is the jth measure of the raw concentration in the ith position. In this way, both tem-poral and spatial standard deviation can be calculated. Obviously, laboratory testing of well-prepared samples (dried, crushed and pelletized) represents an ideal situation and is far from being representative of in-situ conditions, but it enables an idea of the lower limits to be obtained.
For each position p, the local average concentration mi (i=1…p) can be calculated from the q measurements:
mq
Ci i jj
q
==∑1
1,
The local sample standard deviation si is given by:
sq
C mi i j ij
q
=−
−( )=∑1
1 1,
and the global average concentration of the sample by:
mp
mii
p
==∑1
1
We define the temporal standard deviation st as the average of local standard deviations over the p zones and the spatial standard deviation sm as the standard deviation of local aver-ages. Therefore, the temporal standard deviation is given by:
sp
st ii
p
==∑1
1
and the spatial standard deviation by:
sp
m mm ii
p
=−
−( )=∑1
1
2
1
Fig. 2. The four horizons of the peridotite weathering profile.
P: Peridotite, S1: Coarse Saprolite, S2: Fine Saprolite, L1: Yellow Laterite, L2: Red Laterite, F1: Granular Iron and F2: Iron Duricrust (Picture from Vale NC).
at Bureau De Recherches Geologiques Et Minieres BRGM, FRANCE on February 5, 2014http://geea.lyellcollection.org/Downloaded from
T. Quiniou & V. Laperche 4
Grain size analysis. Attempting to measure chemical compo-sition of rocks directly poses the problem of the best sampling, because particle size distribution and vein occurrence can dras-tically influence results. In order to evaluate the effects of par-ticle size distribution, three samples (one coarse saprolite and two laterites) were sieved in a sieve shaker. Five dry grain frac-tions (< 80 µm, 80 µm–400 µm, 400 µm–800 µm, 800 µm–1.6 mm and 1.6 mm–4 mm) were isolated, weighed and analysed through a plastic bag (PVC) by pXRF. Since hetero-geneity increases with grain size, five measurements were taken and averaged for the finest fractions (< 400 µm), while 10 measurements were taken for the coarser fractions.
Influence of water content. In order to test the influence of water content on the analysis results, four more samples were col-lected on working faces: red laterite, yellow laterite, fine sapro-lite and coarse saprolite. The fresh samples were ground with a mortar and pestle and passed through a 2 -mm sieve. This frac-tion was used instead of the < 125 µm fraction because it was not possible to produce wet pellets with very fine particles mixed with a high water content. Furthermore, this fraction is closer to the field conditions than the < 125 µm fraction. Before producing the pellets, c. 2 g of sample were mixed with different amounts of water. Above a certain quantity of water, the sample/water mixture becomes too liquid to form a pellet. The maximum water content varies, depending on the nature of the sample. In the case of laterites, the water content was up to 35 %, whilst for fine and coarse saprolites, it was up to 44 and 66 %, respectively. For each sample, 3 measurements were taken on different areas of the pellet. The moisture H% is expressed as a percentage of the sample's wet weight:
Hm m
mw d
w% =
−×100
where mw and md are the masses of the wet and dry sample, respectively.
in-situ analysisDrill-cores. The 42 -m long drill-core was stored in 1 -m length labelled sample boxes. All the cores were first logged by a geol-ogist and properties used in the core description recorded by intervals. An interval represents a change in the weathering
profile but its maximum length was limited to 1 m. On average, interval length was 0.7 m (from 0.2 to 1 m). The core drilling was split longitudinally and half of the split core was sent to the laboratory to be analysed by the lithium metaborate fusion method (‘ME-ICP93’) and ICP-AES spectrometry.
At the time when the measurements were taken on site, the core was air-dried. The pXRF analyses were performed in-situ, by placing the analyser probe directly on the planar surface of the remaining half-core. Two experiments were undertaken, one week apart. During the first experiment, a single measure-ment of 15-s duration was made in the middle of each interval. During the second experiment, five analyses were performed using a regular distance between the measurements along the interval. The single measurement and the average of the five measurements were then compared to the analyses performed by fusion ICP-AES on the other half-core.
Pit face. The pXRF analyses were performed in-situ, by placing the analyser probe directly on the surface on 57 fresh samples. Twenty-seven samples were analysed directly on the working faces (3 to 5 measurements were taken, depending on the het-erogeneity of the sample) and 30 samples, about one cubic deci-metre, were collected from the working face (10 measurements were taken on the different sides of each sample). The 57 sam-ples were identified as 24 red laterites, 16 yellow laterites and 17 fine saprolites. The pit face did not yet reach the coarse saprolite level. After pXRF analysis, the samples were split into two parts, one for XRF analysis and the other for the water content deter-mination in an oven at 105 °C for 24 h.
resuLTs ANd disCussioNpXrF analyses in the laboratorypXRF calibration. Quantitative analysis is based on the ‘Fundamental Parameter Method’ which provides multi-site capabilities. This method uses X-ray theory to mathematically predetermine inter-element coefficients and thus corrects for all matrix effects that affect the intensity emitted by a given element. However, uncertainties in the calculation of coeffi-cients may lead to systematic biases. To obtain reliable results, adjustments based on reference samples, which are representa-tive of the materials under study, may still be needed. Systematic biases can be overcome through a calibration process that con-sists in finding, for a given element, the relationship between
Table 2. Critical penetration depth d (µm) of different rock types (oxide concentrations, in %, from Pelletier 2003)
Rock type NiO FeO CoO SiO2 MgO H20 dNi (µm) dFe (µm)
Olivine 0.4 8 0.02 41 50 0 190.2 182.5Orthopyroxene 0.08 5 0.02 60 35 0 210.5 176.1Serpentine 0.4 7 0 40 39 13 216.3 207.3Harzburgite 0.3 7 0.02 41 42 7 210.6 199.2
Table 1. Typical chemical composition (in %), relative density (g/cm3) and water content (in %) of weathered peridotite in New Caledonia (from Troly et al. 1979). The numbers in the first row refer to the peridotite weathering profile (Fig. 2)
N Horizon Ni Fe2O3 SiO2 MgO ρa Moisture (%)
iv Iron Duricrust (F2)Granular Iron (F1)
0.3 75 1 0.1 3 5
iii Red Laterite(L2) 0.9 72 1 0.6 2.2 20ii Yellow Laterite(L1) 1.4 70 3 2 1.9 40–50i Earthy Saprolite(S2) 2–3 32 30 16 1.7 35
Massive Saprolite(S1) 2.3–2.5 17–23 35–39 21–28 1.8–2.4 22–30 Peridotite (Harzburgite) (P) 0.3 8 44 45 2.6–3.2 5
at Bureau De Recherches Geologiques Et Minieres BRGM, FRANCE on February 5, 2014http://geea.lyellcollection.org/Downloaded from

FPXRF Analyzer for Ni and Fe content of Laterite Soils 5
pXRF data (raw data Cr) and XRF, ICP-AES or AAS labora-tory data (reference data C). A linear regression analysis can be performed for this purpose. Linear regression produces the slope α and the y-intercept β of the regression line. A slope of 1.0 and a y-intercept of 0.0 indicate that pXRF is accurate. If not, the values of α and β can be entered directly into the ana-lyser. The corrected concentration C̆ is then defined by:
C̆ Cr= ⋅ +α β
In addition to calibration factors, linear regression analysis produces statistical parameters that can be used to evaluate the level of data quality. One of them is the coefficient of determi-nation, also called r-squared (r2), which is the square of correla-tion of the coefficient r. The coefficient of determination is a measure of the scatter about the regression line and is a meas-ure of the strength of the linear association. It ranges in value from 0.0 (no linear association) to 1.0 (perfect linear associa-tion). The standard deviation s, which is a measure of random error of y-values, and Percent Relative Standard Error (RSE%) were also calculated. RSE% is defined by:
RSE
C C
C
n
i i
ii
n
%
˘
= ×
−
−=∑
1001
2
1
where n is the number of samples, Ci and C̆i are the reference and corrected values of the ith sample.
Figures 3 and 4 show scatter plots obtained for Ni and Fe, respectively for the saprolite samples (n = 98). The regression line is above the reference line (y=x) for Ni but is under the reference line for Fe. This means that pXRF underestimates Ni but overestimates Fe, probably because of secondary fluo-rescence (Ni Kα is absorbed by Fe). This secondary fluores-cence can also explain why calibration factors are different between the saprolite and laterite layers. For both Ni and Fe, the coefficient of determination is high (> 0.99).
In order to protect the pXRF instrument from water and fine particles, some pXRF users cover the front of the analyser with a Kapton® sticker foil. Insertion of this foil between the sample surface and instrument head compromises light ele-ment measurement (Mg, Si) but also attenuates primary X-rays and fluorescence X-rays of heavier elements (Fe, Ni). During the calibration process of laterites, both situations (i.e. with and without Kapton® foil) were evaluated. Figures 5 and 6 show the scatter plots obtained for Ni and Fe, respectively for the laterite samples (n = 103). Insertion of Kapton® foil causes an increase in the slope α for both elements and so an increase in the attenuation. In all cases, the coefficient of determination is high (> 0.98).
Table 3 gives an overview of the results. For Ni, the stand-ard deviation s is higher in the saprolite layer than in the laterite layer. It is lower for Fe. This result is consistent with an increase in average concentration Ca. The RSE% parameter is less than a few percent, except for Ni in the saprolite layer where it reaches 20.77 %. However, this value decreases to 7.09 % when smaller concentration values (C<0.3) are excluded from the calculation. This problem is not encountered in the laterite layer, since the lower Ni concentration of the samples base is 0.38 %.
Fig. 3. Nickel calibration curve – saprolite.
Fig. 4. Iron calibration curve – saprolite.
Ĉ
Ĉ
Ĉi
Ĉi
at Bureau De Recherches Geologiques Et Minieres BRGM, FRANCE on February 5, 2014http://geea.lyellcollection.org/Downloaded from

T. Quiniou & V. Laperche 6
In conclusion, at least for Ni and Fe, pXRF can correlate extremely well with conventional laboratory measurements when samples are suitably prepared (dried, pulverized and, if appropriate, pelletized). Although Kapton® foil attenuates the X-rays, the correlation with reference data is still high and the standard deviation is of the same order of magnitude for Ni and Fe. Consequently, it is possible to use Kapton® foil to pro-tect the instrument head if necessary. Unbiased results can be obtained by calibration.
Temporal and spatial standard deviation. The bar charts shown in Figures 7 (Ni) and 8 (Fe) display the overall average raw con-centrations for the four samples. Error bars on the left and on the right represent standard deviations, st and sm, respectively. The temporal dispersion is low compared to the spatial disper-sion. This means that even on well-prepared samples, heteroge-neity is one of the principal factors that affect data quality.
Particle size chemistry. The aim was to check how concentra-tions change from one fraction to another and to determine, if
possible, the overall concentration from individual concentra-tions. The individual concentration is calculated by weighting the measured concentration by its mass fraction. The number of samples is, of course, too small for a trend to emerge, but the idea was to evaluate the possibility of measuring only the finest fraction and using it to estimate the concentration aver-aged over all grain sizes.
Figures 9 and 10 show, for one of the studied laterites, Ni and Fe raw average concentrations for the different fractions, one standard deviation (±s) and the minimum and maximum measured values. As expected, data dispersion increases with grain size. For this sample, the distribution of Ni is almost constant but Fe is mostly in the finest fraction.
Table 4 gives the relative mass of the sample retained on each sieve. The finest fraction is by far the most important since it represents more than 90 % of the total.
From average raw concentrations, mass fraction and PVC calibration factors, the overall Ni and Fe concentrations can be
Fig. 5. Nickel calibration curves – laterite (□ Without film, ○ Kapton®).
Fig. 6. Iron calibration curves – laterite (□ Without film, ○ Kapton®).
Table 3. Average concentration (Ca in %), slope (□), y-intercept (□) of the regression line, coefficient of determination (r²), standard deviation (s) and relative standard error (RSE) of the saprolite and laterite samples
Analyte Ca α β r2 s RSE%
Saprolite Ni 2.3 1.1126 0.072 0.9918 0.13 20.77(7.09)Fe 18.59 0.9225 −0.4084 0.9969 0.47 2.96
Laterite Ni 1.27 1.2594 0.0062 0.9947 0.04 3.68Ni (Kapton®) 1.6694 0.0628 0.9857 0.06 5.47Ni (PVC) 1.6083 0.0625 0.9881 0.05 4.7Fe 47.6 0.9970 −3.3676 0.9870 0.87 1.84Fe (Kapton®) 1.2979 −5.2773 0.9899 0.77 1.79Fe (PVC) 1.2956 −6.8843 0.9954 0.45 1.09
at Bureau De Recherches Geologiques Et Minieres BRGM, FRANCE on February 5, 2014http://geea.lyellcollection.org/Downloaded from

FPXRF Analyzer for Ni and Fe content of Laterite Soils 7
calculated. The reference values are 1.36 % for Ni and 61.16 % for Fe, whilst the calculated values are 1.49 % for Ni and 66.35 % for Fe. For this sample, 85 % and 97 % of total Ni and Fe, respectively, are carried by the finest fraction. One solution to deal with the heterogeneity of laterite samples in the field would be to measure only the finest fraction and to leave out zones comprising coarser grains. The non-measured fraction would then have to be taken into account by a statistical compensation. Measurement of a large number of samples would be necessary to make a statistical inference, but since laterite nickel ores con-tain significant amounts of very fine material (between 60 and 80 %), this process could lead to acceptable results.
Corrections for water content. Moisture and grain size are the most problematic parameters to deal with in the mining con-text. In order to evaluate how moisture affects concentration measurements, four samples were selected, one saprolite and
three different laterites. During the experiment, each sample was mixed with an increasing quantity of water, weighed and measured by pXRF. If H% is defined as the moisture content of the sample, the concentration loss CL of a given analysis, expressed in percent, is given by:
CLC C
CH% %( ) = −
×0
0
100
where C0 and CH% are the raw concentrations measured on the dried and wet sample, respectively. The relationship between concentration loss and moisture is shown in Figures 11 (Ni) and 12 (Fe) for the four samples. In both cases, the points are almost aligned on a regression line and the regression analysis gives a high coefficient of variation (r2 > 0.94). It is possible to write:
Fig. 7. Temporal (left error bar) and spatial (right error bar) standard deviation of Ni concentration.
Fig. 8. Temporal (left error bar) and spatial (right error bar) standard deviation of Fe concentration.
Fig. 9. Distribution of Ni concentration vs. particle size (Boxplot values: minimum, -s, average (C), +s, maximum).
at Bureau De Recherches Geologiques Et Minieres BRGM, FRANCE on February 5, 2014http://geea.lyellcollection.org/Downloaded from

T. Quiniou & V. Laperche 8
CL H% %( ) = λ
Because λ is close to 1.0 for Ni while it is close to 0.8 for Fe, Ni is proportionally more attenuated than Fe. Combining the two equations above, the estimated concentration C̆0 can then be calculated from:
˘%%C C
HH0
100
100=
− ×( )λ
Figures 13 and 14 show the concentrations estimated from the above equation for Ni and Fe, respectively. The horizontal lines correspond to the target values C0. To make the figures more legible, an offset of +0.5 was applied on coarse saprolite (Fig. 13) and +5 and -5 on fine saprolite and yellow laterite, respectively (Fig. 14). Except for the fine saprolite, which is underestimated whatever the moisture value, the concentra-tions are well corrected. Since fine saprolite is an intermediate stage between coarse saprolite and yellow laterite, its behaviour may be explained by its chemical and physical nature (heteroge-neity of saprolites, porosity and wetting potential of laterites). A
Fig. 10. Distribution of Fe concentration v. particle size.
Table 4. Relative mass of each particle size fraction
Fraction φ < 80 µm 80 < φ < 400 µm 400 < φ < 800 µm 0.8 < φ < 1.6 mm 1.6 < φ < 4 mm
Mass (%) 91.15 5.70 1.68 1.00 0.47
Fig. 11. Nickel concentration loss vs amount of added water (♦ Red Laterite. Δ Yellow Laterite. • Fine Saprolite. □ Coarse Saprolite).
Fig. 12. Iron concentration loss vs amount of added water (♦ Red Laterite. Δ Yellow Laterite. • Fine Saprolite. □ Coarse Saprolite)
Ĉ0
Ĉ0
at Bureau De Recherches Geologiques Et Minieres BRGM, FRANCE on February 5, 2014http://geea.lyellcollection.org/Downloaded from

FPXRF Analyzer for Ni and Fe content of Laterite Soils 9
second possibility is that the reference value C0 (2.50) is slightly overestimated (average of estimated concentrations: 2.25).
in-situ pXrF analysesDrill-cores. Since the pXRF was only calibrated from XRF refer-ence values, fusion ICP-AES calibration factors were deter-mined directly from the core. Because of matrix and particle size effects, two calibration sets were determined. The first set covers the upper part, named (H1) in Figures 15 and 16, from iron duricrust (F) to yellow laterite (L1) while the second set covers the lower part (H2), from fine saprolite (S2) to the bed-rock (P). The calibration factors, with the y-intercept set to
zero in all cases, are 1.23 (H1) and 1.15 (H2) for Ni and 0.94 (H1) and 0.85 (H2) for Fe.
The results of this test are graphically represented in Figures 15 (Ni) and 16 (Fe). Except for two points, it can be seen that a good agreement exists between corrected pXRF and fusion ICP-AES reference data in the upper part H1. In the H2 sec-tion, data are more dispersed since the particle size is increas-ing and the material becoming more heterogeneous.
Percent relative standard errors, RSE%, are presented in Table 5. In the calculation, the two odd points have been removed. In the upper part (H1) of the core, the average of five measurements on a section of about one metre provides cor-rect results. In the second part (H2), except for indurated rock
Fig. 13. Nickel content after water correction vs amount of added water (♦ Red Laterite. Δ Yellow Laterite. ο Fine Saprolite. ■ Coarse Saprolite).
Fig. 14. Iron content after water correction vs amount of added water (♦ Red Laterite. Δ Yellow Laterite. ο Fine Saprolite. ■ Coarse Saprolite).
Fig. 15. Evolution of Ni concentration along the core drilling (+ Laboratory/ICP-AES. ◊ One shot. □ Average of 5 shots; upper part (H1): Iron Duricrust (F), Red Laterite (L2) and Yellow Laterite (L1); Lower Part (H2): Fine Saprolite (S2), Coarse Saprolite (S1) and Bedrock (P)).
at Bureau De Recherches Geologiques Et Minieres BRGM, FRANCE on February 5, 2014http://geea.lyellcollection.org/Downloaded from

T. Quiniou & V. Laperche 10
transitions noted (P) in Figure 15, RSE% is twice for Ni and six times more for Fe compared to the upper part (H1). In order to obtain similar results, one solution would consist of increas-ing the number of shots.
Pit face. Fifty-seven fresh samples, from red laterites to fine grained saprolites, were measured directly in the field without preparation. Samples were collected and sent to laboratories in order to obtain both reference concentrations and moisture con-tents. Nickel concentrations range from 0.78 to 2.55 % and Fe concentrations from 26.8 to 56.6 %. Moisture ranges from 30 to 50 % depending upon the sampling location. As a general rule, moisture is higher in red laterites than in fine-grained saprolites. Concentrations were then corrected as described previously.
Figure 17 shows the raw concentrations and moisture-cor-rected concentrations versus Ni reference data. Because moisture attenuates X-rays, the slope of the regression line is high (1.96) before correction. The coefficient of determination r2 is lower (0.77) than on well-prepared dry samples because of particle size chemistry, surface effects, sampling and differences in moisture
content from sample to sample. Indeed, the slope of the regres-sion line shows average effects (average moisture) over the sam-ple set while dispersion shows individual effects (moisture of a particular sample). After correction for moisture, λ=1, the slope decreases to 0.94, showing that average moisture is fairly well compensated. The value of r2 (0.83) is only very slightly greater than the previous value.
Figure 18 shows the scatter plots of raw and corrected (λ=0.8) concentrations for Fe. The slope decreases from 1.29 to 0.96, showing here also that moisture is on average fairly well compensated. The value of r2 increases from 0.34 to 0.72, so the gain is more important for Fe than for Ni. There is no obvious reason for this, although thorough analysis of physical phenomena including dilution and matrix effects may help this result to be better understood.
CoNCLusioNsPortable XRF methodology is considered to be a viable, cost- and time-effective approach for on-site analysis of environ-mental samples. In the mining context, different situations and objectives may be encountered. If used as a bench-top labora-tory unit, pXRF can provide accurate and precise elemental analysis providing that the instrument is properly calibrated for the matrices and elements of interest and that samples are well-prepared (finely ground and dried). This technology is espe-cially suitable for use by small companies because it can be used for laboratory and on-site analysis as well. In the field, however, the instrument may deliver biased and noisy results if
Fig. 16. Evolution of Fe concentration along the core drilling (+ Laboratory/ICP-AES. ◊ One shot. □ Average of 5 shots; upper part (H1): Iron Duricrust (F), Red Laterite (L2) and Yellow Laterite (L1); Lower Part (H2): Fine Saprolite (S2), Coarse Saprolite (S1) and Bedrock (P)).
Table 5. Drill-core - relative standard error (%), RSE%
RSE%
1 shot 5 shots
Section Ni Fe Ni FeH1 11.66 2.97 4.83 1.84H2 15.15 13.80 10.75 12.26
Fig. 17. Pit face measurement of Ni content (◊ Not compensated, □ Water compensated).
at Bureau De Recherches Geologiques Et Minieres BRGM, FRANCE on February 5, 2014http://geea.lyellcollection.org/Downloaded from

FPXRF Analyzer for Ni and Fe content of Laterite Soils 11
no sample preparation or correction is undertaken. In the lev-els of the weathering profile where ore is naturally composed of fine particles, suitable sampling associated with moisture correction may lead to reliable data. Water content can be measured from a surface moisture analyzer. In the case of very heterogeneous particles (size, morphology, chemical composi-tion) such as earthy saprolite, the problem is far more complex and previous solutions may be ineffective. As a matter of fact, the internal pore structure and rough crystalline external sur-face of particles may hinder the determination of moisture content. An alternative option is likely to be explored to improve the quantification of these samples. It would be useful to develop a battery-powered, portable crusher in order to pro-duce powder and make pellets before analysing the sample in the field. The relative waste of time for the on-site preparation of pellets would be compensated by an improvement in the quality of analytical data; thus, this analytical procedure would be of prominent interest for mining operators. This portable crusher, not available at the time of the study, appeared on the market while the present paper was being written.The authors gratefully acknowledge financial support by the CNRT (Centre National de Recherche Technologique) ‘Nickel et son environne-ment’. We greatly thank Pierre Maurizot for his assistance during all phases of this program and the mining companies for their help in the field and the samples and data they provided for this study. We are very grateful to Marc Dupayrat from Thermo Fisher Scientific for his cooperation and assistance with the pXRF instrument. Thanks also to Dominique Cluzel for his careful review of the manuscript. Finally, we would like to acknowledge Christophe Dubois for his invaluable technical help during the laboratory work. Mention of trade names or commercial products does not constitute endorsement or recom-mendation for their use.
reFereNCesCesareo, R., GiGante, G.E., Castellano, A. & ridolfi, S. 2009. Portable
and Handheld Systems for Energy-dispersive X-ray Fluorescence Analysis. In: Meyers, R. A. (ed.) Encyclopaedia of Analytical Chemistry. John Wiley & Sons Ltd, Chichester.
Cluzel, D., aitChison, J.C. & PiCard, C. 2001. Tectonic accretion and under-plating of mafic terranes in the Late Eocene intraoceanic fore-arc of New Caledonia (SW Pacific): Geodynamic implications. Tectonophysics, 340, 23–59.
fortes, F.J. & laserna, J.J. 2010. The development of fieldable laser-induced breakdown spectrometer: No limits on the horizon. Spectrochimica Acta Part B: Atomic Spectroscopy, 65, 975–990.
hiGueras, P., oyarzun, R., iraizoz, J.M., lorenz, S., esbrí, J.M. & Martínez-Coronado, A. 2012. Low-cost geochemical surveys for environmental studies in developing countries: Testing a field portable XRF instrument under quasi-realistic conditions. Journal of Geochemical Exploration, 113, 3–12.
houlahan, T., raMsay, S. & Povey, D. 2003. Use of Field Portable X-Ray Fluorescence Spectrum Analyzers for Grade Control – A Presentation of Case Studies. In: 5th International Mine Geology Conference. Austalasian Institute of Metallurgy. 377–385.
KalniCKy, D.J. & sinGhvi, R. 2001. Field portable XRF analysis of environ-mental samples. Journal of Hazardous Materials, 83, 93–122.
laPerChe, V., beaulieu, M. & auGer, P. 2008. Caracterisation sur site et in situ de sites et sols potentiellement pollues par spectrométrie de fluores-cence X. Environnement et Technique, 275, 37–43.
MarKowiCz, A. 2008. In: Potts, P.J. & west, W. (eds) Portable X-ray fluorescence spectrometry – capabilities for in situ analysis. RSC Publishing, Cambridge, 13–38.
Pelletier, B.C. 2003. Les minerais de nickel de Nouvelle-Calédonie. Revue ‘Géologues’ n° 138. September 2003. Spécial DOM-TOM.
Potts, P.J., williaMs-thorPe, O. & webb, P.C. 1997. The bulk analysis of sili-cate rocks by portable X-ray fluorescence: Effect of sample mineralogy in relation to the size of the excited volume. Geostandards Newsletter: The Journal of Geostandards and Geoanalysis, 21, 29–41.
troly, G., esterle, M., Pelletier, B.G. & reibell, W. 1979. Nickel oxide deposits in New Caledonia: Some factors influencing their formation, International Laterite. Symposium AIME. New Orleans, 85–119.
Fig. 18. Pit face measurement of Fe (◊ Not compensated, □ Water compensated).
Received 6 July 2012; revised typescript accepted 14 January 2013.
at Bureau De Recherches Geologiques Et Minieres BRGM, FRANCE on February 5, 2014http://geea.lyellcollection.org/Downloaded from