evaluation field-portable x-ray fluorescence hazardous waste
TRANSCRIPT
Unitftd Statti Environm«mi) Monitoring Pra-t$«u« copyEnvtronrrr M Protection Syst*m* Laboratory August 1987Agency P.O. Box 93478 ]/_____________________LM V«g«» NV 99193-3478____________S"Rataafch »nd D«vatopm«nt_____________________________________
Evaluationof a PrototypeField-PortableX-Ray FluorescenceSystem forHazardous WasteScreening

EVALUATION OF A PROTOTYPE FIELD-PORTABLE X-RAYFLUORESCENCE SYSTEM FOR HAZARDOUS WASTE SCREENING
G. A. Raab, D. Cardenas and S. J. SimonEnvironmental Programs
Lockheed Engineering and Management Services Company, IncLas Vegas, Nevada 39119
and
L. A. EcclesAdvanced Monitoring Systems Division
Contract Number 68-03-3249
Project Officer
K* W. BrownExposure Assessment Research Division
Environmental Monitoring Systems LaboratoryLas Vegas, Nevada 89114
ENVIRONMENTAL MONITORING SYSTEMS LABORATORYOFFICE OF RESEARCH AND DEVELOPMENTU.S. ENVIRONMENTAL PROTECTION AGENCY
LAS VEGAS, NEVADA 39114
SR3QQ536
ABSTRACT
A prototype field-portable X-ray fluorescence system developed by ERAand NASA was evaluated at'a site contaminated with Pb, Zn, and Cu. Theobjective of the field test was to evaluate the effectiveness of the instru-ment as a field analytical tool for locating hot spots and as a preliminaryscreening device where immediate data feedback aids in decision-making in thefield.
By making use ~6f~~an analytical method designed specifically for the XRFsystem, all routine field measurements for Cu, Zn, and Pb were made on site byplacing the probe on the surface of the ground ("in situ" measurements).Subsequently, confirmatory samples were collected and analyzed in the laboratorywith an Inductively Coupled Plasma spectrometer £ICP) while adhering to EPAContract Laboratory Program (CLP) protocols.
The quality assurance consisted of measuring NBS standard referencematerials to verify the data measured in the field and in the laboratory inaddition to duplicates, blanks, and replicate sample analysis.
The analytical results were plotted on the sampling grid. One canimmediately locate the hotspots for Cu, Zn, and Pb on site. The instrumentdetection limits for Cu, Zn, and Pb are 250, 200, and 70 ppm, respectively.Comparison of the XRF results with the ICP results showed an overall meanpercent error (MPE, which means lack of precision and bias incorporated intoone term) from NBS concentrations of only a few percent for Cu, Zn, and Pb.Precision and accuracy of the in situ measurements were within plus or minus10 percent of the true value when compared to the samples analyzed in thelaboratory.
flB300537
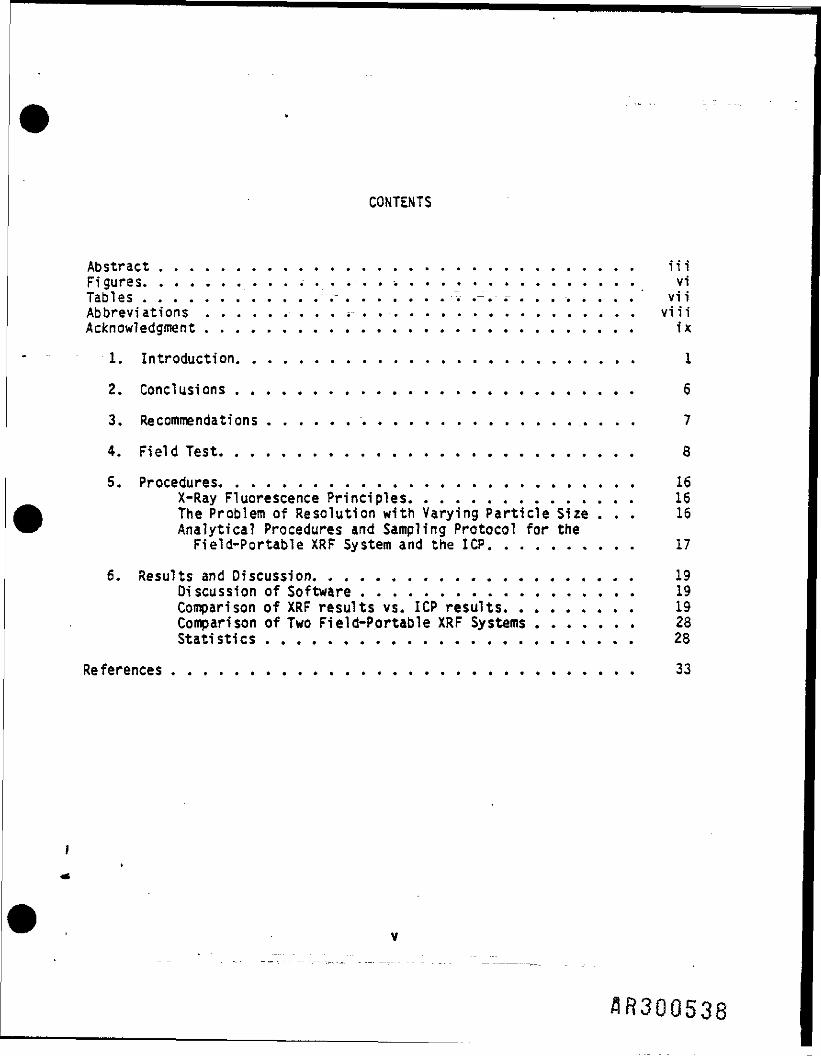
CONTENTS
Abstract ............................... iiiFigures. ............ i .................. viTables ........... . r ........ .-.- ......... vi iAbbreviations . . . . . . . . . * . . . . . . . . . . . . . . . . . . viiiAcknowledgment ............................ ix
1. Introduction. ......................... 1
2. Conclusions .......................... 6
3. Recommendations ........................ 7
4. Field Test. .......................... 8
5. Procedures. .......................... 16X-Ray Fluorescence Principles. .............. 16The Problem of Resolution with Varying Particle Size ... 16Analytical Procedures and Sampling Protocol for the
Field-Portable XRF System and the ICP. ......... 17
6. Results and Discussion. .................... 19Discussion of Software .................. 19Comparison of XRF results vs. ICP results, ........ 19Comparison of Two Field-Portable XRF Systems ....... 28Statistics ........................ 28
References .............................. 33

TABLES
Number
1 Comparison of XRF and ICP Results from NBS Standards ....... 20
2 Comparison of the Martin Marietta XRF System and the ICPInstrument Detection Limits with CLP Contract RequiredDetection Limits (CRDL). .................... 22
3 Comparison of XRF and ICP Results from Soil Samples. ....... 23
4 Comparison of Two Field Portable XRF Systems ........... 29
5 Replicate Analyses of the NBS SRM 1648 .............. 30
6 Comparison of Percent RSD of Duplicate Analysis by XRF ...... 30
vii
ACKNOWLEDGEMENTS
The authors would like to extend thanks G. A. Villa for his editorialcomments, to S. 0. Garcia of the Graphics Department at LEMSCo; to Warren C.Kelliher of National Aeronautics and Space Administration, Langley ResearchCenter and to K. W. Brown of the EPA for providing both support at the NPLsite and background information on the project; to T. F. Staible and D. Dusterof EPA, Region 8 - Denver, to T. S. Dunlop, Division of Environmental Health,City of Aspen, Colorado, for their cooperation in arranging the field test,and to Benton C. Clark, Judy Cook, and Mike Thornton of Martin Marietta Aero-space, Denver, Colorado, for their help and information. Thanks also go to F.C. Garner, 0. C. Hlllman, and D. E. Dobb at LEMSCo, Us Yegas, for theirdiscussions, recommendations and support; to Scott Wyma of Kevex Corporationfor the analyses; and to John R. Rhodes and Stan Plorek of Columbia ScientificIndustries Corporation for their consultation.
1x
However, the difference in the two .values should fall within the accep-tance range for the overall inaccuracy of the XRF in situ measurements.For the Intents and purposes of this report we will assume the in situsample area and the collected sample containing the same area to be oneand the same sample.)
• compare the XRF results with those obtained from the ICP.
The EPA has recently expressed more interest in XRF systems than inprevious years because the use of microprocessors and state-of-the-arttechnology have made the equipment smaller and thus portable. Such field-portable XRF systems have been used to delineate hazardous waste site hotspotsfor priority metals in the field (Chappell et al., 1936; Mernltz and Olsen,1985; Furst et al., 1935; and Kendal et al., 1984). With immediate data feed-back from the field-portable XRF system, all samples can be collected with the.knowledge of their approximate concentration. This leads to a decrease in thenumber of unnecessary samples which would be analyzed normally. The XRF fielddata allows an analyst 1n the laboratory to calibrate his laboratory instrumentto the proper concentration on the first try; thus decreasing the number ofattempts at bracketing the correct one. Another use is as a laboratoryanalytical instrument to screen samples of unknown concentrations quicklyproviding the analyst with an approximate concentration. All of these applica-tions of the XRF systems net an overall decrease in time and in money spent.
Furst et al., 1985 described three levels of analytical requirements forestablishing the extent of environmental contamination. The first or highestlevel of analysis is used to develop data for litigation and regulatory enforce-ment (see Figure 1). This level demands the most rigor in sample preparationand Instrument time as well as the highest degree of precision and accuracy.The second level of analysis is used to evaluate and assess average contaminantexposures to people and animals. The data from the third level of analysis isused for screening in order to obtain a preliminary profile of sites. Thisdata can be used for decision making while in the field. Third level data maybe used also to select which samples should be sent to the laboratory for firstlevel analysis following the Contract Laboratory Program (CLP) analyticalprotocols. This report discusses the results obtained by using a portable XRFsystem under the third level of analytical requirements.
The area that the EPA selected for the field test was the Smuggler MountainNPL site in Aspen, Colorado, northeast of the Aspen city limits. The site waslisted on the NPL June 10, 1986. The Smuggler Mountain mine produced lead,silver, and zinc ores. The site is located on one of the slopes of SmugglerMountain; some of the mining, milling, and smelting was located here. Theseslopes are a Mixture of native soils, mine tailings, and other mine wastes.Much of the surface has been subjected to reworking by prior and recentconstruction projects. Several such projects used arine tailings as fill.
Martin Marietta Aerospace people brought a prototype XRF system to fieldtest,at the Smuggler Mountain site. The first prototype system had evolvedfrom technology used in the Martian Viking lander. This system had to beredesigned to measure metals in contaminated soils because of the changes inIts intended usage. Prior to the field test, the software was not programmed

for efficient evaluation of soil samples and field application. Reprogrammingthe software took place subsequent to the field test.
The Martin Marietta field-portable XRF system consists of three units (seeFigure 2): (1) the sensor head (when filled with liquid N^, weighs 32 pounds),(2) the Canberra main unit analyzer (16 pounds), and (3) a Gridcase 2 portablecomputer (12 pounds)* The filtration unit shown in Figure 2 was designed forlaboratory use only to preconcentrate metals in water samples. The cooledsemiconductor detector has excellent energy resolution and is capable of simul-taneous detection of a wide range of X-ray energies. The cooled semiconductordetector decreases the dead time response to the X-rays it senses, thus decreas-ing the length of time needed for analysis. A typical analysis with the systemlasts between 120 and 300 seconds. The X-ray tube uses a molybdenum targetoperating at 30,000 volts to produce a wide enough spectrum to fluoresce thepriority elements. The detector is a semiconductor made of lithium driftedsilicon. The detector must be cryogenlcally cooled and must have a continuoussupply of liquid nitrogen.

SECTION 2
CONCLUSIONS
The XRF system produced data of known quality from 229 In situmeasurements (defined as measurements made by placing the probe on theground surface and by analyzing the same surface without moving theprobe). The XRF field results on the NBS standards compared relativelywell with the certified NBS values of the same standards.iField personnel can greatly decrease the time spent on site by makingin situ measurements. If necessary, the technician can collect aconfirmatory sample after each XRF analysis.The detection limits are low enough for obtaining data when third levelrequirements are necessary^for analytical work on hazardous waste siteinvestigations.The NBS standards were adequate for quality control and qualityassurance. These standards were SRM 1633a» coal fly ash; SRM 1645,river sediment; and SRM 1648, urban particulate.
The instrument uses cryogenics to cool the silicon-lithium detectorwhich requires a Oewar container filled with liquid nitrogen. Eventhough the Dewar container will last 8 hours before a refill 1snecessary, maintaining a continuous supply of liquid nitrogen in thefield can be difficult in some locations.
The overall advantages of all X-ray fluorescent systems include:minimal sample preparation time, rapid turnaround time for analyses,multi-element analytical capability, nondestructive analyses, andsample size required for analysis is small or possibility of surfaceanalysis without the need for sampling at all. These advantages makethe XRF system very cost effective.

CO
11
I/I—1Q_aseo•o•̂L.cnw»c
o.03
if)0)
3
VAN
U.S. EPA AIR SAMPLER& POWER SOURCE
n..d.n*.
373
253•n._d.
nvd.
n.d. •
n.d. 3J« n-.d- "** SMUGGLER485 n.d. n.d. n'.d' MOUNTAIN SITE
n.d. 313 "*• XRF Data for Cun.d. yg/g
558* -»T|6 »J2
1880 13.0310J59
WASTE SITE
n.a.— not u«it?ui«u•n.d.
TENNIS COURTS
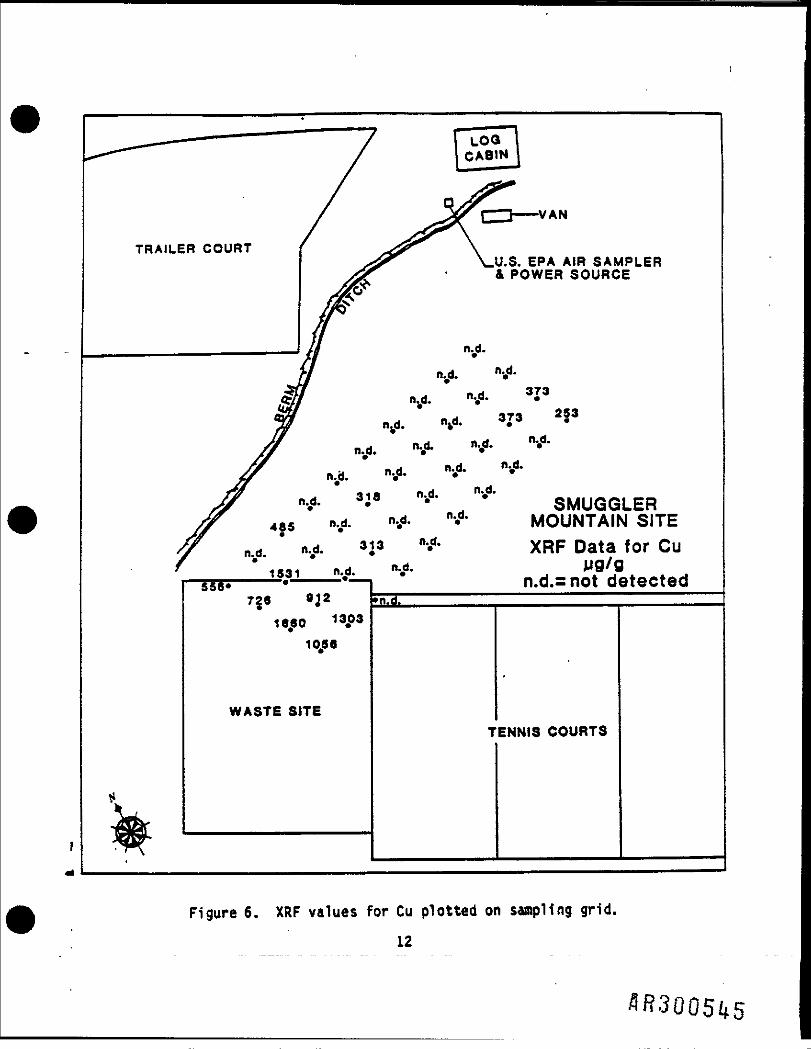
Figure 6. XRF values for Cu plotted on sampling grid.12
VAN
U.S. ERA AIR SAMPLER& POWER SOURCE
SMUGGLERMOUNTAIN SITEXRF
5.708* *12.138 1S,£24
14.943
WASTE SITE
•417
TENNIS COURTS
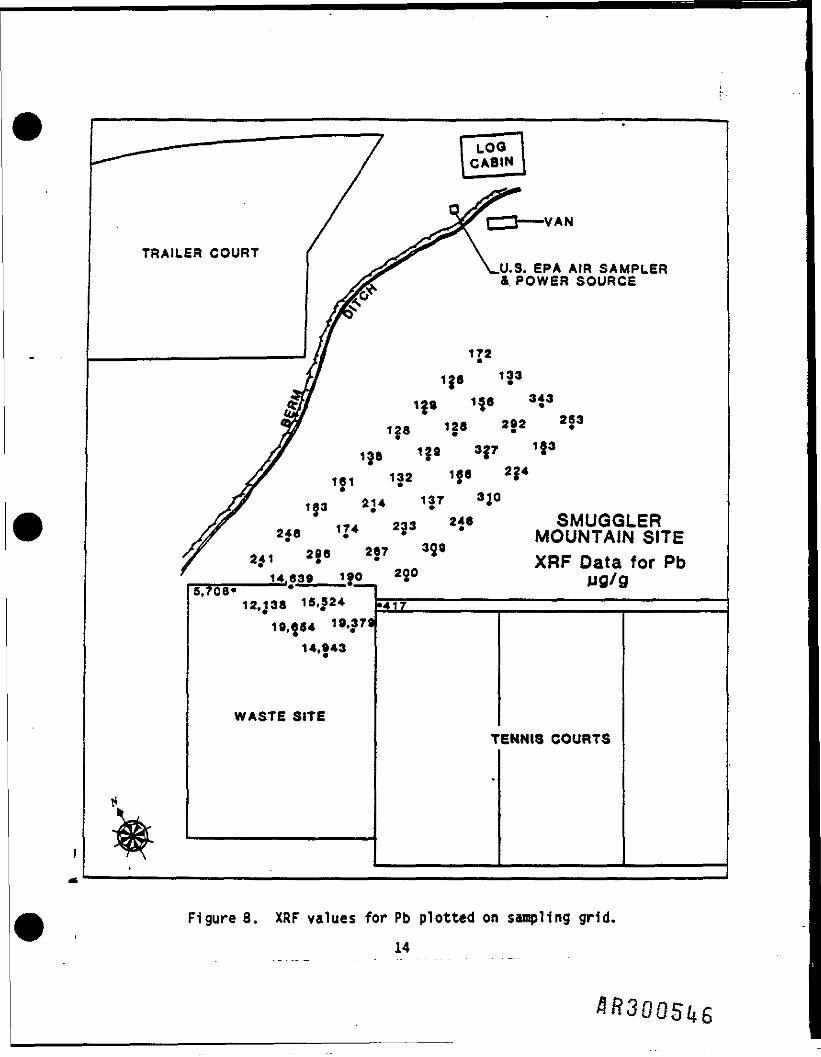
Figure 3. XRF values for Pb plotted on sampling grid14
SECTION 5
PROCEDURES
X-RAY FLUORESCENCE PRINCIPLES
The X-ray fluorescence (XRF) system used 1n this study is energy dispersiveby design. All XRF depends on either an electron or X-ray beam bombarding thesample. The X-rays produced by an X-ray tube impinge on the electron clouds ororbitals in the atoms within the sample. When the X-ray displaces an electronfrom an inner orbital of an atom, such as the It-shell, a vacancy is created.This causes an instability below the electrons in outer shells. As the outerelectrons seek stability by filling the inner shell vacancies, a cascade ofelectrons spontaneously follows. Energy is released or emitted for each shellvacancy that is filled. This emitted energy is characteristic of the atom fromwhich it was produced. This emission is called fluorescence. All elementsexcited by the X-rays fluoresce simultaneously to produce a spectrum of charac-teristic and backscattered radiation. It is this spectrum that the detectorsenses and counts. The whole spectrum data is transferred to the analyzerwhere the software deconvolves the peaks for the desired elements.
THE PROBLEM OF RESOLUTION WITH VARYING PARTICLE SIZE
The bulk density of the sample and the particle size distribution affectthe characteristic X-ray intensity. When dealing with varied distribution ofparticle sizes, an accurate analysis of these particles is difficult if thereis no attempt to make all the particles the same size, either by segregation orreduction.
The varied particle sizes have an effect on X-ray absorption and enhance-ment especially during in situ emission analysis. Collecting and grinding thesample to <0.075-mm (20U M) will generally solve the problem, but this is notalways a practical solution in the field. It also defeats the purpose of usingthe field-portable XRF system with an in situ technique, i.e., a fast turn-around time. We cm address this problem in a sample preparation step by usinga mortar and pestel to break up the soil samples and by grinding the sample toapproximately sand size assuming the sample is dry. Even though this approachdoes not entirely solve the problem, it does reduce the effect to an acceptableconstant error while keeping sample preparation time to a minimum.
16

• Clean the trowel by wiping the blade with a paper towel and thenrinsing with distilled water.
h. Take samples with contamination levels ranging from approximatelyfive times the IOL for Cu, Zn, and Pb up to the maximum values foundon site.
1. Use N3S standards for the reference calibration.
j. Use silica sand for the blank sample. The grains of silica sand willclosely approximate the grain geometry of the soils.
The sample preparation for the ICP analyses was done by both the standard CLPmethod and the Parr bomb method which 1s described below. The CLP method andQA/QC protocol for analysis may be found in Exhibit D of the Invitation for Bidfor the Contract Laboratory Program (U.S. EPA, 1984).
ICP AnalysisDigestion of soil by a generic Parr bomb method {adapted from Bernas,
1968, Buckley and Cranston, 1971; and Dolezal et a!.. 1969):
a. Dry at 60*C and homogenize the sample.
b. Weigh 0.5 g of soil and place it 1n the Parr bomb.c. Add 5 mL of concentrated nitric acid (HN03) and 2 mL of concentrated
hydrochloric acid (HCl).
NOTE: • Do not add more than the 2 mL HC1 prescribed. Too much cangenerate enough chlorine gas to cause the Parr bomb to explode.
• Do not add any soil with carbonates; the evolution of CO? couldcause the Parr bomb to explode.
• Do not add the filter paper 1f It 1s a cellulose base. Thiscould cause the formation of nitrocellulose which 1s explosive.
d. Seal the Parr bomb and place it In an oven at 120*C for 2 hours.
e. Remove the bomb from the oven and allow it to cool to roomtemperature.
f. Open and rinse the contents into a filter funnel feeding Into a100-mL volumetric flask. Bring the flask up to volume with D!water. The digest is ready for analysis.
18

TABLE 1. COMPARISON OF XRF AND ICP RESULTS FROM NBS STANDARDSis**•••»«««**««a**«•••«•«ma»«»»»x «*»•«*•*«•«****• asaa**x
ElementsAnalyst s Fe Cu Zn P5Number (all units are in ug/g)
Coal Fly Ash
SRM 1 94,000 113 220 72.41633a 2 91,555 178 261 152.4
3 33.780 75.6 103 34.44 17,944 54.0 84 n.a
River Sediment
SRM 1 113,000 109 1720 7141645 2 313,636 133 1551 735
3 84,410 109 1632 6884 n.a. n.a. n.a. n.a
Urban Particulate
SRM 1 39,100 609 4760 65501648 2 41,252 584 2212 6247
3 21,746 550 4486 59864 20,857 432 3443 4192
No. 1 Certified by National Bureau of Standards.No. 2 Martin-Marietta XRF unit. The Martin Marietta values for the SRM I633a
and 1648 are the averages of 7 replicates; for the SRM 1645, the valuesare the averages of 14 replicates.
No. 3 Perkin Elmer ICP II, Parr Bomb Method. The values are the averages of 3replicates.
No. 4 Perkin Elmer ICP II, CLP Methods. The values are the averages of 3replicates.
n.d. » not detected.n.a. * not analyzed.standards. When the Individual Pb values for the different standards from Table1 are plotted, the XRF results of the NBS standards show excellent concurrencewith the ICP, especially for Pb (Figure 9).
The detection limits for the XRF system were determined by Martin Marietta.Three 300-second spectra were collected for each element, and the ratios of thenet Ka and La peaks to net backscatter calculated. The instrumental detectionlimit was calculated from the formula:
IDL - 3S
where S is the quantity (1n micrograms) of metal present In the sample, C& isthe background counts under the peak, and Cs the net sample counts. The peak
20

. TABLE 2. COMPARISON OF THE MARTIN MARIETTA XRF SYSTEM AND THE ICPINSTRUMENT DETECTION LIMITS AGAINST CLP CONTRACT REQUIRED
DETECTION LIMITS (CRDL)ix3«*sxs3»***3**«*x»zxass**«»»B*»x*3as*s****a*«sx»x«*x**aam*axs*««:
ICPMartin Marietta Perkin Elmer CRDL
Element XRF System! ifpmM ICP2 (ppb) {ppb}
Cu &&̂ y 8 25Pb tys 35 (5)*In 200 17 20Cr 1000 5 10Ni 300 30 40As 150 80 (10)*Se 140 170 (5)*Ag >1000 5 IdCd ND 4.8 5Sb NO 50 60Ba >1000 20 200Hg 80 50 £0*2)*T! 75 160 (10)*
1 Data provided by Martin Marietta.2 IDL's qualified for CLP.* These metals are not required for analysis on the ICP under CLP
protocols. The values in the parentheses are the measured IDL's forthe atomic absorption spectrometer to show its capability.
ND * not detected.
background is calculated, and the net sample counts are calculated by subtrac-ting the background level from the total number of counts in the peak. Thedetection limits for the XRF (the IDL for iron was not Included) and ICP instru-mental detection limit (IDL's) are listed in Table 2 and are compared in theCLP contract required detection limits (CRDL). The CRDL's represent a levelone requirement regime for analytical work. The XRF IDL's might represent aproposed level three requirement regime for hazardous waste site investigationswith field-portable XRF systems.
In comparison of the IDL's for Cu, Zn, and Pb against the values for thesoil samples in Table 3, what Immediately becomes apparent is that 29 of thevalues for Cu measured by the Martin Marietta XRF system are less than orequal to the Instrumental detection limit. Any values below five times the IDLshould not be used. The variation of precision in this range is, as a rule ofthumb, plus or minus the IDL. Between 5 and 10 times the IDL, the variation inprecision ranges from 10 percent to 20 percent of the amount present. Above 10times the IDL, the variation in precision Is less than 10 percent of the amountpresent.
22
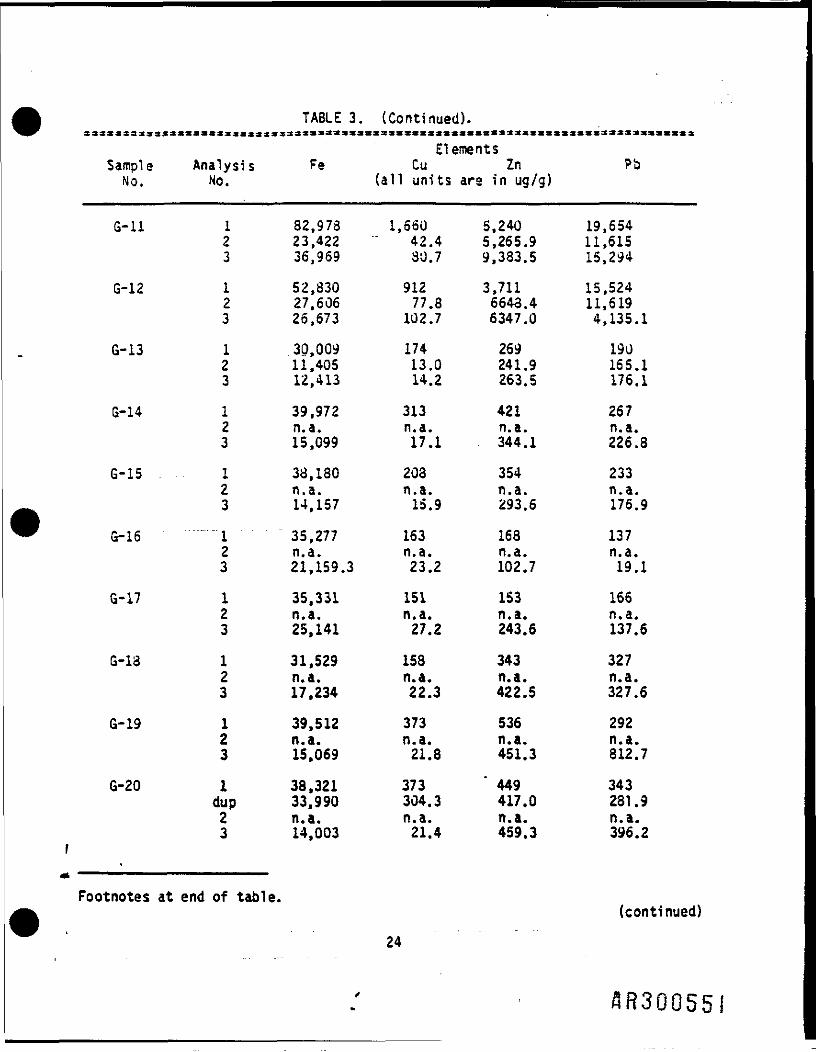
TABLE 3. (Continued).
ElementsSampl e Analysi s Fe Cu Zn Pb
No. Mo. (all units are in ug/g)
G-U 1 82,973 1,660 5,240 19,6542 23,422 " 42.4 5,265.9 11,6153 36,969 30.7 9,383.5 15,294
6-12 1 52,830 912 3,711 15,5242 27,606 77.8 6643.4 11,6193 26,673 102.7 6347.0 4,135.1
G-13 1 30,009 174 269 1902 11,405 13.0 241.9 165.13 12,413 14.2 263.5 176.1
G-14 1 39,972 313 421 2672 n.a. n.a. n.a. n.a.3 15,099 17.1 344.1 226.8
G-15 1 38,180 203 354 2332 n.a. n.a. n.a. n.a.3 14,157 15.9 293.6 176.9
G-16 "1 " 35,277 163 168 1372 n.a. n.a. n.a. n.a.3 21,159.3 23.2 102.7 19.1
G-17 1 35,331 151 153 1662 n.a. n.a. n.a. n.a.3 25,141 27.2 243.6 137.6
G-13 1 31,529 158 343 3272 n.a. n.a. n.a. n.a.3 17,234 22.3 422.5 327.6
G-19 1 39,512 373 536 2922 n.a. n.a. n.a. n.a.3 15,069 21.8 451.3 812.7
G-20 1 38,321 373 * 449 343dup 33,990 304.3 417.0 281.92 n.a. n.a. n.a. n.a.3 14,003 21.4 459.3 396.2
Footnotes at end of table.(continued)
24
3R30055!
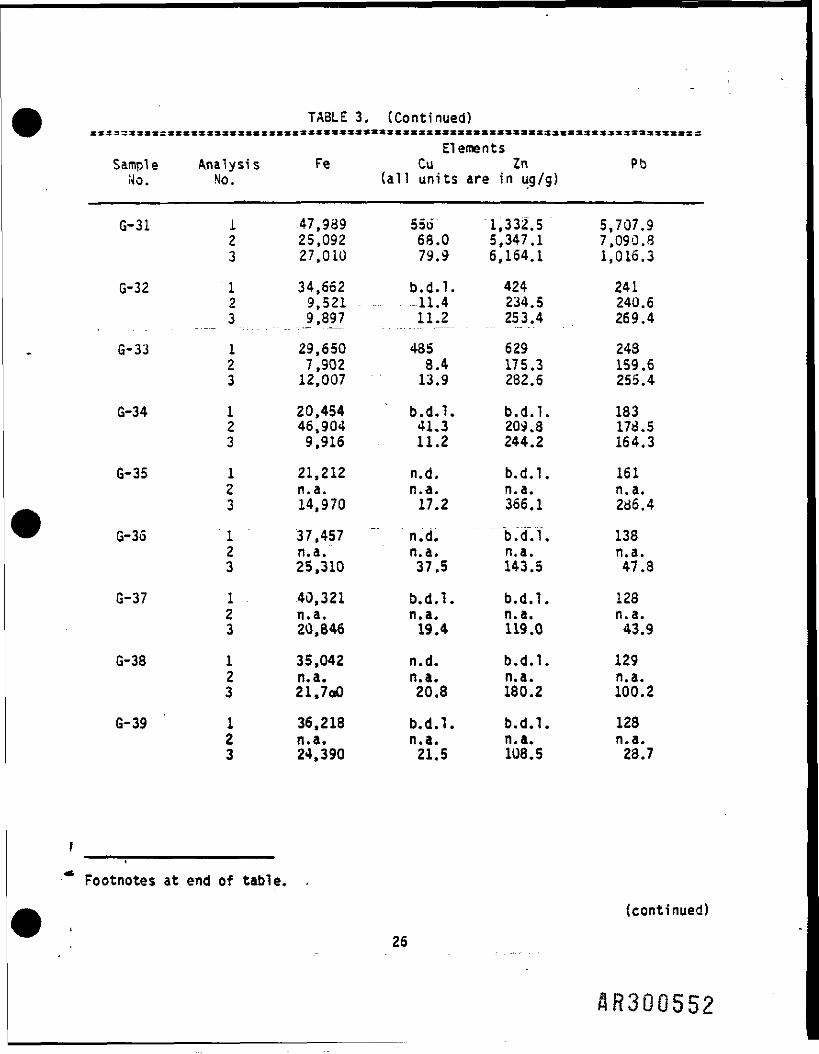
TABLE 3. (Continued)
ElementsSample Analysis Fe Cu In Pb
Ho. No. (all units are in ug/g)
G-31 1 47,989 55d 1,332.5 5,707.92 25,092 68.0 5,347.1 7,090.83 27,010 79.9 6,164.1 1,016.3
G-32 1 34,662 b.d.1. 424 2412 9,521 - .... -11.4 234.5 240.63 9,897 11.2 253.4 269.4
G-33 1 29,650 485 629 2432 7,902 8.4 175.3 159.63 12,007 13.9 282.6 255.4
G-34 1 20,454 * b.d.1. b.d.l. 1832 46,904 41.3 209.8 173.53 9,916 11.2 244.2 164.3
G-35 1 21,212 n.d. b.d.l. 1612 n.a. n.a. n.a. n.a.3 14,970 17.2 366.1 2*6.4
G-35 " 1 37,457 " n.d. ""b.dVt. 1382 n.a. n.a, n.a. n.a.3 25,310 37.5 143.5 47.8
G-37 1 40,321 b.d.l. b.d.l. 1232 n.a. n.a. n.a. n.a.3 20,846 19.4 119.0 43.9
G-38 1 35,042 n.d. b.d.l. 1292 n.a. n.a. n.a. n.a.3 21.7*0 20.8 180.2 100.2
G-39 1 36,218 b.d.l. b.d.l. 1282 n.a. n.a. n.a. n.a.3 24,390 21.5 108.5 23.7
Footnotes at end of table. .
(continued)
26
flR300552
concentrations but they are still closer to the NBS certified concentrationsthan the CLP recovered concentrations.
COMPARISON OF TWO FIELD-PORTABLE XRF SYSTEMS
We sent 13 soil samples to the Kevex Corporation for analysis with theirfield-portable XRF system, X-site 99UO and Analyst G700. Kevex agreed toanalyze the samples at no cost. Because Kevex analyzed these samples withoutcontractual requirements the analyses were not verifiable. Therefore, the datamust be accepted only as approximate values. In spite of this deficiency, wegain anough insight from the data to warrant its inclusion here {Table 4).The samples were shipped as loose soils sealed in petri dishes. Kevex analyzedthe samples by placing the probe of their x-site 9900 onto the samples in thepetri dishes. No sample homogenization or preparation took place. Overall theFe values of the two instruments are close enough for semi-quantitative work,but the values for the priority metals Cu, Zn, and Pb are diverse for the twoinstruments and need further investigation. The authors suggest that furthercomparative work in the laboratory with rigorous QA/QC would determine whichXRF system is better suited for field work.
STATISTICS
The replicate precision on the standards of the Martin Marietta XRF systemranged from 1.2 percent RSD for Zn to a maximum of 34.4 percent RSD for Pbon the NBS SRM 1648 (Table 5). The second column for each element representsthe 90" rotation in the same horizontal plane after the seven-replicateanalysis. The difference in the two sets of analyses could reflect the effectdue to surface morphology from different areas within a sample which canaffect the X-rays the detector senses. "
The duplicate precision on routine samples of the Martin Marietta XRFsystem ranged from 0.88 percent RSD to a maximum of 10.19 percent RSD on thethree samples run {Table 6). The relatively high percent RSO's which appearwith sample G-20 could occur due to the counting statistics and being close tothe instrument's detection limit. The more controlled studies need to be donein this area.
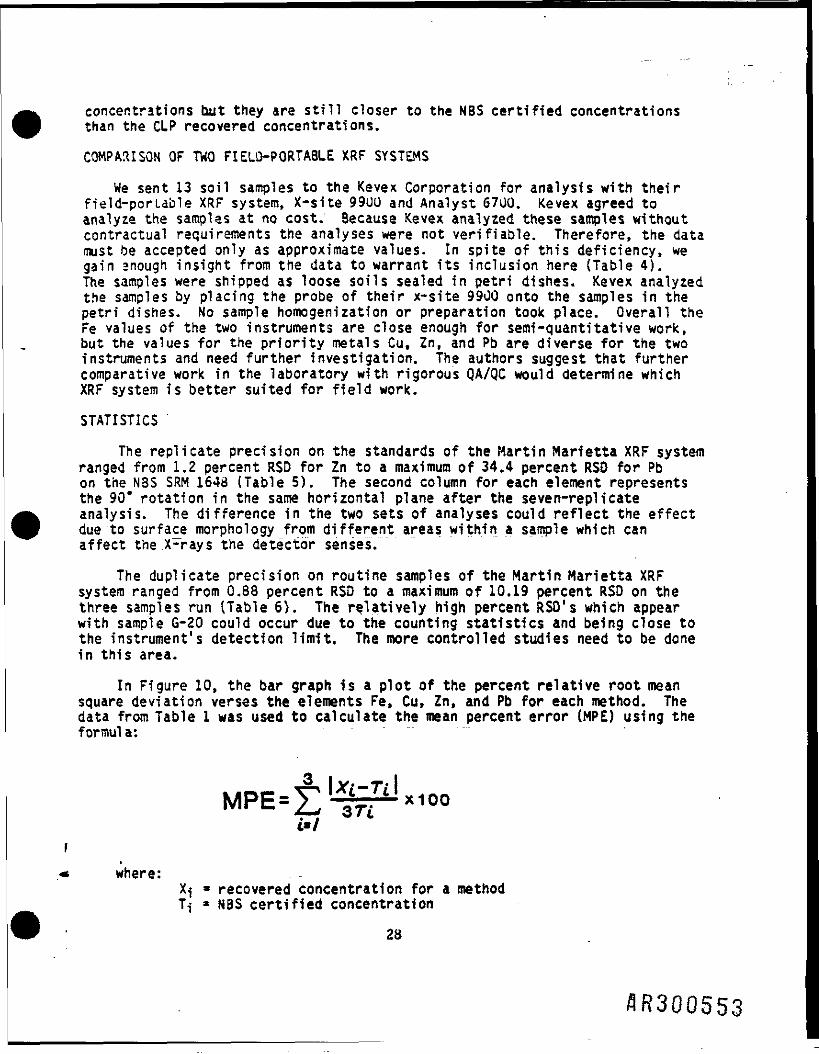
In Figure 10, the bar graph 1s a plot of the percent relative root meansquare deviation verses the elements Fe, Cu, Zn, and Pb for each method. Thedata from Table 1 was used to calculate the mean percent error (MPE) using theformula:
where: -Xj » recovered concentration for a methodTJ * N3S certified concentration
28
flR300553
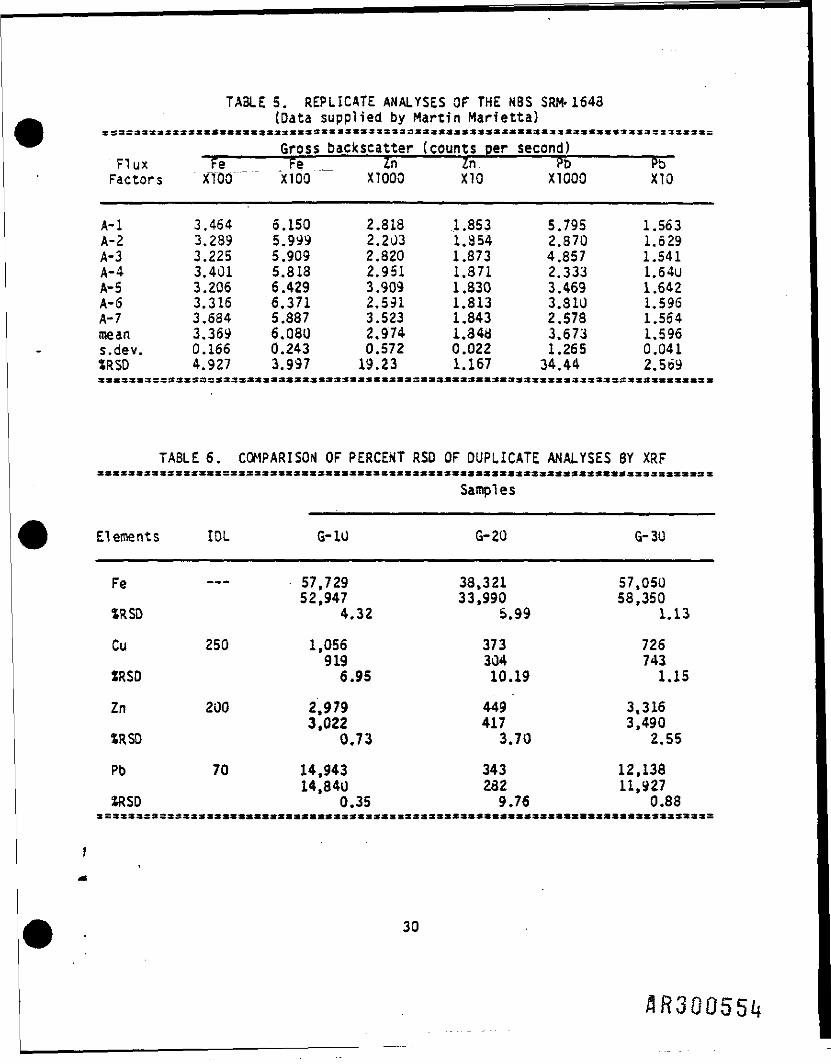
TABLE 5. REPLICATE ANALYSES or THE NBS SRM-1643(Data supplied by Martin Marietta)
33*3XSX«3*33333aE333X3 33*33 33333:Z33*a*333333X3X*X33:3*3X3**ax3333 333333
____Gross backscatter (counts per second)________Flux Te Fe ~ Z n Z r v P5 PITFactors XTOO ~ " X100 X10QO X10 X1000 X10
A-l 3.464 6.150 2.818 1.853 5.795 1.563A-2 3.239 5.999 2.203 1.354 2.870 1.629A-3 3.225 5.909 2.820 1.873 4.857 1.541A-4 3.401 5.813 2.951 1.371 2.333 1.64UA-5 3.206 6.429 3.909 1.830 3.469 1.642A-6 3.316 6.371 2.591 1.813 3.810 1.596A-7 3.684 5.887 3.523 1.843 2.578 1.564mean 3.369 6.080 2.974 1.348 3.673 1.596s.dev. 0.166 0.243 0.572 0.022 1.265 0.041SRSD 4.927 3.997 19.23 1.167 34.44 2.569
TABLE 6. COMPARISON OF PERCENT RSD OF DUPLICATE ANALYSES BY XRF3S33:*̂ Sa2X3S3<3aS3****
Samples
Elements IDL G-10 G-20 G-30
Fe — 57,729 38,321 57,05052,947 33,990 58,350
JRSD 4.32 5.99 1.13
Cu 250 1,056 373 726919 304 743
XRSD 6.95 10.19 1.15
Zn 200 2,979 449 3,3163,022 417 3,490
1RSO 0.73 3.70 2.55
Pb 70 14,943 343 12,13814,840 282 11,927
5RSD 0.35 9.76 0.88
30
The N3S certified value is assumed to be the "true" concentration. Each methodof analysis recovered concentrations equal to or less than the true concentra-tion for each element. The deviation from the true concentration of eachelement represents the effect of both bias and lack of precision or MPE foreach method. What is interesting to note is that whjle the Parr bomb methodshows the lowest MPE of the three methods, the XRF is within a few MPE of theCLP for F'.-, Cu, and Pb. Ths Zn values for XRF exhibited a lower observed MPEthan the CLP values. The overall precision and bias of the results from theCLP and XRF methods are within acceptable scientific limits (±Ui).
32
flftsoosss