an australian and usq perspective ( ‘the case study … · an australian and usq perspective ......
TRANSCRIPT
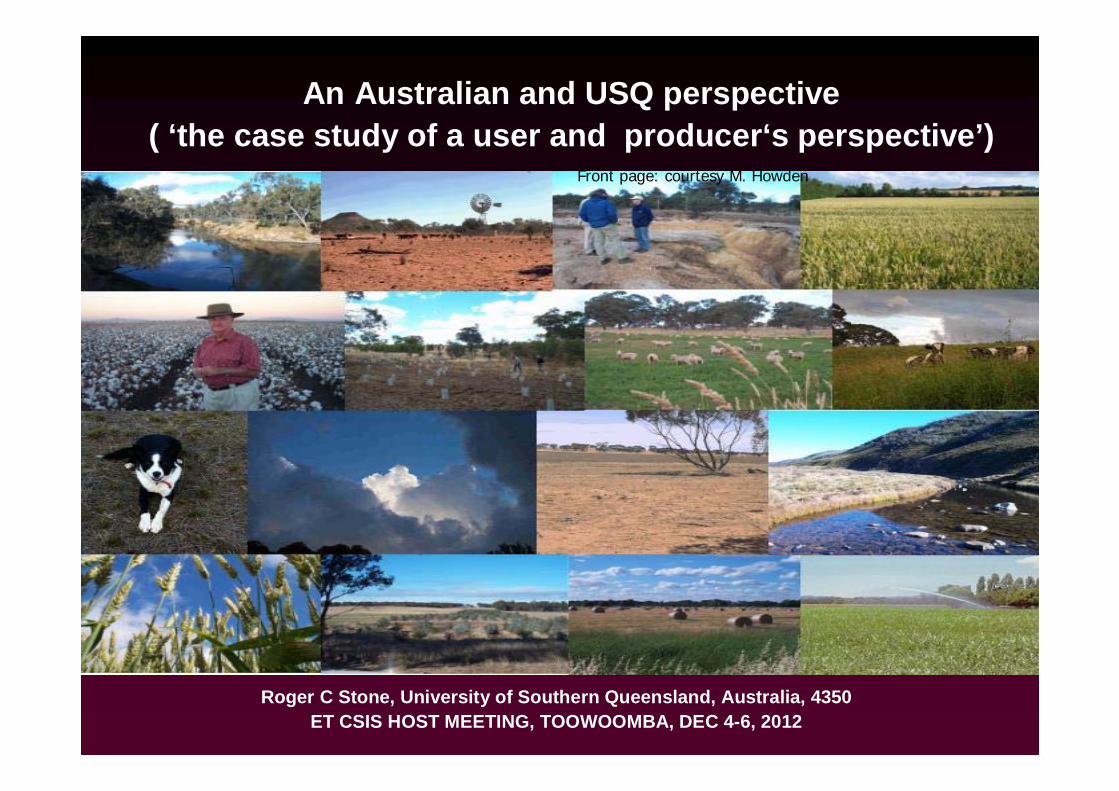
Roger C Stone, University of Southern Queensland, Australia, 4350ET CSIS HOST MEETING, TOOWOOMBA, DEC 4-6, 2012
Front page: courtesy M. Howden
An Australian and USQ perspective ( ‘the case study of a user and producer‘s perspective’)

Australia has the world’s highest levels of year‐to‐year rainfall variability
Variability of Annual rainfall
02468
101214161820
Australia S. Africa Germany France NZ India UK Canada China USA Russia
Country
Coe
ffici
ent (
%)
(100 years of data for Australia and generally also for the other countries)
(Love, 2005)
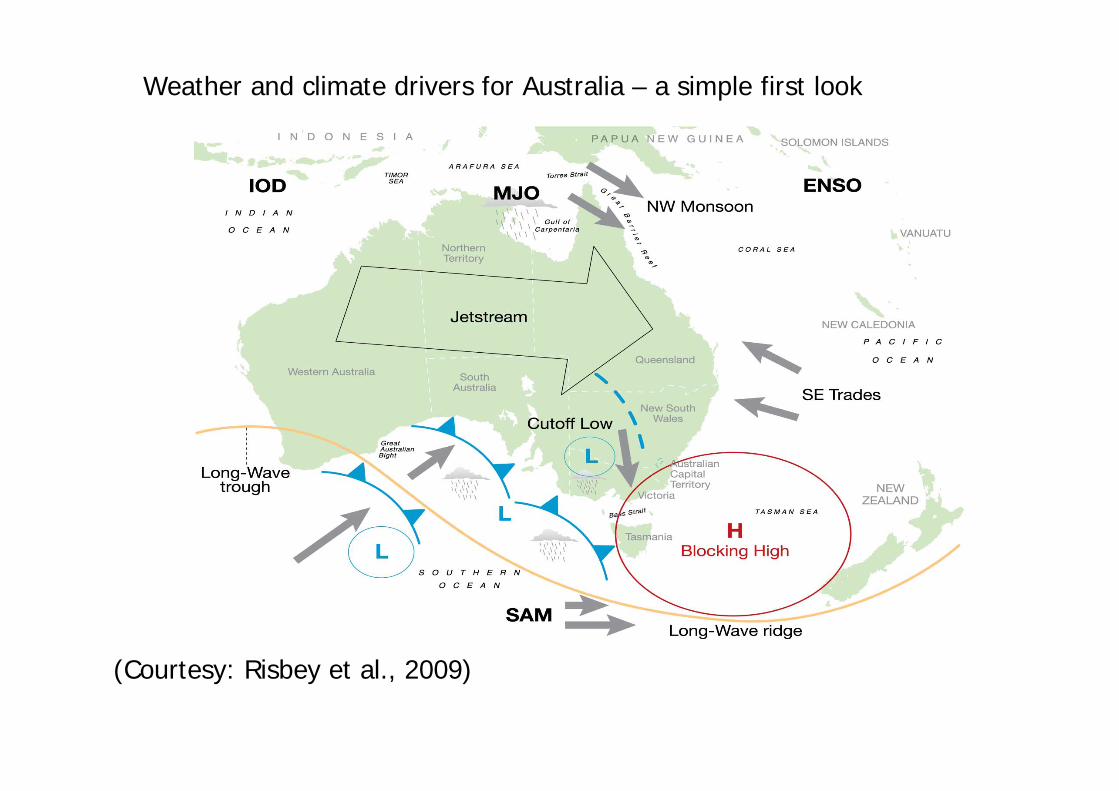
(Courtesy: Risbey et al., 2009)
Weather and climate drivers for Australia – a simple first look
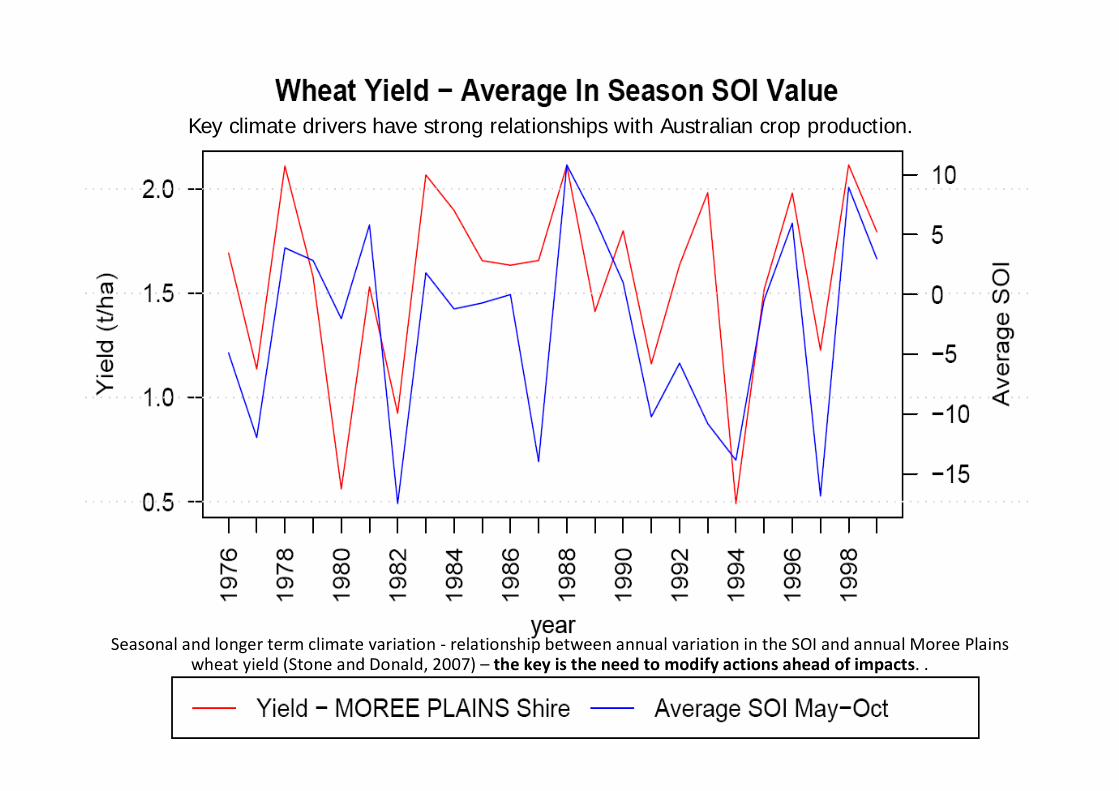
Seasonal and longer term climate variation ‐ relationship between annual variation in the SOI and annual Moree Plains wheat yield (Stone and Donald, 2007) – the key is the need to modify actions ahead of impacts. .
Key climate drivers have strong relationships with Australian crop production.
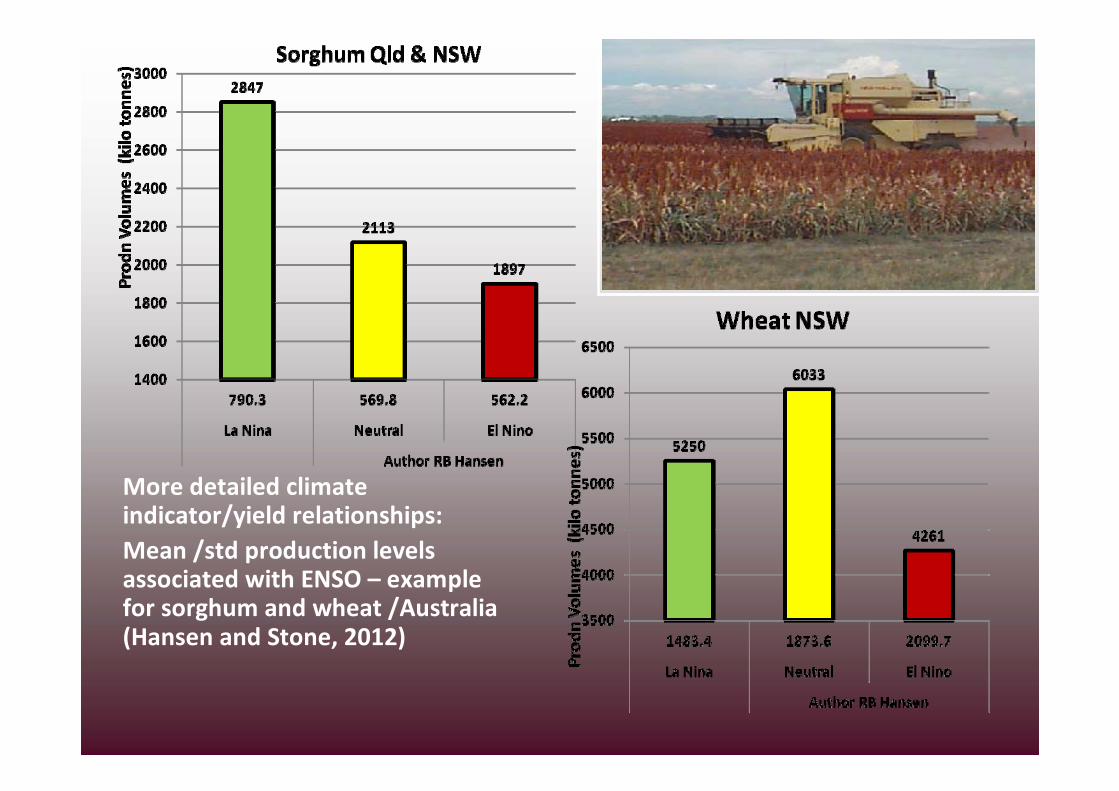
More detailed climate indicator/yield relationships:Mean /std production levels associated with ENSO – example for sorghum and wheat /Australia (Hansen and Stone, 2012)
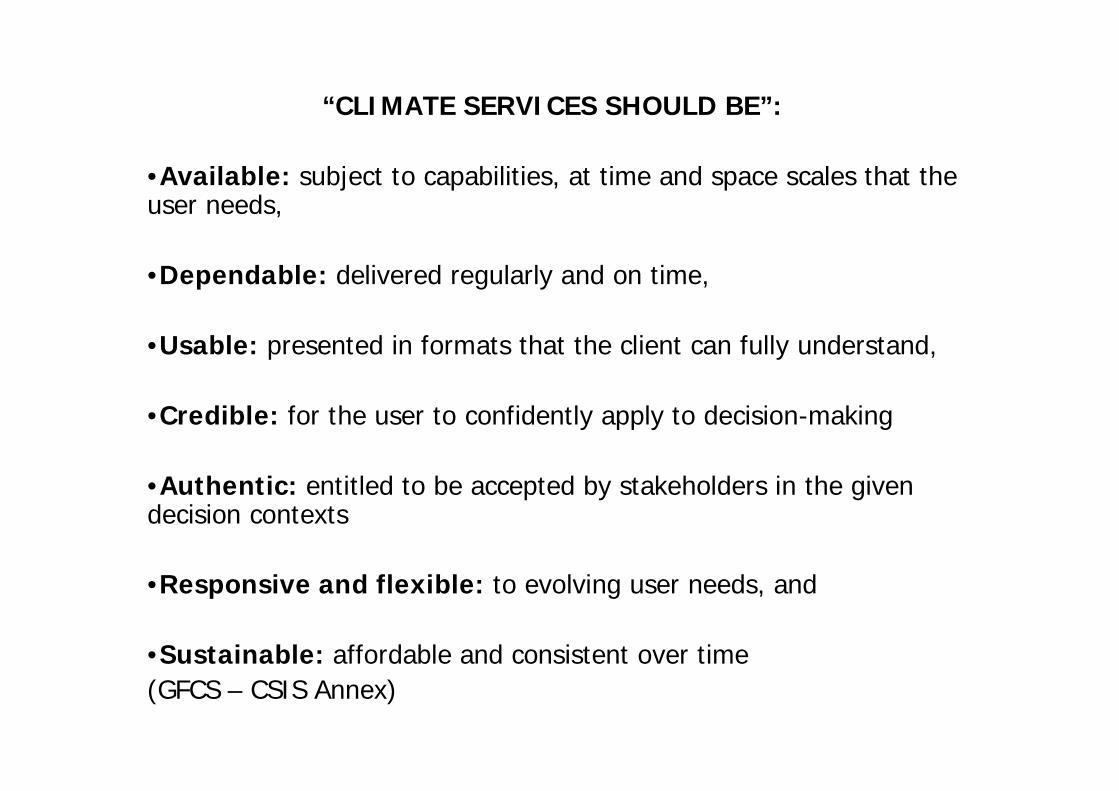
“CLIMATE SERVICES SHOULD BE”:
•Available: subject to capabilities, at time and space scales that the user needs,
•Dependable: delivered regularly and on time,
•Usable: presented in formats that the client can fully understand,
•Credible: for the user to confidently apply to decision-making
•Authentic: entitled to be accepted by stakeholders in the given decision contexts
•Responsive and flexible: to evolving user needs, and
•Sustainable: affordable and consistent over time (GFCS – CSIS Annex)
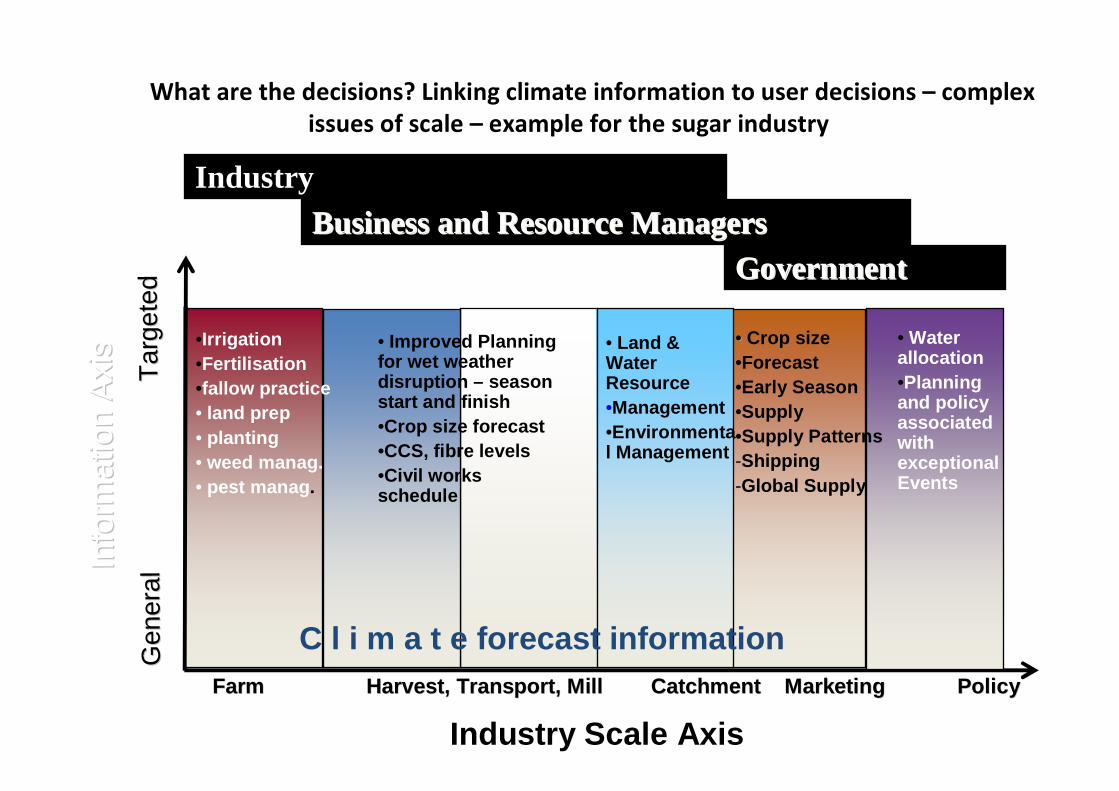
What are the decisions? Linking climate information to user decisions – complex issues of scale – example for the sugar industry
Farm Harvest, Transport, Mill CatchmenFarm Harvest, Transport, Mill Catchment Marketing Policyt Marketing Policy
Industry Scale Axis
Info
rmat
ion
Axi
sIn
form
atio
n A
xis
Gen
eral
Tar
gete
dG
ener
al
T
arge
ted
C l i m a t e forecast information
•Irrigation•Fertilisation•fallow practice• land prep • planting• weed manag.• pest manag.
• Improved Planning for wet weather disruption – season start and finish•Crop size forecast•CCS, fibre levels•Civil works schedule
• Land & Water Resource •Management•Environmental Management
• Water allocation•Planning and policy associated with exceptional Events
IndustryBusiness and Resource ManagersBusiness and Resource Managers
GovernmentGovernment
•• Crop size •Forecast•Early Season •Supply•Supply Patterns-Shipping-Global Supply
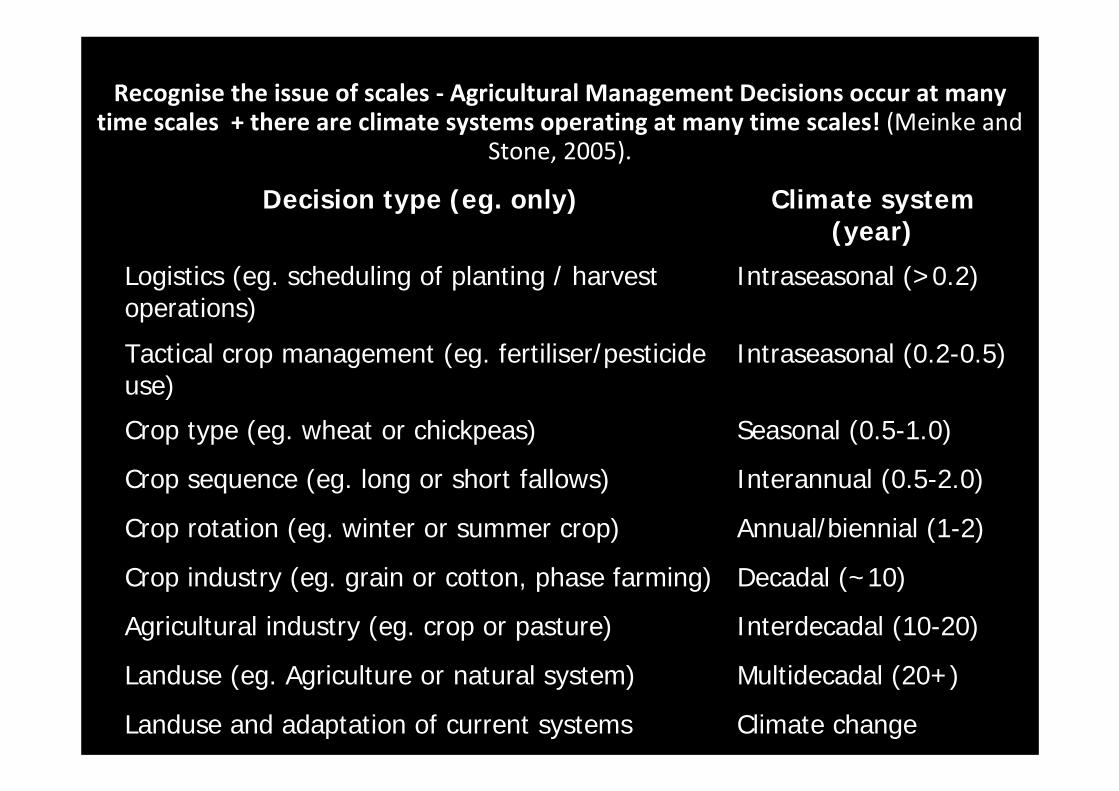
Decision type (eg. only) Climate system (year)
Logistics (eg. scheduling of planting / harvest operations)
Intraseasonal (>0.2)
Tactical crop management (eg. fertiliser/pesticide use)
Intraseasonal (0.2-0.5)
Crop type (eg. wheat or chickpeas) Seasonal (0.5-1.0)
Crop sequence (eg. long or short fallows) Interannual (0.5-2.0)
Crop rotation (eg. winter or summer crop) Annual/biennial (1-2)
Crop industry (eg. grain or cotton, phase farming) Decadal (~10)
Agricultural industry (eg. crop or pasture) Interdecadal (10-20)
Landuse (eg. Agriculture or natural system) Multidecadal (20+)
Landuse and adaptation of current systems Climate change
Recognise the issue of scales ‐ Agricultural Management Decisions occur at many time scales + there are climate systems operating at many time scales! (Meinke and
Stone, 2005).
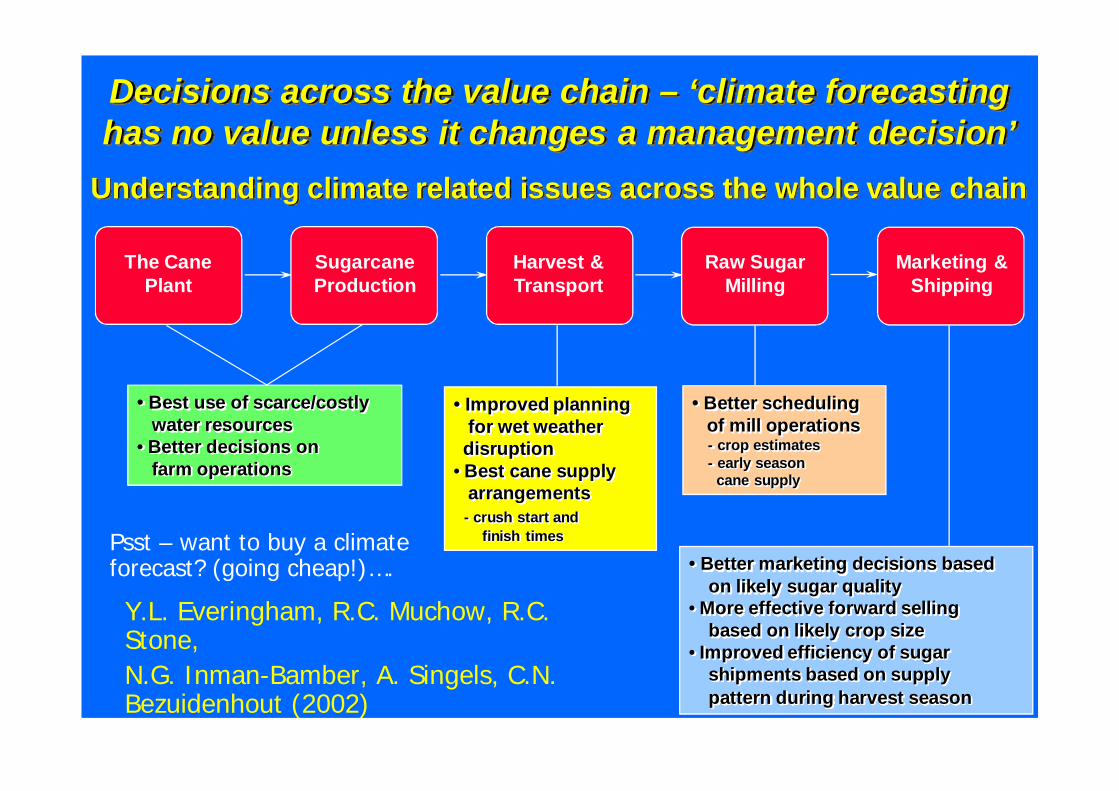
Decisions across the value chain – ‘climate forecasting has no value unless it changes a management decision’
Understanding climate related issues across the whole value chain
The CanePlant
Sugarcane Production
Harvest & Transport
Raw Sugar Milling
Marketing & Shipping
• Best use of scarce/costlywater resources
• Better decisions onfarm operations
• Improved planningfor wet weatherdisruption
• Best cane supplyarrangements
- crush start andfinish times
• Better schedulingof mill operations- crop estimates- early season
cane supply
• Better marketing decisions basedon likely sugar quality
• More effective forward sellingbased on likely crop size
• Improved efficiency of sugarshipments based on supplypattern during harvest season
Y.L. Everingham, R.C. Muchow, R.C. Stone,N.G. Inman-Bamber, A. Singels, C.N. Bezuidenhout (2002)
Psst – want to buy a climate forecast? (going cheap!)….
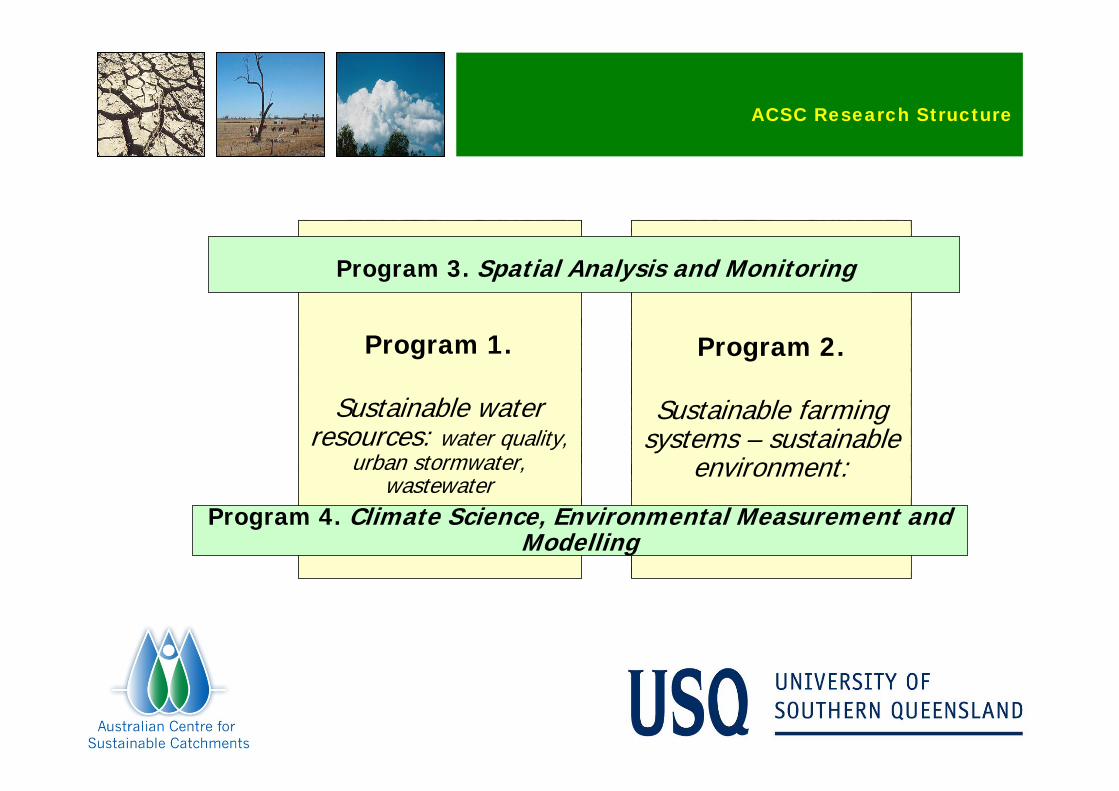
Program 1.
Sustainable water resources: water quality,
urban stormwater, wastewater
Program 2.
Sustainable farming systems – sustainable
environment:
Program 3. Spatial Analysis and Monitoring
Program 4. Climate Science, Environmental Measurement and Modelling
ACSC Research Structure

The underpinning climate forecast system - assessing climate
forecast accuracy and reliability• Example – assessing the
dimensions of forecast quality -
Reliability - How consistently do realisations fit the forecast distributions?
Shift - How far is the forecast distribution shifted from the reference distribution?
Dispersion – How variable is the forecast
• distribution relative to the reference distribution? (Potgieter et al, 2003)
SHIFTReference
distributionForecast
distribution
Reference distribution
DISPERSION
Forecast distribution
0.0 0.2 0.4 0.6 0.8 1.0Forecasted Probabi l i ty of exceeding the median
0.0
0.2
0.4
0.6
0.8
1.0
Obs
Rel
Fre
quen
cy
Reliability Shire: 612 - Month 6
Signi f= 0.619rmse 0.118
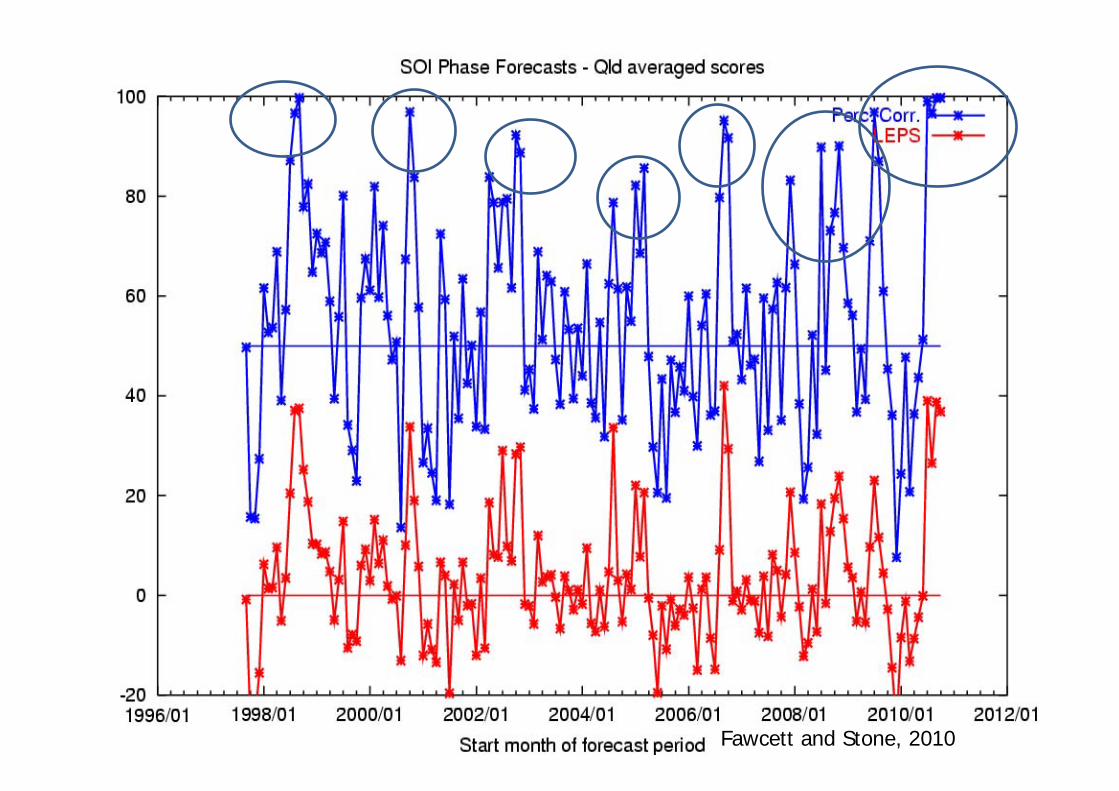
Fawcett and Stone, 2010
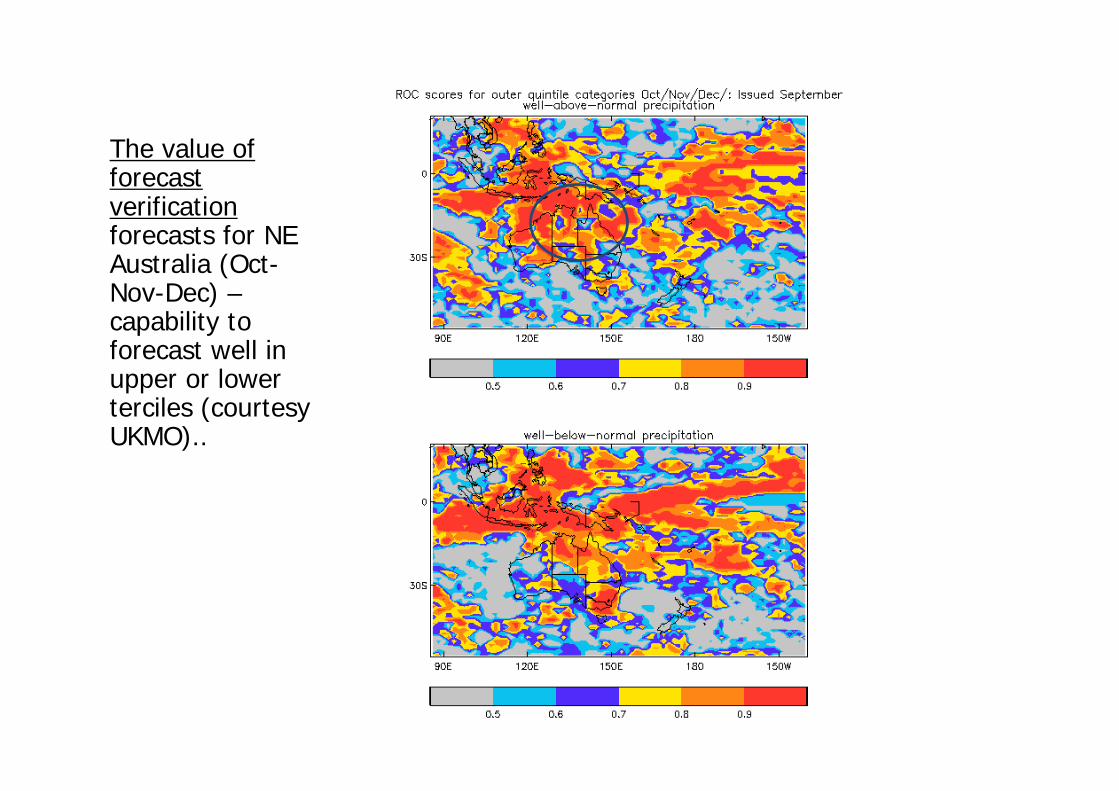
The value of forecast verification forecasts for NE Australia (Oct-Nov-Dec) –capability to forecast well in upper or lower terciles (courtesy UKMO)..
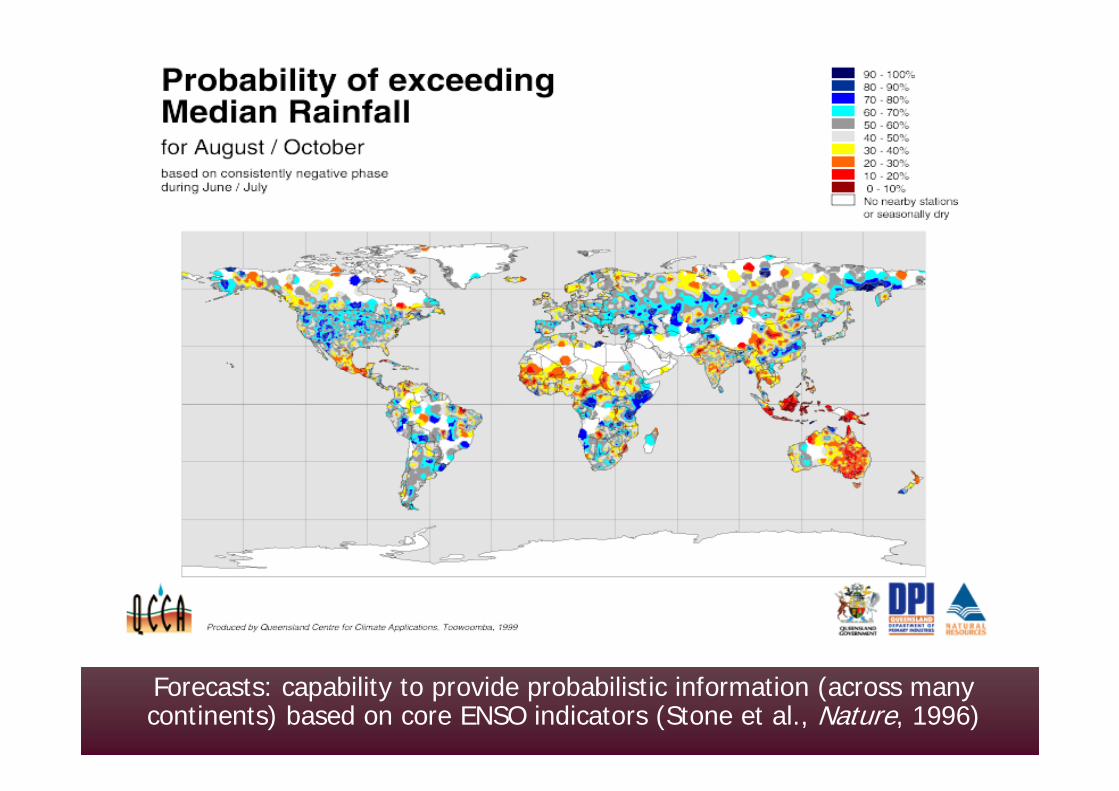
Forecasts: capability to provide probabilistic information (across many continents) based on core ENSO indicators (Stone et al., Nature, 1996)
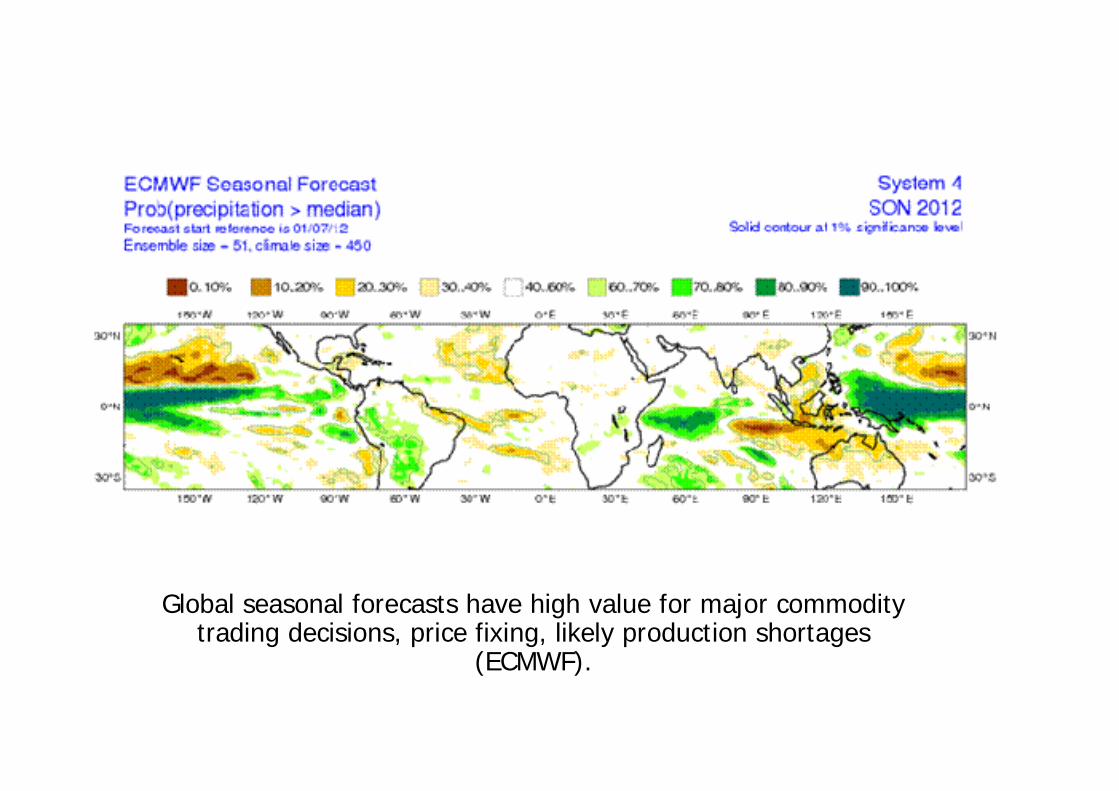
Global seasonal forecasts have high value for major commodity trading decisions, price fixing, likely production shortages
(ECMWF).
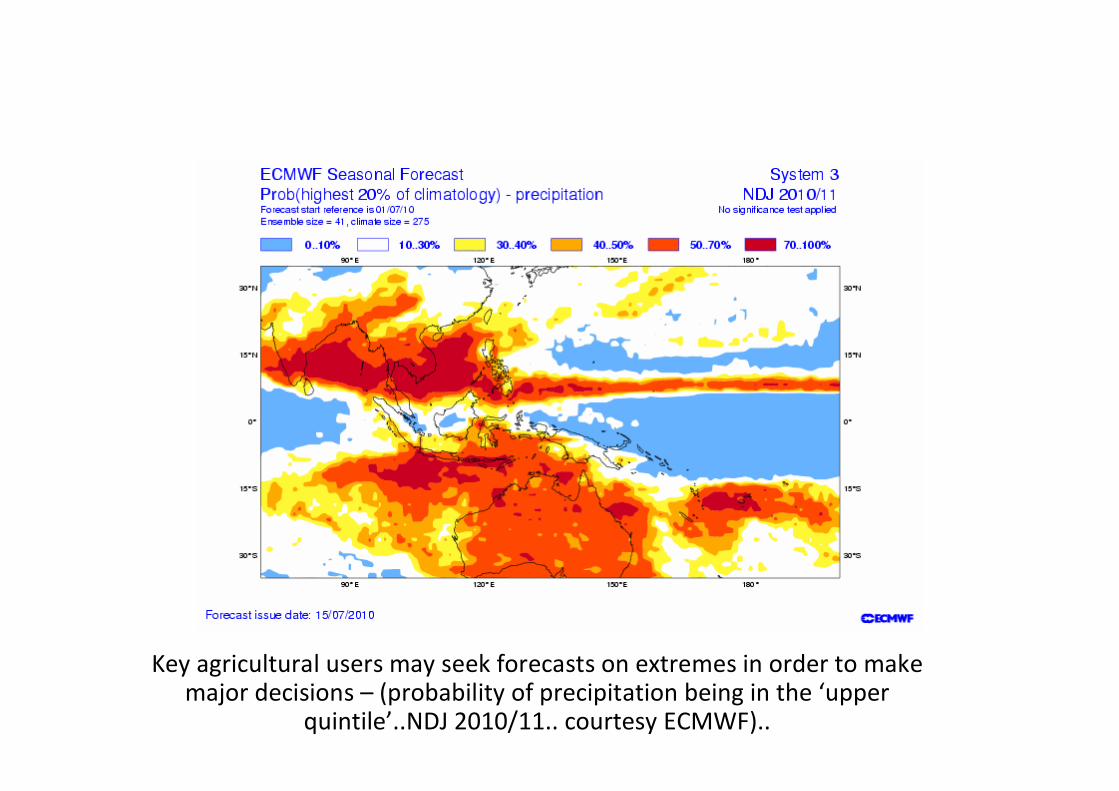
Key agricultural users may seek forecasts on extremes in order to make major decisions – (probability of precipitation being in the ‘upper
quintile’..NDJ 2010/11.. courtesy ECMWF)..

Sample Sample ‘‘Water and the LandWater and the Land’’ (WATL) products from (WATL) products from Australian NMHSAustralian NMHS……facilitating climate information facilitating climate information
application application directlydirectly from NMHSsfrom NMHSs
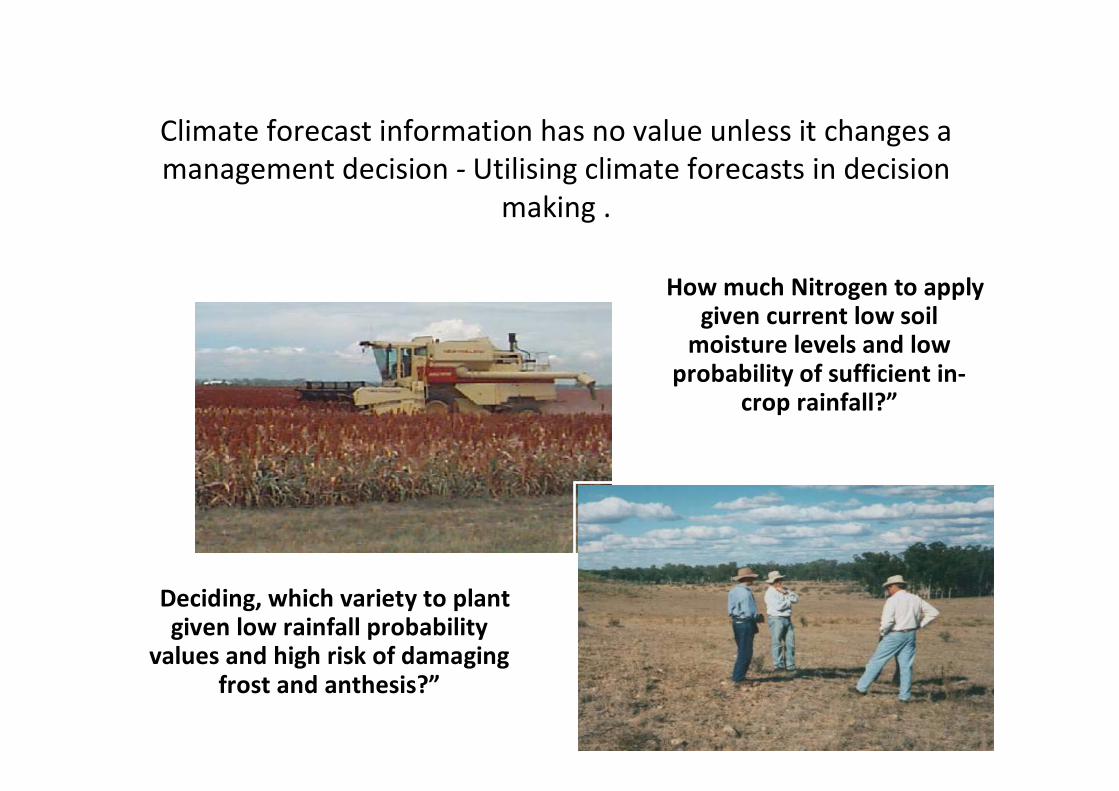
Climate forecast information has no value unless it changes a management decision ‐ Utilising climate forecasts in decision
making .
“How much Nitrogen to apply given current low soil moisture levels and low
probability of sufficient in‐crop rainfall?”
“Deciding, which variety to plant given low rainfall probability
values and high risk of damaging frost and anthesis?”
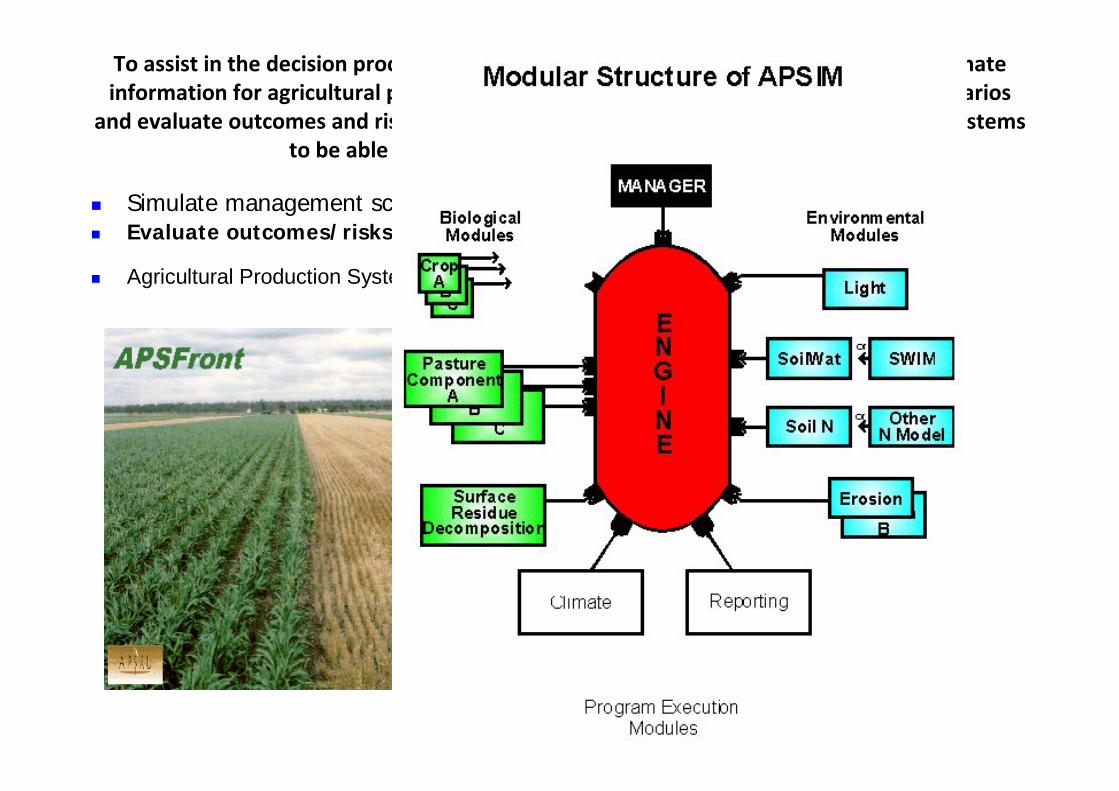
To assist in the decision process? the linking role of modelling in the application of climate information for agricultural production ‐ the key role is to simulate management scenarios
and evaluate outcomes and risks relevant to decisions – the need for climate forecast systems to be able to fit such additional model requirements….
• yield of crops and pastures
• key soil processes (water, N, carbon)
• surface residue dynamics & erosion
• range of management options
• crop rotations + fallowing• short or long term effects
Simulate management scenarios Evaluate outcomes/risks relevant to decisions
Agricultural Production Systems Simulator (APSIM) simulates
Sow date & SOI Phase
15-SepNegative
15-OctNegative
15-NovNegative
15-DecNegative
15-JanNegative
Yie
ld (k
g/ha
)
6000
5500
5000
4500
4000
3500
3000
2500
2000
1500
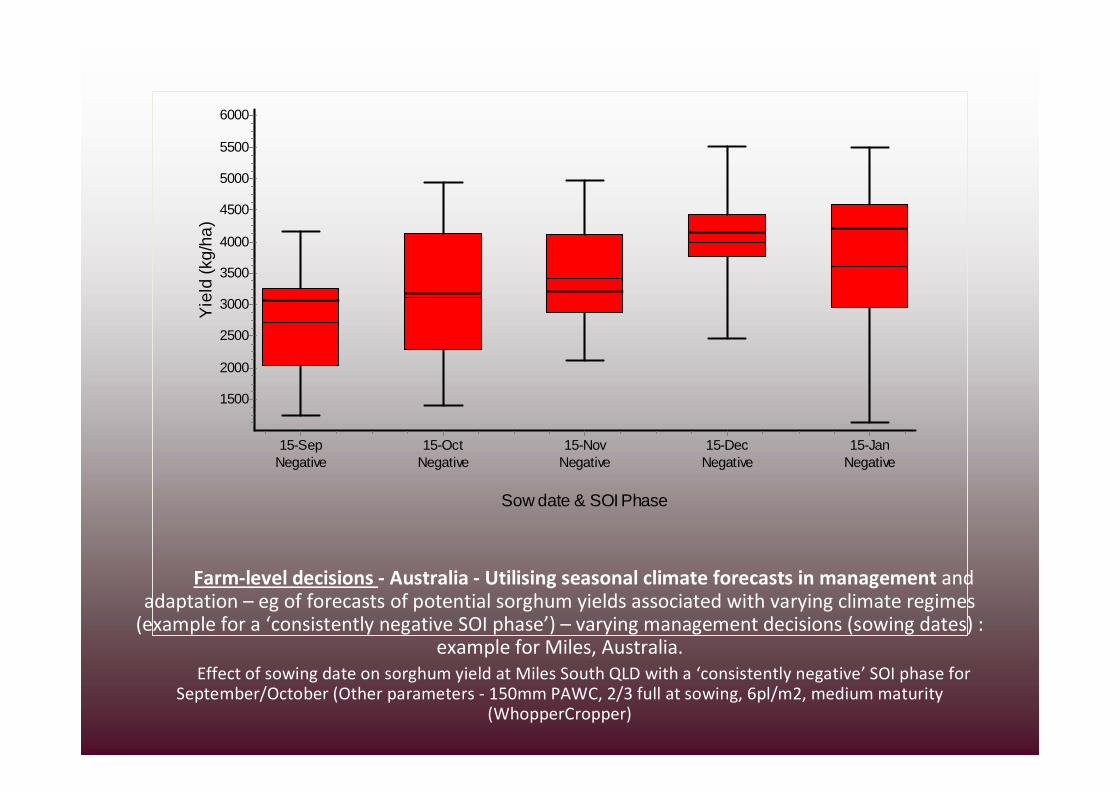
Farm‐level decisions ‐ Australia ‐ Utilising seasonal climate forecasts in management and adaptation – eg of forecasts of potential sorghum yields associated with varying climate regimes (example for a ‘consistently negative SOI phase’) – varying management decisions (sowing dates) :
example for Miles, Australia.Effect of sowing date on sorghum yield at Miles South QLD with a ‘consistently negative’ SOI phase for
September/October (Other parameters ‐ 150mm PAWC, 2/3 full at sowing, 6pl/m2, medium maturity (WhopperCropper)
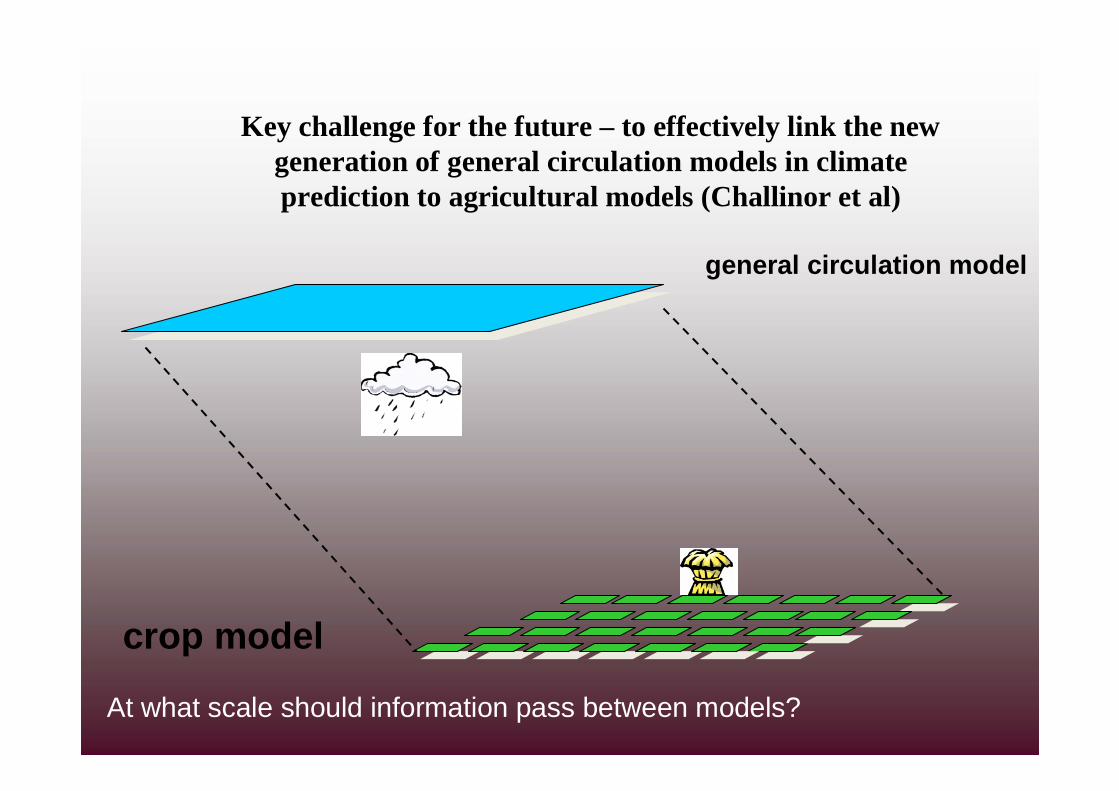
Key challenge for the future – to effectively link the new generation of general circulation models in climate prediction to agricultural models (Challinor et al)
general circulation model
crop model
At what scale should information pass between models?
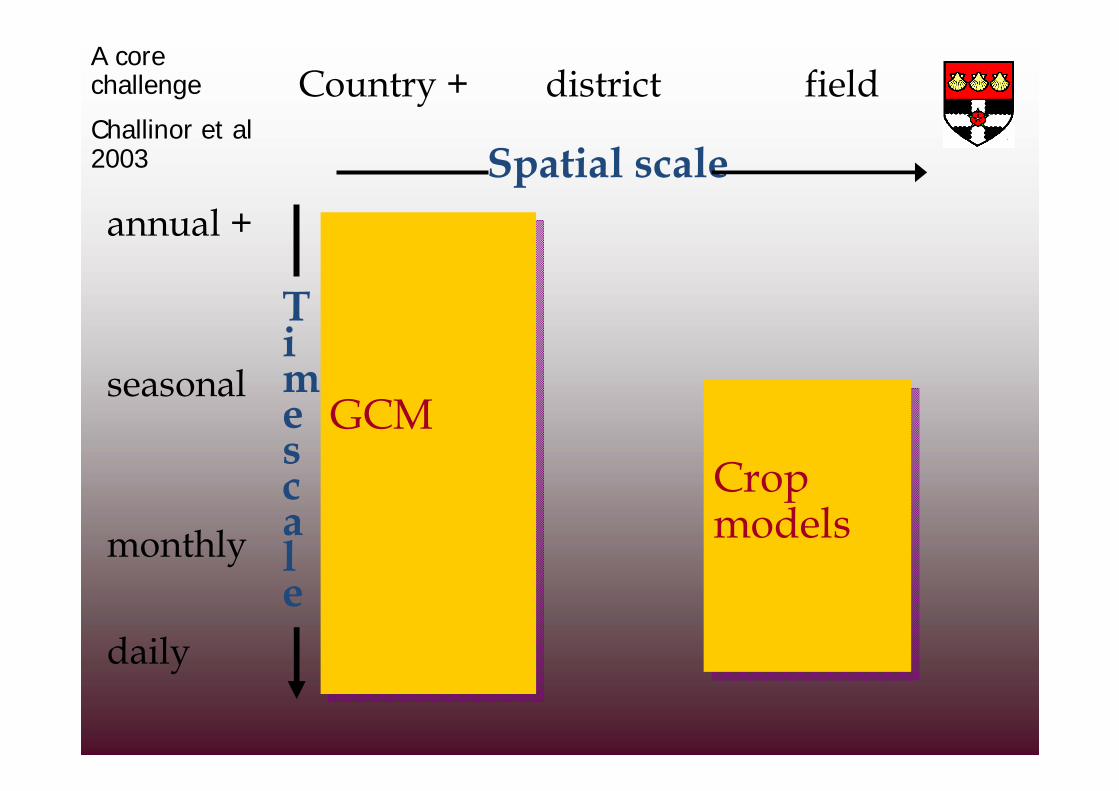
GCMGCM
Timescale
Spatial scaleannual +
seasonal
monthly
daily
Country + district field
Crop modelsCrop models
A core challenge
Challinor et al 2003
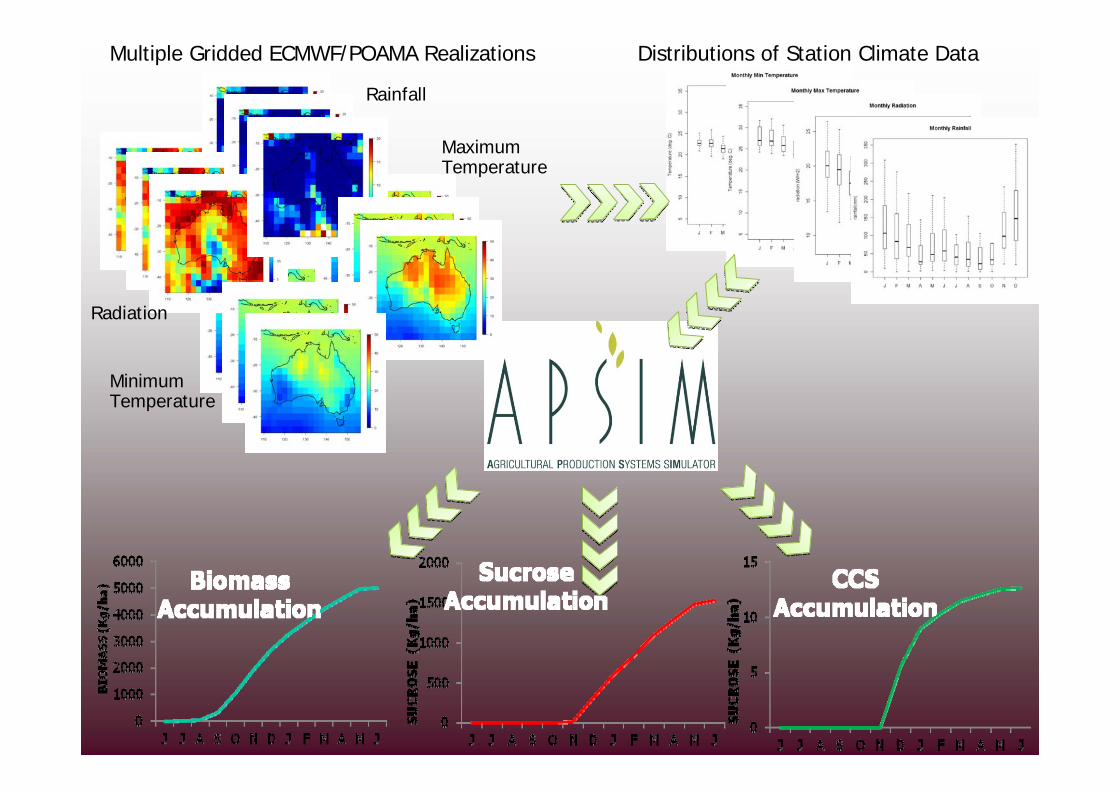
Multiple Gridded ECMWF/POAMA Realizations
Maximum Temperature
Radiation
Rainfall
Minimum Temperature
Distributions of Station Climate Data
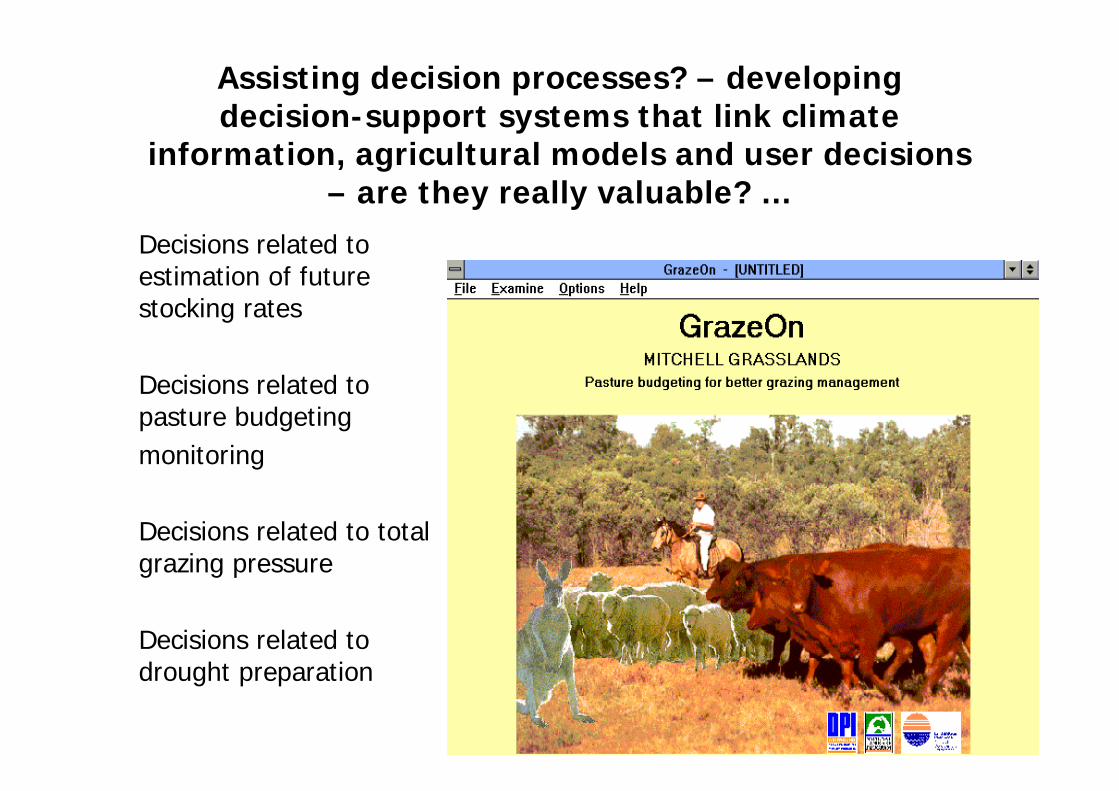
Assisting decision processes? – developing decision-support systems that link climate
information, agricultural models and user decisions – are they really valuable? …
Decisions related to estimation of future stocking rates
Decisions related to pasture budgetingmonitoring
Decisions related to total grazing pressure
Decisions related to drought preparation
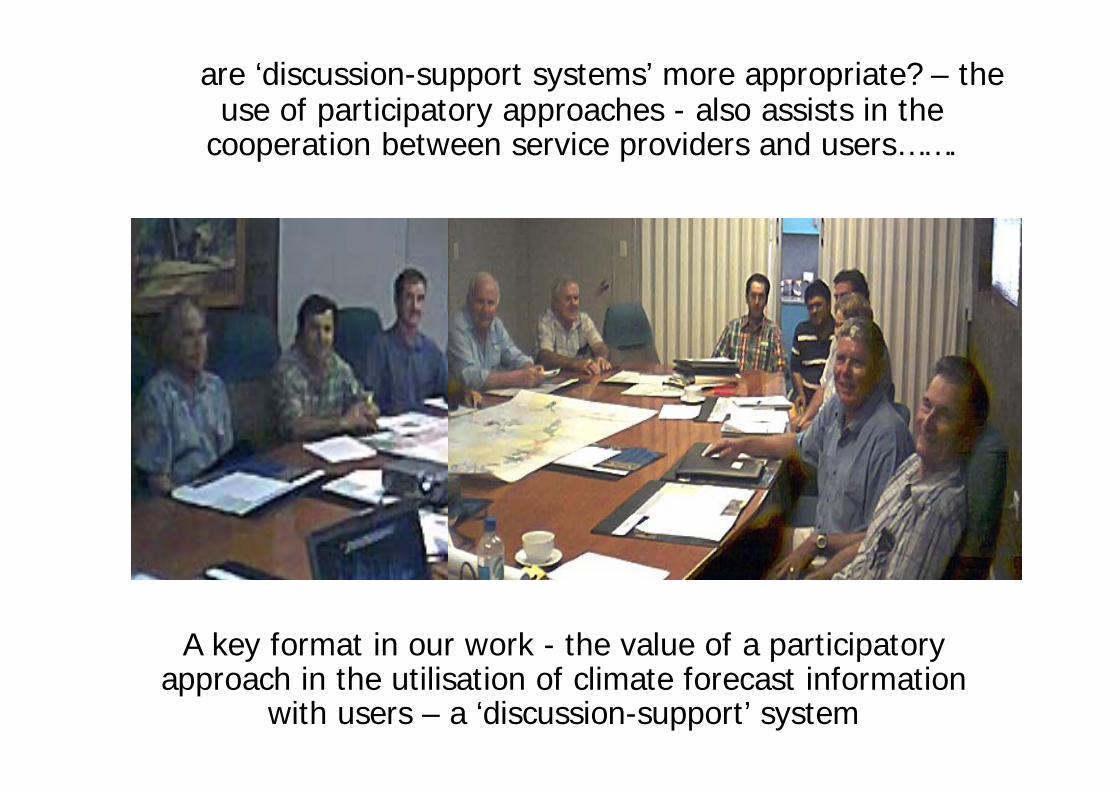
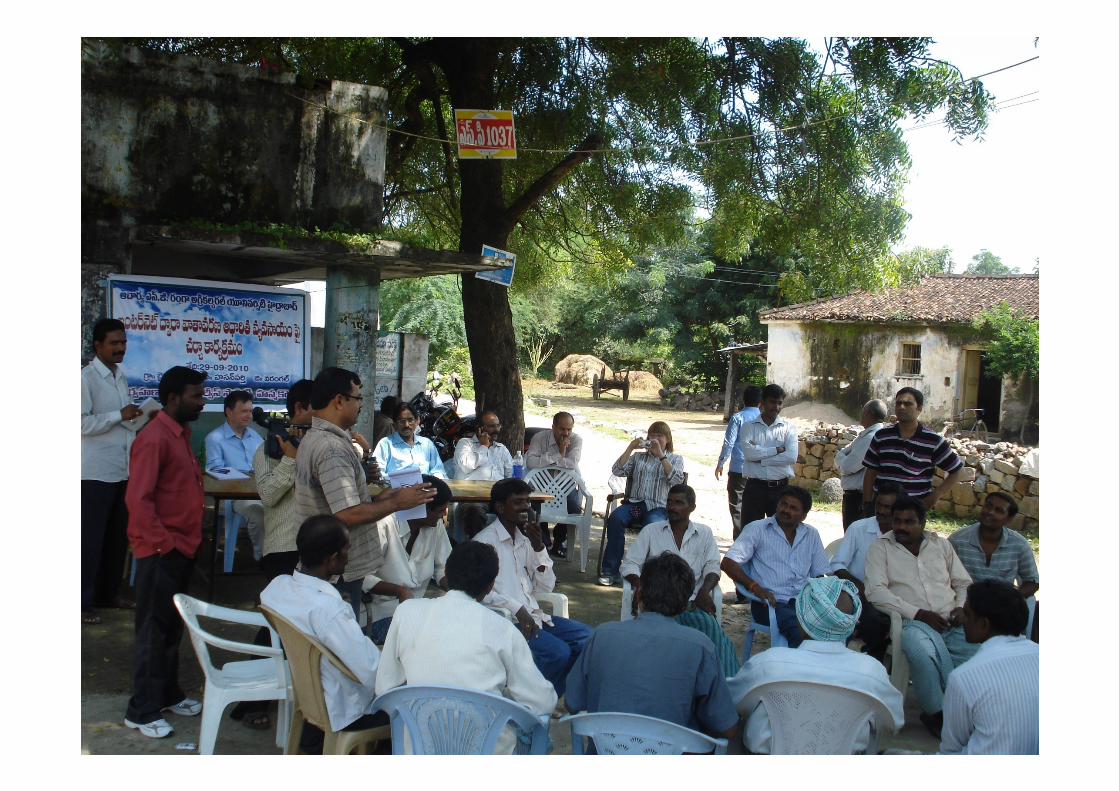
Or are ‘discussion-support systems’ more appropriate? – the use of participatory approaches - also assists in the
cooperation between service providers and users…….
A key format in our work - the value of a participatory approach in the utilisation of climate forecast information
with users – a ‘discussion-support’ system

Discussion support systems vital

USQ Online ExtensionUSQ Online Extension‐‐DevelopmentDevelopment• Provide an online discussion support tool for farmers
• Enable real time (SMS alerts/synchronous chats)• Discussion prompts/scenarios driven by climate‐based information
• SST / SOI / agronomic information
•Production of climate/ag‐relevant scripts and scenarios• Use of 2nd Life to replicate simulated environments
• Addresses cultural and language issues
Key needs (selfish)…•Data rescue – climate risk management requires full assessment of underlying variability/extremes etc…especially for work in countries such as Vietnam, Iran, China, DRPK, Columbia where we now or will soon work. •Output/feed from new generation of fully coupled models–R&D needed to work out best means of working with varying scale issues.•Core need to ascertain the best means (and best models?) when linking GCMs into crop simulation or hydrological simulation models.•Need for IVRT as well as cross validated skill assessments.•Need for forecast outputs for critical management periods for industry – does or should ‘one size’ (or model) fit all temporal and spatial scales? Industry may have critical periods worth many billions of $ but maybe just for one critical period of the year.•Create as much ‘ownership’ as possible of the climate forecast system to the user – create a sense of empowerment – make sure one links to the very core critical periods…
THANK YOU!
• Evaluate the worth of tactical or strategic decision options: the quantification and clear communication of the likely outcomes e.g. economic or environmental, and associated risks of a changing an agricultural management practice are key to achieving adoption of the technology.
• Implement participative implementation and evaluation: working with agricultural managers/decision makers generates valuable insights and learning throughout the entire process: i.e. identifying relevant questions/problems and devising suitable technologies and tools.
• Provide feedback to climate forecasting research in the NMHS (oruniversity): rather than just accepting a given climate forecast, consider what specific improvements would be of greatest value in the agricultural system. This can provide some direction for the style of delivery of forecasts and for climate research of value for the agricultural sector.
• “Climate information doesn’t have to be perfect to be useful; it just needs to support a decision” (Hammer, 2000; Hammer et al., 2001; Stone and Meinke, 2007; Rodriguez, 2010).
• Summary: A systematic approach in applying climate information to agricultural decision-making to achieve best practice (after Hammer, 2000)
• Understand the agricultural system and its management: it is essential to understand the system dynamics and opportunities for management intervention i.e. identify those decisions that could influence desired systems behaviour or performance;
• Understand the impact of climate variability/climate change: it is important to understand where in the ag-system climate is an issue;
• Determine the opportunities for tactical/strategic management in response to the forecasts. If forecasts are now available, what possible options are there at relevant decision-points? How might agricultural decisions be changed in response to forecasts? Whatnature of forecast would be most useful? and - What lead-time is required for management responses?
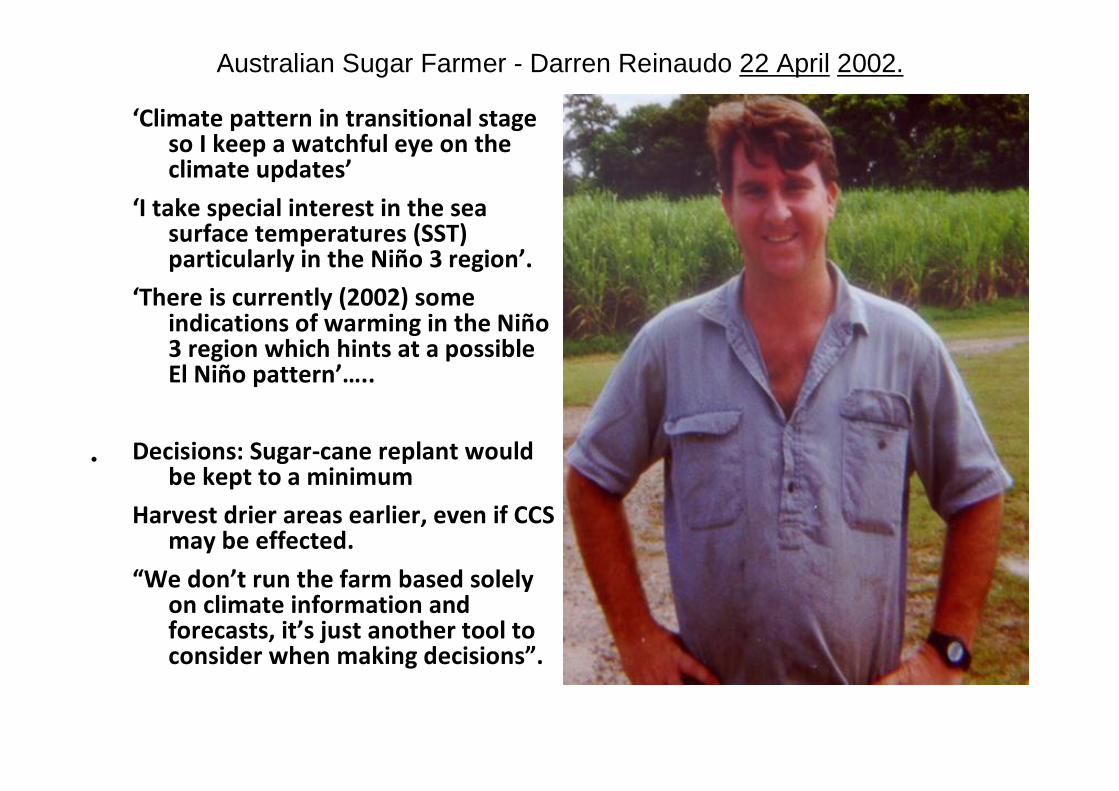
Australian Sugar Farmer - Darren Reinaudo 22 April 2002.
•
‘Climate pattern in transitional stage so I keep a watchful eye on the climate updates’
‘I take special interest in the sea surface temperatures (SST) particularly in the Niño 3 region’.
‘There is currently (2002) some indications of warming in the Niño 3 region which hints at a possible El Niño pattern’…..
Decisions: Sugar‐cane replant would be kept to a minimum
Harvest drier areas earlier, even if CCS may be effected.
“We don’t run the farm based solely on climate information and forecasts, it’s just another tool to consider when making decisions”.
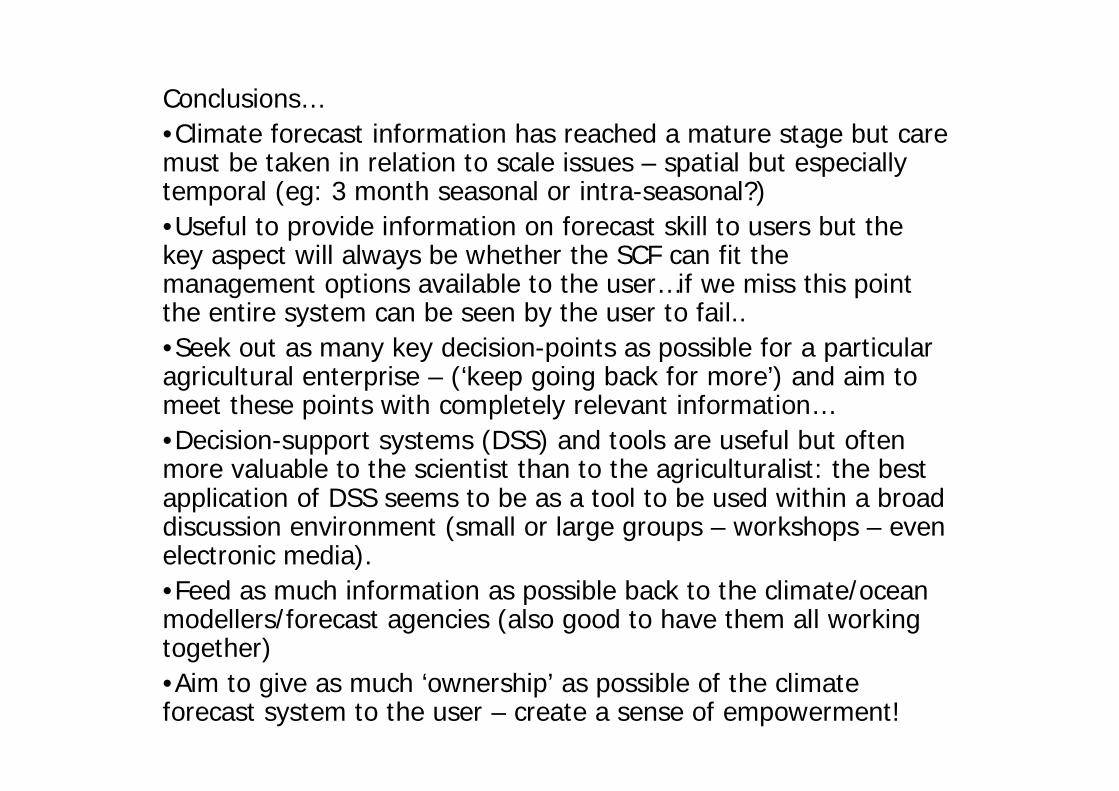
Conclusions…•Climate forecast information has reached a mature stage but caremust be taken in relation to scale issues – spatial but especially temporal (eg: 3 month seasonal or intra-seasonal?)•Useful to provide information on forecast skill to users but thekey aspect will always be whether the SCF can fit the management options available to the user…if we miss this point the entire system can be seen by the user to fail..•Seek out as many key decision-points as possible for a particular agricultural enterprise – (‘keep going back for more’) and aim to meet these points with completely relevant information…•Decision-support systems (DSS) and tools are useful but often more valuable to the scientist than to the agriculturalist: the best application of DSS seems to be as a tool to be used within a broad discussion environment (small or large groups – workshops – even electronic media).•Feed as much information as possible back to the climate/ocean modellers/forecast agencies (also good to have them all working together) •Aim to give as much ‘ownership’ as possible of the climate forecast system to the user – create a sense of empowerment!