australian journal of agricultural - welcome to usq … · 2014-10-26 · mapping components of...
TRANSCRIPT

P u b l i s h i n g
Australian Journal of Agricultural ResearchCSIRO PublishingPO Box 1139 (150 Oxford St)Collingwood, Vic. 3066, Australia
Telephone: +61 3 9662 7628Fax: +61 3 9662 7611Email: [email protected]
Published by CSIRO Publishing for CSIRO and the Australian Academy of Science
w w w . p u b l i s h . c s i r o . a u / j o u r n a l s / a j a r
All enquiries and manuscripts should be directed to:
AustralianJournal ofAgriculturalResearch
Volume 52, 2001© CSIRO 2001
A journal for the publication of original contributionstowards the understanding of an agricultural system

© CSIRO 2001 10.1071/AR01048 0004-9409/01/111297
Aust. J. Agric. Res., 2001, 52, 1297–1309
Mapping components of flour and noodle colour in Australian wheat
D. J. MaresAC and A. W. CampbellBD
AUniversity of Sydney, Plant Breeding Institute, PO Box 219, Narrabri, NSW 2390, Australia.BCentre for Rural and Environmental Biotechnology, Faculty of Sciences, University of Southern Queensland,
Toowoomba, Qld 4350, Australia. C Current address: Adelaide University, Waite Campus, Department of Plant Science, Glen Osmond, SA 5064, Aus-
tralia.DCurrent address: Animal Genomics, AgResearch, Invermay, Private Bag 50034, Mosgiel, New Zealand.
Abstract. Flour and noodle colour influence the value of wheat (Triticum aestivum L.) and are obvious targets forbreeders seeking to improve quality, end-product range, and marketability of wheat. The objective of thisinvestigation was to identify quantitative trait loci (QTLs) associated with flour and noodle colour traits and withindividual components of colour. One hundred and sixty-three doubled haploid lines derived from Sunco × Tasman,white-grained, prime hard, and hard wheats adapted to the north-eastern region of Australia were used for the bulkof this study and were supplemented by doubled haploid populations derived from CD87 × Katepwa and Cranbrook× Halberd for comparisons of flour colour. Samples of Sunco × Tasman, together with parental lines, were grownat Narrabri, NSW, in 1998 and 1999 and at Roma, Qld, in 1998 and used for visible light reflectance measurementsof flour brightness (CIE L*) and yellowness (CIE b*), and white salted noodle (WSN) and yellow alkaline noodle(YAN) brightness, yellowness, and colour stability. Xanthophyll content and polyphenol oxidase (PPO) activitywere measured spectrophotometrically.
No consistent QTLs were identified for flour L* or initial L* of WSN and YAN. Xanthophyll content was verystrongly associated with QTLs located on chromosomes 3B and 7A and these QTLs also had a major influence onflour b*, WSN b*, and YAN b*. Noodle brightness at 2, 24, and 48 h and the magnitude of change in noodle L*and b* with time were affected by QTLs on 2D, contributed by Tasman, and, to a lesser degree, 2A. The QTL on2D was clearly associated with control of grain PPO, an enzyme implicated in darkening of Asian style noodles.QTLs located on 2B, 4B, and 5B and associated with control of grain size or flour protein content also appeared toinfluence a number of colour traits.
Additional keywords: colour stability, xanthophyll, polyphenol oxidase.
D. J M ares ,A. W. CampbellAR01048Mapping component s of fl our and noodl e col our in Aus tr ali an wheatD. J M ares and A. W. Campbel lIntroduction
Flour and end-product colour are important criteria of wheat,Triticum aestivum L., quality and play a critical role indetermining the suitability of wheat for particular productsand markets. Flour colour is affected by two maincomponents: (i) the presence of bran flakes resulting inspeckiness, which is related to how easily the outer seed coatlayers and aleurone can be separated from the endospermduring milling and sieving, and (ii) the actual colour of thestarchy endosperm. In turn, end-product colour depends onthe colour of the flour together with reactions andinteractions that occur during the mixing of flour with waterand other ingredients and subsequent processing andcooking. Different end products of wheat have differentcolour requirements, for example, white flour is importantfor bread production in many regions, a bright white to
creamy colour is desirable for white salted noodles (WSN),whereas development of a bright yellow colour is requiredfor yellow alkaline noodles (YAN). Some products are soldin a raw form and both initial dough/product colour and themaintenance of colour and brightness are important.
Flour colour has been shown to be genetically controlledin part, and factors such as brightness, yellowness, and thedegree of bran and germ contamination of the flour have longbeen targets for selection by many wheat breeders(Labuschagne et al. 1996; Parker et al. 1998; Mares andPanozzo 1999; Parker and Langridge 2000). Theconstituents and reactions involved in brightness of flour andthe initial brightness of noodles are still to be characterisedand quantified. In WSN, as in flour, the importantcomponents of initial colour include brightness, measured asa CIE (Commission Internationale l’Eclairage) L* value, andthe whiteness/creaminess, measured as a CIE b* value,
1298 D. J. Mares and A. W. Campbell
which is determined by the level of xanthophylls (lutein andits fatty acid esters, which are retained in the flour) (Mares etal. 1997; Ward et al. 1997, 1998). Colour stability in WSN isdetermined by factors that degrade brightness, i.e. causedarkening, or bleach the xanthophyll pigments. In YAN, theimportant components of initial colour include brightnessand xanthophyll content, as in WSN, and also specificflavonoid compounds that are colourless at neutral pH and inWSN and bread doughs but which turn yellow at the high pHresulting from the use of alkaline salts (Mares et al. 1997).Mares et al. (1997) reported the extraction, separation, andquantitation of the xanthophylls and flavonoids involved inthe yellow colour of YAN and demonstrated that there was astrong correlation between CIE b* and the sum of thexanthophyll and flavonoid contents of flour. Colour stabilityin YAN will consequently be determined by factors thatcause darkening or degrade either xanthophylls or thespecific flavonoids that turn yellow at high pH. Noodledarkening results from the additive effects of polyphenoloxidase (PPO) and non-PPO reactions (Mares and Panozzo1999). PPO catalyses the oxidation of some phenoliccompounds, which leads to the production of black or darkbrown pigments causing noodles to darken over time.Variation in PPO, derived from the seed coat, explains muchof the difference in darkening between genotypes and thisappears to be superimposed on a background of non-PPOdarkening that shows only limited genetic variability (Maresand Panozzo 1999). Darkening is obviously more critical innoodles that are often stored raw for several days prior tocooking ready for consumption and thus PPO levels areparticularly relevant in the production of YAN.
Most of these factors are thought to be under independentgenetic control (Mares and Panozzo 1999; Mares et al.2001); however, flour colour can also be influenced byenvironmental factors during grain formation, the millingprocess, and, in the case of noodles, the particular recipe,ingredients, and preparation conditions used in themanufacturing process (Mares and Panozza 1999).
Flour and noodle colour are expressed as quantitativetraits. Parker et al. (1998) found quantitative trait loci(QTLs) for flour colour (b*) in an Australian single seeddescent population, Schomburgk × Yarralinka, onchromosomes 3A and 7A. Ma et al. (1999) located QTLs forflour colour (L*-b*) on homoeologous group 1 linkagegroups and chromosome 7B. The QTL found by Parker et al.(1998) on chromosome 7A was later converted to an STSmarker (Parker and Langridge 2000). This marker has beenfurther validated and shown to be polymorphic over a widerange of Australian germplasm (Sharp et al. 2001, thisissue).
The aim of this study was to identify QTLs associatedwith various measures and components of flour and noodlecolour by evaluating flour colour data for 3 Australiandoubled haploid populations and noodle colour data for the
Sunco × Tasman doubled haploid population (DH),respectively (Chalmers et al. 2001, this issue). In doing thisit should be possible to identify potential molecular markersfor flour and noodle colour, which represent a wide range ofAustralian germplasm. Xanthophyll content and PPO levelswill also be examined. Flavonoids, whilst very important inYAN (Mares et al. 1997), were not included in thisinvestigation since biochemical studies on their role incolour and genetic variation in colour are still in progress.
Materials and methods
Plant material
This study was based on 3 doubled haploid populations, Sunco ×Tasman, Cranbrook × Halberd, and CD87 × Katepwa (163, 180, and163 lines, respectively). Sunco, a hard-grained wheat with exceptionalYAN quality, Tasman, a hard-grained wheat with similar phenology butpoor noodle quality, and the Sunco × Tasman doubled haploidpopulation were of particular interest in this investigation. Populationdetails, parental lineage, and trait segregation details are discussed inKammholz et al. (2001, this issue).
Field trials
Flour colour data were collected from trials grown at 3 sites for theCranbrook × Halberd population over 2 years [Roseworthy, SA (1997);Roma, Qld (1997); Stow, SA (1997, 1998)], at one site for 2 years forthe CD87 × Katepwa population [Roma (1998 and 1999)], and at 2 sitesfor 2 years for the Sunco × Tasman population [Roma (1998 and 1999)and Narrabri, NSW (1998 and 1999)]. Details of trials conducted atRoseworthy, Roma, and Stow are described in Kammholtz et al. (2001,this issue). Noodle colour data were collected for the Sunco × Tasmanpopulation grown at Narrabri in 1998 and 1999, where effort was madeto optimise soil fertility, uniformity, plant growth, and harvest and toexclude any confounding effects due to moisture stress or weatherdamage. DH lines were sown as 5-m × twin-row plots in a block20 plots wide × 10 plots deep and with Sunco and Tasman at intervalsof 20 plots.
Plant and grain characteristics
Flowering times were collected from the field trials at Roma. Plantheight (distance from the base of the plant to the tip of the spikes onprimary tillers) and kernel weight (mean weight of replicate samples of20 grains) were measured at the Narrabri site in 1998 and 1999. Plantheight data were confirmed using a GA-seedling test under controlledglasshouse conditions. Twenty seedlings per line were raised in pottingmix and irrigated with 20 µM gibberellic acid. Heights from theseedling base to the tips of fully expanded first and second leaves wererecorded.
Flour protein determination
Flour protein was determined by NIR using an InfraAlyser 260calibrated against Kjeldahl nitrogen and expressed as percent flourweight.
Flour colour evaluation
All samples were conditioned to 15% moisture content prior to milling.Harvested seed (100 g) from each line was milled on a QuadrumatJunior Mill (Narrabri sites), whilst for all other sites 1 kg was milled ona Buhler Mill. Flour samples were scored for colour using aSpectroflash 300 reflectance spectrometer and an 18-mm measuringaperture (Narrabri sites) and a Minolta CR–200 Chroma Meterequipped with a 50 mm measuring head (all other sites). Colour was

Mapping components of flour and noodle colour in Australian wheat 1299
measured in L* a* b* colour space (CIELAB) and expressed as CIE(Commission Internationale I’Eclairage) L* (brightness) and b*(yellowness) values.
Noodle colour evaluation
Noodle colour evaluation was only done on the Sunco × Tasmanpopulation. Colour was measured at 0, 2, 24, and 48 h (Narrabri sites),and 2 and 24 h (Roma sites). For the samples produced at Narrabri in1998 and 1999, small scale WSN (10 g flour + 3.6 mL 2% w/v sodiumchloride solution) and YAN (10 g flour + 3.6 mL 2% w/v sodiumcarbonate solution) sheets were prepared in duplicate. Flour and liquidwere combined in a stainless-steel bowl using a butterfly-shapedmixing paddle driven by a commercially available drill press. Thenoodle dough was then pressed into a block and passed through the rollsof a small domestic pasta machine, progressively reducing the roll gapto finish with a sheet 1.5 mm thick. The sheet was cut to a standardrectangle and stored in a resealable plastic bag between colourmeasurement readings. In addition to the recorded colourmeasurements, changes in L* and b* were calculated by subtractingmeasurements at 2, 24, and 48 h from the initial readings. Mean valuesfrom duplicate noodle sheets were used in all the analyses.
PPO evaluation
PPO evaluation was only done on the Sunco × Tasman population.Grain PPO was determined on 20 individual grains from the Narrabri(2 years) and Roma (1 year) sites, according to the microplate methoddescribed by Bernier and Howes (1994) and activities expressed assimple OD415 nm units. The assay procedure was standardised by usingsamples from a bulk of a low PPO cultivar, Lark, on every assay plate.
Xanthophyll evaluation
Xanthophyll evaluation was only done on the Sunco × Tasmanpopulation. Duplicate flour samples (3 g) were extracted with 15 mLabsolute methanol for 30 min on a gentle rocker table at roomtemperature. Samples of the extracts were centrifuged in a microfuge at14000 rpm then filtered through a 0.45 µm syringe filter prior tomeasurement of absorbance at 436 nm. Xanthophyll content was
expressed simply as OD436 nm. The assay was standardised by includinga sample of a bulk flour, cv. Sunvale, with each batch of lines.
Statistical analysis of data
Transgressive segregation among doubled haploid lines, Sunco, andTasman was tested by the l.s.d. test at P = 0.05. Where the mean traitvalue for a line exceeded that of the nearest parent, it was considered atransgressive segregant. Simple linear regression coefficients andstandard errors were calculated in Excel. Broad sense heritabilityestimates were calculated from ANOVA results using Agrobase.
Genetic maps
The genetic maps used to evaluate phenotypic data are described inChalmers et al. (2001, this issue).
Table 1. Mean values, standard errors (parental lines), and range (doubled haploid lines) for grain, flour, and noodle trait measurementsStandard errors and range in parentheses after the corresponding means. PPO, polyphenol oxidase; WSN, white salted noodle; YAN, yellow
alkaline noodle
Sunco Tasman Sunco × Tasman1998 1999 1998 1999 1998 1999
RomaGrain PPO 0.11 0.34 0.25 (0.095 – 0.605)
NarrabriGrain PPO 0.114 (0.004) 0.209 (0.056) 0.28 (0.018) 0.45 (0.029) 0.20 (0.102 – 0.36) 0.38 (0.19 – 0.73)Flour protein (%) 12.64 (0.13) 12.70 (0.03) 13.80 (0.05) 12.90 (0.12) 12.9 (11.6 – 15.1) 13.5 (11.8 – 15.8)Flour L* 93.2 (0.022) 92.8 (0.05) 93.6 (0.074) 93.3 (0.07) 93.3 (92.3 – 94) 93.0 (92.3 – 93.5)Flour b* 8.9 (0.05) 8.5 (0.06) 8.7 (0.07) 8.4 (0.05) 8.9 (7.2 – 10.9) 8.4 (6.95 – 10.0)Xanthophyll 0.075 (0.003) 0.072 (0.003) 0.085 (0.002) 0.084 (0.003) 0.081 (0.061 – 0.11) 0.081 (0.052 – 0.124)
WSN L* 0 h 87.6 (0.27) 87.4 (0.14) 86.8 (0.29) 87.0 (0.26) 87.0 (84.8 – 88.9) 87.0 (84.5 – 88.7)WSN L* (0–24 h)* 6.61 (0.28) 6.4 (0.22) 9.04 (0.41) 7.6 (0.21) 7.87 (3.42 – 14.1) 7.05 (4.0 – 11.6)YAN L* 0 h 87.3 (0.28) 85.4 (0.20) 86.7 (0.19) 85.4 (0.21) 87.1 (84.44 – 88.78) 85.45 (82.47 – 87.32)YAN L* (0–24 h) 6.52 (0.17) 5.65 (0.17) 12.2 (0.21) 9.52 (0.32) 9.96 (5.56 – 14.1) 8.16 (4.16 – 13.1)
WSN b* 0 h 14.5 (0.37) 13.64 (0.16) 15.6 (0.42) 14.34 (0.22) 15.7 (11.9 – 20.1) 13.9 (11.5 – 16.8)WSN b* (0–24 h) –4.02 (0.57) –3.33 (0.23) –2.34 (0.23) –1.86 (0.18) –3.36 (–6.05 to –1.17) –2.8 (–5.03 to –1.01)YAN b* 0 h 20.95 (0.21) 20.1 (0.21) 20.6 (0.27) 20.2 (0.33) 20.6 (18.2 – 23.8) 19.7 (17.9 – 22.3)YAN b* (0–24 h) –5.55 (0.27) –5.04 (0.13) –1.76 (0.25) –1.55 (0.09) –3.5 (–7.2 to –0.08) –3.42 (–6.12 to –0.3)
Table 2. Broad sense heritability estimates for grain polyphenol oxidase (PPO), flour traits (protein content,
xanthophyll content, L*, and b*), and noodle colour traits (L* 0 h, b* 0 h, L*0–24 h)
YAN, yellow, alkaline noodles; WSN, white, salted noodles
Trait Broad-sense heritability
Grain PPO 0.77Flour protein content 0.47Flour xanthophyll content 0.93Flour L* 0.74Flour b* 0.89WSN L* 0 h 0.77WSN b* 0 h 0.92WSN L*(0–24 h) 0.90YAN L* 0 h 0.76YAN b* 0 h 0.88YAN L*(0–24 h) 0.96

1300 D. J. Mares and A. W. Campbell
70 60 50 40 30 20 10 00.
050.
150.
250.
35
Gra
in P
PO
(O
D41
5 nm
)
50 45 40 35 30 25 20 15 10 5 0
35 30 25 20 15 10 5 0 40 35 30 25 20 15 10 5 0
78
910
Flo
ur b
*X
anth
ophy
ll (O
D44
0 nm
x 1
0)
0.6
0.7
0.9
1.0
1.1
0.8
34
56
78
1011
1213
149
WS
N L
* (0
−24
h)W
SN
L*
0 h
84.5
85.5
86.5
87.5
88.5
50 45 40 35 30 25 20 15 10 5 040 35 30 25 20 15 10 5 0
No. of lines
Flo
ur L
*
9292
.593
93.5
94
50 45 40 35 30 25 20 15 10 5 0−7
−6−5
−4−3
−2−1
0
50 40 30 20 10 0607035 30 25 20 15 10 5 0
50 40 30 20 10 0 45 40 35 30 25 20 15 10 5 0 50 40 30 20 10 060
1718
1920
2122
2324
YAN
b*
0 h
YAN
b*
(0−2
4 h)
WS
N b
* 0
h
YAN
L*
0 h
8485
8687
88
1112
1314
1516
1718
1920
−6−5
−4−3
−2−1
WS
N b
* (0
−24
h)
YAN
L*(
0−24
h)
56
78
910
1112
1314
Fig
. 1.
His
togr
ams
of d
istr
ibut
ions
for
gra
in, f
lour
, and
noo
dle
colo
ur tr
aits
in th
e S
unco
× T
asm
an d
oubl
ed h
aplo
id p
opul
atio
n gr
own
at N
arra
bri,
NS
W, i
n 19
98.

Mapping components of flour and noodle colour in Australian wheat 1301
Genetic analysisThe associations between markers and trait data were tested using asingle-point regression analysis in Map Manager QTb29ppc (Manly1997) based on the likelihood ratio statistic (LRS). Permutation testsusing Map Manager were run for each set of trait data compared withthe marker data for that population to set a level of significance forthat trait. The permutation tests were run 1000 times at a significancelevel of P < 0.001. QTLs identified by a combination of single pointanalyses and permutation tests were further analysed by intervalmapping [using the software Qgene, version 3.04 (Nelson 1997)],which searches for the effects of QTLs using sets of linked markers(Lander and Botstein 1989). A chromosomal display of thesignificant QTL associations after interval analysis was generatedusing Qgene.
Results
Field observations on the Sunco × Tasman population grown at Narrabri
In both 1998 and 1999, the trials were disease-free, uniformin appearance, and produced well-filled grain with highprotein content (Table 1). Broad sense heritability for proteincontent in this population was 0.47 (Table 2). Proteincontents for the parental lines were similar to one anotherand to the means of the doubled haploid population.Variation in protein content was associated with QTLs onchromosomes 1B (LOD 5.07), 2B (LOD 7.09), and 5B(3.75). Small differences in maturity were controlled byQTLs on chromosomes 1D (LOD 4.07) and 7B (LOD 4.54).The population contained 3 distinct classes based on plantheight: tall (35 lines), semi-dwarf (86 lines), and extremedwarf (42 lines). Plant height measured on mature field-
grown plants or on GA-treated seedlings was associated withQTLs on chromosomes 4B (LOD scores ranging from 12.8 for mature plant height to 8.76 for the GA seedling test) and4D (LOD score for mature plant height of 22.66). Meangrain size was significantly different between these classesand decreased as plant height decreased (mean 1000-kernelweights of 42.5, 36.9, and 30.1 g in 1998 and 44.35, 40.73,and 33.7 g in 1999 for the tall, semi-dwarf, and extremedwarf groups, respectively). Grain weight was associatedwith QTLs on chromosomes 2B (LOD 5.42), 4B (LOD9.57), and 4D (LOD 5.68). The group of lines with extremedwarf growth habit also appeared to have a higher proportionof shrivelled or misshapen grains, although no attempt wasmade to quantify this effect.
Colour traits
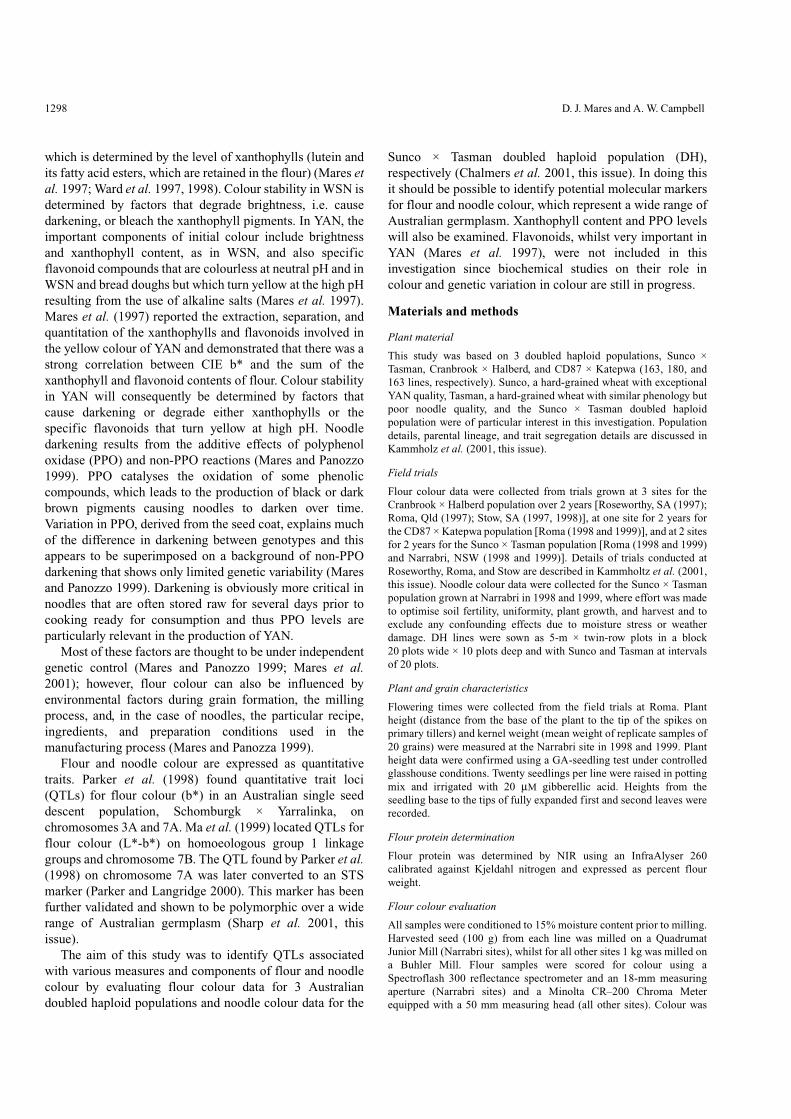
Mean values and ranges for all traits for both years are shownin Table 1 together with mean values and standard errors forSunco and Tasman. All trait distributions were normal exceptdarkening of YAN (L*(0–24h)) and were similar in both years(Fig. 1, data for 1998 only). Significant transgressivesegregation occurred in both directions for all traits exceptgrain PPO. For this trait, there was no transgressive segrega-tion towards lower values. With the exception of grain proteincontent, broad sense heritability estimates for grain, flour, andnoodle colour traits were generally very high (Table 2).
Flour colour
Comparisons of flour L* over the 3 populations revealed nochromosome areas that were significant for all crosses. All
Table 3. LOD scores for flour L* and flour b* for 3 doubled haploid populations grown at 1–3 sites for 1 or 2 years Only chromosomes that had QTLs with LOD scores > 3 are reported. Sites used were Roseworthy, SA (Ros97), Roma, Queensland
(Rom97, Rom98, and Rom99), Stow, SA (Sto97 and Sto98), and Narrabri, NSW (Nar98 and Nar99)
Cranbrook × Halberd CD87 × Katepwa Sunco × TasmanSite: Ros97 Rom97 Sto97 Sto98 Rom98 Rom99 Rom98 Nar98 Nar99
Flour L*1A 4.73 3.511B 3.31 4.55 5.412D 3.88 3.784B 3.97 6.635B 3.97 3.625D 5.43 3.99Unknown 4.03
Flour b*2D 3.55 3.99 5.23 5.173A 3.02 5.463B 3.98 3.81 4.78 3.404B 3.59 3.155B 4.48 3.77 4.085D 3.43 3.35 5.946A 3.797A 3.41 5.89 4.08 3.29 7.56 10.61 12.087B 4.38Unknown 4.43 4.00 4.33 3.75

1302 D. J. Mares and A. W. Campbell
those with LOD scores >3 (after interval analysis) arereported in Table 3. For the Sunco × Tasman population, flourL* was affected by a QTL on 2B, Narrabri sites only, and aQTL on 4B at 2 sites in 1998; however, this QTL was notsignificant in the 1999 samples. Flour L* in 1998 wassignificantly correlated with flour L* in 1999 (r = 0.57) andthe broad sense heritability for this trait was 0.74 (Table 2).A large number of QTLs affecting flour b* were identified,although again there were significant differences betweenpopulations (Table 3). For the CD87 × Katepwa population,4 QTLs on chromosomes 2D, 3A, 6A, and 7B (Fig. 2)accounted for 12%, 17%, 13%, and 10% of the variationrespectively. Cranbrook × Halberd had QTLs for flour b* on3B, 5D, 7A, and an unknown location that were generallyconsistent across sites and years (Table 3, Fig. 3). Finally,Sunco × Tasman had QTLs for flour b* on 3B, 4B, 5B, and7A that were also consistent across sites and years and whichaccounted for 20%, 7%, 12%, and 27% of the variation (Table3, Fig. 4). The same regions of chromosomes 3B and 7A were
significant for both Cranbrook × Halberd and Sunco ×Tasman populations (Figs 3 and 4). In the Sunco × Tasmanpopulation, the 3B QTL was contributed by Sunco, whereasthe 5B and 7A QTLs were contributed by Tasman. Flour b*was highly heritable (Table 2) and showed the greatesttransgressive segregation in both directions, and flour b* datafrom 1998 were strongly correlated with corresponding datafrom 1999 (r = 0.82). In addition, flour b* QTLs onchromosomes 3B and 7A appeared to be additive. Means offlour b* for progeny genotype combinations of the Sunco 3BQTL with the Tasman 7A QTL (mean flour b* = 9.5) weresignificantly different from all other combinations (meanflour b* = 8.5–8.7) and the parents at P < 0.01.
The QTL located on chromosome 4B that was associatedwith both flour L* and flour b* appeared to correspond to aQTL controlling plant height and grain size but had nosignificant effect on protein content (Fig. 5). Similarly, theregression analysis scans for the QTL on chromosome 5B forflour b* appeared to correspond to the scan for a QTL for
2D
Xmwg950
P36/M44-2
P36/M43-1
Xabc 451
Xbcd175Xwmc111
Xwmc025aP44/M54-3
25 cM
LRS = 20.7
3A
Xwmc011P41/M40-1P37/M53-3
P37/M45-11P40/M45-3P40/M45-8Xcdo460
P37/M39-4Xpsr598Xwmc050XksuB8,P44/M61-4,P40/M61-3
Xwmc428
P46/M41-6
Xpsr596b
P39/M50-8
Xcdo482b
P41/M39-3
P41/M51-1
25 cM
LRS = 30.6
25 cM
LRS = 19.2
7B
Xpsr121
P37/M36-6
P40/M61-1P41/M39-5P37/M36-4P38/M45-4P35/M39-6P42/M39-2Xwg686P38/M40-4Xpsr117P36/M41-3
P36/M44-1P41/M38-1P36/M43-6
P46/M40-4P40/M60-9
P42/M50-2
P35/M38-3
P39/M31-3
P41/M35-2P36/M40-8P36/M43-2
P39/M38-5P44/M37-4
P39/M49-7
Xwmc402Xcdo949a
Xpsr129
Xwg232c
XksuE19
XcsBhj1
Xpsr680a
(a) (b) (c)
Fig. 2. QTLs on chromosome 2D, 3A, and 7B associated with flour b* in CD87 × Katepwa. The left part of each section in the figure illustratesthe standard C-banded karyotype for the chromosome. The accompanying genetic map has been aligned to the C-banded karyotype using publishedliterature (Chalmers et al. 2001, this issue), and a scale of genetic distance (cM = centimorgans) is provided. The profile on the right of eachchromosome is the result of a regression analysis scan for QTLs (interval analysis, Map Manager). The location of the marker with the highestlikelihood ratio statistic (LRS) is marked with an arrow in each case. Red regions indicate highly significant (HS, 99.9%, corresponding to LRS>22.5) and the yellow, significant (S, 95%, corresponding to LRS >14.1), associations as determined using permutation tests.

Mapping components of flour and noodle colour in Australian wheat 1303
protein content on 5B (data not shown). There were nosignificant QTLs for any of the colour traits thatcorresponded to the QTLs for height and grain size on 4D.
Noodle colour
Initial brightness (L*0h) of noodle sheets was associated withQTLs on 1D and 2B (YAN) (Table 4), and 1B and 2B (WSN)(Table 5). These QTLs were not significant formeasurements of L* at 2, 24, or 48 h or for any of themeasures of darkening (L*0–2h, L*0–24h, L*0–48h). Ratherthese traits were associated with QTLs on 2A, 2D, and 4Bwith the QTL on 2D, in particular, having a very high LODscore (Tables 4 and 5) and characterised by a substantialincrease in LOD score between 2 and 24 h. The QTL on 2Daccounted for 43% of the variation in YAN L* at 24 h. Therole of the QTL on chromosome 2D in determiningdarkening in alkaline noodles is graphically illustrated inFigs 6 and 7, having no impact on initial brightness (L*0h)but a rapidly increasing effect with time. This QTL appearedto correspond exactly to a QTL associated with grain PPOactivity (Fig. 6). Rates of darkening in WSN and YAN were highly correlated in both years (r = 0.71 and 0.74) and hada high heritability (Table 2). Initial yellowness (b*0h) ofnoodle sheets was associated with QTLs on 2B, 3B, 5B,and 7A (YAN and WSN) (Tables 4 and 5). These QTLs,with the exception of the 5B QTL, were also associatedwith b* measured at 2, 24, and 48 h but not with calculatedchanges in b*. Change in YAN b* (b*0–2h, 0–24h, 0–48h), aswith darkening, were controlled by QTLs on 2A and 2D(Table 4), whereas for WSN there appeared to be noconsistent pattern.
Xanthophyll content
Two significant regions on chromosomes 3B (contributed bySunco) and 7A (contributed by Tasman), respectively, wereidentified as associated with xanthophyll levels (Fig. 4).These QTLs corresponded to 2 of the regions controlling b*in flour and noodle sheets in this population. Xanthophyllcontent was consistent over 2 years (r = 0.72) and had a veryhigh heritability (Table 2). There were no significant QTLsassociated with xanthophyll content on chromosomes 4Band 5B, corresponding to QTLs for flour b*.
PPO
A highly significant region on chromosome 2D wasidentified as associated with variation in PPO levels over 2sites and 2 years (Table 6 and Fig. 8), and accounted for 39%of the variation. LOD scores ranged from 12.02 to 17.68 anddata between sites and years were strongly correlated (rvalues 0.60–0.54). This chromosome region had a strongimpact on noodle brightness at 2, 24, and 48 h (Fig. 6) andall measurements of darkening (L*0–2h, 0–24h, 0–48h), but wasnot associated with flour brightness (L*) or initial noodlebrightness (L*0h). Measurements of grain PPO activity were
7A
P33/M52-2P41/M49-173P31/M60-2P40/M61-4Xabg704aP35/M47-12P32/M51-5P35/M61-3, P41/M51-321P37/M58-2P36/M49-7, P33/M49-4Xabg75bXbcd873a
P40/M49-2
P41/M51-212
P34/M50-4
Xcdo475
Xcdo1395P39/M50-2P39/M50-1Xwmc283P38/M59-66P35/M49-6
P36/M61-156Xwmc083
Xcdo595
Xpsr311aP33/M52-6Xwmc247, Xcdo673, P33/M54-5
Xabg652P34/M50-7P40/M54-5P40/M55-178P33/M55-4P40/M55-3P36/M50-4
Xfba349P37/M64-450P36/M53-172, P40/M54-1
P37/M48-3
P32/M52-333
P40/M51-4P37/M64-255P40/M47-9, Xwmc116
P40/M54-101, Xcdo347P32/M515-5,P36/M61-173,Xgwm344-128,
Xpsr680a,XksuH9c,P36/M49-8P40/M54-179,P33/M49-1P32/M52-182,P36/M48-7P32/M51-3,P38/M59-134P40/M54-6,P40/M60-64
Xpsr121,
P43/M62-2P36/M53-229P37/M50-3
P31/M56-2Xbcd135a
P41/M47-7
Wx-A1
P35/M54-8
P40/M47-8, P33/M49-55P31/M60-4
25 cM
LRS = 18.4
Fig. 3. QTL on chromosome 7A associated with flour b* inCranbrook × Halberd. The colour system for showing the location andsignificance of QTLs is described in Fig. 2. HS (99.9%) correspondsto LRS > 21.5 and S (95%) corresponds to LRS > 13.6. The locationof the marker with the highest likelihood ratio statistics (LRS) ismarked with an arrow.

1304 D. J. Mares and A. W. Campbell
also not correlated with flour brightness or initial noodle(WSN and YAN) brightness (r = 0.051, 0.08, and 0.01,respectively, in 1998), but were strongly correlated withdarkening (L*0–24h) in both WSN and YAN (r = 0.55 and0.735, respectively), and this trait had a high heritability(Table 2). Selection of lines with low and high PPO,respectively, from the 1998 trial resulted in the identificationof doubled haploids with low and high rates of darkening.The performance of these sets of lines was consistent in both1998 and 1999. The 2D QTL was also associated withchanges in YAN b* (b*0–2 h etc.). Grain PPO activity was notcorrelated with yellowness or xanthophyll content; however,when the doubled haploid lines were ranked according tohigh noodle sheet b* at 24 or 48 h, the lines with highest b*invariably also had low PPO and low darkening (data notshown).
Effect of time on the expression of QTLs
LOD scores for QTLs related to L* measurements on YANwere compared at 0, 2, 24, and 48 h. Scores for QTLs on 1D,2B, and 4B were constant or decreased over time, whereasthe LOD scores for QTLs on 2A, and in particular 2D,increased as noodles aged (Fig. 7). Similarly, with YAN b*measurements, LOD scores for QTLs associated with PPOand darkening, 2A and 2D, both increased with time, whilstscores for QTLs associated with the yellow pigment itself,3B and 7A, showed little change (Fig. 9).
Discussion
The overall objective of this study was to find markers forflour and noodle colour, which could be applied to a widerange of Australian germplasm. Specific chromosomeregions that are very important for different components of
PAACTelo3PAACTelo4
P35/M37-6
P36/M41-1Xcdo545
Xbcd135
Wx-A1
Xcdo475b
Xstm271
P36/M35-2
Xwmc083
Xwmc017Xstm764aP35/M66-1
P41/M43-7
P40/M42-4
P36/M374
P42/M69
P37/M58-195
P41/M51-321
P44/M78
P39/M50-209
P32/M52-333
P40/M44-6
Xwmc346
P41/M55-199
P40/M60-64
7A
P32/M52-181
XmurFC3P39/M49-96
P45/M32-4
25 cM
LRS= 41.3
LRS= 36.1
Xabg75
Xcdo583
P40/M44-2
P40/M42-2
Xgwm285
Xpsr902
Xwmc043
P40/M42-3
P32/M37-4
P45/M37-5
P36/M35-1
3B
Xcdo482
P41/M51-237Xbcd451
P41/M39-3
P34/M50-165
P37/M58-141
LRS= 29.4
5B
Xpsr167
Xgwm067
Xbcd508P41/M41-5P35/M37-7
Xgwm271b
Xwmc376
Xgwm371
Xstm652XsunG5B
P33/M76-1
Xpsr911gwm639BP36/M40-1P36/M40-2
Xgwm499Xstm286P41/M48-178
P32/M48-234P46/M37-3
LRS= 15.7
LRS= 24.5
25 cM25 cM
flour b
*
xanth
ophyll
flour b
*
xanth
ophyll
flour b
*
xanth
ophyll
Fig. 4. QTLs on chromosome 3B, 5B, and 7A associated with flour b* and with xanthophyll content in Sunco × Tasman. The colour system forshowing the location and significance of QTLs is described in Fig. 2. HS corresponds to LRS >14.1 and >24.4 for flour b* and xanthophyll contentQTLs, respectively, whilst S corresponds to LRS >9.5 and >13.7 respectively. The location of the marker with the highest likelihood ratio statistic(LRS) is marked with an arrow in each case.

Mapping components of flour and noodle colour in Australian wheat 1305
flour and noodle colour in Australian wheat were identifiedand support biochemical studies that suggest that colour is aproduct of a number of independent components andinteractions between these components.
Colour of flour and noodles is measured by visual orinstrumental analysis of the light reflected from the surfaceof the material. In addition to being affected by componentsthat absorb light in specific regions of the visible spectrum,the amount of reflected light is affected by the physicalnature of the flour or noodle, in particular the particle sizedistribution. This latter characteristic is determined duringmilling and will be influenced by factors such as grainprotein content, grain hardness, grain size, andenvironmental factors. QTLs associated with plant heightalso affected grain size, and as anticipated, these effects werereflected in flour colour measurements. Grain proteincontent in the Sunco × Tasman population also affected flourcolour and initial noodle colour.
The QTL located on chromosome 7A, which waspreviously identified by Parker et al. (1998) as being withassociated flour colour, has been confirmed in this study tobe an important QTL for the b* component of flour andnoodle colour. Both Cranbrook × Halberd and Sunco ×Tasman populations had significant QTLs on the long arm ofchromosome 7A. Interestingly, however, the markeridentified in the study by Parker et al. (1998) waspolymorphic in Cranbrook × Halberd but not Sunco ×Tasman. The RFLP marker Xcdo347, identified as importantfor flour colour by Parker et al. (1998), maps to the long armof chromosome 7A in Cranbrook × Halberd and is associatedwith b* flour colour (LOD score 3.28). There are markerscloser to this trait on the Cranbrook × Halberd map (P43/M62-2, LOD score 4.17), which is not unexpected given the
4B
P34/M47-5P32/M59-10P40/M60-126P32/M53-3
P31/M57-6
P44/M68-160P40/M55-9
P33/M54-4P38/M54-4Xcdo669b
Xwmc048cXgmw495
XksuC2
Xgwm006Xwmc047P41/M51-299P40/M54-2
Cranbrook × Halberd
Sunco × Tasman
XcsME1
25 cM
height
grai
n siz
e
%pro
tein
flour L
*
flour b
*
Xwmc047P36/M40-3
Xgwm192bXbcd15, P41/M51-222
Xwg180a
Xgwm113
Xwmc048c
Xgwm149
csME1
Xgwm495
Table 4. LOD scores for YAN L* (0, 2, 24, 48 h) and YAN b* (0, 2, 24, 48 h), and changes in YAN L* and b* over 2, 24, and 48 h
All data are for the Sunco × Tasman doubled haploid population grown at Narrabri, NSW, in 1998 and 1999. Only chromosomes that had QTLs with LOD scores >3 are reported.
Time: 0 h 2 h 24 h 48 h 0–2 h 0–24 h 0–48 h1998 1999 1998 1999 1998 1999 1998 1999 1998 1999 1998 1999 1998 1999
YAN L*1D 3.66 4.972A 4.13 7.39 6.41 6.30 5.86 5.89 8.65 7.04 8.20 6.09 6.922B 7.342D 5.58 3.33 18.18 16.42 18.68 17.28 9.81 9.02 21.28 17.28 19.47 18.174B 3.86 3.67 4.04 3.50 3.53 3.69
YAN b*2A 6.01 5.01 6.16 7.852B 5.33 5.95 3.732D 10.76 6.10 5.87 5.58 7.63 14.423B 3.96 3.12 4.16 3.51 3.135B 4.74 3.12 3.307A 6.85 7.79 9.33 9.15 6.18 7.67 5.86 6.11
Fig. 5. QTL on chromosome 4B associated with plant height inSunco × Tasman. The same region of chromosome 4B containedhighly significant QTLs for grain size and flour L*, a significant QTLfor flour b*, but no significant association with protein content. Themap of chromosome 4B from Cranbrook × Halberd, which containsmore detail, is included at the left side of the figure for comparison.The colour system for showing the location and significance of QTLsis described in Fig. 2. LRS values corresponding to HS (99.9%) and S(95%) are 19.5 and 13.5 (height), 22.6 and 11.0 (grain size), 16.9 and11.3 (percent protein), 14.1 and 9.5 (flour b*), and 18.0 and 10.2 (flourL*), whilst the highest LRS values are height (51.4), grain size (35.3),percent protein (4.7), flour b* (10.7), and flour L* (24.5).

1306 D. J. Mares and A. W. Campbell
Cranbrook × Halberd map has 900 markers as opposed to themap produced by Parker et al. (1998), Schomburgk ×Yarralinka, which had 147 markers. Given the position of theQTL identified in the Cranbrook × Halberd (originatingfrom the Halberd parent) population compared with the QTLlocated on 7A in the Yarralinka × Schomburgk population(originating from the Schomburgk parent), it is probable thatthis is the same QTL. However, the LOD score of 4.17 in theCranbrook × Halberd population is considerably lower thanthat of 10.77 in the Yarralinka × Schomburgk population(Parker et al. 1998). This could be due to a number of factors,
2D
Xwmc112
Xwmc190Xwmc018
Xabc451b
P41/M32-6
P41/M32-1P37/M39-g
Xbcd266bP37/M39-f
P32/M37-6
P41/M51-273
P35/M76-3P32/M48-212
24 48 PPO
Time (h)
25 c
M
0 2
Fig. 6. QTL on chromosome 2D associated with grain PPO and itsimpact on noodle brightness at 0, 2, 24, and 48 h in Sunco × Tasman.The colour system for showing the location and significance of QTLsis described in Fig. 2. LRS values corresponding to HS (99.9%) and S(95%) are 19.7 and 11.0 (YAN L* 0 h), 20.8 and 11.6 (YAN L* 2 h),16.2 and 10.2 (YAN L* 24 h), 18.5 and 11.1 (YAN L* 48 h), and 18.8and 11.7 (PPO), whilst the highest LRS values within the QTLs areYAN L* 0 h (2.2), YAN L* 2 h (25.0), YAN L* 24 h (75.1), YAN L*48 h (77.9), and PPO (71.2).
Table 5. LOD scores for WSN L* (0, 2, 24, 48 h) and WSN b* (0, 2, 24, 48 h) and changes in WSN L* and b* over 2, 24, and 48 h
All data are for the Sunco × Tasman doubled haploid population grown at Narrabri, NSW, in 1998 and 1999. Only chromosomes that had QTLs with LOD scores >3 are reported
Time: 0 h 2 h 24 h 48 h 0–2 h 0–24 h 0–48 h1998 1999 1998 1999 1998 1999 1998 1999 1998 1999 1998 1999 1998 1999
WSN L*1B 4.802A 3.412B 4.582D 13.06 16.90 13.90 24.57 15.72 19.27 15.41 26.894B 3.45 3.47 3.50 3.24 3.24 3.51 3.25
WSN b*1B 3.58 3.18 3.99 5.032B 4.33 6.18 3.892D 5.153B 3.07 4.08 3.76 3.49 3.70 3.193D 3.164B 6.18 5.87 3.305B 4.54 4.09 4.34 3.366B 5.057A 7.90 10.73 7.62 6.46 4.75
20
18
16
14
12
10
8
6
4
2
0
LOD
sco
re
0 h 2 h 24 h 48 h
Chromosome1D 2A 2B 2D 4B
Fig. 7. The effect of time on the expression of QTLs related toYAN L* measurements.

Mapping components of flour and noodle colour in Australian wheat 1307
such as the differences in backgrounds in which the QTLsare expressed. In the study by Parker et al. 1998, very littletransgressive segregation was observed and all of theincreased effects on flour colour originated from theSchomburgk parents, whereas in the Cranbrook × Halberdcross, both parents contributed to increased effects on flourcolour and transgressive segregation occurred.
The region of chromosome 7A identified as important forb* flour colour in the Sunco × Tasman population alsoappears to be the same region as that seen in the Cranbrook× Halberd cross. However, neither the original RFLP foundto be associated with this region in the Yarralinka ×
Schomburgk population, nor the STS marker (Parker et al.1998; Parker and Langridge 2000) are polymorphic in theSunco × Tasman cross. Further work on this marker (Sharpet al. 2001, this issue) has resulted in the development of amore robust and simple PCR test that is polymorphic in theSunco × Tasman population and this marker has the highestLRS for b* in this population (Fig. 4). There is no commonparent in the pedigree of the 3 cultivars with the chromosome7A-associated colour QTL, Halberd and Tasman (this study)and Schomburgk (Parker et al. 1998)). However,Schomburgk and Tasman have common parentage throughWW15 (from CIMMYT, Mexico) and Schomburgk andHalberd have common parentage through Dirk (a line fromRoseworthy, South Australia). The significance of thischromosome region in all 3 populations indicates that themarker derived from it will have wide use in Australiangermplasm. No QTLs for flour b* were identified onchromosome 7A in the CD87 × Katepwa population;however, a QTL was identified on a similar region ofchromosome 7B.
Other chromosome regions were also identified asimportant for each of the crosses for both L* and b*(summarised in Table 3). Most of these regions wereconsistent over different sites and different years, althoughnot across the different crosses. Chromosome 3A wasimportant in the CD87 × Katepwa cross and this was alsoshown to be important in the Yarralinka × Schomburgk cross(Parker et al. 1998). The position of the QTLs relative tomarkers on the Cranbrook × Halberd map of chromosome3A that were also polymorphic in the CD87 × Katepwapopulation (Xwmc050 and Xwmc428) or the Schomburgk ×Yarralinka population (Xbcd828) (Parker et al. 1998)indicated that the QTL was the same in both thesepopulations. Chromosome 3B in Sunco × Tasman was shownto be important in all sites over both years (Queensland and
Table 6. LOD scores for grain polyphenol oxidase (PPO) in the Sunco × Tasman doubled haploid population grown at Roma,
Qld, in 1997 (Rom97), and at Narrabri, NSW, in 1998 and 1999 (Nar98 and Nar99)
Only chromosomes that had QTLs with LOD scores >3 are reported
Site Rom97 Nar98 Nar99
2A 4.012D 12.02 17.68 15.94
25 c
M
2D
Xwmc112
Xwmc190Xwmc018
Xabc451b
P41/M32-6
P41/M32-1P37/M39-g
Xbcd266bP37/M39-f
P32/M37-6
P41/M51-273
P35/M76-3P32/M48-212
Likelihood ratio statistic
0 20 40 60 80
significant level
highly significant level
Fig. 8. QTLs on chromosome 2D associated with grain PPO activitytogether with the Map Manager output showing the LRS profileacross the relevant region of the chromosome. Vertical black lines onthe LRS profile represent the LRS values indicative of significant andhighly significant associations respectively. The colour system forshowing the location and significance of QTLs is described in Fig. 2.LRS values corresponding to HS (99.9%) and S (95%) are 18.8 and11.7, respectively, whilst the LRS at the peak is 71.2.
12
10
8
6
4
2
0
LOD
sco
re
0 h 2 h 24 h 48 h
Chromosome
2A 2B 2D 3B 5B 7A
Fig. 9. The effect of time on the expression of QTLs related to YANb* measurements.

1308 D. J. Mares and A. W. Campbell
Narrabri in northern NSW), and this region was alsoidentified as significant in the Cranbrook × Halberdpopulation in Roma 1997, the only Queensland site at whichthis population was trailed. This may indicate that this QTLis only important for the warmer, summer-dominant rainfallenvironments of Queensland and northern NSW. The QTLson 3A (CD87 × Katepwa, Schomburgk × Yarralinka) and 3B(Cranbrook × Halberd, Sunco × Tasman) appeared to map tohomoeologous regions of the respective chromosomes.
Xanthophyll content measurements of the Sunco ×Tasman population indicated that QTLs were present onchromosomes 3B and 7A. The QTLs identified were in thesame region as those identified for flour b* and noodle b*0hin Sunco × Tasman, discussed above. The increasedxanthophyll effect also came from the same parents as theincreased b* effect (3B, Sunco; 7A, Tasman). This wouldindicate that it is likely to be the same QTLs causing eachincreased effect and there may be xanthophyll genes presenton chromosomes 3B and 7A, and by extrapolation from theflour b* analysis for CD87 × Katepwa 3A and 7B, or genesaffected by xanthophyll content. In support of our findings,a study by Alvarez et al. (1998) showed that carotenoidpigments could be assigned to chromosome 7Hch intritordeum, which in comparative genetic maps showsextensive homologies to wheat chromosomes 7A, 7B, and7D (Hohmann et al. 1995). Within the Sunco × Tasmandoubled haploid population there was substantialtransgressive segregation for xanthophyll content, flour b*,and noodle sheet b*. When the range of genotypes present inthe progeny for the 2 QTLs associated with b* andxanthophyll content (3B-Sunco and 7A-Tasman) werecompared, those progeny with both QTLs had a significantlyhigher mean b* than either parent, and those progeny withone or no QTLs. The presence of either QTL results in amedium level of yellowness. Potentially, further variationcould be introduced by using the genes on 3A and 7B. Thishas significant implications for breeders and the wheatindustry since different products require or tolerate differentlevels of yellowness. Sunco and Tasman flours appear whiteto creamy to the naked eye and are acceptable for productionof a wide range of breads and noodles. Very low b* isunacceptable for WSN in some markets, whereas high b*,whilst advantageous for YAN, could preclude the use ofcultivars from bread and other end-product markets. QTLson 4B and 5B associated with flour b*, but not xanthophyllcontent, were attributed to the effects of height andsubsequently grain size (4B) and protein content (5B)respectively. Presumably these loci influence flour colour viaeffects on the milling process, flour granularity, and the lightabsorption/reflection characteristics of flour samples.Interestingly, whilst QTLs on 4B and 4D, that correspondedto the semi-dwarfing genes Rht1 and Rht2, had a markedinfluence on plant height and grain size, only the 4B QTLhad effects on flour and noodle colour (L* and b*).
Sunco is noted for its yellow colour development, yellowcolour stability, and brightness of colour (Kammholz et al.2001, this issue). For this reason, Sunco is considered to bethe YAN benchmark throughout Australia. Results from thisstudy highlight a large segregation for PPO levels in theSunco × Tasman population and indicate that the PPOgene(s) was probably located on chromosome 2D of Tasman.LOD scores for PPO levels ranged from 11 to 17 onchromosome 2D. Fine mapping of this region in future wouldaid in narrowing the range of the region and show whetherthis effect is due to the action of one or multiple QTLs. Theobserved distribution of PPO activity in a number of wheatpopulations is difficult to reconcile with control by a singlegene (D. J. Mares, unpublished data). It is possible thereforethat multiple QTLs present on the long arm of chromosome2D and/or QTLs on other chromosome regions (e.g. 1B and2A), which were significant in some environments (Table 6),are important in determining PPO activity. The 2Dchromosome region was also shown to be important inconveying colour stability in both YAN and WAN in L* andb* measurements. The QTL was most significant at the 24and 48 h measurements (LOD scores ranged between 6.16and 22.94), peaking at 24 h. This is consistent with theobserved time course of browning of noodles. Black orbrown pigments resulting from PPO activity are responsiblefor part of the darkening that occurs over time in raw WSNand YAN (Mares and Panozzo 2001). Because thesepigments absorb light throughout the visible spectrum theywould be expected to decrease L*, and mask perception ofpigments such as xanthophylls that absorb in a specificregion of the spectrum. Mares et al. (2001) demonstratedthat addition of black dye to noodle sheets resulted in areduction in both L* and b*. Changes in b* during darkeningcould not be associated with change in xanthophyll orflavonoid compounds. Mares and Panozza (1999) concludedthat there is another factor that contributes to noodledarkening, which must be attributed to some othermechanism, possibly another oxidase. Since there is littlegenetic variation for the non-PPO darkening it was notanticipated that this investigation would identify QTLs forthis component of colour stability. There were otherchromosomes also shown to be important in noodle colourstability: 1D, 2A, and 4B. The expression of these QTLs waseither consistent over time (therefore probably notcontributing to darkening), e.g. the b* QTL located onchromosome 7A, or differed over time, e.g. the L* and b*QTLs identified on chromosomes 2A and 2D.
Time-related mapping, such as shown here, demonstratesthat in order to understand many important traits it may benecessary to know not only their effects at a given time orstage, but also their ‘expression dynamics’. This also hasimportant implications for detection of QTLs, in that asheritability varies with trait development, we can assume thatfor most QTLs there is a time or time interval at which the

Mapping components of flour and noodle colour in Australian wheat 1309
http://www.publish.csiro.au/journals/ajar
QTL has maximum heritability and therefore is most likelyto be detected (Wu et al. 1999). Measurement of noodlebrightness and yellowness as soon as practicable afterpreparation provided information that was obscured by PPOeffects at 2, 24, and 48 h.
This study has shown that there are a number ofchromosome regions associated with flour and noodle colourin Australian germplasm. Many of these chromosomeregions are significant over multiple sites and multiple years,although environmental factors can determine their level ofexpression. Other QTLs are only present in someenvironments. For the purposes of selecting markers for usein Australian wheat breeding programs, it would be mostefficient to select markers that were significant over a widerange of germplasm and environmental conditions. Giventhat for most traits more than one QTL is expressed, it maybe important to select only one QTL for some traits, such asb* flour colour, in that if two QTLs were selected, theresulting progeny would be too yellow. For other traits, suchas colour stability, it may be desirable to select for multipleQTLs, ensuring maximum stability.
The identification of markers for QTLs controlling flourand noodle colour in Australian wheat is a first step in usingthese markers effectively in breeding programs. A number ofthe markers identified in this study will be converted tosequence characterised amplified region (SCAR) markersand strictly validated over a wide range of Australiangermplasm. The more robust markers will then be able to beimplemented in breeding programs throughout Australia toensure that stringent colour requirements are met throughearly screening of breeding lines.
Acknowledgments
This work was supported by research grants provided by theGrains Research and Development Corporation of Australia.The authors are indebted to Dr Rudi Appels, CSIRO, PlantIndustry, Canberra, ACT, for his assistance and support, andto Professor Andrew Barr, Department of Plant Science,University of Adelaide, SA, for calculation of broad senseheritabilities.
References
Alvarez JB, Martin LM, Martin A (1998) Chromosomal localization ofgenes for carotenoid pigments using addition lines of Hordeumchilense in wheat. Plant Breeding 117, 287–289.
Bernier A-M, Howes NK (1994) Quantification of variation intyrosinase activity among durum and common wheat cultivars.Journal of Cereal Science 19, 157–159.
Chalmers KJ, Cambell AW, Kretschmer J, Karakousis A, Henschke PH,Pierens S, Harker N, Pallotta M, Cornish GB, Shariflou MR,Rampling LR, McLauchlan A, Daggard G, Sharp PJ, Holton TA,Sutherland MW, Appels R, Langridge P (2001) Construction ofthree linkage maps in bread wheat, Triticum aestivum. AustralianJournal of Agricultural Research 52, 1089–1119.
Hohmann U, Graner A, Endo TR, Gill BS, Herrmann RG (1995)Comparison of wheat physical maps with barley linkage maps forgroup 7 chromsomes. Theoretical and Applied Genetics 91, 618–626.
Kammholz SJ, Campbell, AW, Sutherland MW, Holamby GJ, Martin PJ,Eastwood RF, Barclay I, Wilson RE, Brennan PS, Sheppard JA(2001), Establishment and characterisation of wheat geneticmapping populations. Australian Journal of Agricultural Research52, 1079–1088.
Labuschagne MT, Coetzee MCB, Van-Deventer CS (1996) Generalcombining ability of six genotypes of spring wheat (Triticumaestivum) for biscuit-making quality characteristics. Plant Breeding115, 279–281.
Lander ES, Botstein D (1989) Mapping Mendelian factors underlyingquantitative traits using RFLP linkage maps. Genetics 121, 185–199.
Ma W, Daggard G, Sutherland M, Brennan P (1999) Molecular markersfor quality attributes in wheat. In ‘Proceedings of the NinthAssembly Wheat Breeding Society of Australia’. (Eds PWilliamson, P Banks, I Haak, J Thompson, A Campbell) pp. 115–117.
Manly KF (1997) Map Manager QT, software for mapping quantitativetrait loci. Abstracts of the 11th International Mouse GenomeConference, St Petersburg, FL. p. 75
Mares DJ, Panozzo JF (1999) Impact of selection for low grainpolyphenol oxidase activity on darkening in Asian noodles. In‘Proceedings of the Ninth Assembly Wheat Breeding Society ofAustralia’. (Eds P Williamson, P Banks, I Haak, J Thompson, ACampbell) pp. 32–33.
Mares DJ, Wang Y, Baydoun M (2001) Colour of Asian noodles:stability of xanthophylls and flavonoids and interactions withdarkening. In ‘Proceedings of the 11th ICC Cereal and BreadCongress and the 50th Australian Cereal Chemistry Conference’.(Eds M Wootton, IL Batey, CW Wrigley) pp. 320–322.
Mares DJ, Wang Y, Cassidy CA (1997) Separation, identification andtissue location of compounds responsible for the yellow colour ofalkaline noodles. In ‘Proceedings of the 47th Cereal ChemistryConference, Perth, Australia’. (Eds AW Tarr, AS Ross, CWWrigley) pp. 114–117.
Nelson JC (1997) QGENE: software for marker-based genomicanalysis and breeding. Molecular Breeding 3, 239–245.
Parker GD, Chalmers KJ, Rathgen AJ, Langridge P (1998) Mappingloci associated with flour colour in wheat (Triticum aestivum L.).Theoretical and Applied Genetics 97, 238–245.
Parker GD, Langridge P (2000) Development of a STS marker linked toa major locus controlling flour colour in wheat. Molecular Breeding6, 169–174.
Ward S, Millikan M, Wootton M. (1997) Quantification of carotenoidcompounds in Australian wheats. In ‘Proceedings of the 47thAustralian Cereal Chemistry Conference’. (Eds AW Tarr, AS Ross,CW Wrigley) pp. 294–298.
Ward S, Millikan M, Wootton M (1998) Assessment of the relationshipbetween flour colour and the flavonoid and carotenoid compoundsin wheat flour. In ‘Proceedings of the 48th Australian CerealChemistry Conference’. (Eds L O’Brien, AB Blakeney, AS Ross,CW Wrigley) pp. 175–179.
Wu W-R, Li W-M, Tang D-Z, Lu H-R, Worland AJ (1999) Time-relatedmapping of quantitative trait loci underlying tiller number in rice.Genetics 151, 297–303.
Manuscript received 19 February 2001, accepted 19 July 2001