an availability evaluation method for desalination process
TRANSCRIPT

1
An Availability Evaluation Method for Desalination Process with
Three-States Equipment under the Specific Repair Queuing
Policy
Mani Sharifi a, *, Fahimeh Yargholi b, Mohammad Reza Shahriari c
a Faculty of Mechanical & Industrial Engineering, Ryerson University, Toronto, ON, Canada,
b Faculty of Industrial & Mechanical Engineering, Qazvin Branch, Islamic Azad University, Qazvin, Iran, c Faculty of Management & Accounting, South Tehran Branch, Islamic Azad University, Tehran, Iran.
* Corresponding author: [email protected]
Abstract: Oil waste, is one of the most important pollutants in the oil and gas industry. Since the wells' oil has
significant saltwater, the effluent amount increases with increasing oil reservoir extraction. Separating the
saltwater from the extracted oil before starting the refinery process plays an essential role in reducing the oil
costs as well as the useful transfer capacity. This paper presents a new Chapman-Kolmogorov Equation-based
(CKEB) method to evaluate a desalination system's availability with three-state equipment and weighted-k-
out-of-n configuration. In this system, the equipment is repairable, and each repair facility can repair all
equipment types of different sub-systems (pump stations). We consider all failures and repairs to have a
constant rate (with Exponential distribution) and use the Chapman-Kolmogorov Equations to drive the
system’s availability. Then we validate the presented method using a simulation technique. Finally, the
elapsed time of both solving techniques is compared. The results show the superiority of the CKEB technique
in terms of computational time. Compared with the simulation technique, the computational time ratio for the
CKEB method is between 0.0002% to 0.0058% for the small-size problems, between 0.05% to 0.94% for the
medium-size problems, and between 1.31% to 5.39% for the large-size problems.
Keywords: Desalination system, Availability, Multi-state equipment, Repairable equipment, Chapman-
Kolmogorov Equations, Monte-Carlo Simulation.
1- Introduction
The oil drainage that comes out of the reservoir during oil extraction is one of the most
important pollutants in the oil and gas industry. With the increase in extraction of oil
reservoirs, the effluent amount is also increased. Over time, by reducing the amount of oil
in the well and replacing it with saltwater, saltwater's value increases, which requires
separation of the saltwater from the oil. For this purpose, the wells' extracted oil is sent to
desalination units for separation of saline waste after decontamination in the units. Suppose
the case that waste materials do not separate from the oil before delivering to the refineries.
So, the consequence is corrosion of the pipelines and reduce transfer debit. Finally, it causes
disruptions during distillation and corrosion in steam boilers and other devices. The
presence of these waste materials in the exported oil reduces the cost of oil and reduces
transportation's useful capacity. So, the reliability (availability) of the separation systems of
this wastewater from oil and injection is the priority of oil companies.
Sewage sludge contains a significant value of heavy metals and various salts, and these
materials in nature are one of the major environmental pollutants. Since the sewage sludge
will be injected into the wells, it is too essential to separate the environmental pollutant
before injection. The presence of these pollutant materials in the sewage sludge is a
consequence of incomplete separation in the desalination units. So, there is essential for

2
wastewater treatment systems to separate oil and particulate matter from the wastewater
and prepare it for injection. The desalination plants require a variety of equipment, and
many of them are three-state equipment. For example, due to the number of healthy blades,
the water pumps have three functional states: working, failed, and low-performance
working status.
This paper uses the Chapman-Kolmogorov Equation to calculate a desalination system's
availability with three-state equipment. The system's equipment is considered repairable,
and all repair facilities in this system can repair all the equipment of different plant sections.
Initially, the system’s states based on the number of sub-systems (number of equipment),
the number of redundant equipment, the number of under-repair equipment in all sub-
systems, and the number of repair facilities are determined. Then, the total system
availability using the Chapman-Kolmogorov Equation is calculated. To validate the
proposed method, the system availability is calculated using a simulation technique.
Finally, given the number of sub-systems (equipment), the number of redundant
components, and the system's mission time, we propose the condition that the Chapman-
Kolmogorov equation-based (CKEB) method has less computational time compared with the
simulation method.
This paper consists of seven parts. The second section is the literature review. The third
section deals with the system’s definitions. In Section Four, the problem definitions are
presented. Section five deals with solving methods. Some numerical examples are presented
in Section six, and the last section is the conclusion and further studies.
2- Literature review
In this paper, we present a new availability evaluation for a desalination system with
three-state components. So, the literature review is presented in three directions. The first
direction is related to the multi-state systems (MSS), and discuss the general reliability
(availability) evaluation of different MSS systems’ configuration. The third direction is
related to systems’ reliability (availability) evaluation for the redundancy allocation
problem (RAP). The last direction regards to reliability evaluation of desalination systems.
In terms of MSS and according to classical reliability models, most of the systems, as well
as their components, have two states as workings and failed states. A particular system
component can operate at any level of functionality from 0% to 100% with a given
probability. These systems are called the MSS. Since increasing the number of the
components in an MSS, the system states increase rapidly, and the complexity of the
calculations rises astonishingly; calculating the reliability of the MSS using basic reliability
methods, if not impossible, is too complicated. In order to reduce the complexity of
calculating the reliability of the MSS, Ushakov [1] introduced the Universal Generating
Function (UGF) method. The UGF is a well known convenient method to calculate MSSs’
reliability with series, parallel, and series-parallel configurations. However, by increasing
the system’s components, this UGF’s computational time increases remarkably.
Wu and Chen [2] proposed the recursive algorithm to estimate the weighted k-out-of-n
system's reliability. This technique is another well-known technique for calculating the
reliability of the MMSs. Higashiyama [3] proposed instruction to evaluate the reliability of
the binary state weighted k-out-of-n system in a shorter time than the proposed recursive

3
method. Sharifi, Ganjian, and Ghajar [4] worked on a network consisting of two elements
with incremental and constant failure rates in real-time situations. Later, they studied the
real-time reliability of a k-out-of-n load-sharing system with 𝑛 identical components [5].
Lisnianski and Ding [6] studied the redundancy of repairable MSS using a combinatorial
method of statistical processes and UGF analysis. Sharifi, Memariani, and Noorossana [7]
proposed an algorithm for evaluating a k-out-of-n systems' real-time reliability with
identical components with fuzzy failure rates. Levitin, Xing, & Dai [8] considered the
optimal standby element sequencing problem for k-out-of-n: G heterogeneous cold-standby
systems. They optimized the expected system mission cost by selecting the initial sequence
of the system’s components. Pourkarim, Sharifi, Niaki, et al. [9] proposed a new practical
approach for estimating the un-repairable three-state systems' reliability. They first
presented a proper definition of system states and then provided differential equations
using the Markov process and Chapman-Kolmogorov equation. By solving these
differential equations, which calculate the states’ probabilities and system reliability, the
processing time reduced significantly compared with other available techniques. Lu, Wu,
Liu, et al. [10] examined the reliability of the large MSS with repairable components. They
reported that some phased-mission systems (PMS) might contain a large number of steps
and repairable components in many engineering applications. Levitin, Xing, Dai [11]
optimized a 1-out-of-N: G cold standby systems consist of non-repairable components with
different productivity or load levels. They first suggested analyzing the system’s reliability
and expected mission cost, then formulated and solved the completed work-dependent
components load's optimal dynamic load distribution. Sharifi and Taghipour [12]
considered a k-out-of-n system with non-identical components to optimize the system’s
inspection interval. In their model, the system was an MSS based on the number of working
components during each inspection interval.
Many real-case problems like the RAP deal with calculating the system's reliability.
Different system configurations have been considered in RAP, and the systems’ reliability
is calculated before optimizing the systems’ redundancy. The general mathematical model
for the RAP was presented by Fyffe, Hines, Lee [13]. The presented model aims to maximize
the system’s reliability under the system’s cost and weight constraints.
After that, many researchers optimized the RAP considering different MSS’s
configurations. For example, Ramirez-Marquez and Coit [14] considered a series-parallel
MSS with capacitated binary components which could provide different MSS performance
levels, and calculated the system’s reliability using UGF. Tian and Zou [15] optimized a
multi-objective RAP for general series-parallel MSS. Later they presented an optimization
model for a series-parallel MSS, which jointly determined the optimal component state
distribution and optimal redundancy for each stage. The relationship between component
state distribution and the component cost was discussed based on an assumption on the
components' treatment [16]. Ouzineb, Nourelfath, , Gendreau [17] worked on a RAP with
series-parallel MSS and used an efficient Tabu Search (TS) algorithm to solve the presented
problem. They considered that the system’s performance levels have a continuous range
between perfect functioning and complete failure. Mousavi, Alikar, Niaki, et al. [18]
investigated a bi-objective RAP for a series-parallel MSS with non-repairable components.
They considered that both the performance rates and the availabilities of components are

4
considered fuzzy due to the uncertainties. They used a fuzzy UGF to evaluate the
availability of their considered system.
Wang, Xiong, Xie [19] presented a RAP for cold-standby systems with degrading
components and approximated the models' objective function. They used Genetic
Algorithm to solve the presented RAP. Lai and Yeh [20] proposed a swarm-based approach
called two-stage simplified swarm optimization to solve a RAP for a bridge MSS. Shahriari,
Sharifi, and Naserkhaki [21] modeled the system's reliability consisted of a time-dependent
continuous performance rate MSS. They considered the system’s components might have a
continuous performance rate between zero and their maximum performance rate. George-
Williams and Patelli [22] evaluated the MSS’s reliability with a flow simulation approach
and hybrid events. They reported that the system's complexity and multi-state structural
features make it challenging to evaluate these systems' reliability and availability. Despite
the emergence of diverse techniques for analyzing complex MSS, but simulation seems to
be the only proper and doable approach for real systems. Attar, Raissi, and Khalili-
Damghani [23] studied the optimization method approach based on simulation for RAP and
the availability of the repairable MSS with any statistical distribution.
Some other studies on RAP considering MSS are presented in Table 1 (between 2018-
2021).
Insert Table 1 here
In terms of the desalination system’s reliability (availability) evaluation, El-Naser [39]
presented a method that incorporated equipment reliability considerations into the optimal
design of cogeneration systems for power and desalination. Hosseini et al. [40] studied the
effects of equipment’s reliability on analyzing the thermo-economic of combined power and
multi-stage-flash water desalination plant using the Markov process. They expanded their
method by considering a multi-objective optimization model and design a combined gas
turbine and multi-stage flash desalination plant [41]. Zhou, Chang, and Fane [42] addressed
three essential reliability aspects that drive uncertainty in the life cycle assessment of the
desalination plants, including the incompleteness of the system boundary, the
unrepresentativeness of the database, and the omission of uncertainty analysis. Ailliot,
Boutigny, Koutroulis, et al. [43] used the stochastic (Markov-switching auto-regressive
model) weather generators for the optimal design and reliability evaluation of hybrid
Photovoltaic/Wind-Generator systems providing energy to desalination plants. Wang,
Asefa, Wanakule, et al. [44] presented an application of decision-support tools to
incorporate uncertainties, seasonal demand forecasts, and system operational constraints of
the desalination plants to assist decision-makers in designing more reliable systems using a
hidden Markov chain. In all these studies, the effect of considering the system’s reliability
on the desalination process has been investigated. In this paper, we calculate the system’s
availability for a system consist of three-state repairable components using CKEB methods.
For this reason, we used the procedure which was presented by Pourkarim, Sharifi, Niaki,
et al. [9].
A common assumption for simplifying the systems with several sub-systems is that
every repair facility may only work on one sub-system's components. This assumption
reduces the number of system’s states dramatically. However, in real-case problems, the

5
repair facilities can operate and repair all equipment of different sections (sub-systems) of a
plant. This assumption has been violated in this study, and an assumption has been added
to the model that allows every repair facility to work on all sub-systems’ components. We
use the Chapman-Kolmogorov Equation and simulation method to evaluate the system
availability. Using the Chapman-Kolmogorov Equation to evaluate system availability, we
presented eight different rules. Then the transition probabilities between the system’s states,
as well as the transition matrix using these eight rules, are calculated. The results
(availability) obtained using both methods from the viewpoint of computational time are
compared at the end. The novelties of the current paper can be summarized as follows:
Developing a CKEB method for calculating the availability of systems with multi-
tasking repair facilities,
Presenting a closed-form set of differential equations for calculating the system’s
availability,
Comparing the performance of the given model with simulation technique.
The problem raised in this paper is an availability problem. This system has a series-
parallel configuration and components with three states of performance. These components
are repairable, and every repair facility can offer service to all sub-systems. The
mathematical model and the solution offered for the series-parallel system are based on the
assumption that redundancy policy is of the active type. The failure and repair rate of the
available components are constant. The problem objective is to calculate the availability of
the system by using differential equations and state diagrams. Considering the problem
conditions, it is a state-dependent system, so Markov analysis in examining this problem is
too important.
3- System Definitions
In this section, we present some descriptions for a real-world desalination system.
3-1- The recovery treatment process at a desalination plant
Figure 1 shows the recovery treatment process at a desalination plant. Figure 1 shows
that after adding bactericide materials and reverse demulsifies to the wastewater, it moves
to the skimmer reservoir. After a while, a portion of the oil droplets comes to the water's
surface, collects by a pipe, and sends it to the reservoir to store contaminated oil. Then it
enters the gravity separator, and again a portion of the oil drops is collected, and the
remained will be sent to the contaminated oil reservoir. The water is then pumped to under
pressure filters, designed to collect the solid particle with more than 10 microns’ dimensions,
and the dimension of the remaining oil drop to below 25 ppm. Eventually, the wastewater
stores in a volatile reservoir and injects into the wells by pressure pumps. At the time of any
technical problem in the plant, the wastewater will be sent to the pit, which will cause
environmental pollution.
Insert Figure 1 here

6
3-2- Components of the studied filtration and injection system
3-2-1. Skimmer tank
The dimensions of the skimmer tank are 10 meters in diameter and 5 meters high.
The reservoir is equipped with a cochlear plate, which allows the oil to remain on the surface
with a lifespan and can be removed by a cut tube that can be changed. Water is also ejected
out of the tube through a pipe.
3-2-2. Gravity separator
The weighing separator consists of two cavity piers with a width of 2.5 m, a length
of 3.15 m, and a depth of 1.5 m long covered by a steel sheet. The oil floating on the water's
surface collects using a rotating tube, and the water is draining from the bottom.
3-2-3. Filter
The utilized sandwich filters have a height of 1.6 to 2.6 meters in diameter and 2
meters in height—filters designed for solid particles up to 10 microns and oil reduction of
around 25 ppm.
3-2-4. The dirty oil surge tank
This tank received the oil separated in a skimmer tank and pump the remaining
water to the desalination plant. This tank has a diameter of 3 meters, a height of 2 meters,
and a design pressure of 0.02 bar.
3-2-5. Disposal water pump
A wastewater pump is a single-stage pump of OH6 designed for working in harsh
conditions. This pump receives the wastewater from the disposal water surge tank and
injects it into the well. In cases where the required injection pressure is greater than 1200
psi, pre-pressure pumps are used.
4- Problem definition
As shown in Fig. 1, five different types of pumps are functioning at the desalination
plant. Failure of each pump will disrupt the desalination process. In this system, considering
the number of healthy blades, each pump can be considered three-state equipment. If all the
blades are in good condition, the pump will continue to work with its maximum
performance. If more than one blade has been damaged, the pump will be deactivated,
while if just a blade is failed, the pump will keep working at lower performance. In this
paper, the pumps’ reduced performance is considered half of the new pump’s performance.
Moreover, as it is clear, all repair facilities can repair all existing pumps (of any type).
The understudy's system is a weighted-k-out-of-n system with a multi-state component.
Since each pump has three states, it should be considered as an MSS. Moreover, for each
sub-system (pump-station), when a specific number (𝑘𝑖) of the pumps were available, the
pump station is considered as an operational pump station. For example, if 𝑘𝑖 = 1.5, it
means that the pump station is working with equal or more than one fully-working and one

7
semi-working pump, or with more than two semi-working pumps. One of the ways to
increase the availability of such systems is to use redundant equipment. If the available
budget and space for component redundancy are limited, the main issue is to find the best
solution for assigning redundant pumps. The first step for optimal allocation is to find a
way to calculate the system's availability. We present the following two methods for
calculating such systems' availability: CKEB and simulation technique.
4-1- The general procedure of calculating the system’s availability
Pourkarim, Sharifi, Niaki, et al. [9] calculated the three-state system’s reliability using
UGF, Recursive algorithm, and differential equations (using Chapman-Kolmogorov
Equations). They reported that the differential equations model’s computational time is
significantly less than two other techniques, especially for large-scale systems. In this paper,
we used the method of differential equations to calculate the system’s availability. The
general procedure of the model solution in this paper is as follows:
Step one: determine the system’s states,
Step two: obtain the general state diagram for such a system,
Step three: determine the relations between the system’s states,
Step four: establish the set of differential equations between the system’s states and
calculate the system’s transition matrix using the Chapman-Kolmogorov equations.
Step five: calculate the system’s availability (which is the main objective of the current
study),
Step six: validate the model using the simulation technique.
4-2- Nomenclatures
The notation (indexes and parameters) used in this paper is presented in Table 2 as
follows.
Insert Table 2 here
4-3- System configuration
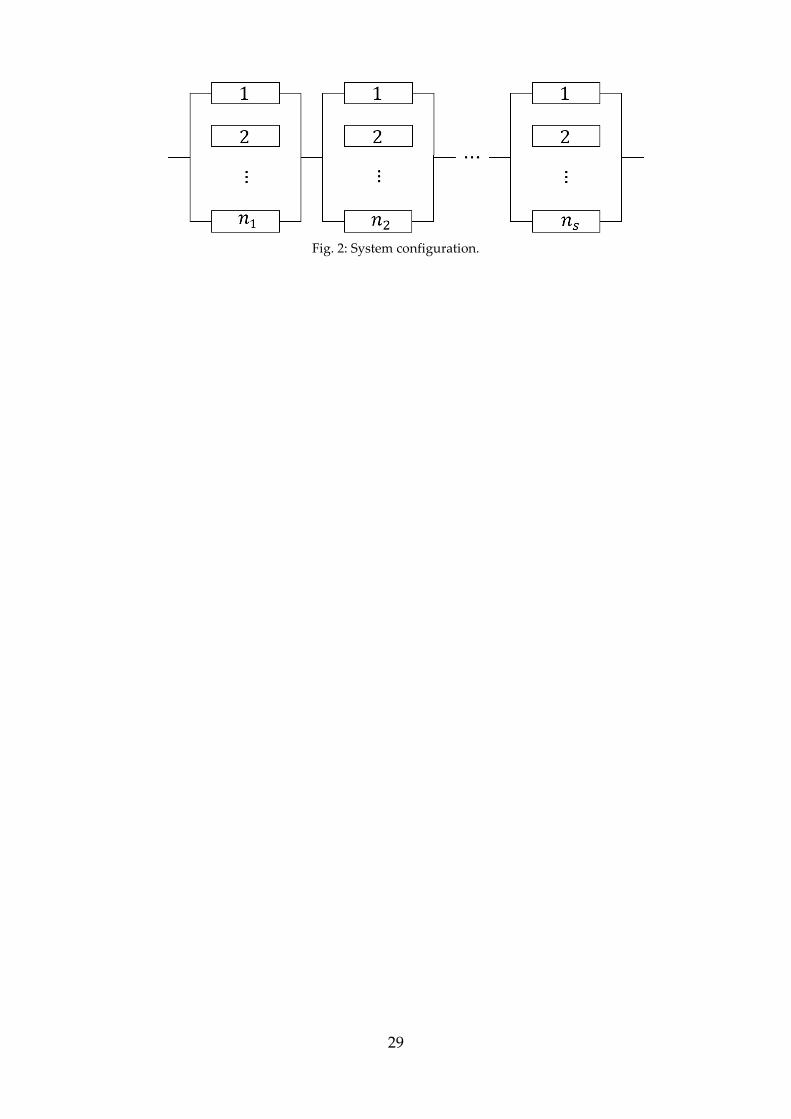
The general diagram of a RAP is presented in Figure 2. The system consists of 𝑆 serially
connected pump stations, in which the 𝑖th (𝑖 = 1, … , 𝑆) pump station has 𝑛𝑖 redundant
pump.
Insert Figure 2 here
Three operational states can be considered for each pump: working, semi-working
(or partially failed), and failed. For pump station 𝑖, we show the number of working pumps
by 𝑤𝑖, the number of semi-working pumps by ℎ𝑖, and the number of repair facilities which
are working on the pump stations’ pumps by 𝑚𝑖. We consider that a repair facility can fix a
pump when it is completely failed. So, the pump station condition can be determined by
(𝑤𝑖, ℎ𝑖 , 𝑚𝑖). Using the presented notation, the condition of the system is shown by
{(𝑤1, ℎ1, 𝑚1), … , (𝑤𝑠, ℎ𝑠, 𝑚𝑠)}. The system’s states are determined based on the values of 𝑤𝑖,
ℎ, and 𝑚𝑖. For example, the first state is {(𝑛1, 0,0), … , (𝑛𝑠, 0,0)}, which shows that all pumps
of all pump stations are fully working, and no semi-working pump is working in pump

8
stations. Moreover, all repair facilities are available, and none of them are working. For each
particular state, the working performance of the pump station calculates using Equation 1
as follows:
; 1,...,2
ji j
hPo w i h (1)
and the system is working, if for all pump stations 𝑃𝑜𝑖 ≥ 𝑘𝑖. Since the repair facilities
can serve the pump of all pump stations, determining the system’s state is very complicated,
especially when the number of pump stations increases. The number of possible states
dramatically rises. For a particular state, the state is reachable from different other states,
shown in Figure 3. This figure illustrates all scenarios that may happen for a particular
system’s state: partial failure of the functional pump, complete failure of the functional
pump, complete failure of a partially failed pump, and repair of a failed pump. For drawing
the state-space diagram of the system, only the states with 𝑃𝑜𝑖 ≥ 𝑘𝑖 should be considered.
In general, when a failure happens, two scenarios are desirable: a repair facility is
free and starts to repair the failed pump immediately after the failure, or there is no available
repair facility in the system, and the failed pump must stay on the waiting repair queue.
Likewise, two scenarios are desirable after repairing a failed pump; a failed pump in the
repair queue requires a free repair facility, or no pump is on the repair queue.
Insert Figure 3 here
In Figure 3, state 0 is a general state of the system, and states 1 to 8 are all possible
states in which state 0 is reachable from them. Figure 3 would be breakdown into eight
different rules which may happen for this system. In other words, all possible system states
can be expressed by the eight following rules. A general condition for all rules is presented
in Equation 2 as follows:
0 ;j j jw h n j i (2)
4-3-1. Rule one
In Figure 3, the correspondence state of Rule 1 is state 1. Figure 4 illustrates the semi-
failure of a working pump in a pump station. In the pump station 𝑖, there is (𝑤𝑖 + 1) working
pumps (ℎ𝑖 − 1) partially-failed pumps and 𝑚𝑖 busy repair facilities. The number of working
pumps reduces by one unit by partially-failure of one pump in this pump station, and the
number of semi-working pumps increases one unit. Since the state has (𝑤𝑖 + 1) working
pumps and partially-failure rate of each pump is 𝜆𝑖1, the transition rate from this state to
state 0 is equal to (𝑤𝑖 + 1). 𝜆𝑖1. The conditions for using Rule 1 are presented in Equations
(3) to (6). Insert Figure 4 here
0 i i i im n w h (3)
0 ;j j j jm n w h j i (4)
i j
j i
m m M
(5)
1 & 1 & 0 1i i i i i i iw h n h n w n (6)

9
4-3-2. Rule two
In Figure 3, the correspondence state of Rule 2 is state 2. Figure 5 illustrates the full-
failure of a working pump of a pump station. In the pump station 𝑖, there is (𝑤𝑖 + 1) working
pumps, ℎ𝑖 partially-failed pumps and (𝑚𝑖 − 1) busy repair facilities. By fully-failure of one
pump in this pump station, the number of working pumps reduced one unit, and the
number of busy repair facilities increases one unit. Since the state has (𝑤𝑖 + 1) working
pumps and fully-failure rate of each pump is 𝜆𝑖2, the transition rate from this state to state
0 is equal to (𝑤𝑖 + 1). 𝜆𝑖2. The conditions for using Rule 2 are presented in Equations (7) to
(10).
Insert Figure 5 here
1 i i i im n w h (7)
0 ;j j j jm n w h j i (8)
1i j
j i
m m M
(9)
0 1 & 0 1i i i i iw h n w n (10)
4-3-3. Rule three
In Figure 3, the correspondence state of Rule 3 is state 3. Just like Rule 2, Figure 6
illustrates the full-failure of a working pump in the pump station. But in this rule, there is
no available repair facility. So, for this rule, after the full-failure of one pump, the number
of working pumps reduces by one unit, but the number of busy repair facilities doesn’t
change. Since the state has (𝑤𝑖 + 1) working pumps and fully-failure rate of each pump is
𝜆𝑖2, the transition rate from this state to state 0 is equal to (𝑤𝑖 + 1). 𝜆𝑖2. The conditions for
using Rule 4 are presented in Equations (11) to (14).
Insert Figure 6 here
0 i i i im n w h (11)
0 ;j j j jm n w h j i (12)
i j
j i
m m M
(13)
0 1 & 0 1i i i i iw h n w n (14)
4-3-4. Rule four
In Figure 3, the correspondence state of Rule 4 is state 4. Figure 7 illustrates the full-
failure of a semi-failed pump in a pump station. In the pump station 𝑖, there are 𝑤𝑖 working
pumps, (ℎ𝑖 + 1) partially-failed pumps, and (𝑚𝑖 − 1) busy repair facilities. By fully-failure
of one semi-failed pump, the number of the semi-failed pumps reduces one unit, and the
number of the busy repair facilities increases one unit. Since the state has (ℎ𝑖 + 1) semi-
failed pumps and fully-failure rate of each pump is 𝜆𝑖3, the transition rate from this state to
state 0 is equal to (ℎ𝑖 + 1). 𝜆𝑖3. The conditions for using Rule 4 are presented in Equations
(15) to (18).

10
Insert Figure 7 here
1 i i i im n w h (15)
0 ;j j j jm n w h j i (16)
1i j
j i
m m M
(17)
0 1 & 0 1i i i i iw h n w n (18)
4-3-5. Rule five
In Figure 3, the correspondence state of Rule 5 is state 5. Figure 8 illustrates the full-
failure of a semi-failed pump in a pump station. But in this rule, there is no available repair
facility. So, for this rule, after the full-failure of one semi-failed pump, the number of semi-
failed pumps reduces by one unit, but the number of busy repair facilities doesn’t change.
Since the state has (ℎ𝑖 + 1) semi-working pumps and fully-failure rate of each pump is 𝜆𝑖4,
the transition rate from this state to state 0 is equal to (ℎ𝑖 + 1). 𝜆𝑖4. The conditions for using
Rule 4 are presented in Equations (19) to (22). Insert Figure 8 here
0 i i i im n w h (19)
0 ;j j j jm n w h j i (20)
i j
j i
m m M
(21)
0 1 & 0 1i i i i iw h n h n (22)
4-3-6. Rule six
Rules 6, 7, and 8 are related to pump repair. In Figure 3, the correspondence state of
Rule 6 is state 6. Rule 6, illustrated in figure 9, indicates that the one pump's repair is
finished, and no failed pump is in the repair queue. In the pump station 𝑖, there is (𝑤𝑖 − 1)
working pumps, ℎ𝑖 partially-failed pumps, and (𝑚𝑖 + 1) busy repair facilities. The repaired
pump starts working, so the number of working pumps increases one unit, and the number
of under repair pumps decreases one unit. Since there is (𝑚𝑖 + 1) under repair pumps and
the repair rate of each pump is equal 𝜇𝑖, the transition rate from this state to state 0 is equal
(𝑚𝑖 + 1). 𝜇𝑖. The conditions for using Rule 6 are presented in Equations (23) to (26). Insert Figure 9 here
i i i im n w h (23)
;j j j jm n w h j i (24)
i j
j i
m m M
(25)
1 i i iw h n (26)

11
4-3-7. Rule seven
In Figure 3, the correspondence state of Rule 7 is state 7. Rule 7, illustrated in figure
10, indicates that the one pump's repair is finished, and the pump station has at least one
failed pump on the repair queue. In the pump station 𝑖, there is (𝑤𝑖 − 1) working pumps,
ℎ𝑖 partially-failed pumps, and 𝑚𝑖 busy repair facilities. Based on the repair policy, which
will be presented in Section 4.4, pump station 𝑖 has the priority of repair, so, repair facility
allocates to one of the failed pump(s) of the pump station 𝑖. In this case, the number of the
working pumps of the pump station 𝑖 increases one unit, but the number of the under repair
pumps doesn’t change. Since there is 𝑚𝑖 under repair pumps, and the repair rate of each
pump is equal 𝜇𝑖, the transition rate from this state to state 0 is equal 𝑚𝑖 . 𝜇𝑖. The conditions
for using Rule 7 are presented in Equations (27) to (33). Insert Figure 10 here
;j j j jL j n w h m j i (27)
minL Lj L
w w
(28)
,
minj Lj L w w
l j
(29)
& &
& & &
&
i l i i i i
i l i i i i i j
j i
i i i i
L w w n w h m
or
if L w w n w h m i l then m m M
or
L n w h m
(30)
1 i i i im n w h (31)
0 ;j j j jm n w h j i (32)
1 1i i iw h n (33)
4-3-8. Rule eighth
In Figure 3, the correspondence state of Rule 8 is state 8. Rule 8, illustrated in figure
11, indicates that the one pump's repair is finished, and the pump station has at least one
failed pump on the repair queue. In the pump station 𝑖, there is (𝑤𝑖 − 1) working pumps, ℎ𝑖
partially-failed pumps, and (𝑚𝑖 + 1) busy repair facilities. Based on the repair policy, which
will be presented in Section 4.4, pump station 𝑖 has no priority for repair, so the repair
facility allocates to one of the failed pump(s) of another pump station. In this case, the
number of the working pumps of the pump station 𝑖 increases one unit, and the number of
the under repair pumps decreases one unit. Since there is (𝑚𝑖 + 1) under repair pumps and
the repair rate of each pump is equal 𝜇𝑖, the transition rate from this state to state 0 is equal
(𝑚𝑖 + 1). 𝜇𝑖. The conditions for using Rule 8 are presented in Equations (34) to (40). Insert Figure 11 here
;j j j jL j n w h m j i (34)
minL Lj L
w w
(35)

12
,
minj Lj L w w
l j
(36)
& &
& & &
&
i l i i i i
i l i i i i i i i i
i l
i j
j i
L w w n w h m
or
if L w w n w h m or n w h m i l
or
L w w
then m m M
(37)
0 i i i im n w h (38)
0 ;j j j jm n w h j i (39)
1 i i iw m n (40)
4-4- Repair queuing policy
Rules 7 and 8 are the same as Rule 6. But in Rules 7 and 8, some pumps are in the repair
queue, and a released repair facility must work on one of the failed pumps in the repair
queue. In this condition, the important question that should be answered is: which failed
pump should be allocated to the available repair facility? To answer this question and solve
this problem, we consider a policy that determines the repair priority of the pumps in the
repair queue. This policy is defined in four steps:
Step 1: Determine the 𝑅, set of pump stations that have at least one pump in the repair
queue,
Step 2: Determine the working pumps of the pump station(s) of 𝑅.
Step 3: Allocate the repair facility to the failed pump of the pump station with the lowest
working pump is 𝑅,
Step 4: If there is more than one pump station with the lowest working pump in 𝑅,
allocate the repair facility to the pumps of the pump station with a lower pump station’s
index (lower value of 𝑖).
According to the eight rules mentioned above, the state diagram can be determined for
any system with any number of pumps and pump stations. In any situation, one of the above
rules will comply. For example, consider a system with three pump stations. Each pump
station consists of four pumps, and three repair facility is available. Consider the state
{(2,1,1), (1,0,1), (2,1,0)}. In this state and for the first pump station, two fully-working and
one semi-working pump is available, and one pump is under repair, so this station has no
pump on the repair queue. One fully-working and no semi-working pump is available in
the second pump station, and one pump is under repair, so this station has two pumps on
the repair queue. In the third pump station, two fully-working and one semi-working pump
are available, and no pump is under repair, so this station has one pump on the repair queue.
So, for this state 𝑅 = {2, 3} which is the index of the pump stations with at least one pump
on the repair queue. The working power of the second pump station is equal 𝑃𝑜2 = 1 × 𝑤2 +
0.5 × ℎ2 = 1 × 1 + 0.5 × 0 = 1 and the power of the third pump station is equal 𝑃𝑜3 = 1 ×
𝑤3 + 0.5 × ℎ3 = 1 × 2 + 0.5 × 1 = 2.5. Since we know that one repair facility is available, this
repair facility allocates to the pump station with lower working power, the second pump-
13
station. But for state {(1,2,1), (1,2,1), (2,2,0)}, the working power of the first and second
pump stations are equal (𝑃𝑜1 = 𝑃𝑜2 = 2), so the available repair facility allocates to the
pump station with the lower index of 𝑖, which is the first pump station.
4-5- Transition matrix
The transition matrix is a matrix, which their elements are the transition probabilities
between different system states. The state-space diagram of a system with one repairable
pump is presented in Figure 12, and the correspondence transition matrix is shown in Figure
13.
Insert Figure 12 here
Insert Figure 13 here
4-6- Differential equations
In memoryless models, using the Markov process and Chapman-Kolmogorov
equations, we can obtain differential equations. Lets 𝑃𝑛(𝑡) represents the probability that the
system is in state 𝑛, at time 𝑡. So, 𝑃𝑛(𝑡) is obtained from the differential equation according
to Equation (41) as follows:
. .n i n i j
i output fellows from state n j input fellows to state n
P t P t P t
(41)
By solving the set of the differential equation, the probability of each system’s state at
time 𝑡 is obtained. The sum of these probabilities is system availability. To do the
calculations, all coding is done in MATLAB R2019b software.
4-7- Simulation
One of the most common tools for analyzing the models and real-world systems is the
simulation [22, 23, 28, 30, 31]. Particularly in models and systems that have a random nature,
this procedure is very efficient. To validate our proposed method, we use a simulation
technique. The simulation flowchart of the repairable three-state system is presented in
Figure 14. Insert Figure 14 here
In different periods, the event’s times are randomly created concerning their failure
rates. Considering that the failure and repair rates are constant, these times calculates using
Equation (42).
RRandLnt
(42)
Although the simulation technique in this paper is used to validate the proposed model,
this method could notably be used to obtain repairable three-state systems with any
distribution.
14
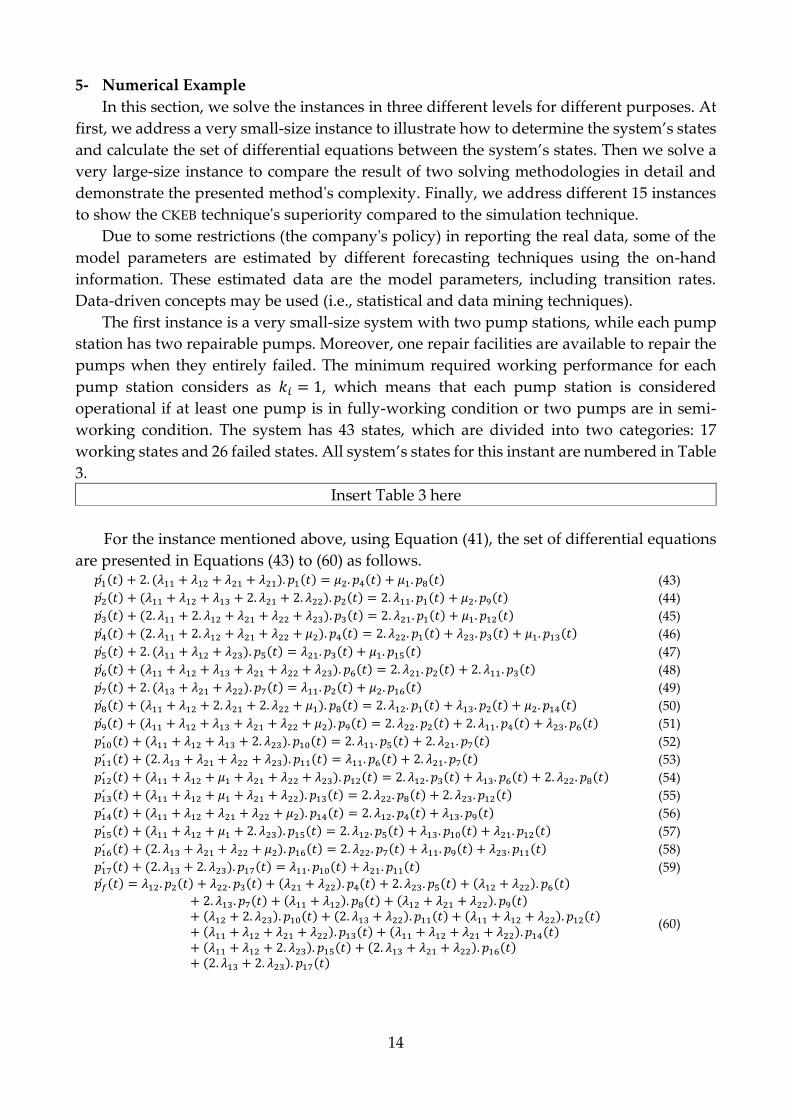
5- Numerical Example
In this section, we solve the instances in three different levels for different purposes. At
first, we address a very small-size instance to illustrate how to determine the system’s states
and calculate the set of differential equations between the system’s states. Then we solve a
very large-size instance to compare the result of two solving methodologies in detail and
demonstrate the presented method's complexity. Finally, we address different 15 instances
to show the CKEB technique's superiority compared to the simulation technique.
Due to some restrictions (the company's policy) in reporting the real data, some of the
model parameters are estimated by different forecasting techniques using the on-hand
information. These estimated data are the model parameters, including transition rates.
Data-driven concepts may be used (i.e., statistical and data mining techniques).
The first instance is a very small-size system with two pump stations, while each pump
station has two repairable pumps. Moreover, one repair facilities are available to repair the
pumps when they entirely failed. The minimum required working performance for each
pump station considers as 𝑘𝑖 = 1, which means that each pump station is considered
operational if at least one pump is in fully-working condition or two pumps are in semi-
working condition. The system has 43 states, which are divided into two categories: 17
working states and 26 failed states. All system’s states for this instant are numbered in Table
3.
Insert Table 3 here
For the instance mentioned above, using Equation (41), the set of differential equations
are presented in Equations (43) to (60) as follows. 𝑝1́(𝑡) + 2. (𝜆11 + 𝜆12 + 𝜆21 + 𝜆21). 𝑝1(𝑡) = 𝜇2. 𝑝4(𝑡) + 𝜇1. 𝑝8(𝑡) (43)
𝑝2́(𝑡) + (𝜆11 + 𝜆12 + 𝜆13 + 2. 𝜆21 + 2. 𝜆22). 𝑝2(𝑡) = 2. 𝜆11. 𝑝1(𝑡) + 𝜇2. 𝑝9(𝑡) (44)
𝑝3́(𝑡) + (2. 𝜆11 + 2. 𝜆12 + 𝜆21 + 𝜆22 + 𝜆23). 𝑝3(𝑡) = 2. 𝜆21. 𝑝1(𝑡) + 𝜇1. 𝑝12(𝑡) (45)
𝑝4́(𝑡) + (2. 𝜆11 + 2. 𝜆12 + 𝜆21 + 𝜆22 + 𝜇2). 𝑝4(𝑡) = 2. 𝜆22. 𝑝1(𝑡) + 𝜆23. 𝑝3(𝑡) + 𝜇1. 𝑝13(𝑡) (46)
𝑝5́(𝑡) + 2. (𝜆11 + 𝜆12 + 𝜆23). 𝑝5(𝑡) = 𝜆21. 𝑝3(𝑡) + 𝜇1. 𝑝15(𝑡) (47)
𝑝6́(𝑡) + (𝜆11 + 𝜆12 + 𝜆13 + 𝜆21 + 𝜆22 + 𝜆23). 𝑝6(𝑡) = 2. 𝜆21. 𝑝2(𝑡) + 2. 𝜆11. 𝑝3(𝑡) (48)
𝑝7́(𝑡) + 2. (𝜆13 + 𝜆21 + 𝜆22). 𝑝7(𝑡) = 𝜆11. 𝑝2(𝑡) + 𝜇2. 𝑝16(𝑡) (49)
𝑝8́(𝑡) + (𝜆11 + 𝜆12 + 2. 𝜆21 + 2. 𝜆22 + 𝜇1). 𝑝8(𝑡) = 2. 𝜆12. 𝑝1(𝑡) + 𝜆13. 𝑝2(𝑡) + 𝜇2. 𝑝14(𝑡) (50)
𝑝9́(𝑡) + (𝜆11 + 𝜆12 + 𝜆13 + 𝜆21 + 𝜆22 + 𝜇2). 𝑝9(𝑡) = 2. 𝜆22. 𝑝2(𝑡) + 2. 𝜆11. 𝑝4(𝑡) + 𝜆23. 𝑝6(𝑡) (51)
𝑝10́ (𝑡) + (𝜆11 + 𝜆12 + 𝜆13 + 2. 𝜆23). 𝑝10(𝑡) = 2. 𝜆11. 𝑝5(𝑡) + 2. 𝜆21. 𝑝7(𝑡) (52)
𝑝11́ (𝑡) + (2. 𝜆13 + 𝜆21 + 𝜆22 + 𝜆23). 𝑝11(𝑡) = 𝜆11. 𝑝6(𝑡) + 2. 𝜆21. 𝑝7(𝑡) (53)
𝑝12́ (𝑡) + (𝜆11 + 𝜆12 + 𝜇1 + 𝜆21 + 𝜆22 + 𝜆23). 𝑝12(𝑡) = 2. 𝜆12. 𝑝3(𝑡) + 𝜆13. 𝑝6(𝑡) + 2. 𝜆22. 𝑝8(𝑡) (54)
𝑝13́ (𝑡) + (𝜆11 + 𝜆12 + 𝜇1 + 𝜆21 + 𝜆22). 𝑝13(𝑡) = 2. 𝜆22. 𝑝8(𝑡) + 2. 𝜆23. 𝑝12(𝑡) (55)
𝑝14́ (𝑡) + (𝜆11 + 𝜆12 + 𝜆21 + 𝜆22 + 𝜇2). 𝑝14(𝑡) = 2. 𝜆12. 𝑝4(𝑡) + 𝜆13. 𝑝9(𝑡) (56)
𝑝15́ (𝑡) + (𝜆11 + 𝜆12 + 𝜇1 + 2. 𝜆23). 𝑝15(𝑡) = 2. 𝜆12. 𝑝5(𝑡) + 𝜆13. 𝑝10(𝑡) + 𝜆21. 𝑝12(𝑡) (57)
𝑝16́ (𝑡) + (2. 𝜆13 + 𝜆21 + 𝜆22 + 𝜇2). 𝑝16(𝑡) = 2. 𝜆22. 𝑝7(𝑡) + 𝜆11. 𝑝9(𝑡) + 𝜆23. 𝑝11(𝑡) (58)
𝑝17́ (𝑡) + (2. 𝜆13 + 2. 𝜆23). 𝑝17(𝑡) = 𝜆11. 𝑝10(𝑡) + 𝜆21. 𝑝11(𝑡) (59) 𝑝�́�(𝑡) = 𝜆12. 𝑝2(𝑡) + 𝜆22. 𝑝3(𝑡) + (𝜆21 + 𝜆22). 𝑝4(𝑡) + 2. 𝜆23. 𝑝5(𝑡) + (𝜆12 + 𝜆22). 𝑝6(𝑡)
+ 2. 𝜆13. 𝑝7(𝑡) + (𝜆11 + 𝜆12). 𝑝8(𝑡) + (𝜆12 + 𝜆21 + 𝜆22). 𝑝9(𝑡)+ (𝜆12 + 2. 𝜆23). 𝑝10(𝑡) + (2. 𝜆13 + 𝜆22). 𝑝11(𝑡) + (𝜆11 + 𝜆12 + 𝜆22). 𝑝12(𝑡)+ (𝜆11 + 𝜆12 + 𝜆21 + 𝜆22). 𝑝13(𝑡) + (𝜆11 + 𝜆12 + 𝜆21 + 𝜆22). 𝑝14(𝑡)+ (𝜆11 + 𝜆12 + 2. 𝜆23). 𝑝15(𝑡) + (2. 𝜆13 + 𝜆21 + 𝜆22). 𝑝16(𝑡)+ (2. 𝜆13 + 2. 𝜆23). 𝑝17(𝑡)
(60)

15
The system’s availability is the sum of the probabilities of 𝑝𝑖(𝑡), for all system’s
working states. The estimated availability for this example is equal to 𝐴(100) = 0.95601 for
a 100 hours system’s mission time.
To investigate the computational methods' complexity, a new large-size problem is
solved with both methods. We consider different system’s mission times from 100 to 450
hours. The system consists of four pump stations with five repair facility. The first pump
station has four pumps, the second pump station has two pumps, the second pump station
has three pumps, and the fourth pump station has only one pump. the minimum required
working performance for all pump stations are considered as 𝑘𝑖 = 0.5. The presented
instance has a 2575 working state and one failed state. The failure rate of the pumps in these
four pump stations are {(𝜆11 = 0.045, 𝜆12 = 0.028, 𝜆1 = 0.035), (𝜆21 = 0.015, 𝜆22 =0.043, 𝜆23 = 0.020), (𝜆31 = 0.025, 𝜆32 = 0.035, 𝜆33 = .037), (𝜆41 = 0.014, 𝜆42 = 0.044, 𝜆43 =
0.026)}, and the repair rate for all pumps’ types is equal 𝜇𝑖 = 0.195; 𝑖 = 1,2,3,4. The number
of simulation technique runs ten times, and the number of simulation iterations for each run
is equal to 1,000,000. The results for solving the presented instance using both methods are
presented in Table 4. In this table, when system operation time is considered 450 hours, the
system's availability calculated with both methods is equal, even though the calculation
times vary significantly. Figure 15 shows the system's availability calculated with both
methods, and figure 16 illustrates the calculation time of both methods.
Insert Table 4 here
Insert Figure 15 here
Insert Figure 16 here
As shown in Table 4, with an increase in the system's mission time, the computational
time of the CKEB method is not significantly changed. In contrast, the simulation method's
computational time has increased dramatically, which confirms the CKEB method's
efficiency in computational time.
As shown in Figure 15, by increasing the system’s mission time, both techniques'
availability converges to the same values. The reason is that by increasing the system’s
mission time, the simulation method approaches its steady-state condition, and the
simulation method's availability achieves real system’s availability, which is the same as
calculated using the CKEB method.
Figure 16 shows that, by increasing on system’s mission time, the CKEB method's
computational time is not significantly changed. But, the computational time of the
simulation method has increased significantly. Thus, by studying both Figures 15 and 16,
the following essential points can be concluded:
The availability obtained from both methods is equal, which is a reason for the proper
functioning of the CKEB method.
The computational time of the CKEB method is significantly less than the
computational time of the simulation method, which is a reason for the superiority of the
CKEB method

16
5-1- Managerial insights
To compare the solving methodologies better, we solve 15 different instances in small,
medium, and large scales. These instances are designed based on the real pumps’
configuration in different under-studied desalination plants. In these instances, the number
of pump stations varies from two to five, the number of repair facilities varies from one to
seven. So, the number of the systems’ states are from 8 to 2576. Other systems’ parameters
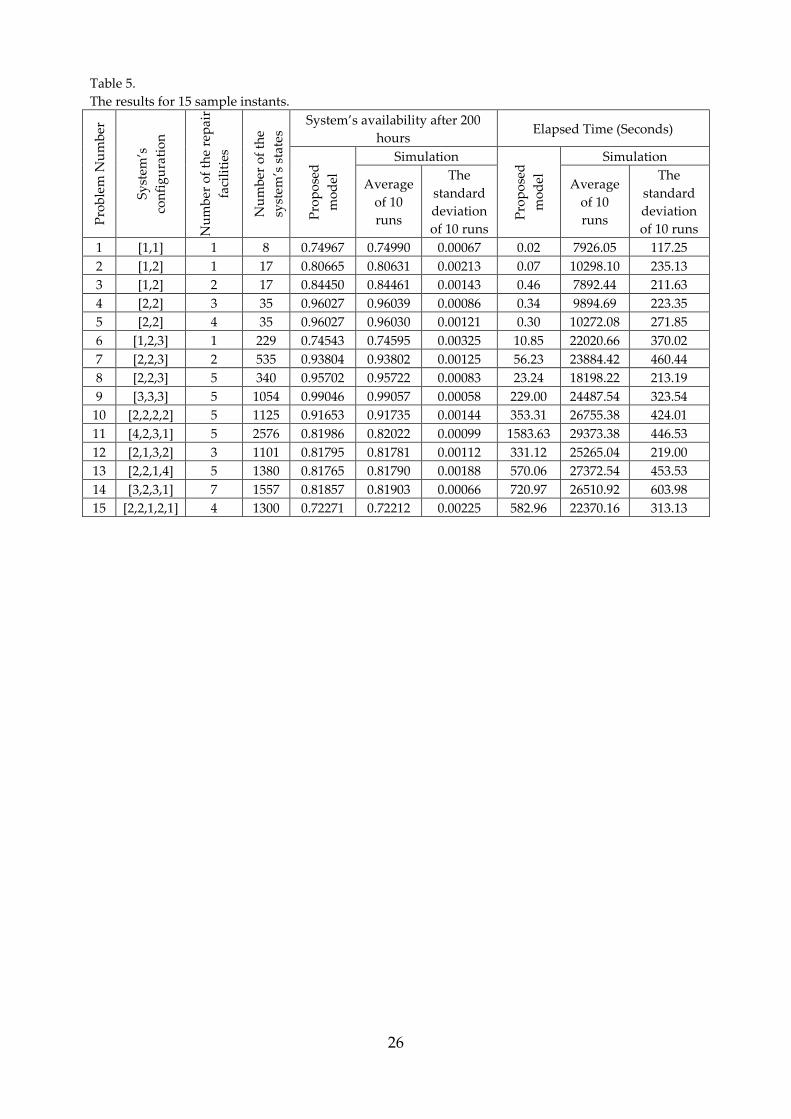
are generated randomly. The results of these 15 instances are presented in Table 5.
Insert Table 5 here
In Table 5, the simulation runs ten times for each instance, the number of the
simulation iterations for each run is equal to 1,000,000, and the system mission time equals
200 hours. As is presented in Table 5, for all system configurations, the computational time
of the CKEB method is significantly less than the simulation technique's computational time.
We used a T-test for comparing the availability and computational time of both methods
using Minitab 17. The comparing results for systems’ availability and computational time
are presented in Table 6.
Insert Table 6 here
As presented in Table 6, both methods reach equal availability, proving the CKEB
method's accuracy.
In a desalination plant, considering the workplace constraint, it is essential to
optimize the pumps’ configuration to keep the plant functional. Moreover, allocating the
proper number of multi-tasking maintenance facilities increases the reliability of the pump
stations. For this reason, different techniques like the RAP are applicable. The RAP is an Np.
Hard problem in nature. So, the lack of an appropriate model to calculate the problem's
objective function increases the complexity of the problem. In this paper, we presented a
CKEB technique to calculate the system's availability consists of the series sub-systems. The
components of each sub-system are considered repairable components, while some multi-
tasking maintenance facilities repaired the failed components of all sub-systems.
The computational time ratio for the CKEB method to simulation technique is
between 0.0002% to 0.0058% for the small-size problems, between 0.05% to 0.94% for the
medium-size problems, and between 1.31% to 5.39% for the large-size problems. So, the
presented model can reduce the complexity of the optimization methods used to optimize
the components’ configuration in such systems.
6- Conclusion and Further Studies
In this paper, a new method based on the Chapman-Kolmogorov equations is presented
for evaluating the availability of a desalination system’s pump stations with three-state
repairable pumps. At the same time, each repair facility can service the pumps of all pump
stations. The differential equations were compiled by using the Chapman-Kolmogorov
equations. Then by solving the differential equations, the availability of the system was
calculated. Finally, to validate the proposed model, we used the simulation method. The
results showed that the CKEB technique could calculate the system’s availability has
significantly less computational time. The computational time ratio for the CKEB method

17
on simulation technique was between 0.0002% to 0.0058% for the small-size problems,
between 0.05% to 0.94% for the medium-size problems, and between 1.31% to 5.39% for the
large-size problems. On average, the computational time of the CKEB method for
calculating the system’s availability was 1.12% of the computational time of the simulation
technique, which is the only other technique for calculating such a system’s availability.
Moreover, considering the proposed CKEB method's steps, the complexity of the proposed
method in practice is less than the simulation technique.
For expanding the results of current research, some directions for future studies are as
follows: optimizing the components’ configuration using the results of the current research,
solving the model by considering cold or warm standby policy, to draw the problem nearer
to the real-case condition, review, and assessment of the reliability (availability) of
repairable continuous-state problems, solving the model with a different repair policy for
under-repair equipment, solving the model by considering the repair event for partially
failed components, and solving the model with a different repair policy for under-repair
equipment.
Acknowledgment
Special thanks to Mr. Ali Reza Tahmasebi, Head of Maintenance Planning, Marun Oil
& Gas Production Company, for the great help in gathering required data and information
on the operational processes.
7- References [1] Ushakov, I., “Universal generating function”, Soviet Journal of Computer Systems and Science, 24(5):
pp. 118–129 (1986).
[2] Wu, J.-S. and R.-J. Chen, “An algorithm for computing the reliability of weighted-k-out-of-n systems”,
IEEE Transactions on Reliability, 43(2): p. 327-328 (1994)
[3] Higashiyama, Y., “A factored reliability formula for weighted-k-out-of-n system”, Asia-Pacific Journal
of Operational Research, 18(1), pp. 61 (2001)
[4] Sharifi, M., M. Ganjian, and H. Ghajar, “Expansion of Reliability Models based on Markov Chain with
Consideration of Fuzzy Failure Rates: System with two Parallel and Identical Elements with Constant Failure
Rates”, In Computational Intelligence for Modelling, Control and Automation, and International Conference
on Intelligent Agents, Web Technologies and Internet Commerce, International Conference on, IEEE (2005).
[5] Sharifi, M., A. Memariani, and R. Nouralsana, “Real time study of a k-out-of-n system: n identical
elements with increasing failure rates”, Iranian Journal of Operations Research, 1(2), pp. 56-67 (2009).
[6] Lisnianski, A. and Y. Ding, “Redundancy analysis for repairable multi-state system by using combined
stochastic processes methods and universal generating function technique”, Reliability Engineering & System
Safety, 94(11), pp. 1788-1795 (2009).
[7] Sharifi, M., A. Memariani, and R. Noorossana, “Real time study of a k-out-of-n system”, World
Applied Sciences Journal, 8(9), pp. 1136-1143 (2010).
[8] Levitin, G., Xing, L., & Dai, Y., “Sequencing optimization in k-out-of-n cold-standby systems
considering mission cost”, International Journal of General Systems, 42(8), pp. 870-882 (2013).

18
[9] Guilani, P. P., Sharifi, M., Niaki, S. T. A., & Zaretalab, A. “Reliability evaluation of non-reparable three-
state systems using Markov model and its comparison with the UGF and the recursive methods”, Reliability
Engineering & System Safety, 129, pp. 29-35 (2014).
[10] Lu, J. M., Wu, X. Y., Liu, Y., & Lundteigen, M. A. “Reliability analysis of large phased-mission systems
with repairable components based on success-state sampling”, Reliability Engineering & System Safety, 142,
pp.123-133 (2015).
[11] Levitin, G., Xing, L., & Dai, Y. “Optimal completed work dependent loading of components in cold
standby systems”, International Journal of General Systems, 44(4), pp.471-484 (2015).
[12] Sharifi, M., & Taghipour, S. “Optimal inspection interval for a k-out-of-n system with non-identical
components”, Journal of Manufacturing Systems, 55, pp.233-247 (2020).
[13] Fyffe, D.E., W.W. Hines, and N.K. Lee, “System reliability allocation and a computational algorithm”,
IEEE Transactions on Reliability, 17(2), pp. 64-69 (1968).
[14] Ramirez-Marquez, J. E., & Coit, D. W. “A heuristic for solving the redundancy allocation problem for
multi-state series-parallel systems”, Reliability Engineering & System Safety, 83(3), pp. 341-349 (2004).
[15] Tian, Z., & Zuo, M. J. “Redundancy allocation for multi-state systems using physical programming
and genetic algorithms”, Reliability Engineering & System Safety, 91(9), pp.1049-1056 (2006).
[16] Tian, Z., Zuo, M. J., & Huang, H. “Reliability-redundancy allocation for multi-state series-parallel
systems”, IEEE Transactions on Reliability, 57(2), pp. 303-310 (2008).
[17] Ouzineb, M., Nourelfath, M., & Gendreau, M. “Tabu search for the redundancy allocation problem
of homogenous series–parallel multi-state systems”, Reliability Engineering & System Safety, 93(8), pp. 1257-
1272 (2008).
[18] Mousavi, S. M., Alikar, N., Niaki, S. T. A., & Bahreininejad, A. “Two tuned multi-objective meta-
heuristic algorithms for solving a fuzzy multi-state redundancy allocation problem under discount strategies”,
Applied Mathematical Modelling, 39(22), pp. 6968-6989 (2015).
[19] Wang, W., Xiong, J., & Xie, M. “Cold-standby redundancy allocation problem with degrading
components”, International journal of general systems, 44(7-8),pp. 876-888 (2015).
[20] Lai, C. M., & Yeh, W. C. “Two-stage simplified swarm optimization for the redundancy allocation
problem in a multi-state bridge system”, Reliability Engineering & System Safety, 156, pp. 148-158 (2016).
[21] Shahriari, M., Sharifi, M., & Naserkhaki, S. “A New Continuous Multi-State Reliability Model with
Time Dependent Component Performance Rate”, Journal of New Researches in Mathematics, 1(4), pp. 169-
180 (2016).
[22] George-Williams, H. and E. Patelli, “A hybrid load flow and event driven simulation approach to
multi-state system reliability evaluation”, Reliability Engineering & System Safety, 152, pp. 351-367 (2016).
[23] Attar, A., Raissi, S., & Khalili-Damghani, K. “A simulation-based optimization approach for free
distributed repairable multi-state availability-redundancy allocation problems”, Reliability Engineering &
System Safety, 157, pp. 177-191 (2017).
[24] Essadqi, M., Idrissi, A., & Amarir, A. “An Effective Oriented Genetic Algorithm for solving
redundancy allocation problem in multi-state power systems”, Procedia Computer Science, 127, pp. 170-179
(2018).
19
[25] Tavana, M., Khalili-Damghani, K., Di Caprio, D., & Oveisi, Z. “An evolutionary computation
approach to solving repairable multi-state multi-objective redundancy allocation problems”, Neural
Computing and Applications, 30(1), pp. 127-139 (2018).
[26] Sharifi, M., Moghaddam, T. A., & Shahriari, M. “Multi-objective Redundancy Allocation Problem
with weighted-k-out-of-n subsystems”, Heliyon, 5(12), e02346 (2019).
[27] Sharifi, M., Shahriari, M., & Zaretalab, A. “The Effects of Technical and Organizational Activities on
Redundancy Allocation Problem with Choice of Selecting Redundancy Strategies Using the memetic
algorithm”, International Journal of Industrial Mathematics, 11(3), pp. 165-176 (2019).
[28] Sun, M. X., Li, Y. F., & Zio, E. “On the optimal redundancy allocation for multi-state series–parallel
systems under epistemic uncertainty”, Reliability Engineering & System Safety, 192, 106019 (2019).
[29] Hadipour, H., Amiri, M., & Sharifi, M. “Redundancy allocation in series-parallel systems under warm
standby and active components in repairable subsystems”, Reliability Engineering & System Safety, 192,
106048 (2019).
[30] Sharifi, M., Saadvandi, M., & Shahriari, M. “Presenting a Series-Parallel Redundancy Allocation
Problem with Multi-State Components Using Recursive Algorithm and Meta-Heuristic”, Scientia Iranica.
Transaction E, Industrial Engineering, 27(2), pp. 970-982 (2020).
[31] Xu, Y., Pi, D., Yang, S., & Chen, Y. “A novel discrete bat algorithm for heterogeneous redundancy
allocation of multi-state systems subject to probabilistic common-cause failure”, Reliability Engineering &
System Safety, 107338 (2020).
[32] Borhani Alamdari, A. H., & Sharifi, M. “Solving a Joint Availability-Redundancy Optimization Model
with Multi-State Components with Meta-Heuristic”, International Journal of Industrial Mathematics, 12(1),
pp. 59-70 (2020).
[33] Xiahou, T., Liu, Y., & Zhang, Q. “Multi-Objective Redundancy Allocation for Multi-State System
Design Under Epistemic Uncertainty of Component States”, Journal of Mechanical Design, 142(11), (2020).
[34] Sharifi, M., Cheragh, G., Dashti Maljaii, K., Zaretalab, A., & Shahriari, M. “Reliability and Cost
Optimization of a System with k-out-of-n Configuration and Choice of Decreasing the Components Failure
Rates”, Scientia Iranica, Transaction E, Industrial Engineering, in press.
[35] Zaretalab, A., Hajipour, V., & Tavana, M. “Redundancy allocation problem with multi-state
component systems and reliable supplier selection”, Reliability Engineering & System Safety, 193, 106629
(2020).
[36] Sharifi, M., & Taghipour, S. “Optimizing a redundancy allocation problem with open-circuit and
short-circuit failure modes at the component and subsystem levels”, Engineering Optimization, 53(6), pp.
1064-1080 (2021).
[37] Du, M., & Li, Y. F. “An investigation of new local search strategies in memetic algorithm for
redundancy allocation in multi-state series-parallel systems”, Reliability Engineering & System Safety, 195,
106703 (2020).
[38] Sharifi, M., Shahriari, M., Khajepour, A., & Mirtaheri, S. A. “ Reliability Optimization of a k-out-of-n
Series-Parallel System with Warm Standby Components. Scientia Iranica, Transaction E, Industrial
Engineering, in press.
[39] El-Nashar, A. M. “Optimal design of a cogeneration plant for power and desalination taking
equipment reliability into consideration”, Desalination, 229(1-3), pp. 21-32 (2008).

20
[40] Hosseini, S. R., Amidpour, M., & Behbahaninia, A. “Thermoeconomic analysis with reliability
consideration of a combined power and multi-stage flash desalination plant”, Desalination, 278(1-3), pp. 424-
433 (2011).
[41] Hosseini, S. R., Amidpour, M., & Shakib, S. E. “Cost optimization of a combined power and water
desalination plant with exergetic, environment and reliability consideration”, Desalination, 285, pp. 123-130
(2012).
[42] Zhou, J., Chang, V. W. C., & Fane, A. G. “Life cycle assessment for desalination: a review on
methodology feasibility and reliability”, Water research, 61, pp. 210-223 (2014).
[43] Ailliot, P., Boutigny, M., Koutroulis, E., Malisovas, A., & Monbet, V. “Stochastic weather generator
for the design and reliability evaluation of desalination systems with Renewable Energy Sources”, Renewable
Energy, 158, pp. 541-553 (2020).
[44] Wang, H., Asefa, T., Wanakule, N., & Adams, A. “Application of Decision-Support Tools for Seasonal
Water Supply Management that Incorporates System Uncertainties and Operational Constraints”, Journal of
Water Resources Planning and Management, 146(6), 05020008 (2020).
List of Tables
Table 1. Some recent research (between 2018-2020) related to RAP considering MSS.
Table 2. Indexes, parameters, and decision variables.
Table 3. State definition of the presented instant.
Table 4. Availability and calculation time of two methods for different system’s mission time.
Table 5. The results for 15 sample instants.
Table 6. T-values and P-Values for comparing two solving methodologies
21
List of Figures
Fig. 1: Recovery treatment process at a desalination plant.
Fig. 2: System configuration.
Fig. 3: General state diagram for the proposed model.
Fig. 4: Diagram of the state related to Rule 1.
Fig. 5: Diagram of the state related to Rule 2.
Fig. 6: Diagram of the state related to Rule 3.
Fig. 7: Diagram of the state related to Rule 4.
Fig. 8: Diagram of the state related to Rule 5.
Fig. 9: Diagram of the state related to Rule 6.
Fig. 10: Diagram of the state related to Rule 7.
Fig. 11: Diagram of the state related to Rule 8.
Fig. 12: State-space diagram of a system with one repairable member.
Fig. 13: Transition matrix related to Figure 12.
Fig. 14: Simulation flowchart of repairable three-state system.
Fig. 15: System Availability for different system operation time obtained with both methods.
Fig. 16: Computational time of both techniques.

22
Table 1.
Some recent research (between 2018-2020) related to RAP considering MSS.
Name of the researcher(s) Year
Single or
multi-
objective(s)?
Repairable
components?
The used technique for
evaluating the system’s
availability (reliability)
Essadqi, Idrissi, and Amarir.
[24] 2018 Multi × UGF
Tavana, Khalili-Damghani,
Di Caprio, et al. [25] 2018 Multi √ Markov process
Sharifi, Moghaddam, and
Shahriari [26] 2019 Multi × UGF
Sharifi, Shahriari, and
Zaretalab [27] 2019 Single ×
Technical &
Organizational activities
(TOA)
Sun, Li, and Zio [28] 2019 Multi ×
Considering the
availability’s upper and
lower bond
Hadipour, Amiri, and Sharifi
[29] 2019 Multi √ ---
Sharifi, Saadvandi, and
Shahriari [30] 2020 Single × Recursive algorithm
Xu, Pi, Yang, et al. [31] 2020 Single × Interval-valued UGF
Borhani-Alamdar and Sharifi
[32] 2020 Single √ UGF
Xiahou, Liu, and Zhang [33] 2020 Multi × Evidential network
Sharifi, CheraghDashti
Maljaii, et al. [34] 2020 Single × TOA
Zaretalab, Hajipour, and
Tavana [35] 2020 Single √ UGF
Sharifi and Taghipour [36] 2020 Single × UGF-based method
Du and Li [37] 2020 Single × UGF
Sharifi, Shahriari, and
Khajepour. [38] 2021 Single × ---

23
Table 2.
Indexes, parameters, and decision variables.
Indexes:
𝑖: Counter of pump stations,
Parameters: 𝑆: Number of the system’s pump stations,
𝑛𝑖: Number of pumps of the pump station 𝑖 (redundant pump), 𝜆𝑖1: Semi-failure rate of a working pump in pump station 𝑖, 𝜆𝑖2: The complete-failure rate of a working pump in pump station 𝑖, 𝜆𝑖3: The complete-failure rate of a semi-working pump of the pump station 𝑖, 𝜇𝑖: Repair rate of a failed pump of the pump station 𝑖, 𝑀: Total number of repair facilities, 𝑤𝑖 : Number of functional pumps in pump station 𝑖, 𝑠𝑖 : Number of semi-working pumps in sub-system 𝑖,
𝑚𝑖: The number of repair facilities which are working in pump station 𝑖. 𝑃𝑜𝑖 : Working power of pump station 𝑖,
𝑘𝑖: The minimum required working power for pump station 𝑖, to be considered as an
operational pump station,

24
Table 3.
State definition of the presented instant.
Total working power of
the system
1 2TPo Po Po State
Sy
stem
is
wo
rkin
g
4.0TPo 1: 2,0,0 , 2,0,0 ,
3.5TPo
2 : 1,1,0 , 2,0,0 ,
3 : 2,0,0 , 1,1,0 ,
3.0TPo
4 : 2,0,0 , 1,0,1 ,
5 : 2,0,0 , 0,2,0 ,
6 : 1,1,0 , 1,1,0 ,
7 : 0,2,0 , 2,0,0 ,
8 : 1,0,1 , 2,0,0 ,
2.5TPo
9 : 1,1,0 , 1,0,1 ,
10 : 1,1,0 , 0,2,0 ,
11: 0,2,0 , 1,1,0 ,
12 : 1,0,1 , 1,1,0 ,
2.0TPo
13 : 1,0,1 , 1,0,0 ,
14 : 1,0,0 , 1,0,1 ,
15 : 1,0,1 , 0,2,0 ,
16 : 0,2,0 , 1,0,1 ,
17 : 0,2,0 , 0,2,0 ,
Sy
stem
is
fail
ed
2.5TPo 2,0,0 , 0,1,1 , 0,1,1 , 2,0,0 ,
2.0TPo 2,0,0 , 0,0,1 , 1,1,0 , 0,1,1 , 0,1,1 , 1,1,0 , 0,0,1 , 2,0,0 ,
1.5TPo
1,1,0 , 0,0,1 , 1,0,0 , 0,1,1 , 1,0,1 , 0,1,0 , 0,2,0 , 0,1,1 ,
0,0,1 , 1,1,0 , 0,1,1 , 1,0,0 , 0,1,0 , 1,0,1 , 0,1,1 , 0,2,0 ,
1.0TPo
1,0,0 , 0,0,1 , 1,0,1 , 0,0,0 , 0,1,0 , 0,1,1 ,
0,0,1 , 1,0,0 , 0,0,0 , 1,0,1 , 0,1,1 , 0,1,0 ,
0.5TPo 0,1,0 , 0,0,1 , 0,1,1 , 0,0,0 , 0,0,0 , 0,1,1 , 0,0,1 , 0,1,0 ,
0.0TPo 0,0,1 , 0,0,0 , 0,0,0 , 0,0,1 .

25
Table 4.
Availability and calculation time of two methods for different system’s mission time. System’s mission
time (hours) 100 200 350 450
Availability sim 0.82071 0.82022 0.82005 0.81997 Availability diff 0.81899 0.81986 0.81990 0.81990 Elapsed time sim 16992.00 29373.38 54134.43 69562.19 Elapsed time diff 1591.10 1583.63 2128.11 1663.66
26
Table 5.
The results for 15 sample instants. P
rob
lem
Nu
mb
er
Sy
stem
’s
con
fig
ura
tio
n
Nu
mb
er o
f th
e re
pai
r
faci
liti
es
Nu
mb
er o
f th
e
syst
em’s
sta
tes
System’s availability after 200
hours Elapsed Time (Seconds)
Pro
po
sed
mo
del
Simulation
Pro
po
sed
mo
del
Simulation
Average
of 10
runs
The
standard
deviation
of 10 runs
Average
of 10
runs
The
standard
deviation
of 10 runs
1 [1,1] 1 8 0.74967 0.74990 0.00067 0.02 7926.05 117.25
2 [1,2] 1 17 0.80665 0.80631 0.00213 0.07 10298.10 235.13
3 [1,2] 2 17 0.84450 0.84461 0.00143 0.46 7892.44 211.63
4 [2,2] 3 35 0.96027 0.96039 0.00086 0.34 9894.69 223.35
5 [2,2] 4 35 0.96027 0.96030 0.00121 0.30 10272.08 271.85
6 [1,2,3] 1 229 0.74543 0.74595 0.00325 10.85 22020.66 370.02
7 [2,2,3] 2 535 0.93804 0.93802 0.00125 56.23 23884.42 460.44
8 [2,2,3] 5 340 0.95702 0.95722 0.00083 23.24 18198.22 213.19
9 [3,3,3] 5 1054 0.99046 0.99057 0.00058 229.00 24487.54 323.54
10 [2,2,2,2] 5 1125 0.91653 0.91735 0.00144 353.31 26755.38 424.01
11 [4,2,3,1] 5 2576 0.81986 0.82022 0.00099 1583.63 29373.38 446.53
12 [2,1,3,2] 3 1101 0.81795 0.81781 0.00112 331.12 25265.04 219.00
13 [2,2,1,4] 5 1380 0.81765 0.81790 0.00188 570.06 27372.54 453.53
14 [3,2,3,1] 7 1557 0.81857 0.81903 0.00066 720.97 26510.92 603.98
15 [2,2,1,2,1] 4 1300 0.72271 0.72212 0.00225 582.96 22370.16 313.13

27
Table 6.
T-values and P-Values for comparing two solving methodologies.
Problem
Number
System’s availability
after 200 hours Elapsed Time (Seconds)
T-Value P-value T-Value P-Value
1 1.32 0.219 213.77 0.000
2 -0.50 0.626 138.50 0.000
3 0.24 0.813 117.93 0.000
4 0.44 0.669 140.09 0.000
5 0.08 0.939 119.49 0.000
6 0.51 0.625 188.10 0.000
7 -0.05 0.961 163.65 0.000
8 0.76 0.466 269.59 0.000
9 0.60 0.563 237.10 0.000
10 1.80 0.105 196.91 0.000
11 1.15 0.280 196.80 0.000
12 -0.40 0.702 360.04 0.000
13 0.42 0.684 186.88 0.000
14 2.20 0.055 135.03 0.000
15 -0.83 0.428 220.03 0.000

28
Fig. 1: Recovery treatment process at a desalination plant.
29
Fig. 2: System configuration.

30
Fig. 3: General state diagram for the proposed model.

31
Fig. 4: Diagram of the state related to Rule 1.

32
Fig. 5: Diagram of the state related to Rule 2.

33
Fig. 6: Diagram of the state related to Rule 3.

34
Fig. 7: Diagram of the state related to Rule 4.

35
Fig. 8: Diagram of the state related to Rule 5.

36
Fig. 9: Diagram of the state related to Rule 6.

37
Fig. 10: Diagram of the state related to Rule 7.

38
Fig. 11: Diagram of the state related to Rule 8.

39
Fig. 12: State-space diagram of a system with one repairable member.

40
Fig. 13: Transition matrix related to Figure 12.

41
Fig. 14: Simulation flowchart of repairable three-state system.
Complete failure of a
partially failed
component
The component stands
in the waiting queue
Is a free
repair facility?
The repair starts
Completion of the repair
operation
Is there any other
failed component
in the queue?
The repair facility is idle
End
Operation of functional
components
Occurrence of first event
Is a partially
failed component
completely failed?
Start

42
Fig. 15: System Availability for different system operation time obtained with both methods.
0.81895
0.81915
0.81935
0.81955
0.81975
0.81995
0.82015
0.82035
0.82055
0.82075
100 200 350 450
syst
em's
ava
ilab
ilit
y
system's mission time
Simulation Chapman-Kolmogorov

43
Fig. 16: Computational time of both techniques.
0
10000
20000
30000
40000
50000
60000
70000
100 200 350 450
Co
mp
uta
tio
nal
tim
e
System's mission time
Simulation Chapman-Kolmogorov