an electrochemical study of lead acid battery positive ... · loughborough university institutional...
TRANSCRIPT

Loughborough UniversityInstitutional Repository
An electrochemical study oflead acid battery positive
electrodes
This item was submitted to Loughborough University's Institutional Repositoryby the/an author.
Additional Information:
• A Doctoral Thesis. Submitted in partial fulfilment of the requirementsfor the award of Doctor of Philosophy of Loughborough University.
Metadata Record: https://dspace.lboro.ac.uk/2134/13873
Publisher: c© Simon Webster
Please cite the published version.

This item was submitted to Loughborough University as a PhD thesis by the author and is made available in the Institutional Repository
(https://dspace.lboro.ac.uk/) under the following Creative Commons Licence conditions.
For the full text of this licence, please go to: http://creativecommons.org/licenses/by-nc-nd/2.5/

LOUGHBOROUGH UNIVERSITY OF TECHNOLOGY·
LIBRARY AUTHOR/FILING TITLE
__________ WE-f,S::(t~~_L_~_L _________________ _
------ -- --------------------- -- -- --- ---- - - - ------ -_..- I
ACCESSION/COPY NO.
C \ Vh"'l~"l.. ----------------- ---- --- --- --- ------------ - --- - - --
VOL. NO .
. 1 JUl 1988
3~989
.. 5 JUL '991 /
? ' I 199.
CLASS MARK
(
! 00'1 1927 02
. ~11@111111111111~lllllmllllllilllllllmW


'.
AN ELECTROCHEMICAL STUDY
OF
LEAD ACID BATTERY
POSITIVE ELECTRODES
by
SIMON WEBSTER
Supervisor: Professor N. A. Hampson
A Doctoral thesis submitted in
partial fulfilment of the requirement
for the award of Doctor of
Philosophy of the Loughborough
University of Technology,
September 1986


The work described in this thesis has not been submitted, in full
or in part, to this or any other institution for a higher degree .
.. ~

The thesis describes an electrochemical investigation into the
properties of various lead alloys used in the manufacture of lead
acid battery positive electrodes. The electrochemical results have
been discussed in terms of current nucleation and growth theories.
The morphological aspects of the discharge reaction have been
investigated and theories are presented describing some of the
important influences of various alloying ingredients. It has been
found possible to suggest trends important in the optimisation of
alloy composition for modern lead-acid battery grids. This aspect
is especially relevant to the development of maintenance free
technology.

ACKNOWLEDGEMENTS
I wish to thank Professor Noel Hampson for his supervision and
encouragement over the last three years.
I am also grateful to all the members of the electrochemistry group
for their friendship. I wish to thank in particular Dr. P.J. Mitchell
for his advice and 'useful discussions' on electrocrystallisation
theory.
I would also like to thank Mr. J.1. Dyson for his personal interest
in the project and financial support is acknowledged from Oldham
Batteries Ltd. and S.E.R.C.
My thanks go to Miss A. Hurst for typing this thesis and also to
members of the department's technical staff for assistance during the
project.
Finally I would like to thank my wife Catherine for the support
she has given me throughout this study and especially for her patience
during the thesis 'write-up' period.

CONTENTS
CHAPTER
1.
2.
3.
4.
5.
6.
7.
8.
9.
10.
Introduction
Theoretical Principles
The Theory of the Experimental
Experimental Techniques
The Electrochemical Properties of Solid Lead After Alloying with Calcium, Tin and Antimony
Morphology of Planar Lead Dioxide Electrodes After Continued Potentiodynamic Cycling
The Corrosion of Various Lead Alloys in 5M H2S04
The Electrochemical Properties of Solid Lead-Bismuth Alloys in 5M H2S04
The Electroreduction Processes of Planar and Porous Lead Dioxide on Various Lead Alloy Supports
Final Discussions
References
Appendix
PAGE
1
8
26
48
54
74
79
87
97
111
114
124

A
ao' ar
C
* C
Co' CR
CD
CPixed
CDiffuse
Do
EEl e
E
Ep
E pzc
E!
F
LlG
LlGEl
h
i
io
I p or im
j
k
kb' kf
kO
L
LIST OF SYMBOLS
area of electrode
activity of oxidised and reduced species
capacitance
bulk concentration
concentration of oxidised or reduced species
double layer capacitance
capacitance of fixed layer
capacitance of diffuse layer
diffusion coefficient
equilibrium potential
electrode potential
peak potential
potential of zero charge
polargraphic halfwave potential
Faradays constant
Gibbs free energy
standard Gibbs free energy
height of nuclei
current density or current
exchange current density
peak current
complex number
potential dependent reaction rate constant
potential dependent rate constant for forward and reverse reaction.
standard or intrinsic rate constant
inductance

M
n, Z
N
No
0
q
R
RcT, Rn
Rn' Rsol
R
R
r
t
t m
T
u
V
V
W
x
X
Z
Z'
Z' ,
Cl
n
'" p
rh
molecular weight
number of electrons
number of nuclei
initial number of nuclei
oxidised species
charge on electrode or flux of diffusing species
resistance
charge transfer resistance
ohmic resistance of electrode and electrolyte
G as constant
reduced species
radius
time
time of maximum current
temperature
age of nucleus
volume
voltage
Warburg impedance
distance from electrode
reactance
cell impedance
real part of electrode impedance
imaginary part of electrode impedance
charge transfer coefficient
overpotential
sweep rate
density
potential at various point within double layer

y
------ -----------------------------------------------------------~
angular velocity, angular frequency
fraction of surface covered by growth centres
fraction of surface covered in the absence of overlap

CHAPTER 1
INTRODUCTION
The resistance of lead to corrosion in sulphuric acid solutions
[1] has resulted in it having a wide variety of applications in
electrochemical and metallurgical processes [2]. The three main
uses of lead are: the construction of equipment for the chemical
industry, the anode material in electroprocessing and as the support
grids in the lead acid battery. The manufacture of lead-acid
batteries is now the major consumer of both primary and secondary
lead supplies [2].
Although the lead-acid battery was introduced in the nineteenth
century by Plante [3], it still remains one of the most important
secondary power sources in use today. The historic details of its
discovery and development have been comprehensively described by
Vinal [4]. In terms of the number of units produced per year, the
usage of the lead-acid battery is approximately twenty times as
large as that of its nearest rival, the nickel-cadmium battery.
There are several contributory factors for the success of the lead
acid battery:
It is very versatile providing on instant demand high
or low currents over a wide range of temperatures.
It has good storage characteristics and a long shelf
life, particularly in the dry charged state.
The basic material of construction, lead, is relatively
cheap when compared with nickel, cadmium and silver
- 1 -

which are used in other commercial storage systems.
The relatively low melting point of lead ~27°C) enables
the easy casting and joining of the various metallic
components e.g. grids and terminals.
The greatest disadvantage of the lead-acid battery is its energy
density (weight to capacity ratio) when compared to other secondary
power sources [5], as shown in Table 1.1.
Mass (wh/kg) Volume (wh/l) Cycle life Battery System Practical Theoretical Practical
Lead Acid: 161 . Pasted Plates 20-30 40-60 1200-1500
Tubular Plates 20-35 40-70 (Starter 300)
Nickel Cadmium: 236
Pocket Plates 15-25 25-50 1000-2000
Sintered Plates 25-33 35-65
Nickel Iron 304 20-25 40-70 2000
Nickel Zinc 373 60-80 90-110 200-250 (100% discharge)
Silver Zinc 460 55-120 90-250 10-200
Table 1.1: Average values for the energy density and cycle life of various
battery systems.
- 2 -

Today lead-acid batteries are marketed in a wide variety of
sizes and capacities, ranging from small batteries to units of
several tonnes. The main catagories of the lead-acid battery are:
Starting,lighting and ignition (S.L.I.) batteries, designed
for the internal combustion engine.
Industrial batteries for heavy duty applications e.g.
submarines, fork lift trucks, electric vehicles etc.
Standby power batteries which are maintained in a fully
charged state by the passage of a small charging or 'float'
current for use in telephone exchanges, emergency lighting
etc.
A more comprehensive survey of the lead-acid battery can be found in
a review by Burbank, Simon and Willihnganz [6].
The design of the lead acid battery varies considerably with
the application. However, the basic principles for each application
are the same: the battery consists of a positive electrode of porous
lead dioxide, a negative electrode of 'spongy lead' and an electrolyte
of aqueous sulphuric acid. The active material is supported on a
grid framework of metallic lead alloy (Pb-Sb, Pb-Ca or Pb-Ca-Sn).
In addition to supporting the active material, the grid serves as a
current conductor, the function of which is to maintain a uniform
current distribution throughout the active mass, thus minimising the
resistance of the battery.
The porous active materials are usually derived from a mixture
of lead oxide and lead powder produced from massive lead which has
been mixed into a paste with dilute sulphuric acid. This 'leady oxide'
- 3 -

mixture is pasted onto the metallic grids and then 'cured' and dried
under carefully controlled conditions to produce a mixture of lead
monoxide, lead sulphate and basic lead sulphates. The electrodes
are then formed in dilute sulphuric acid «2M H2S04) which reduces
the paste in the negative plates to 'spongy lead' and oxidises the
paste in the positive plate to lead dioxide. In assembly of the
battery, the positive and negative plates are isolated from each
other by thin sheets of porous insulators called separators, which
are good ionic conductors and excellent electronic insulators.
Many theories have been proposed to account for the reactions
taking place in the lead-acid battery [7-9]. The one which is now
generally accepted [10] is the 'double sulphate' theory' proposed
by Gladstone and Tribe in 1882 [11]. The double sulphate theory
has been confirmed thermodynamically by Craig and Vinal [12], Beck
andWynne-Jones [13] and Barrett [14]. A complete derivation is given
by Vinal [4]. The double sulphate theory states that lead sulphate
is formed at both positive and negative plates as part of the process
of discharge. Gladstone and Tribe [11] also found that the electrolyte
became more dilute during discharge,thus proving that sulphuric acid
acts both as an electrolyte and reactant. The charge and discharge
reactions are shown in Figs. 1.1 and 1.2 respectively. The overall
reaction of the lead-acid battery can be written as:
E=+2.04V
discharge ::;",===='" 2PbS04 + 2H20 charge
The behaviour of the positive plate of the contemporary lead-
acid battery is generally thought of as being the cycle lifetime limiting
- 4 -

: Negative Plate; , Electrolyte 'Positive Plate: , , , ---------------~-------------------------------,
, ' ,
Final Products of Discharge ~---------!1t~~~-------~11~-----~--:~i~~-------.: ; • • I
Ionization Process ,Pb++ SO -; 2H+ 40H- 2H+' SO -- Pb++ ,
p""" Prod.", by '.<reo, ~-~~-~ -:---,-;- --:--- -:--- : -'--:-}~-~;-i : I P.b++++ : :------ --------,- ----ZH20 ·~-------1-----·,
Original Materials Restored; Pb 'H SO H ~~O . PbO I , • 2 4 2:" 4: 2 I ------------------------------------------ ______ 1
FIG. 1.1. THE CHARGE REACTION OF THE LEAD-ACID BATTERY,
·~--~------------i---------------~---------------~ • I
, Negative Plate: Electrolyte' Positive Plate: I ,
·~---------------~---------------4-----__________ ~ I • j •
Original Materials Used: Pb :2H250,+ and 2HzO' Pb02 :
~-------- ------+-1i----------~-~--t-----------~ I l I
Ionization Process ,::-2--e--+--Pb-::---i,F~'-t~~lj,'--~~~~±pPb~+~+~~-~-2-~-: Current Producing Process L '~
D' h ~--------[Pb-5-0----riiii:-~:~~-:~~~~------ir ------:
Final Products of BC arge, 4 , • I~ , I ,2HZO; Pb504 . ------------------------------------------------_.
FIG. 1.2. THE DISCHARGE REACTION OF THE LEAD-ACID BATTERY,

component [6]. Much work has been carried out to improve character
istics of this electrode within the framework of the need to improve
the battery in general [15]. Over the last 25 years or so, gains of
about 50% in energy and power density have been achieved with no
significant loss in cycle life. One of the most outstanding
developments in the last decade has been the reduction in the
antimony level from 14% and ultimately the replacement of antimony
as the main grid alloying ingredient. Modern non-antimonial alloys
employ calcium and tin as the added ingredients, whereas low antimonial
alloys generally contain less than 2% antimony.
Lead antimony alloys were introduced for use in battery grid
construction by Sellon in 1882 [16]. These additions of antimony,
have traditionally been used to improve .hardness, strength and
castability of battery alloys. It is widely known that antimony in
the positive grids extends the service life by improving the capability
to resist the effects of deep cycling [17]. This property is believed
to be due to the lead antimonial alloys promoting a corrosion layer
which has good adhesion to the active material and an active material
structure which imparts mechanical strength giving good cycle life
properties [17]. However, antimony does have a prime electrochemical
disadvantage [r8];this is shown schematically in Fig. 1.3. Under
anodic attack of the grid, during overcharge, antimony can pass into
solution (in the +5 oxidation state); it can then be either readsorbed
back onto the surface of the positive active mass or transferred via
the electrolyte to the negative grid. Ruetschi and Angstadt [19]
proposed the following mechanism for the dissolution of antimony
from the positive electrode:
- 5 -

SPb02 + 2Sb + SH2S04 + 2H+;;;",,===-- 2Sb02 + + SPbS04 + 6H20
The antimony which has been transferred from the positive grid is then
reduced (+3 oxidation state) and deposited on the negative electrode
surface. This deposited antimony has a lower hydrogen evolution
potential than lead and therefore gassing will occur more readily,
causing significant water loss from the battery. With the advent of
sealed 'maintenance free' batteries the problem of gassing and water
loss have had to be minimised. This has been achieved by replacing
antimony as the main grid alloy ingredient with various alloying
materials. The most successful ones have been based on lead alloys
containing calcium, tin, (aluminium and magnesium) [20]. These
modifications have overcome the hydrogen evolution problems and
proved satisfactory for use in 'float' 'service. However, for use in
batteries which need a deep cycling capacity the removal of antimony
has engendered poor cycle lives.
With these associated cycle life problems of the Pb-Ca system,it
was pertinent to investigate the so-called 'alloy effect' on the cycle
life of the positive electrode. This would give valuable information
on the beneficial properties of antimony and aid the discovery of
new and better grid alloying ingredients.
A substantial amount of work has been carried out on the effect
bismuth has on the performance of the lead acid battery [21]. This
is not surprising since bismuth is a major contaminant of many
sources of lead ores and at present is removed by the use of an
expensive process [1]. There is however, a conflict o.f opinion in the
literature over the effects bismuth has on the physical, mechanical
and cycle life properties of the alloys used in modern battery grids.
- 6 -

Posiltve plo le Stporotor Neoallvt plait
SbH) I \ ......
Corrolion DillulIon I" Sb Sb .. SI:> ( \l) - ... 5 b ('Ill - , \ / /
// \,' " _ / Grid allay
Grid alloy /' ' Charo_ " O •• rehoro·, /
'/ /' \ ' O/Cond°z / /...0' I corrosion
/ / I "harO' ' / / "" ,// 1/ ,
'" Adsorption Ml9,otion ----. \ Sb01T __ -------Sb(m)--------Sb([ln-~SbO .. Sb
Adsorbed Oeposiled
on Pb02
- - Malortly 01 dlnolvtd antimony
Anllmony pOlsonin9
FIG, 1,3, THE DISSOLUTION AND MIGRATION OFANTIMONY FROM THE POSITIVE ELECTRODE,

One group of workers has found it beneficial [22-24] whilst other
workers have found it to be detrimental, stating it should be removed
completely at all costs (25,26]. The battery industry has tended to
believe the latter, therefore lead alloys used in grid construction
are usually free from bismuth contamination. This difference of
opinion has led us to extend our investigation into the 'alloy effect'
on the positive electrode of the lead-acid battery to include bismuth
in order to clarify this situation.
In this thesis"work is described which was carried out in order
to investigate the electrochemistry of pure Pb (Koch-Light 99.999% pure)
and various pertinent ,lead alloys used in the manufacture of 'maintenance
free' batteries. A series of binary lead-bismuth alloys has also been
investigated. The results are discussed in terms of their relationship
to the cycle life of the positive plate of the lead acid battery.
- 7 -

CHAPTER 2
THEORETICAL PRINCIPLES
2.1 INTRODUCTION
Electrochemists are constantly concerned with the processes and
factors affecting the transport of charge across interfaces between
different chemical phases. In general, one of the two phases is the
electrolyte in which charge is usually carried by the movement of
ions, and the other is the electrode where charge is usually carried
by electronic movement. In this particular case the electrode is
lead dioxide and the electrolyte is dilute sulphuric' acid.
There is a three dimensional transition region between the two
phases where the properties have not yet reached the properties of
the bulk of either phase. This region is called the electrode/
electrolyte interphase and any entity which moves from the electrode
into the solution or vice ,versa, traverses this interphase [27].
2.2 THE STRUCTURE OF THE ELECTRODE/ELECTROLYTE INTERPHASE
The earliest model proposed to describe this interfacial region
was postulated by Helmholtz and Perrin [28] in 1879. It was a very
simple concept, where excess charge on the surface of the electrode
is neutralised by an equal number of opposite charged ions (Fig. 2.1).
This concept of two layers of opposite charge is the origin of the
term 'electrical double layer' and although the situation in reality
- 8 -

FIG. 2.1. HELMHOLTZ MODEL OF THE DOUBLE LAYER.
VARIATION OF POTENTIAL WITH DISTANCE THROUGH THE INTERFACE PREDICTED BY THE HELMHOLTZ MODEL.

is more complex,the original name still remains. The Helmholtz model
of the double layer is equivalent to a simple parallel plate capacitor,
and the following assumptions have to be made if the model is to be
valid:
a) The separated charges at the interphase are in electrostatic
equilibrium.
b) There is no transfer of charge in either directionocross
the interphase with changes in electrode potential.
c) The charge in the solution near to the electrode interphase
alters with variation in electrode potential.
These assumptions imply that the electrical behaviour of the
double layer should be purely capacitive and have no parallel resistive
components. Electrodes which obey the above model are known as
'ideally polarisably' electrodes. The classic example is the mercury
electrode in I mol dm- 3 KCl.
Gouy [29] and Chapman [30] modified the Helmholtz model by
realising that in an electrolyte, ions are free to move and are
subject to thermal motion. The Gouy-Chapman model predicts that the
greatest concentration of excess charge is adjacent to the electrode
where the electrostatic forces are most able to overcome the thermal
processes, and the concentrations decrease at greater distances, where
the electrostatic forces are weaker (Fig. 2.2). There is a serious
defect in the Gouy-Chapman model as it treats the ions as point
charges approaching to within very small distances of the electrode
surface. This leads to very high values for the charge concentration
in the immediate neighbourhood of the interphase. The theory does
predict that capacitance varies with potential, but it has been found
- 9 -

I
FIG. 2.2. GOUY - CHAPMAN MODEL OF THE DOUBLE LAYER.
VARIATION OF POTENTIAL WITH DISTANCE THROUGH THE INTERFACE PREDICTED BY THE GOUY - CHAPMAN MODEL.

E
COMPACT I
T DIFFUSE
FIG. 2.3. THE STERN MODEL. D IS THE DIELECTRIC CONSTANT OF THE COMPACT 'c' AND DIFFUSE 'n' LAYERS.

that there are significant deviations between the calculated and
experimental values for the double layer capacitance.
In 1924 Stern [31] proposed a theory of the double layer based on the
G/C model which, in majlY respects, has a high level of agreement with the
experimental results. This modified approach provides corrections in
the form of an adsorbed layer of ions which have finite sizes and approach
within a certain critical distance of the electrode surface
(Planar tayer orHelhomltz layer), while the remainder of the ions are
distributed in a diffuse layer which extends from the plane of
closest approach to the bulk of the solution. ('diffuse layer' or
'Gouy layer') (Fig. 2.3).
Grahame [32], in postulating a modified Stern model which takes into
account the presence of dipoles due to water molecules at the
electrode surface, stated that at least three layers must be
considered when describing the interphase. These were: the inner
Helmholtz plane, the outer Helmholtz plane and the diffuse layer.
The inner Helmholtz plane consists of specifically adsorbed ions
which have lost some of their water of hydration and so are closest
to the electrode surface; the outer Helmholtz plane contains normal
hydrated ions at their distance of closest approach to the surface
(Fig. 2.4). The diffuse layer is as previously described. The model
of the double layer can therefore be treated as two capacitors
connected in series:
1
CDiffuse
where CD = capacitance of Double layer
CFixed = capacitance of Fixed layer
C = capacitance of Diffuse layer. Diffuse
- 10 -
(2.1)

o o
FIG. 2.4. GRAHAME MODEL OF THE DOUBLE LAYER.
~,
VARIATION OF POTENTIAL WITH DISTANCE THROUGH THE INTERFACE PREDICTED BY THE GRAHAME MODEL.

FIG. 2.5. THE COMPLETE MODEL OF THE ELECTRICAL DOUBLE LAYER.
COMPACT LAYER
I I I I '~Solvent : I Molecules
.... I I
+
+
+ DIFFUSE LAYER
Inner /" Helmholtz Plane
~SolVated Cations
/
+
+
f-i-___ Specifically Adsorbed Anions
I I
~outer Helmholtz Plane
+

Equation 2.1 shows that as the concentration of the electrolyte
becomes more dilute, the value of the diffuse layer becomes
significantly larger than the capacitance associated with the fixed
layer. Hence CD becomes virtually independent of CFixed' At very
low concentrations a sharp minimum is obtained on a CD Vs. potential
plot. This minimum is associated with the point of zero charge
(P.Z.C.) for the electrode.
In 1963 this model was further improved by Devanathan, Bockris
and MUller [33] who considered the dielectric properties of the species
of the inner Helmholtz plane and outer Helmholtz plane. They proposed
that adsorbed solvated cations remained outside a layer of strongly
orientated solvent dipoles. The inner solvent layer is penetrated
by specifically adsorbed anions. The water molecules are thought to
be adsorbed with their negative poles pointing either towards or
away from the electrode surface, depending on the potential. This
is now the generally accepted model used to describe the double layer
and is shown in Fig. 2.5.
2.3 THE CHARGE TRANSFER PROCESS
Electrode processes are heterogeneous chemical reactions which occur
at the electrode.-electrolyte interphase and are accompanied by the
transfer of electric charge through this region. The reaction involves
the transfer of electrons from one substance to another and can be
represented ,by the general redox equation below:
o + ne :;;=:. R (2.2)
- 11 -

where 0 = oxidised species
R = reduced species
kf = rate of forward reaction
kb = rate of reverse reaction.
The dependence of this reaction on potential can be better
understood if transition state theory is considered. If the free energy
profile is as shown in Fig. 2.6 then at an electrode potential of
zero volts, ~Gt and ~Gi will correspond to the activation energies oc oa
of the forward and reverse processes. If the potential is shifted
to a new potential of value E, a change in the relative energy of the
electron resident on the electrode by -nFE will result. The '0 + ne'
curve will move up or down by that amount. The dashed line in Fig. 2.6
shows the effect for a positive potential shift. The change in
chemical energy of the system must equal the electrical energy
produced and therefore the change in Gibbs free energy is given by:
~G = -nFE (2.3)
and at equilibrium the standard Gibbs free energy change "ill be
given by:
= -nFEa e (2.4)
where Ea is the standard equilibrium potential. For the reaction e
taken to completion, the Gibbs free energy change for the process
left to right is given by the Vant Hoff isotherm
(2.5)
Now substituting for ~G and ~G9 gives:
- 12 -

11 - 0) of!! --r---------
o + ,,~
--- -/----- - --I
f.' • /;,/1
/ /
/ ---------I M;;',
R
RNCtK>n coordinate
FIG. 2.6. A DETAILED DIAGRAM OF THE EFFECTS OF A POTENTIAL CHANGE ON THE FREE ENERGIES OF ACTIVATION FOR OXIDATION AND REDUCTION.
Electrode of area A x=O
x
x+dx
FIG. 2.7. A SCHEMATIC DIAGRAM SHOWING PERPENDICULAR DIFFUSION NEAR AN ELECTRODE SURFACE.

RT E = E: + - In {a/aR}
nF (2.6)
which is the Nernst equation and predicts the potential of the electrode. e
E is a constant at a given temperature and pressure and is called· the e
standard equilibrium potential. e
E is defined by the magnitude of the e
potential when the activities of the reacting species are unity.
As with any chemical process, it is necessary to consider both the
thermodynamics and the kinetics of the electron transfer process.
Any theory of electrode kinetics must predict the Nernst equation for
corresponding conditions.
Returning to the free energy profile in Fig. 2.6. After. the
shift in potential from the equilibrium potential, the energy required
for the forward process is greater than that for the reverse process.
It is obvious that it is necessary to introduce a charge transfer
coefficient, a, to describe the way the energy is split between
the two processes. (a can range from zero to unity, typically it is
0.5 for a reversible reaction). For the forward reaction, in the
polarised state:
+ anFE
Similarly, for the backward reaction:
flGf - (l-a)nFE oa
(2.7)
(2.8)
Now, assuming that the rate constant kf and kb have an Arrhenius form,
then the forward and reverse reactions can be expressed as:
k = A exp 1- fiG I f f RT
(2.9)
- 13 -

- ---------------------------------------------------------------------------
and (2.10)
Expanding these equations in terms of the activation energies in
equation 2.7 and 2.8
kf = [-~G+ ) Af exp R;c exp [ -a:;E) (2.11)
and
kb [ -~Gta) [ (l-:~nFEJ = '\ exp exp
RT (2.12)
As can be seen, the above terms (Eqn. 2.11 and 2.12) have a potential
dependent and potential independent term. The potential independent
terms are equal to the rate constant at E=O and are designated by 9 9
kf and kb . Hence:
9 [ -a:;E) kf = kf
exp (2.13)
and
9 [(l-a)nFEl kb = kb exp
RT j (2.14)
* * In electrochemica1 kinetics, Co and CR
are used for bulk
concentrations and CR(x,t) Co(x,t) are used to denote concentrations
at distances, x, and times, t, away from the electrode surface. At
the standard equilibrium potential, when the electrode interface is at
equilibrium with a solution then both reactions occur at the same
rate.
- 14 -

Hence:
(2.15)
and the following must be true
* * kfCo = kbCR (2.16)
and
kf = kb = 9
k (2.17)
The rate constant k9
is known as the standard or intrinsic rate
constant. The potential independent term can therefore be removed
from equations 2.13 and 2.14. Hence:
kf = k9 exp [-anF~:-E:)j (2.18)
and
kb = k9 exp [(l-a)n::E-E:)j (2.19)
In electrochemistr~ a current is more meaningful than a rate constant
as it can be measured directly. Now:
i = nFkC (2.20)
but only the net current is measured:
(2.21)
- 15 -

I
Therefore equating equation C2.18) and C2.l9) in terms of current:.
i nFk9 - [-anpCE-E:)] C -
[Cl-ct)nFCE-E:) ) CRCo,t)] C2.22) = exp exp
RT o(o,t) RT - .
which is known as the Butler-Volmer equation. However, if the
solution is well stirred or the current density low, so that the surface
concentration does not differ appreciably from the bulk value, then
equation C2.22) can be simplified to:
[ r -anF (E -E:Jj
expl RT
exp [
(l-a)nFCE-E:)
RT ]1 (2.23)
Since also under these conditions E9 = E then overpotential is e eq
given by:
E - E = n ,eq
and the exchange current density by:
substituting for io in equation (2.23) gives:
. [ [-"oF"] [ Cl-Cl)nFnJ
1 i = 1 exp exp
o RT RT
which is known as the Erdey-Gruz and Volmer [34] equation.
C2.24)
C2.25)
C2.26)
Under equilibrium conditions, when the forward rate is equivalent
to the backward rate:
- 16 -

~ nFk Co(o,t)
9 nFk CR(o,t)
because no net current flows at equilibrium:
* Co(o,t) = C
0 (2.28)
* C R( 0, t) = CR (2.29)
substituting into equation (2.27) gives:
(2.30)
Taking logs of both sides of equation (2.30) and rearranging gives:
E e
* RT C = E9 + - In -..£
e * nF CR
(2.31)
(2.27)
Equation (2.31) is equivalent to equation (2.6) if the concentrations
* * Co and CR are replaced by activities. The kinetic treatment is shown
to be consistent with the thermodynamic treatment. By definition,
the exchange current density is given by the rates of the forward
and reverse process at equilibrium:
(2.32)
Under these conditions of balanced Faradaic activity
[ -cmFn~ exp RT
(2.33)
- 17 -

raising equation (2.31) to the power -a gives
[ -anFnJ _ [<j_a
exp - -. RT eR
(2.34)
which on substitution into equation (2.33) gives
(2.35)
The exchange current density is therefore proportional to k9 . k9
can be simply interpreted as a measure of the kinetic capacity of
a redox couple. A system having a large k9 will achieve equilibrium
quicklY whereas a smaller k9 will take longer.
For practical purposes, it is often convenient to consider the
limiting behaviour of the Erdey-Gruz and Volmer equation (2.26):
a) Large Overpotentials CTafel behaviour)
For overpotentia1s greater or equal to 100 mV the following
assumptions are true:
(2.36)
and if the electrode is sufficiently polarised then if » ib and
(2.37)
(2.38)
- 18 -

Taking logs of both sides of Equation (2.38):
anFn lni = lnio
RT
rearranging this equation gives the cathodic form:
RT RT n = -- lni - -- lni
cmF 0 anF
and for the anodic form:
RT RT n " lnio + lni
(l-a)nF (l-a)nF
(2.39)
(2.40)
(2.41)
The above equations (2.40) and (2.41) are known as the Tafel relation-
ship [35].
b) Low Overpotentials: (1nl ~ lOin mY)
x For small values of x, the exponent e , can be approximated as
1 + x; hence for sufficiently small overpotentials, n, (~lO/n mY)
equation (2.24) can be written:
i = i [fl - anFn~ fl + (lR~a)nFn~J
0 RT (2.42)
Hence:
nFn i " -i
o RT (2.43)
- 19 -

which shows that the current densit~ is linearly related to over
potential near the equilibrium potential. Rearranging equation
(2.43) gives:
i o
-RT i = -- (2.44 )
nF n
The ratio n/i has the dimensions of resistance and is often called
the charge transfer resistance Rct
.
Rct = RT 1
nF i o
(2.45 )
This parameter can be evaluated directly in some experiments, and
it serves as a convenient index of kinetic facility. For a very a
large k , it clearly approaches zero.
2.3 MASS TRANSPORT PROCESSES
As stated in Chapter 2.2 a redox reaction occurring at an
electrode surface can be represented by:
o + ne (2.46)
and can be considered to consist of the following processes:
i)
H)
Hi}
o electrode
o - R . electrode+ne electrode
R ->-electrode ~ulk
- 20 -
(2.47)
(2.48)
(2.49)

The redox reaction can be controlled either by the rate of availability
of 0bulk arriving at the electrode surface (equation 2.47), or by the
rate of electron transfer (equation 2.48). These processes are
said to be mass transport controlled or charge transfer controlled
respectively. Sometimes neither of the above processes i~ as slow
as a chemical transformation involving the electroactive species, in
which case the chemical transformation is the rate determining process.
The three modes of mass transfer which are normally encountered
are migration, convection and diffusion.
i) Migration
Mass transfer by migration is the result of the forces exerted
on charged particles by an electric field. (This is negligible with
excess electrolyte).
ii) Convection
Natural or free convection will always occur spontaneously in
any solution undergoing electrolysis. This convection arises as a
result of density differences which develop near the electrode and
may also originate from thermal or mechanical disturbances. Forced
convection can be caused by stirring, rotating the electrode, bubbling
gas or pumping the electrolyte etc.
iii) Diffusion
Whenever concentration differences are established diffusion will
exist. A concentration gradient is formed as soon as electrolysis is
- 21 -

initiated; diffusion will occur to some extent in every electrode
reaction.
The investigation of the mechanism and kinetics of electrode
processes is normally undertaken with solutions containing a large
excess of base electrolyte where the migration of electroactive
species is unimportant and where the diffusion processes are well
defined i.e. using unstirred solutions or using forced convection which
may be described exactly. In both of the above examples the experi-
ment is carried out so that we may assume that mass transport in
only one direction, that ~s perpendicular to the electrode surface,
is important.
When considering a planar electrode immersed in an electrolyte
undergoing a redox reaction according to equation (2.46), the number,
N, of molecules of 0, which diffuse past a given area, A (cm2) in a
time dt, is proportional to the concentration gradient of the diffusing
species.
dN -= 0 Adt 0
de o
dX (2.50)
Equation (2.50) is known as Fick's first law and is a simple model that
describes diffusion to a plane electrode, assuming that the electrode
is perfectly flat and of infinite dimensions. The left hand side of
h . 1 dN. k h fl d· h b f t e equat10n, A dt 1S nown as t e ux, q an 1S t e num er 0
molecules diffusing through a unit area per unit time. 00 is the
diffusion coefficient. Rewriting Fick's law gives:
I dN - - = flux = q = A dt
o ae o o(x, t)
ax
- 22 -
(2.51)

However, during electrolysis the concentration of 0 in the volume
element, dx (Fig. 2.7) decreases.
d.C o (X, t)
at = [Onumbe: of moles _ numb~r of mOlesJ
enter1ng leav1ng
in time, t
dC q (x+dx) - qx o(x, t) =
at dx
C aq o(x,t) = as dx + OQ
at ax
From Fick's first law it is known that:
ae q = D o(x,t)
o ox
therefore differentiating with respect to x gives
dq -= dx
s· . and substituting for dx 1n equat10n (2.54) gives:
Co(x, t) =
at
(2.52)
(2.53)
(2.54)
(2.55)
(2.56)
(2.57)
This equation is known as Fick's second law and defines how Co varies
with time. A solution of this equation (2.54) under a given set of
- 23 _

boundary,conditions enables us to determine Co(x,t), and from this
determine the amount any'time after initiation of electrolysis.
The boundary conditions for the solution of (2.57) are:
a) Co(o,t) = 0 at t > 0 (2.58)
* b) Co(x,t) -> Co' as x ..... '"' (2.59)
* c) C o(o,t) = C at t < 0
0 (2.60)
* where Co is the concentration of 0 in the bulk and Co(o,t) is the
concentration at the electrode surface.
The solution of this equation is complicated [35] but leads to
the exact form of the i-t transient.
! * nFDo Co 1=_, __ _ (2.61)
This equation (2.61) is the Cottrell equation and states that the
diffusion limited current of a planar, stationary electrode is
inversely proportional to the square root of time.
2.4 POROUS ELECTRODE THEORY
When lead is placed in sulphuric acid solutions it corrodes to
form Pb2+ ions; these then combine with SO~- ions to form lead sulphate
[36-37]. Lead sUlphate is extremely insoluble and forms a non-conduct-
ing (impedance ~ 1010 Q. cm-I) surface film. This conversion involves
an increase in volume (~150%) giving a densely packed but thin film of
lead sulphate. When an anodic current is applied this equilibrium is
perturbed and as the potential increases, lead dioxide is formed
- 24 -

(charging process for positive plate). This is ·followed by a decrease in volume
(~50%) which leads to a porous structure. The performance of the
porous lead dioxide electrode is thought to be determined by the
following factors [38):
i) The amount of active material
ii) The thickness of the electrode
iii) The rate of discharge
iv) The temperature
v) The quantity and concentration of the electrolyte
vi) The porosity
vii) The design of the electrode
viii) The previous history of the electrode.
The task of modelling the porous electrode to account for all
these factors is enormous, and at best the model is a simplified
mathematical expression taking into account the kinetic and transport
phenomena occurring at the electrode. Work on such mathematical
modelling has been reviewed by a number of authors [39-42]. The
majority of models use a one dimensional approach where the pore
geometry is ignored. This representation is correct when the distances
over which there is a variation of concentration and potential is
large, compared with the dimensions of the pore system.
- 25 -

CHAPTER 3
THE THEORY OF THE EXPERIMENTAL TECHNIQUES
3.1 LINEAR POTENTIAL SWEEP TECHNIQUES AND CYCLIC VOLTAMMETRY
These techniques involve the application of a linear potential
time waveform to an electrode, with the observed current being
recorded as a function of the applied potential. The simplest of
these techniques is linear sweep voltammetry (L.S.V.) and involves
sweeping the electrode potential between the limits El and E2 at a
known sweep rate, v, before halting the experiment, (Fig. 3.1). If
the sweeps are repeated continuously the technique is known as cyclic
voltammetry. In this case the waveform is initially the same as in
L.S.V., but on reaching, E2, the sweep is reversed rather than
terminated (switching potential). Cyclic voltammetry was first
introduced by Matheson and Nichols [43] and the fundamental equations
which describe linear sweep/cyclic voltammetry have been developed
by Delahay [44], Shain [45-46] and others [47-50]. These techniques are
used to elucidate data on reaction mechanisms, charge transfer processes
and other complicated electrode reactions.
During the potential sweep the current is recorded. The plot of
current as a function of potential is known as a voltammogram (Fig. 3.1).
The basic feature of a voltammogram is the formation of a current peak
at a potential characteristic of the electrode reaction taking place.
The position and shape of the current peak obtained depends on many
factors such as sweep rate, electrode material, temperature, solution
- 26 -

E
I I P
E
(
/ /
/
/ /
/ /
/
, / , / , / , / V
t
FIG. 3.1. POTENTIAL PROFILE AND CURRENT RESPONSE FOR A LINEAR POTENTIAL SWEEP.
E

composition and the concentration of the reactants. Slow sweep
rates are used to study steady state reaction whilst fast rates are
useful for detecting the existance of short lived intermediates.
Only the linear potential sweep technique can give accurate kinetic
parameters because the equation'derived applies only if there are'no
concentration gradients in solution before the commencement of the
sweep. Cyclic voltammetry causes complex concentration gradients to
appear near the electrode surface, hence this technique is best
suited for identifying steps in the overall reaction, and new species
which occur during electrolysis.
3.1.1. Reversible Reactions
Reversible reactions in electrochemistry are reactions where the
rate of electron transfer is significantly greater than the rate of
mass transport. Under these conditions the peak current density is
given by the Randles - Sevcik equation:
(3.1)
where n = number of electrons transferred in the overall process
D = diffusion coefficient (cm2s-1) o
v = sweep rate (Vs- 1)
* C = bulk solution concentration (mol cm- 3) o
Ip = peak current density (A cm-2)
Thus peak current density is proportional to the concentration of
electroactive species and to the square root of the sweep rate and
the diffusion coefficient. The criteria for reversibility have been
shown to be:
- 27 -

1 t.Ep = E A E C = 59/n mV p p
2 lE p Ep/21 = 59/n mV
3 IIA/ICI = 1 p P
4 Ip <X)
5 E is independent \) p
Table 3.1. Diagnostic test for the reversibility
of electrode processes.
3.1.2. Irreversible Processes
For an irreversible process the rate of electron transfer is
insufficient to maintain the surface equilibrium. The peak current
density is given by:'
I = -(2.99 x 10⁵) n(CI n )! Co' D! ) at 25°C p a Cl 0 (3.2)
where: n is the number of electrons transferred up to and including Cl
the rate determining step.
For a reversible system E was independent of sweep rate but p
for the irreversible case Ep is found to vary with sweep rate as
shown below [45].
2.3 RT Ep = k + ---
2C1 n F a Cl
log \) (3.3)
- 28 -
where: RT
k = Ea + - __ e
~ n F a ~
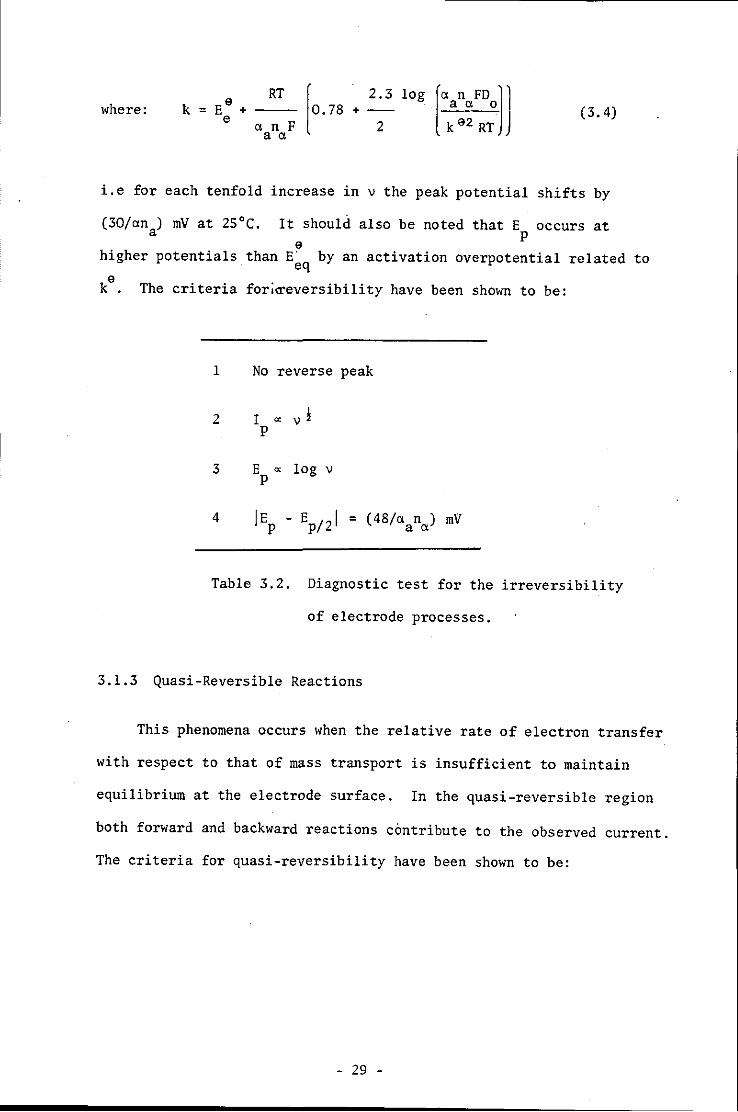
(3.4)
i.e for each tenfold increase in v the peak potential shifts by
(30/~n ) mV at 25°C. It should also be noted that E occurs at a p
a higher potentia1s than E' by an activation overpotentia1 related to eq
ka
. The criteria for;~eversibi1ity have been shown to be:
1 No reverse peak
2 I " v ! p
3 E " log v P
4 IEp - Ep/21 = (48/~an~) mV
Table 3.2. Diagnostic test for the irreversibility
of electrode processes.
3.1.3 Quasi-Reversible Reactions
This phenomena occurs when the relative rate of electron transfer
with respect to that of mass transport is insufficient to maintain
equilibrium at the electrode surface. In the quasi-reversible region
both forward and backward reactions contribute to the observed current.
The criteria for quasi-reversibility have been shown to be:
- 29 -

1 I increases with vI but not proportional to it p
2 11 A/I Cl = 1 provided = p p ~c ~A = 0.5
3 6E is greater than 59/n mV and increases with increasing v p
4 a E shifts positive with increasing v
p
Table 3.3. Diagnostic tests for quasi-reversible electrode
processes.
3.2. A.C. IMPEDANCE METHOD
This method is used to evaluate kinetic parameters related to
the electrode undergoing study. With this technique it is possible
to examine simple charge transfer processes and more complex reactions
involving specific adsorption of reactants or products, as well as
chemical reactions preceeding or following the charge transfer process.
Electrochemical interphase, such as the surface of an oxidised
metal electrode can be viewed as combinations of passive electrical
circuit elements i.e. resistance, capacitance and inductance. For
these elements, Ohm's law will apply for an A.C. signal as long as the
resistance is replaced by appropriate expression for reactance, X, of
the passive element in question.
v = i X peak peak (3.5)
The reactance of a capacitor or an inductor can be expressed in several
forms, the most convenient 'are those using complex numbers:
- 30 -

XR
= R
1
Xc = jwC
XL = jwL
where: w = 211f
R = resistance
C = capacitance
L = inductance
(3.6)
(3.7)
(3.8)
This notation makes it possible to represent any reactance or
the impedance of a combination of reactances, as a vector in the real
and imaginary plane.
An impedance, Z, can be completely defined by specifying the
magnitude I Z I and the angle 4> its vector makes with the real posi ti ve
axis or alternatively, by specifying the magnitudes of its real,
ZI, and imaginary, Z11, components.
ZI = Z cos 4> (3.9)
.Zl1 = Z sin 4> (3.10)
or in complex number notation
Z=Zl+jZl1 (3.11)
Since the above reactance expressions contain, w the angular frequency
of the applied waveform, the magnitude and phase angle of the impedance
- 31 _

---------
I
COL
RSOL.
W
RE
"
FIG. 3.2. RANDLES TYPE EQUIVALENT CIRCUIT INCLUDING WARBURG COMPONENT.
N .., I
RSOL
L _____ . __ .. __ .
,
" . ~ , ,
, , , , ,
\ . RE + RSOL
z'
FIG. 3.3. THE COMPLEX PLANE (SLUYTERS PLOT) RESPONSE FOR FIG. 3.3.

vector representing the response of the circuit containing the
reactive ~lements will vary as lW' varies.
In order to appreciate the variation of the electrochemical
impedance with.frequency, it is convenient to consider a hypothetical
equivalent circuit; a combination of electrical circuit elements
that behave in a similar manner to the electrode. Randles [51]
proposed an equivalent circuit and this has been found to have a
wide application in many electrochemical systems. The equivalent
circuit is shown in Fig. 3.2 and the resultant behaviour is shown
in terms of a Nyquist diagram in Fig. 3;3. (Sluyters plot).
The resistance, R l' represents the solution and developed so
product on the electrode, the parallel combination of the resistor,
~, and the capacitor, Cdl , represent the reacting interphase. Cdl
is the electrochemical double layer capacitance (Chapter 2.1) resulting
from adsorbed ions and water molecules. RE is the charge transfer
resistance. In the Nyquist diagram in Fig. 3.3 the horizontal axis
represents the real part of the cell impedance i.e. the resistive
component, and the vertical axis the imaginary component, the
capacitive reactance. At high frequencies (>10 kHz) the capacitor
Cdl conducts easily, and effectively shorts out RE; only the effect
of the solution and film resistance R I remains. RIcan usually be so so
measured in aqueous medium by taking a measurement at 50 kHz [52].
As the frequency decreases, Cdl conducts less and less and the response
follows a semicircle. At low frequencies (as d.c. is approached) the
capacitor ceases to condu~t and the cell impedance becomes the sum of
Rsol + RE· This corresponds to the right-hand intercept on the diagram.
Most systems are not as simple as this and effects due to concentration
in solution are usually present. To account for these it is necessary
- 32 -

to include an additional circuit element, W in series with RE as
shown in Fig. 3.2. This additional element, the Warburg impedance,[53]
describes the impedance of the concentration and diffusion related
processes. This Warburg impedance is represented on a Nyquist diagram
or complex plane plot by a straight line at 45° to the axis. At high
frequencies the term is small, since the Warburg impedance describes
a mass transfer process involving ionic diffusion; consequently it
is observed only at low frequencies. The complete response of a
Randles type equivalent circuit including a Warburg component is shown
in Fig. 3.3.
3.3. POTENTIAL STEP ~ffiTHOD
In this method of perturbation, the potential of the working electrode
is changed instantaneously and the resulting current recorded as a
function of time as the system relaxes to the steady state. The rate
controlling mechanism can either be the diffusion of the electroactive
species to the surface or a solid state reaction involving the
incorporation of a species into the lattice.
3.3.1. Diffusion control
When the rate determining step is the diffusion of the electro
active material to the electrode surface the current-time transient
appears as a sharp current response followed by a decay. This is
the result of the depletion of the electroactive species near the
electrode surface.
At high overpotentials, electron transfer is fast and the current
is always determined by the rate of diffusion. The whole transient
- 33 -

obeys the Cottrell equation and gives a linear i Vs t-! relationship
(Chapter 2.3).
At low overpotentials where electron transfer and diffusion
occur at similar rates, it is possible to show that at long times:
and at short times:
* i = nFk C co
3.2.2. Electrocrystallisation
(3.12)
(3.13)
As stated earlier, the potentiostatic step method can be used to
investigate nucleation and growth mechanisms which occur at the electrode
surface.
Electrocrystallisation is the process involving the formation of
nuclei and their subsequent growth into a crystal lattice with the
formation of another solid. Using nucleation and growth mechanisms,
studies on the formation of passivating layers have been extensively
studied.
Fleischmann, Thirsk [54] and Harrison [55] developed the
potentiostatic technique and the theory of the growth of such films
under potentiostatic conditions. Armstrong has however, extended
these equations to the more general problems of· layer by layer growth [56].
The nucleation and growth processes which are pertinent to the
charge and discharge of quasi porous lead dioxide which has been
electrochemically formed on solid lead supports has been discussed by
_ 34 _

Hameenoja et al. [57] and is dependent solely on the rate of charge
transfer (the current being independent of rotation speed). The
current-time relationship will depend on:
1) geometric factors, i.e. two dimensional (cylinders)
or three dimensional (hemispheres) growth,
2) rate of appearance of nuclei, i.e. instantaneous
or progressive nucleation.
In deriving any equation which predicts the current-time response
of a nucleation and growth process several assumptions have to be made:
1) the effect of the edge of the electrode have been
neglected,
2) after a suitable potential step has been applied the
nuclei form at discrete centres and grow [58]
3) the rate of growth of current is proportional to·the
area onto which growth occurs, i.e.
i « A (3.14)
The current can be written as:
i = nFkA (3.15)
- 35 -

where: n = number of electrons transferred
F = Faradays constant
k = rate constant of growth process
A = area of electrode
Faradays law can be applied as current proportional to the charge
passed with time and 'kA' as the number of charge carrying moles per
unit time.
p dV kA = (3.16)
M dt
where: p = density of deposit
M = molecular weight of deposit
V = volume
p dV dr and kA = (3.17)
M dr dt
p
[::) [::) nkFA = - nF (3.18) M
dV A and dt are known functions of geometry. Integration of equation (3.18)
gives r as a function of t and consequently current, i, at time t.
In order to mathematically model nucleation and growth processes
known geometries must be incorporated into equation (3.18). Equation (3.15)
only gives the current flowing into a centre which increases in size
in one dimension e.g. a needle. For centres increasing in size in two
or three dimensions other geometries must be considered. For the two
dimensional case cylindrical growth is usually considered and for the
three dimensional case hemispherical growth is considered.
- 36-

a) 2 Dimensional growth (cylinders)
A = 21Trh
where: h = height of the cylinder
r = radius of the cylinder
and the volume is given by:
differentiating with respect to r gives:
dV
dr
Therefore from equation (3.17)
dr M -= -k dt p
t
tk Mkt r = dt =
o p p
substituting into equation (3.19) and equation (3.15) gives:
Mkt i = nFk 21Th -
p
- 37 _
(3.19)
(3.20)
(3.21)
(3.22)
(3.23)
(3.24)

Re-arranging gives the current for the cylindrical growth of a single
centre:
Mt i = 2nFrrhk2 -
p
b) 3-Dimensional growth (hemispheres)
The surface area of a hemisphere is given by:
The volume is given by:
v = 2/3T<r3
differentiating with respect to r gives:
dV -= dr
Therefore from equation (3.17)
dr Mk -= dt p
tfMk Mkt r = dt =
o p p
- 38 -
(3.25)
(3.26)
(3.27)
(3.28)
(3.29)
(3.30)

substituting into equation (3.19) and equation (3.15) gives:
i = nFkrr2 --- (3.31) p
re-arranging gives the current for the hemispherical growth of a
single centre:
i = 2nF (3.32)
For an electrocrystallisation process, in the initial stages of
the formation of a new phase , the individual centres can be assumed
to grow independently of each other without overlapping. The laws of
growth for a single centre such as 3.15, 3.25 and 3.32 can therefore
be combined with the appropriate law of nucleation to give the overall
current-time variation.
At a time, t, the overall current due to nuclei being formed at
a particular time t-u, in the interval du is given by:
(3.33)
where u = the age of the nucleus. It has also been shown that
discrete nuclei have been found to form at preferred sites [54].
If there is a uniform probability with time of converting sites into
nuclei, the nucleation law is first order:
N = No (1 - exp(-Zt)) (3.34)
where: No = total number of sites
Z = nucleation rate constant - .39 _

At short times two limiting forms can be approximated.
If Z is large, all the sites are converted to nuclei virtually
instantaneously:
while if Z is small the nuclei form with time:
N ~ N Zt o
(3.35)
(3.36)
Therefore substituting into equations (3.15), (3.25) and (3.32) will
give:
i) one dimensional growth - instantaneous nucleation
ii) one dimensional growth - progressive nucleation
t
i = JNoznFkA du o
i = nFkAN Zt o
iii) two dimensional growth - instantaneous nucleation
k2t i = 2nFnMhNo --
p
- 40 -
(3.37)
(3.38)
(3.39)
(3.40)

iv) two dimensional growth - progressive nucleation
(3.41)
but (3.42) 2
o 0
i = nF1TMhZno (3.43) p
v) three dimensional growth - instantaneous nucleation
(3.44)
vi) three dimensional growth - progressive nucleation
t
=JNoZ2nF1TM2 k 3
i - u2du (3.45 ) p
t t
JU2
dU [~ u3J 1
but = = _ t 3 (3.46 ) 3
0
(3.47)
Considering equations (3.37), (3.39), (3.40), (3.43), (3.44) and (3.47)
for the current time responses it is obvious that a plot of i Vs t n will
not identify the surface process uniquely. Other techniques are
- 41 _

•
needed to confirm the nucleation and growth processes, the most
obvious being microscopic or electron microscopic counts of the
growth centres at different times after perturbation.
As time after perturbation increases, the current-time variation
cannot continue to follow the relationships stated earlier for two
reasons. Firstly the growth will be obstructed due to the centres
impinging on one another or on the crystal lites of the parent phase,and
secondly in the progressive nucleation there will be a change from the
linear law (Equation 3.36) to the first order law (Equation 3.34).
Bewick et al. [59] have adopted the theory of Avrami [60] to show
that if random overlap occurs between the nuclei then the fraction of
the surface covered by growth centres, y, is related to the fraction
that would be covered in the absence of overlap, y t' by: ex
-Yext Y = 1 - e
The volume of the cylinder will be given by:
v = yh
and the surface area, A, by
dV dy A=-=h-
dr dr
- 42 -
(3.48)
(3.49)
(3.50)
(3.51)

For instantaneous nucleation
Yext = N lIr2 (3.52) 0
A d [ -No lIr2)
(3.53) = h - 1 - e dr
A = h2N lIr exp(-N lIr2) (3.54) 0 0
substituting into equation (3.15) gives:
(3.55)
1 · f Mkt f . (3 23)· h rep aC1ng r or --- rom equat10n . g1ves t e current response p
for a 2-dimensional growth with instantaneous nucleation.
(3.56)
If the nucleation processes follow a progressive mechanism a similar
argument can be applied using the first order nucleation law
(Equation 3.34)
tj N Zk2
i = 2nFlIhM 0p
o
(3.57)
Therefore for a two dimensional growth with progressive nucleation
the current response will be given by:
- 43 -

i = nF1lhMN _Z_k_2
_t2_ exp [_1lM2N Z _k_
2t_
31 o p 0 3p2 ]
(3.58)
The derivation of a mathematical model to describe three dimensional
growth of hemispheres after overlap is limited because the integrals
cannot be solved in closed form. Armstrong [61] has overcome this
problem by considering the growth of right circular cones. This
approach simplified the mathematics and leads to a mathematical model
predicting the current-time transient.
Armstrong considered the cones to be cut into a series of thin
cylinders of height dx at a distance x from the electrode surface.
The growth of the cones continues with a velocity, V, perpendicular
to the plane of the electrode and with a rate constant, k, parallel to
the plane of the electrode. The derivation has been adequately covered
by Armstrong and only the results will be presented here.
i) three dimensional growth - instantaneous nucleation
(3.59)
ii) three dimensional growth - progressive nucleation
(3.60)
In the study of positive grids of the lead acid battery in this
laboratory,dimensionless curve fitting has proved to be the most
successful technique in the identification of the mechanism of
nucleation and growth [62].
- 44 -

The commonly occurring equations which represent both two and
three dimensional growth can be reduced to:
i) i = <XIt exp(SJt2) (3.61)
ii) i = <X2t2 exp(S2t3 ) (3.62)
iii) i = AIll exp(a3 t2)]exp(<X3t2 ) (3.63)
iv) i = 1.2 [1 - exp(a4 t3 )]exp(a4 t3) (3.64)
differentiating these equations with respect to time will give a single
maximum when ~! = 0 (im' t m) at which:
i m 0.5 <Xl = - e
t m
1 SI =--
2t 2 m
i -0.67 m <X2 =-e
t 2 m
2 S2 =-
3t3 m
A = 4i m
lnm <X3 =
t 2 m
(3.65)
(3.66)
(3.67)
(3.68)
(3.69)
(3.70)
- 45 -

A2 = 4i (3.71) m
1nl! ) OC 4 = (3.72)
t3 m
Substituting these values into the previous simplified equations, the
following is obtained:
For two-dimensional growth - instantaneous nucleation
i -= i m
For two-dimensional growth - progresstve nucleation
For three-dimensional growth - instantaneous nucleation
i -=
For three-dimensional growth - progressive nucleation
i -= i m
(3.73)
(3.74)
(3.75)
(3.76)
From the above equations (3.73) to (3.76) it is possible to
calculate the theoretical dimensionless values for the different
- 46 -

nucleation and growth mechanisms and compare them with the experimental
values in order to identify the type of surface process involved.
- 47 -

CHAPTER 4
EXPERIMENTAL TECHNIQUES
4.1 ELECTROLYTIC SYSTEMS
4.1.1 Electrolyte Solutions
The electrolyte solutions were prepared from 'Analar' grade
reagents and triply distilled water, obtained from deionised stock •
• The electrolyte was deoxygenated for several hours by the passage of
oxygen free nitrogen before commencement of each experiment. Fresh
electrolyte was used for each individual experiment. In the
experiments conducted, 2M H2S04 eSp.g. 1.12 kg/I) was used in the
formation of the porous electrodes and 5M H2S04 eSp.g. 1.288 kg/I)
for the electrochemical measurements.
4.1.2 Electrolytic Cells
All cells were manufactured from borosilicate glass (construction
shown in Fig. 4.1 and 4.2) and the fittings had lubrication-free
ground glass joints. The cell and all glassware was cleaned by
steeping in a 50:50 mixture of nitric and sulphuric acid for three
days. The glassware was then thoroughly washed with triplydistilled water
and soaked for 24 hours before use.
A conventional three limbed cell as shown in Fig. 4.1 was used
for all the electrochemical measurements. The working electrode was
- 48 -

- --- -----------------------
--
-7 ~-+--A
--~~------_+--~--B
~~r_-----r_---r_--~-- C
FIG, 4,1, THE THREE LIMBED CELL,
A = COUNTER B = WORKING C= REFERENCE D = LUGGIN CAPILLARY

)
FIG. 4.2. FORMATION CELL.
A = PROVISION FOR REFERENCE ELECTRODE B = COUNTER ELECTRODE C = WORKING ELECTRODE
A
B
c

----.---------------------------------------------------------------------------------
inserted through a loosly fitting teflon cap into the main compartment
of the cell (B). A counter electrode was placed in one side limb (A)
and the reference electrode in the other (C). The connection from
the reference compartment entered the main cell via a luggin
capillary (D) of 1 mm diameter, this was always placed 2 mm below the
centre of the working electrode. The formation ce~l, as depicted in
Fig. 4.2, was used to galvanostatically charge and/or cycle the
porous electrodes. The working electrode was inverted, to allow the
evolved oxygen to escape and the electrode was held securely in
position (C) by a 'teflon bung'. The counter electrode is shown in
position Band a reference electrode was incorporated so that the
potential could be monitored continually (A).
4.2 ELECTRODES
4.2.1 Planar Working Electrodes
These had the construction shown in Fig. 4.3. Their shape was
in accordance with hydrodynamic requirements. The lead and lead
alloys were machined from gravity fed cast lead rods which had been
allowed to age at room temperature for a minimum of 1 month. The
electrodes had a cross-sectional area of 0.2 cm2, and were set in a
teflon electrode shroud (63) . A stout steel spring was then
attached onto the back of the electrode ensuring good electrical
contact with the shaft of the rotating disc electrode (R.D.E.)
assembly. The electrode shroud was then screwed into a hollow
teflon holder. This construction allowed the simple removal of the
- 49 -

TEFLON ELECTRODE-I-HOLDER
FIG, 4,3. PLANAR WORKING ELECTRODE.
TEFLON ELECTRODE SHROUD

working electrode for scanning electron microscopic (S.E.M.) examina
tion. A Mercury pool provided the electrical contact between the
shaft and the external circuit.
Before commencement of the experiments a rigorous electrode
surface preparation regime was adhered to. This was as fo11ows:
firstly the electrode was polished on fine silicon carbide paper
(600 and 1200 grit), roughened glass and finally tissue paper.
This was followed by a 5 sec. chemical etch in 10% nitric acid and
a thorough rinse in triply distilled water. The electrode surface
was then viewed through a binocular microscope to ensure that it
was free from embedded silicon carbide particles.
4.2.2 Porous Electrodes
The porous electrodes had the construction shown in Fig. 4.4.
This consisted of a 'shaped' solid support, constructed from the
lead alloy under investigation which was recessed beneath the level
of the tef10n shrouding. Positive battery paste was then forced into
the cavity forming a porous layer terminated by the lead alloy .e1ectrode.
The pasting and 'curing' was carried out by 01dham Batteries Ltd. to
the same standards as their industrial process.
The porous matrix was oxidised to lead dioxide by a ga1vanostatic
oxidation method in 2M HZS04' A constant charging current of 25 mA/cmZ
was used and continued to flow until the potential was steady and
gas evolution (oxygen) from the porous matrix had started to occur.
- 50 -

J
TEFLON ELECTRODE -----lHOLDER
fl ---..s S~ID ~ METAL ------ TEFLON SUPPORT ~ ELECTRODE
_ SHROUD
LEAD DIOXIDE PASTE~
FIG. 4.4. POROUS WORKING ELECTRODE.

----.-! Ik..
(r- ...... ~<
I. 'I
., /' ,
I- r-~
;>
... . . . . . - JJ .t.-
, r------
'"
FIG, 4,5, REFERENCE ELECTRODE,
Cu wire
B 19
pyrex
solder
Hg:;q
Pt wire
Hg

4.2.3 Counter and Reference Electrodes
The counter electrode used in the formation and electrochemical
experiments was a pure lead rod (koch-Light 99.999%) of larger
surface area than the planar working electrode.
The reference electrode used in all the experiments was the
mercury-mercurous sulphate reference electrode, (Hg/HgzS04/H2S04).
The construction is shown in Fig. 4.5 and the sulphuric acid concentra
tion was always the same as that used in the cell.
4.3 ELECTRICAL CIRCUITS
4.3.1 Linear Sweep/Cyclic Voltammetry and Potentiostatic Step
Experiments
Fig. 4.6 shows a schematic diagram of the experimental arrangement
used. Potentiostatic control was obtained using a potentiostat in
conjunction with a function generator. The resulting voltammograms
or current-time transients were recorded both graphically using an
x-y-t recorder and via a digital oscilloscope. The information
obtained from the transients and voltammograms was digitised and
stored on floppy disc for further analysis using a microcomputer.
4.3.2 Chronocoulometric Cycling Experiments
The experimental arrangement for the chronocoulometric cycling
experiments is shown in Fig. 4.7. Again potentiostatic control was
obtained by using a potentiostat in conjunction with a digital ramp
generator. However, in these experiments, the current response was
- SI -

Potentiostat XY Recorder
11 Function Generator
Multimeter \.. ~~ Lf
-
FIG 4.6. L.S.V. AND POTENTlOSTATlC PULSE CIRCUIT.

Potentiostat
WE RE CE
.... - .... Cell
Bufferl \ I Amplifier Y_ A
... --t D Microcomputer
Function Generator
C
Plotter
1
Printer
FIG. 4.7. CONTINUOUS POTENTIODYNAMIC CHRONOCOULOMETRIC CYCLING CIRCUIT.
V.D.U.

recorded via a 2-80 based microcomputer fitted with a 12 bit
analogue to digital converter (A.D.G). The anodic part of the
vOltammogram which represents the conversion of lead sulphate to
lead dioxide (charging reaction) was then numerically integrated
to obtain the charge contained in the oxidation peak. The values
were displayed against cycle number and stored on floppy disc.
4.3.3 Faradaic Impedance Measurements
The experimental set-up is based on a computer controlled
Solartron 1250 Frequency Response Analyser (F.R.A.) with a 1186
Solartron e1ectrochemical interface to control the potential. The
F.R.A. consists of a programmable generator which delivers the
perturbing signal, measures the system response, analyses the
results with the aid of a correlator, and then displays the results.
The computer controls the programming of the F.R.A. and stores the
resultant data. The generator can be programmed to choose a
frequency and measure the response at that frequency, or more often
to scan through a range of frequencies from the highest to the
lowest (10 kHz to 10mHz). At each frequency the response is
averaged over a number of cycles (10 in this case) and then displayed
in one of three possible ways: resultant impedance (R) and phase
angle 0, log Rand 0 or the real and imaginary parts of the impedance.
4.4.1 Optical Microscopy
Optical microscopy was carried out on polished and etched planar
electrodes. The preparation of the electrode was carried out by
microtoming l~ from the electrode surface with a freshly prepared
- 52 -

glass blade. This gave an equivalent finish to the traditional
polishing method but cut the preparation time down to about 10 min.
The electrode was then etched using a variety of etches depending
on the sample being examined. (See Appendix) .
4.4.2 Scanning Electron Microscopy
The potentiodynamically cycled electrodes were prepared for
microscopic examination after removal from the electrolyte. The
electrodes were washed in methanol, rinsed in acetone and stored
in a vacuum dessicator. The electrodes were then coated with a thin
layer of gold by diode sputtering to ensure conductivity before
examination under the electron microscope.
- 53 -

CHAPTER 5
The E1ectrochemica1 Properties of Solid Lead after Alloying with
Calcium, Tin and Antimony.
5.1 INTRODUCTION
The performance of the lead-acid battery depends to a large
extent on the type of lead alloy used in the battery grid construction.
As stated in Chapter 1, antimony has been employed in grig manufacture
for many years [16], mainly because it engenders desirable properties
such as good cycle life and improved castabi1ity. However, with the
advent of sealed 'maintenance free' batteries, alloys with low gassing
rates (high hydrogen evolution potential) have been required to replace
the lead-antimony alloys. This is because the lead-antimony alloys
contribute heavily to the hydrogen evolution problem. The 1ead-
calcium system has been employed for many years in 'float' service [64].
consequently development of new grids for 'maintenance free' applica
tions has focussed on these lead-calcium and 1ead-ca1cium-tin alloys.
The non-antimonial alloys have overcome the hydrogen evolution problem
but the removal of antimony has resulted in rather inferior cycle lives.
This Chapter records and discusses the linear sweep vo1tammetry
measurements carried out on various lead alloys used in battery
production today. A continuous potentiodynamic chronocou1ometric study
~51has also been undertaken to investigate the 'alloy effect' on the
cycle life performance of the positive battery plate and the mechanism
-54 -

of passivation has been elucidated using A.C. Impedance. It should
also be noted that the industrial practice for battery cycle life
testing takes many years and employs a slow rate galvanostatic
technique. These cycle life experiments have been designed to
accelerate the testing regime time whilst still giving valuable
cycle life data.
5.2 Linear Sweep Voltammetry
5.2.1 Experimental
The linear sweep voltammetric studies were performed on working
electrodes prepared from cast lead alloys which had been allowed to
age at room temperature for a minimum of 1 month. These alloys were
thought to best represent industrial practice and their compositions
are shown in Table 5.1. The electrodes underwent the pretreatment
described in Chapter 4.
The oxidative sweep experiments were carried out at a stationary
electrode. The electrode was polarised to 2,000 mV* on the initial
cycle in order to initiate lead dioxide formation. This was followed
by a modified Plante type process but without the added agressive
ingredients.
5.2.2 Results and Discussion
(a) The non-antimonial alloys
The voltammograms in Figures 5.1 to 5.4 correspond to the various
non-antimonial alloys on the first potential excursion to 2,000 mV
* All potentials in this work are against Hg/Hg2S04 reference electrode.
- ss -

Analysis wt per cent Code
Se Sb Sn Ca Pb
A - - - - 99.999
B - - 0.3 0.095 remainder
C - - - 0.1 remainder
D - - 0.3 - remainder
E 0.02 1.8 - - remainder
F 0.03 2.75 - - remainder
G - 4.5 - - remainder
H - 10 - - remainder
Table 5.1. The composition of the alloys used in the
L.S.V. experiments.
- 56 -
I

s a: E
3
1
-1
-3
-s .6 .8
,
1 1.2 1.4 1.6 1.8 2
V
FIG 5.1. INITIAL L.S.V. FOR PURE LEAD: SWEEP RATE 50 MY/SEC.
s a: r E
3 I-
1 I-
-1 I- 7
-3 l-
-s •
.6 .8
I T I I
-,,,
.
, ,
1 1.2 1.4 1.6 1.8 2
V
FIG. 5.2. INITIAL L.S.V. FOR LEAD-CALCIUM-TIN: SWEEP RATE 50 MY/SEC.

Cl: e
s
3
1
-1
-3
-s
,
-
- I( -
I I
.6 .8 1
, , ,
-"
-
-
I I I I
1.2 1.4 1.6 1.8 2
V
FIG, 5.3. INITIAL L.S.V. FOR LEAD-CALCIUM:
Cl: e
s
3
1
-1
-3
-s
SWEEP RATE 50 MV/SEC.
,
-
C-
/'
V
f-
f-
I I
.6 .8 1
, ,
-~,
-
-
-
I I I ,
1.2 1.4 1.6 1.8 2
V
FIG. 5.4. INITIAL L.S.V. FOR LEAD-TIN: SWEEP RATE 50 MV/SEC.

and the return sweep to 600 mY. The sweep rate was fixed at 50 mY/so
The voltammograms are similar to those presented by Penesar [66],
Carr [67], Brennan [68], Sharpe [69] and Sunderland [70] in their redox
studies on lead alloys. In the anodic potential region (+1.6 mV VS.
Hg/Hg2S04) the current increases steeply owing to the electrode
undergoing an oxygen evolution reaction. During the return sweep
this current is larger than during the preceeding anodic oxidation
due to an apparent increase in catalytic activity of the electrode
surface. This change in surface properties is indicated by a small
reduction peak on the reverse sweep. The reduction peak in all of the
voltammograms is due to the conversion of lead dioxide to lead sulphate.
However, at a sweep rate of 0.1 mV/s (Fig. 5.5) an anodic peak
corresponding to lead dioxide formation was observed at 1.3 Von the
forward sweep. This observation agrees with the work of Visscher [71].
The lack of a peak in the anodic region at fast sweep rates is due to
the difficulty in separating the individual peaks because of the
simultaneous oxygen evolution reaction. The reverse sweep shows some
unusual, but characteristic behaviour, with an anodic peak being observed
as well as a cathodic reduction peak. The anodic peak is probably due
to desorption of oxygen, which exposes part of the lead surface, which
then reacts chemically with the sulphuric acid to produce lead
sulphate, this is immediately oxidised to lead dioxide giving rise
to an anodic peak.
The linear sweep experiments were continued between the potential
limits of 600 and 1350 mV and the sweep rate was kept constant at
50 mY/so A peak corresponding to lead dioxide formation became
apparent and increased initially with cycling. Figure 5.6 shows
- 57-

,--------------------------------------------------------------------------------------------
a: lE
3 I I ,
2 r
1 _
o
-1 r
-2 _
-3 I 1
600 800 1000 1200
FIG, 5,5, INITIAL L,S,V. FOR PURE LEAD: SWEEP RATE 0.1 MV/SEC.
,
1400
-
-
-
-
1600
mV

the corresponding voltammograms for the various lead alloys after
4 h continual cycling under these restricted potential limits. The
potential limits represent a typical potential excursion for a non-
antimonial positive battery plate under aggressive charge/discharge
cycling. The voltammograms in Fig. 5.6 are typical of many sited in
the literature [72, 73, 74], each voltammogram consists of a well
defined oxidation peak and a less well defined reduction peak. The
difference in the potential for lead dioxide formation is shown in
Figs. 5.1 to 5.4 and 5.6. This highlights the considerable nucleation
overpotential required for lead dioxide to form on a planar lead
surface. These results confirm the findings of Fleischmann et al.
[75] who first reported this phenomenon. The shape of the voltammograms
indicate that the reaction is electrochemically hindered in the cathodic
sweep. This is as expected because of the resistive layer of lead
sulphate formed at the metal-dioxide deposit interface during the
discharge process. This resistive layer of lead SUlphate slows down
the rate of electron transfer, giving the voltammogram a similar shape
to a diffusion controlled electrochemically irreversible reaction.
The anodic peak which represents the oxidation of lead sulphate
to lead dioxide does not return to zero above 1350 mV as a residual
current remains. This is a result of the electrode undergoing an
oxygen evolution reaction:
H20 +
--+ !02 + 2H + 2e (5.1)
This isof interest as the equilibrium potential for the decomposition
of water is 1.23 V [6], however, in these experiments oxygen evolution
- 58 -

N -S ()
"-a: s
3.5
2.5
1.5
.5
-:5
-1.5 600 750 900 1050 1200 1350
mV
FIG. 5.6. CONSTANT RESPONSE CURVES FOR THE NON-ANTIMONIAL ALLOYS OVER THE POTENTIAL RANGE 600-1350 MV AFTER CONTINUOUS CYCLING FOR 4H: SWEEP RATE 50 MV/SEC.

did not occur until 1.3 V, therefore there is a slight oxygen over-
voltage on porous lead dioxide. This leads to a higher charging
efficiency than would be theoretically expected. The charge
contained in the reduction peak was found to always be in the range
85-95% of the oxidation peak, indicating the electrode was always
fully charged after each cycle and that only a small amount of
charge contributes to oxygen evolution per cycle. The charge values
for the oxidation and reduction peaks are shown in Table 5.2.
Alloy Code ip Ep Charge of Charge of mA/cm2 mV anodic peak cathodic peak
/mC /mC
Pb A 3.5 1150 2.70 2.30
Pb-Ca-Sn B 3.4 1130 2.65 2.40
Pb-Ca C 2.6 1140 2.35 2.10
Pb-Sn D 2.4 1120 2.40 2.30
Table 5.2 The peak current, peak potential and the charge contained
in the anodic and cathodic peaks for the non-antimonial
alloys after 4 h cycling.
The broadening of the oxidation peak represents the increase in
porosity of the lead dioxide deposit formed as a result of continued
potentiodynamic cycling between the lead sulphate and lead dioxide
potential regions. The more extensive the porous deposit, the harder
the reaction has to be driven in order to convert lead sulphate to
lead dioxide. The oxidation peak will occur over a larger potential
- 59 -

range commensurate with the difficulty in driving the reaction deep
into the porous matrix. The voltammograms showed that initially
the lead-tin binary alloy had the most developed porous lead
dioxide deposit. With continued cycling, the porosity of the surface
layer for lead and the lead calcium alloy was shown to increase.
The effect of rotation speed on the voltammograms has also been
investigated and found to have no apparent effect. The rate of
oxidation of lead sulphate to lead dioxide in sulphuric acid is
not determined by a solution reaction under these conditions. It can
be concluded that even at a stationary electrode the diffusion layer
must be sufficiently thin for control of the current by mass transport
in solution to be absent .. TIle reaction proceeds via a solid state
mechanism.
The relationship between peak potential (Ep) in the oxidation
of lead sulphate to lead dioxide and sweep rate (v) in the form of
Ep Vs. log) 0 sweep rate (v) is displayed in Figure 5.7. This follows
the equation developed by Canagaratna et al. [76] for describing the
formation of lead dioxide at a constant thickness per cycle. As is
evident from the straight line plots in Figure 5.7 and the data in
table 5.2, the potential (Ep) of the oxidation peak (ip) for all of
the non-antimonial alloys occur at more negative potentials than
on the pure metal. This trend is in agreement with the work of
Bialacki [77] and Kelly [78]. The position of the peak current
(Ep) in relationship to the equilibrium potential (E9) is determined e
by the activation overpotential for that particular alloy, this is
9 inturn related to the intrinsic rate constant ~ (Eq. 3.3). A
small value for ~9 will indicate a sluggish reaction whilst a large
- 60 -

> "
Q..
lLJ
1.3
1. 25
1.2
1. 15
1.1
1. 05
1 -1 -1.1 -1.2 -1.3 -1.4 -1.5 -1.6 -1.7
Log (SWEEP RATE)
FIG. 5.7. PLOT OF Ep VS LOG SWEEP RATE FOR THE NON-ANTIMONIAL ALLOYS.

value will indicate that the rate of reaction will be fast and
therefore the oxidation peak will occur at potentials close to the
equilibrium potentials. Comparing the non'-antimonial alloys
(B,C,D),with pure lead (A) it can be seen that the kinetic barrier
to the conversion of lead dioxide from lead sulphate is decreased
when lead is alloyed with calcium and/or tin.
The largest peak current (Table 5.2) was observed for pure
lead (A) and the lowest for the lead-tin binary system. This
indicates that lead undergoes the greatest anodic attack, whilst
the addition of calcium or tin exert a protective effect. It can
be seen that when calcium and tin are combined there is a synergistic
effect and the ternary alloy corrodes more readily. These results
are in agreement with Gonzalez U9] and McWhinnie [80] who independently
investigated the long term corrosion resistance of various non
antimonial alloys.
(b) The antimonial alloys
The voltammograms in Figures 5.8 to 5.11 are similar to those
in Figures 5.1 to 5.4 and are for the various antimonial alloys.
Again there is no observed anodic peak at fast sweep rates for
lead dioxide formation and only a combined anodic peak for oxygen
evolution and dioxide formation is visible at high anodic potentials.
This is in agreement with Brennan et al. [81] and Danel et al. [82].
At slow sweep rates an anodic peak was visible similar to that for
the non-antimonial alloys (Fig. 5.12).
The linear sweep experiments were then continued between the potential
limits of 600 and 1250 mV and the sweep rate was kept constant at 50 mY/so
- 61 -

a: la
5
3
1
-1
-3
-5 .6 .8 1 1.2 1.4 1.6 1.8 2
V FIG. 5.8. INTITIAL L.S.V. FOR 1.8% ANTIMONY:
a: la
5
3
1
-1
-3
-5
SWEEP RATE 50 MV/SEC.
,
r-
r-
V r-
r-
I
.6 .8
, • , I I
-
} /'-
-
-
-
I I I I I
1 1.2 1.4 1.6 1.8 2
V
FIG. 5.9. INITIAL L.S.V. FOR 2.75% ANTIMONY: SWEEP RATE 50 MV/SEC.

a: e
5
3
1
-1
-3
-5
•
t-
I-
cV I-
.6 .8
I I I I I
-
~ ...
0
0
-
I I I I
1 1.2 1.4 1.6 1.8 2
V
FIG. 5.10. INITIAL L.S.V. FOR 5% ANTIMONY:
a: e
5
3
1
-1
-3
-5
SWEEP RATE 50 MV/SEC.
.6 .8 1 1.2 1.4 1.6 1.8 2
V
FIG. 5.11. INITIAL L,S,V, FOR 10% ANTIMONY: SWEEP RATE 50 MV/SEC.

ex: E
5
3 :-
1 f-
-1 I-
-3
-5 .6
I
I
. 8
I , ,
, I I
1 1.2 1.4
FIG. 5.12. INITIAL L.S.V. FOR 1.8% ANTIMONY: SWEEP RATE 0.1 MV/SEC.
I I
-
-
-
-
I
1;6 1.8 2
v

These potential limits compare favourably"to the potential limits set for
the non-antimonial alloys (600-1350 mY) because antimony has been shown by
Maja et al. [83] to lower the oxygen evolution potential. These
potential limits represent a typical potential excursion for a
positive battery plate constructed from a lead-antimony alloy.
The vol tammograms in Figure 5.13 correspond to the various
antimonial alloys and pure lead after 4 h continuous cycling at
50 mV/s under the restricted potential limits. Each voltammogram
consists of a well defined oxidation peak and a less well defined
reduction peak. The arguments applied for the non-antimonial
alloys in Chapter 5.2.2a also apply to these voltammograms. The
charge contained in the reduction peak was again found to always
be in the range 85-95% of the oxidation peak, indicating that the
electrode was fully charged after each cycle and that only a small
fraction of the anodic charge contributes towards oxygen evolution.
The charge contained in the anodic and cathodic peaks are given in
Table 5.3.
Alloy Code ip/mA Ep/V Charge of Charge of anodic peak cathodic peak
/mC /mC
Pb A 2.2 1.030 1.85 1.65
Pb-Sb(1. 8%) E 1.30 1.063 1.25 1.15
Pb-Sb(2.75%) F 0.73 1.054 0.55 0.50
Pb-Sb(5%) G 1.03 1.060 0.70 0.65
Pb-Sb(lO%) H 0.98 1.048 1.00 0.95
Table 5.3. The peak current, peak potential and charge contained in the
anodic and cathodic peaks for the various antimonial alloys.
- 62 -

N -e Cl
"-a: e
2.5
1.5
.5
-.5
-1.5 600
FIG, 5,13,
A
730 860 990 1120 1250
mV
CONSTANT RESPONSE CURVES FOR THE ANTIMONIAL ALLOYS OVER THE POTENTIAL RANGE 600-1250 MV AFTER CONTINUOUS CYCLING FOR 4H: SWEEP RATE 50 MV/SEC,

From the shape of the voltammograms in Figures 5.13 it can be
seen that the higher the antimony content, the broader the oxidation
peak. This indicates that the addition of antimony increases the
porosi ty of the developed lead dioxide film.
Figure 5.1'4 shows the relationship between the peak potential
(Ep) of the oxidation peak for the conversion of lead sulphate to
lead dioxide and sweep rate (v). This is in the form of a plot of
Ep Vs. logIO sweep rate. This, like the non-antimonial alloys,
follows the expected equation developed by Canagaratna [76], for
the development of a layer of lead dioxide at a constant thickness
per cycle. It is also clear from the straight line plots that the
formation of lead dioxide occured at a greater positive potential than
on the pure metal. This is in contrast to the work presented by
Kelly et al. [78] but in agreement with Bialacki et al. [77]. This
discrepancy could be due to the fact that the 'pure lead' alloy used
by Kelly (99.98%) contained traces of other metals which could help
resist anodic attack. The sweep rate employed was also slightly
different.
The largest peak current (ip) and anodic peak capacity was
observed for pure lead and the lowest for the 2.75% antimonial alloy
(Table 5.3). Again lead underwent the greatest anodic attack, with
antimony exerting a protective effect. Figure 5.15 shows a plot of
anodic peak capacity against antimony content. The addition of
antimony initially lowered the capacity of the anodic peak until it
reached a minimum at an antimony concentration of 2.75% antimony,
the capacity then continued to rise with increasing antimony content.
-63 -

> e "Q.
LLJ
1. 15
1. 12
1.1
1. 07
1. 05
1. 02
1 -1 -1.1 -1.2 -1.3 -1.4 -1.5 -1.6 -1.7
Log(SWEEP RATE)
FIG. 5.14. PLOT OF Ep VS LOG SWEEP RATE FOR THE ANTIMONIAL ALLOYS.

This is in agreement with Brennan et al. [81] who concluded from their
differential double layer capacitance studies that antimony exerted
a protective effect with the 2% antimonial alloy having an anomalously
low value. The profile in Figure 5.15 indicates there are probably
two competing mechanisms. Ruetschi [84] and Lander [85] have shown
that under both potentiostatic and galvanostatic conditions, the
corrosion rates of antimonial alloys increase with increasing antimony
content. This can be explained by the fact that, in alloys containing
less than 6% antimony the mode of attack is largely intercrystalline
but with some additional sub grain attack. The grain boundries have
been shown to be corroded more deeply [86] than the channels traversing
the grains. As the antimony content increases corrosion attack is
more uniformly distributed along the interdendritic network and
antimony segregated areas. At the higher antimony concentrations
(9-10%), penetration of the antimony rich areas becomes prominent
leading to a higher corrosion rate which is less destructive. In low
antimonial alloys selenium is added as a grain refining reagent. The
grain refining works by allowing on solidification, grains to grow
around the added nucleating agent, resulting in a more uniform and
finer grain size. The addition of grain refiners becomes unnecessary
above 3-4% antimony because there is sufficient eutectic present to
fill any voids or cracks formed on solidification. Alloys with added
selenium have a finer and more uniform grain size, resulting in a
decrease in corrosion rate and depth of penetration [87]. The optimum
conditions for limited anodic corrosion over the range studied was
found to be 2.75% antimony.
- 64 -

u e
....... w c.!l 0:
1.5
Cl: ::c 1. 3 u
1.1
.9
. "/
.5 o 1 2 3 4 5 6 "/ 8 9 10
COMPOSITION Wt.!. Sh.
FIG. 5.15, PLOT OF CHARGE OF THE ANODIC PEAK VS ANTIMONY CONTENT AFTER 4H POTENTIODYNAMIC CYCLING,

5.3 CONTINUOUS POTENTIODYNAMIC CHRONOCOULOMETRY
5.3.1 Experimental
An identical experimental procedure was followed as in Chapter 5.2.1
but the potentiodynamic cycling was continued for up to 8,000 cycles.
The data was recorded via a microcomputer fitted with a 12 bit analogue
to digital convertor. This allowed for the online numerical integration
of the charge in the anodic peak (See Chapter 4). The charge of
the anodic peak was then displayed as a function of cycle number.
The results presented are the mean of ten separate experiments. This
number of experiments was required to eliminate surface effects
caused by the diffusion of the alloying ingredient to the electrode surface.
5.3.2 Results and Discussion
(a) The non-antimonial alloys
With continued potentiodynamic cycling the peak current and also
anodic peak capacity was found to vary with cycle number. Figure 5.16
shows the relationship between anodic peak capacity and cycle number.
As is evident, the alloys show a trend in which their anodic peak
capacity rises and reaches a maximum after 1,000 cycles and then
diminishes. These results indicate that initially an extensive lead
dioxide deposit is formed with continued cycling by the corrosion of
the planar lead electrode. This then reaches a maximum value where
further attack of the backing alloy is restricted and the capacity
then falls as the electrode passivates. Passivation is most likely to be
brought about by restriction of acid reaching the metal/porous lead
dioxide interface, which will lead to a resistive film of lead sulphate
- 65 -

w e
...... w (!1
a::: a: ::I:
3 I ,
Pb '0' 0,
"
, I
w 2.5 r- " '0' • " ." .
"
Pb-Ca.-Sn , ,
, , , , ,
, , Pb -Sn " " , ... ' :," ,Pb''':CO: ,,',:""'" "",''', .' • '0 • '. • •• '. 0' •• :
, "
: • • ' :' " '" .' • 0, " . '. .
2 " " : r- ," , : '
" .. ' . " ' , ,
'to • :. .
.:. : ", .. . . . .
1. 5 ~, : " "
, , , ,
" , ,
" .. "
, ,
" '. " . '. . , , ' ... ' : .. '" , ,
-
-
-
. , . ...
1 I I I I
o 1000 2000 3000 4000 5000
CYCLE No.
FIG, 5,16, VARIATION OF CHARGE OF ANODIC PEAK WITH CYCLE NUMBER FOR THE' NON-ANTIMONIAL ALLOYS,

forming at the interface, causing subsequent passivation. There is a
marked difference between the alloys containing calcium and/or tin on
one hand and pure lead on the other. These observations could be due
to the fact that after a deep discharge, passivation can be brought
about by a layer of lead sulphate and additionally, in the case of the
calcium containing alloys, a layer of calcium sulphate [86]. The
presence of this binary film in the latter situation will lower the
charge required to passivate the binary alloy. In the case of the ternary
lead calcium-tin alloys, an intermetallic compound of composition
Sn3Ca has been shown by Prengaman [88] to exist at room temperature.
This intermetallic compqund has been shown to be resistant to sulpha-
tion and/or oxidation [89] and so helps reduce the effect of passiva-
tion by the build up of a sulphate layer [88]. Within the restricted
potential limits of the experiment (600 - 1350 mV) any tin present at
the electrode surface would be oxidised to tin dioxide [90] and this
could then contribute to the matrix conductor via a semi-conductor
effect, so again resisting complete passivation.
(b) The antimonial alloys
The antimonial alloys showed a different characteristic to the non
antimonial alloys. The distinctive characteristic of the antimonial
alloys is shown in Figure 5.17. Again the anodic peak capacity is shown
as a function of cycle number. As is evident (unlike the non-antimonial
alloys in Figure 5.16), the antimonial alloys show a trend in which
their charge capacity continues to rise with cycling during the whole
experiment. A similar trend was seen when peak current (ip):was plotted
against cycle number. Theprofi1e in Figure 5.17 indicates that a
- 66 -

c.J e
2.6
~ 2.4 r C!I 0:::
~ 2.2 r c.J
1.8 - :
1.6 -t · · · 1.4 ~ i
1.2 i
~
Pb .' .
I
. . " ... .' . '. ..
, ,
.. ' .' . ". .. ....... ... . .. .
" . .. . .
-
. .' --
-51. Sb _
. . . :
. . . .. . .. ". .. • • • • .... .. • • • ••• I. • " • •
1 r- • :
8 . . . '-.: : . · . .
• 6 r~ .. : . .' . . .
• 4 o
.. .. L
1000
. . .
. . . . . . . . . . . . . . .' .... " .. . . . ...
101. Sb-
-2.75i. Sb . . . . . . . . ". :'." .. .. .. . ... :. . ",. . " '.
I I
2000 3000 4000 5000
CYCLE No.
FIG, 5,17, VARIATION OF CHARGE OF ANODIC PEAK WITH CYCLE NUMBER FOR THE ANTIMONIAL ALLOYS,
I
. I
I
I
I

passivating layer of lead sulphate is unlikely to be formed between
the base metal and the formed lead dioxide deposit. The trends for
the antimonial and non-antimonial alloys are very similar to those
published by Burbank [91] in her studies on the capacity change with
cycling of the anodic coatings on pure and antimonial lead. Burbank
noted that the capacity of the antimonial alloys continued to rise
whilst that for pure lead reached a maximum and did not increase
significantly with continued cycling. Our results agree with those
findings.
Burbank [92] and Swets [93] have studied the crystal structure of
a and S lead dioxide, the two polymorphs most commonly encountered in
the lead acid battery. They have also studied other compounds which
are probably formed on battery cycling which include AB206 type
compounds such as PbSbzOs. This work was undertaken to elucidate the
role these compounds play in the nucleation or passivation of lead
dioxide and so explain the beneficial effect of antimony on the cycle
life performance of the lead acid battery. Burbank [92] suggested
the size of the ion plays an important role, and that ions more compact
than tetravalent lead will lead to the oxygen octehedra surrounding
the antimony ion becoming more compact, thus resulting in an increase
in lattice energy and so a more stable crystal mass. The use of ionic
radius ratios to predict structure once the stoichiometry is known, is
not a new idea [94] and could prove useful in selecting possible guest
ions for the lead dioxide lattice. Table 5.4 shows a list of cation/anion
radius ratios based on the widely accepted ionic radii of Pauling [95]. For
MX type compounds with large radius ratios it has been shown that they
favour the fluorite structure and those with the smaller ratio will
favour the rutile structure [94]. The radius ratio data in Table 5.4
- 67 -

indicates that a cation/anion radius ratio of between 0.4 and 0.7 will
help nucleate new lead dioxide whilst higher ratios might disrupt the
crystal lattice and passivate the electrode by the formation of lead
sulphate. The results expressed in Figures 5.16 and 5.17 agree with
these postulations. Ritchie [96] has also suggested that Sb5+ ions
4+ dissolved from the lattice may occupy vacant Pb octahedral sites in
the lead dioxide lattice and nucleate new a lead dioxide on subsequent
charging. This argument could also apply to other metals with a
smaller or equivalent ionic radii such as tin or selenium.
ion Valence Cation Cation/anion radius (A) radius ratio
Ca +1 1.18 0.90 +2 0.99 0.75
Pb +2 1.20 0.91 +4 0.84 0.63
Sb +5 0.62 0.47
Sn +4 0.71 0.54
Se +6 0.50 0.38
Table 5.4. Cation/anion radius ratios based
on Pauling's values [95].
5.4 A.C. IMPEDANCE
5.4.1 Experimental
Again a similar experimental procedure was followed as for
Chapter 5.2.1. After varying cycle times (1,000, 2,000 and 5,000 cyles)
- 68 -

the cycling was halted and the potential held constant at 1200 mV
(Vs. Hg/Hg2S04' 5M H2S04). This potential was maintained until the
current had fallen to a negligible value, then an impedance scan
was commenced (10 kHz to 10 mHz). A fresh electrode was used for each
experiment and the results presented are the mean of five separate
runs.
5.4.2 Results and Discussion
The A.C. Impedance measurements for all of the alloys were taken
at a fixed potential of 1200 mV (Vs. Hg/Hg2S04)' This potential was
chosen because it maintained the electrode in the fully charged state
whilst minimising the effect of oxygen evolution which would distort
the impedance spectra. This procedure was found to be satisfactory for
the comparison of the impedance spectra.
Figures 5 .18- 5.25 show the Sluyters plots for pure lead and the
various lead alloys after 4h, l2h and 24h continuous potentiodynamic
cycling. Each plot consists of a rising curve which is part of
a semi-circle of very large diameter, indicating a large charge
transfer resistance,Rct ' The Sluyters plot neither exhibit a well
defined high frequency shape nor a typical Warburg line for a diffusion
process. The reason for lack of low frequency data is because the oxygen
evolution reaction occurring on the porous lead dioxide deposit interferes
with the impedance spectra after a whil~ leading to excessive scatter in
the data. The results are typical for a planar lead electrode under
corresponding conditions ~7,~Gl and other workers ~8l have accounted
for this behaviour by the fact the reaction occurs completely in the
adsorbed state without a solution diffusive species. Such a mechanism
- 69 -

e ..c Cl '-
10
c; 8 '--
6
4
2
o o 2
• 4h
•
• • • • • • • •
•
4
• 12h 24~
• •
• • • •
• • • • • • ,:
6 8 10
R/Ohm FIG. 5.18. THE COMPLEX-PLANE PLOT (SLUYTERS PLOT) FOR A PURE LEAD
ELECTRODE AT 1200 MV AFTER 4, 12 AND 24H CONTINUOUS POTENTIODYNAMIC CYCLING.
10 e , • • •
..c • Cl 4h 12h 24h· '-u 8 • • ~ - -'- • - •
• • • 6 l- • • -
• • .4O
• • • 4 l- • . • • • • • • • • • •
2 • • l- • • 1 • . • • i t I
0 J I, .~ , I
0 2 4 6 8 10
R/Ohm I
FIG. 5.19. THE COMPLEX-PLANE PLOT (SLUYTERS PLOT) FOR LEAD-CALCIUM-TIN AT 1200 MV AFTER 4, 12 AND 24H CONTINUOUS POTENTIODYNAMIC CYCLING.

- - - - - ----~~~~~~~~~~~------------
e ..&! o "-
10
'i 8 "-...
6
4
2
o o
FIG. 5.20.
e ..c o
10
"(j
~ 8 t"-...
6 t-
4 t-
2 t-
o o
• •
4h
•
•
• • • .12h 24h
• •
• •
.. . .. • • •
.. • • • • • • • • • • • •
2 4
.. • ..
•
6 8 10
R/Ohm THE COMPLEX-PLAI~E PLOT (SLUYTERS PLOT) FOR LEADCALCIUM AT 1200 MV AFTER 4, 12 AND 24H CONTINUOUS POTENTIODYNAMIC CYCLING.
I • . . ,
• • • • • • • • :
•
. ..
• .12h 24h
• .. • • • • ..
• .. • .. ..
• • ..
• • • • • .. . .~ I
• I
j 1~ I
2 4 6 '-
8
-
-
-
-
10
R/Ohm FIG. 5.21. THE COMPLEX-PLANE PLOT (SLUYTERS PLOT) FOR LEAD
TIN AT 1200 MV AFTER 4, 12 AND 24H CONTINUOUS POTENTIODYNAMIC CYCLING.

e ..c Cl "-
10
c.; 8 "--
6
4
2
o o
•
4h •• 12h
• • • • • • • • • • • :! . : •• •
4
• • • •
• •
6
·65h
•
8 10
R/Ohm FIG. 5.22. THE COMPLEX-PLANE PLOT (SLUYTERS PLOT) FOR 1.8%
ANTIMONY AT 1200 MV AFTER 4, 12 AND 65H CONTINUOUS POTENTIODYNAMIC CYCLING.
e ..c Cl "-
10
c.; 8 "--
6
4
2
o o
FI.G. 5.23.
••
4h • • 12h
• • • • • • • •
• • • •• • •• • • • t • .I .+
4
• • • •
•
• •
6
• 65h •
8 10
R/Ohm THE COMPLEX-PLANE PLOT (SLUYTERS PLOT) FOR 2.75% ANTIMONY AT 1200 MV AFTER 4, 12 AND 65H CONTINUOUS POTENTIODYNAMIC CYCLING.

10 s • .t:
Cl • "- • u 8 4h • 12h 65h :. • "- • .... • •
• • 6 ••
• • • • • • 4 • • • • • • •• •
2
o o 6 8 10
R/Ohm
FIG. 5.24. THE COMPLEX-PLANE PLOT (SLUYTERS PLOT) FOR 5% ANTIMONY AT 1200 MY AFTER 4, 12 AND 65H CONTINUOUS POTENTIODYNAMIC CYCLING.
S .t: Cl "-
10
'i 8 "-....
6
4
2
o o
• • 4h 12h
• • • • •
• • • • • • •
• • • • • •
6
• •
• 65h
•
8 10
R/Ohm FIG. 5.25. THE COMPLEX-PLANE PLOT (SLUYTERS PLOT) FOR 10%
ANTIMONY AT 1200 MY AFTER 4, 12 AND 65H CONTINUOUS POTENTIODYNAMIC CYCLING.

agrees with the known adsorptive properties of lead dioxide (99] and
with the linear sweep experiments in Chapter 5.2.2.
At high frequencies the impedance data shows considerable differences
between the antimonial alloys on one hand and the non-antimonial
alloys on the other. The antimonial allays show a well defined" high
frequency inductive loop. None of the other alloys exhibit this property.
Keddam ~~ has reported this type of behaviour for pasted porous lead
dioxide electrodes in lead acid batteries. The occurrence of the
high frequency inductive loop can be accounted for by the porosity of
the developed deposit. The vOltammograms in Figures 5.13 give further
evidence to support the idea that there is an increase in porosity of
the deposit on the antimonial alloys when compared tothe non-antimonial
alloys. With a porous electrode the electrochemistry will occur over
a distributed region of the electrode as discussed by Darby [l0l].
At sufficiently high frequencies the phase angle of the Faradaic
impedance will become negative, this arises physically because of the
changes in concentration which occur in pores. Therefore as this
cannot occur with a planar electrode no inductive loop will be seen.
The antimonial alloys give a well defined inductive loop indicating
that the pores are semi-infinite. It can also be seen that the curve
for the antimonial alloys rises less steeply than for the non-
antimonial alloys, again indicating an increase in porosity of the
electrode surface for the alloys.
The results on pure lead and the non-antimonial alloys agree with
the impedance spectra for electrodeposited lead dioxide as reported
by Cas son (97]. It can be concluded from this that in the oxidation
region the deposit on the non-antimonial electrodes resembles electrodeposited
- 70 -

; , Ohmic resistance of electrode and solution after varying cycle times
Alloy 4h l2h 24h
A 3(l 4(l 6(l
B 1.9(l 3.0(l 4.4(l
C 1. 8(l 2.7(l 4.0(l
D 2.0(l 2.8(l 3.7(l
E 1.8(l 1.8(l 2.5(l
F 1. 8(l 1.9(l 2.6(l . G 1. 9(l 2.0(l 2.8(l
H 1. 8(l 2.0(l 2.8(l
Table 5.5. The mean value of five separate
experiments for the ohmic resistance
of the various lead alloys after 4h,
l2h and 24h cycling (50 kHz)
~ 71 -

lead dioxide whilst for the antimonial alloys the formation of lead
dioxide involves the formation of a porous structure sufficient to
cause an inductive loop.
Considering the change in the impedance spectra with continued
potentiodynamic cycling, it is clearly seen that the intercept on the
real axis increases with cycle number for the non-antimonial allOYS,
whilst there is little variation with cycle number for the antimonial
alloys. Table 5.5 shows the mean values of five separate experiments
for the ohmic resistance, Rn for the various lead electrodes. The
measurement of the ohmic resistance was taken at 50 kHz on a freshly
cycled electrode. The ohmic resistance increases with cycling for
the non-antimonial alloys. This suggests an increase in the thickness
and soundness of the insulating layer of lead sulphate, which blocks
,the active sites of the electrode and limits the current flow, leading
to passivation of the electrode. The antimonial alloys on the other
hand, indicate that even after extensive cycling the ohmic resistance
does not alter significantly. This can be attributed to the increase
in porosity of the developed lead dioxide deposit which will promote
the continued performance of the electrode
5.5 CONCLUSIONS
1) The L.S.V. curves for the non-antimonial alloys show considerable
differences to those of antimonial alloys.
2) The antimonial alloys showed the greatest initial resistance to
anodic attack.
- 72 -

3) The shape of the vOltamrnograms and the A.C. impedance data shows
that the antimonial alloys have a surface layer of highest
porosity. The porosity increasing with antimony content.
4) The porosity of the non-antimonial alloys increased with potentio
dynamic cycling.
5) The continuous potentiodynamic cycling curves and the A.C. impedance
data show that the antimonial alloys posses.s the greatest resistance
to passivation by lead sulphate, passivation by both calcium
sulphate and lead sulphate occurring with the non-antimonial
calcium containing alloys.
6) Of the alloys examined, lead sulphate shows the greatest reluctance
to nucleate on antimonial lead.
- 73 -

CHAPTER 6
ruE MORPHOLOGY OF PLANAR LEAD DIOXIDE ELECTRODES AFTER CONTINUED
POTENTIODYNAMIC CYCLING
6.1 INTRODUCTION
In Chapter Five the electrochemical behaviour of pure lead and
various pertinent lead alloys in 5M H2S04 have been investigated.
The results from the 1inea~ sweep vo1tammetry and A.C. impedance
studies concluded that the antimonial alloys develop a more porous
surface deposit than the non-antimonial alloys. This difference in
surface structure is thought to account for the difference in the
cycle life of the alloys. This Chapter investigates the morphology
of the various alloys and presents micro graphical evidence in support
of the e1ectrochemica1 data.
6.2 EXPERIMENTAL
The experimental procedure and electrode preparation was
similar to that described in Chapter 5 and Chapter 4 respectively
with the alloys having the composition shown in Table 5.1. The
electrodes were potentiodynamica11y cycled between the lead sulphate
and lead dioxide potential regions (600 ~ 1350 mV Vs. Hg/Hg2S04) .for
various cycle times. After a fixed cycle time the electrode was
removed, in the discharged state, and immediately washed with
methanol. Washing with methanol avoided creating a concentration cell,
- 74 -

which leads to artifacts in the morphology. After a thorough
wash in methanol the electrode was rinsed in acetone and dried
and stored in a vacuum desiccator. For the microscopic study the
electrodes were coated in a thin layer of gold by diode sputtering.
This increases the conductivity of the surface and avoids the
problems of charging associated with nonconductors. The microscopic
examination was carried out using an I.S.I. Alpha 9 scanning electron
microscope.
6.3 RESULTS AND DISCUSSION
Microscopic examination of the electrode surface of the various
lead alloys after ~ h continuous potentiodynamic cycling indicated
that on all of the alloys only a small amount of corrosion product
was present. The extent of corrosion was found to increase with
continued cycling. After 4 h cycling the electrodes were covered in
a thick layer of corrosion product. The micrographs in Figures 6.1
to 6.8 correspond to the various lead alloys after 12 h continuous
cycling. The electrodes are covered in an extensive layer of lead
sulphate. These results are in agreement with the electrochemical
data presented in Chapter 5. The anodic peak capacity of the electrodes
increased with cycle number (Figs. 5.16 and 5.17) over the first
1,000 cycles, this is commensurate with the build up of an extensive
layer of lead dioxide.
Considering the micrographs in more detail, it is obvious
there are morphological differences between the lead sulphate layer
on the non-antimonial alloys and the lead sulphate layer on the
antimonial alloys. The non-antimonial alloys (Figs. 6.1 to 6.4)
- 75 -

•
FIG. 6.1. S.E.M. MICROGRAPH OF PURE LEAD AFTER 12H CONTINUOUS POTENTIODYNAMIC CYCLING. MAGNIFICATION X 10,000
FIG. 6.2. S.E.M. MICROGRAPH OF LEAD-CALCIUM-TIN AFTER 12H CONTINUOUS POTENTIODYNAMIC CYCLING. MAGNIFICATION X 10,000

FIG. 6.3. S.E.M. MICROGRAPH OF LEAD-CALCIUM AFTER 12H CONTINUOUS POTENTIODYNAMIC CYCLING. MAGNIFICATION X 10,000
FIG. 6.4. S.E.M. MICROGRAPH OF LEAD-TIN AFTER 12H CONTINUOUS POTENTIODYNAMIC CYCLING. MAGNIFICATION X 10,000

•
FIG, 6,5, S,E,M, MICROGRAPH OF 1,8% ANTIMONY AFTER 12H CONTINUOUS POTENTIODYNAMIC CYCLING, MAGNIFICATION X 10,000
FIG, 6,6, S,E,M, MICROGRAPH OF 2,75% ANTIMONY AFTER 12H CONTINUOUS POTENTIODYNAMIC CYCLING, MAGNIFICATION X 10,000

•
FIG, 6,7, S,E,M, MICROGRAPH OF 5% ANTIMONY AFTER 12H CONTINUOUS POTENTIODYNAMIC CYCLING, MAGNIFICATION X 10,000
FIG, 6,8, S,E,M, MICROGRAPH OF 10% ANTIMONY AFTER 12H CONTINUOUS POTENTIODYNAMIC CYCLING, MAGNIFICATION X 10,000

exhibit a ?urface layer consisting of fine and uniformly shaped
lead sulphate crystals. This layer is mechanically sound and with
an average crystal diameter of about O.l~m This layer of lead
sulphate will be very effective in blocking (passivating) the
electrode for further reaction and so preventing re-oxidation of lead
sulphate to lead dioxide. Reutschi [102] has shown that. when
individual lead sulphate crystals in the outer corrosion layer are
very small (0.1 - 10 ~m) and uniform the outer corrosion layer becomes
impermeable to sulphate and bisulphate ions. (The pores of the
electrode become practically closed). A similar type of reaction has
been reported by Huber [103] on silver electrodes coated with silver
chloride. The sulphuric acid within the pores of the electrode will
simultaneously become depleted and diluted as discharge occurs,
this will lead to more alkaline conditions « pH 9) in the interior
of the lead dioxide deposit.
The Pourbaix diagram for lead has been modified by Delahay [104]
to take into account the presence of sulphate ions. Further modifica
tion by Barnes and Mathieson [105] and Reutschi and Angstandt [106]
include the basic sulphates: PbO.PbS04, 3PbO.PbS04.H20, and 4PbO.PbS04
and typical E/ph plo'ts are shown in Figure 6.9 arid 6.10. These thermodynamic
diagrams are based on equilibrium conditions and predict spontaneous
reactions occurring on lead at different pH conditions. The
Pourbaix diagrams do not, however, contain any kinetic data and so
cannot be used to predict corrosion rates.
In the interior of the non-antimonial alloys, relatively high
pH conditions will prevail « pH 9) due to the blocking effect of the
fine lead sulphate crystals. Further corrosion of lead, will occur
- 76 -

-1. 2 o 2 4 6 8 10 12 14
FIG, 6,9, POTENTIAL/pH DIAGRAM OF THE LEAD/SULPHURIC ACID SYSTEM AT 25·C,
16
pH

E/V vs. Hg/H92S04 +1.5,..--___ ........ _---------------,
Il-Pb02 ---P
+1.0
+0.5
o
-0.5
-1.0
-1.5
S-Pb02 --I.' 'l--Ar--- Pb02/PbSO 4 (pH -0.48)
PbS04
Pb
mf-Hf--- Pb02/PbO.PbS04 (pH 6.35)
~oH+H--- Pb02/PbO (pH 9.34)
M11+t.1C.--- PbO/Pb (pH 9.34)
HtlIf----- PbO.PbS04/Pb (pH 6.35) --J+I
1-____ PbS04/Pb (p~ -0.48)
o 2 3 4 5
Distance/lJm
FIG. 6.10. SCHEMATIC REPRESENTATION OF THE MULTI-PHASE CORROSION LAYER AT DIFFERENT ELECTRODE POTENTIALS.~02]

by the dissociation of water, underneath the blocking sulphate layer.
This further corrosion will lead to the precipitation of lead oxide
and basic lead sulphates in the interior porous matrix [19,107-113]. The
mixed sulphate layer will be thermodynamically stable at these
relatively high pH values and this is in agreement with the Pourbaix
diagram presented in Figure 6.9. Lead oxide and basic lead SUlphates
formed during the discharge reaction have been shown to resist re
oxidation to some extent [114] and to favour the formation of alpha
lead dioxide. Alpha lead dioxide, has different properties [10] to
the other polymorph Beta lead dioxide. Ruetschi [l14]has also shown
that alpha lead dioxide discharges at a higher rate per unit area and
that it also shows a tendency to passivate, limiting the electrode's
performance. This explanation agrees with the electrochemical data
in Chapter 5, where the non-antimonial alloys were shown to produce
a less porous surface coating, which eventually led to the passivation
of the electrode. Buchannan [115] in his recent photocurrent spectroscopy
studies on cycled lead alloys found the corrosion product on pure le~d
was of mixed oxide format, consisting of the semiconductor, lead oxide,
and basic lead sulphates. Buchannan also found that the corrosion
layer on pure lead was more extensive than on antimonial lead, infact
it was up to five times thicker. These results are also in agreement
with our electrochemical and morphological results.
Returning to the micrographs for the antimonial alloys
(Fig. 6.5 to 6.8). The antimonial alloys exhibit a surface morphology
which is consistent with the presence of prismatic block like crystals
of lead sulphate. This type of morphology leads to a more open
structure and has been shown by Ruetschi[102] in his study on ion
- 77 -

permeability through sulphate membranes not to restrict the free
flow of acid (sulphate and bisulphate ions) through the outer
corrosion layer. This will lead to similar pH conditions inside
the porous matrix as exist in the e'lectrolyte « pH 1) which is in
contrast to the conditions in the non-antimonial corrosion product.
The Pourbaix diagram in Figure 6.9 predicts that only lead sulphate
will be thermodynamically stable and that the conditions will be
unfavourable for the formation of lead oxide and basic lead sulphates.
Bagshaw and Wilson [116] have shown that due to the acidic conditions,
beta lead dioxide will be the favoured polymorph on recharge.
Ruetschi U14] has shown that this polymorph enhances the capacity
of the electrode and so prolongs cycle life. These observations
are again in agreement with the electrochemical results from
Chapter 5. The A.C. impedance data also indicated an increase in
porosity for the antimonial alloys and that a resistive sulphate film
is not formed at the metal-dioxide interface. The microscopic
evidence presented here gives support to this theory.
6 .4 CONCLUSIONS
1 ) The non-antimonial alloys and pure lead show a surface
morphology which is non porous and uniform.
2)', The antimonial alloys show the greatest reluctance to nucleate
lead sulphate.
3) The antimonial alloys have a surface film of highest porosity.
- 78 -

CHAPTER 7
THE CORROSION OF VARIOUS LEAD ALLOYS IN 5M HZS04
7.1 INTRODUCTION
A considerable amount of work has been undertaken
the corrosion rates of various lead alloys [117-121].
to investigate
The morphology
of the corrosion product has also received considerable interest [122].
In Chapter 5 the electrochemical properties of several pertinent
lead alloys used in battery grid construction have been reported. The
results were interpreted in terms of corrosion rates and cycle life
performance. These factors are very important in assessing new and
better alloys for grid construction,however, the mode of destruction
of the grid has yet to be considered. The grid corrosion plays an
important role in determining the life of the battery plate.
The battery grid serves not only as a frame work for the lead
dioxide paste retention, but as an electron carrier. The corrosion
of the grid will lead to surface oxidation and a reduction in the
cross-sectional area of the battery grid and consequently to a drop
in conductivity. If the mode of corrosion attack is localised
(i.e. at grain boundaries), then although the rate of corrosion will be
low, the results can be dramatic with the eventual severing of the
grid network.
This Chapter records and discusses the mode of corrosion attack
in comparison to the alloy microstructure on various antimonial and

non-antimonial alloys used in battery grid manufacture. In this
experiment a potentiodynamic cycling regime was adhered to, as it
was felt that this would more accurately imitate actual battery
cycling. The results have been elucidated using optical and scanning
electron microscopy.
7.2 EXPERIMENTAL
The potentiodynamic cycling was carried out between the potential
limits of 1350 mV and 1100 mV (Vs. Hg/Hg2S04). The descending sweep
was at a rate of 1 mY/sec which represents a slow rate discharge,
this was then followed by an ascending sweep at SO mY/sec to recharge
the electrode. The electrode was then held at 1350 mV (top of charge
potential) for twenty hours after each cycle in order to emulate
typical float service. The composition of the lead alloys is shown in
Table 7.1.
Analysis weight per cent !
i Code Sb Se Sn Ca Pb
, I i
I A - - - - 99.999 I B - - 0.3 0.1 remainder I
I C 0.1 remainder - - -I D 1.8 0.04 - - remainder
E 5 - - - remainder
F 10 - - - remainder
Table 7.1. The composition of the alloys used in the corrosion
experiments
- 80 -

All of the working electrodes were prepared as previously stated
from aged and cast alloys and the electrodes underwent the pretreat
ment discussed in Chapter 4.
On completion of four weeks continuous potentiodynamic cycling,
the working electrodes were removed from the electrolyte and discharged
in a controlled manner across a I kn resistance against a charged
negative battery plate. The charge dissipated during this process
was monitored to ensure full discharge of the electrode.
The corrosion layer was then removed by immersing the electrode
in a solution of SM ammonium acetate for 24 hours. The surface
condition of the alloy backing was then examined using scanning
electron microscopy. The results were then compared with the micro
structure of the microtomed lead alloy.
7.3 RESULTS AND DISCUSSION
7 .3. 1 Pure Lead
Figure 7.1 shows the microstructure of a microtomed section of
a cast pure lead sample (99.999%). The microstructure is consistent
with the presence of columnar type crystals which are formed by the
. cooling process within the mould.
The grain size is large (~O.07 mm grain diameter) and Young [87]
has shown that this type of structure will promote uniform corrosion
rather than attack at the grain boundary. This type of corrosion
attack was observed (Figure 7.2) after four weeks cycling. The
micrograph in Figure 7.2 indicates that the corrosion is very uniform
- 81 -

•
FIG. 7.1. MICROTOMED SECTION OF PURE LEAD. MAGNIFICATION X 50.
FIG. 7.2. S.E.M. MICROGRAPH SHOWING THE MODE OF CORROSION ATTACK FOR PURE LEAD AFTER FOUR WEEKS CYCLING. MAGNIFICATION X 750.

over the whole alloy surface and it should also be noted that the alloy
shows no preference for grain boundary attack.
7.3.2 The Antimonial Alloys
Antimonial alloys have traditionally been used in battery grid
manufacture for nearly a century [16]. The phase diagram for
antimony according to Raynor [123] is shown in Figure 7.3.
u o
~~------------~,
wt ~ Sb
, , , ,
Figure 7.3. Equilibrium diagram for antimony [123]
An alloy with an antimony content of around 10 wt.% has a low
melting point and freezes very rapidly over a narrow temperature
range. The alloy is also very rigid due to the formation of a
segregated dendritic network of eutectic, this can readily be seen in
Figure 7.4. As the antimony content decreases then the amount of
eutectic decreases proportionally leading to a softer alloy (Figure
7.5). The micrograph shows the 5% antimony alloy to have a fairly
fine and uniform grain structure. At low antimony levels, the
- 82 -

•
FIG. 7.4. MICROTOMED SECTION OF 10% ANTIMONY. MAGNIFICATION X 50.
FIG. 7.5. MICROTOMED SECTION OF 5% ANTIMONY. MAGNIFICATION X 50.

•
FIG, 7,6, MICROTOMED SECTION OF 1,8% ANTIMONY, MAGNIFICATION X 50,
FIG, 7,7, S,E,M, MICROGRAPH SHOWING THE MODE OF CORROSION ATTACK FOR 10% ANTIMONY AFTER FOUR WEEKS CYCLING, MAGNIFICATION
X 750,

•
FIG. 7.g. S.E.M. MICROGRAPH SHOWING THE MODE OF CORROSION ATTACK FOR 5% ANTIMONY AFTER FOUR WEEKS CYCLING. MAGNIFICATION
X 750.
FIG. 7.9. S.E.M. MICROGRAPH SHOWING THE MODE OF CORROSION ATTACK FOR 1.g% ANTIMONY AFTER FOUR WEEKS CYCLING. MAGNIFICATION
X 750.

alloys tend to crack and promote shrinkage porosity due to the increase
in the temperature range over which it freezes. These problems have
been overcome to some extent by the addition of grain refiners to the
alloy. Typical grain refiners in use are Selenium [124-126], Copper
[127], Sulphur [128] and Arsenic [1]. The addition of these grain
refining elements act to form a more uniform microstructure by
providing nuclei on which the solidifying alloy can nucleate and
grow. These effects can be seen in Figure 7.6 for the 1.8 wt.%
antimony alloy.
After four weeks corrosion, the antimonial alloys showed marked
differences in the mode of attack. Figure 7.7 shows the alloy
surface for the 10% antimonial alloy after four weeks corrosion.
The micrograph shows that the segregated eutectic region has been
preferentially eroded away. This leads to widespread corrosion
which is fairly uniform over the whole electrode surface. This type
of corrosion will consequently be less detrimental to grid life. As
the antimony content decreases the mode of attack changes. The
micrographs in Figures 7.8 and 7.9 show the mode of attack for the
5% and 1.8% antimony alloys respectively. As these micrographs
illustrate, the corrosion occurs mainly at the grain boundaries. The
grain boundary penetration is more extensive in the 5% alloy (Figure
7 . .8) as a result of more eutectic present. Hondros and Seah [129] have
investigated the segregation of various alloys during solidification.
They have shown that the grain boundaries in an antimony containing
alloy will be nearly 100% antimony and will thicken with increasing
antimony content. This explains the micrographical evidence
presented here.
- 83 -

At the top of charge potential (1350 mV Vs. Hg/HgzS04) antimony
will pass into solution (in the +5 oxidation state) where it can be
reduced at the negative electrode or be readsorbed back onto the
positive paste (Figure 1.3). Thus corrosion will occur preferentially
at the antimony rich regions which as Hondros et al. [129] stated.
occurs at the grain boundaries in low antimony alloys. In the
higher antimony content alloy. attack will occur in the antimony
rich dendritic network. The corrosion rate of the low antimonial
alloys will be less than for the 10%·antimony alloy. yet the corrosion
is more likely to be detrimental due to its localised nature.
7.3.3 Lead-Calcium Alloys
The lead-calcium based alloys have in recent years become
established alternatives to the lead-antimony system for battery
grids. The lead-calcium system has been shown to be age hardened by
grain refinement and precipitation of Pb3Ca. The existence of the
intermetallic compound Pb 3Ca has been confirmed by Hansen [130] and
the phase diagram is shown in Figure 7.10.
w 0:
" '< "' ~ 150 :>: w -
a
OL-~O~2--~G---'~O--~;'--~'8' CALCIUM lw' '-)
Fig. 7.10. Equilibrium diagram for lead-calcium [130]
- 84 -

•
FIG, 7,11, MICROTOMED SECTION OF LEAD-CALCIUM, MAGNIFICATION X 50,
FIG, 7,12, S,E,M, MICROGRAPH SHOWING THE MODE OF CORROSION ATTACK FOR LEAD-CALCIUM AFTER FOUR WEEKS CYCLING, MAGNIFICATION
X 750,

FIG. 7.l3.
FIG. 7.15.
•
MICROTOMED SECTION OF LEAD-CALCIUM-TIN. MAGNI F I CATION X 50.
S.E.M. MICROGRAPH SHOWING THE MODE OF CORROSION ATTACK FOR LEAD-CALCIUM-TIN AFTER FOUR WEEKS CYCLING. MAGNIFICATION X 750.

The microstructure of the lead calcium alloy is shown in Figure 7.11.
This is consistent with the presence of a large grained structure
(0.08 mm diameter) with segregated particles of Pb 3Ca. After the
four weeks corrosion, the alloy has undergone uniform attack but
with preferential dissolution of the segregated particles of Pb 3Ca
(Figure 7.12). The dissolution of Pb 3Ca has led to a series of
uniform voids over the electrode surface.
7.3.4 Lead-Calcium-Tin Alloy
The micrograph in Figure 7.13 shows a large grain structure
(0.08 mm diameter) with segregated intermetallic particles.
Prengaman [89] has recently published a phase diagram for the 1ead-
calcium-tin system (Figure 7.14) which indicates the intermetallics
are of the composition Sn3Ca.
2.4 5n
~12.2'LL __ ----i'" 2. 0
• a 1. 8
~ 1. 6
Il. 1.. ~ 1.2 .. • (PbxsnyC.! .. Sn)C<l.) o i:i 1. 0 , ..
. .
. . • 2 ~~::::;::=~========
:'J .01 ,02 .0) .04 .05 .06 ,01 .08 ,09 .10.11 wr.tGHT PERCEflT C",LCIU"I
Fig. 7.14. Lead-ca1cium-tin phase diagram, lead rich region at room temperature. Prengaman [89]
- 85 -

He also reports that these intermetallics resist anodic attack. After
four weeks corrosion,in our study, the alloy surface showed uniform
corrosion with the precipitates undergoing corrosion at a different
rate (Figure 7.15). This is consistent with the findings of
Prengaman .
7.4 CONCLUSIONS
1) The non-antimonial alloys, particularly the pure lead and the lead
calcium-tin alloys underwent the most uniform corrosion.
2) The non-antimonial alloys are the most suitable for long term
float service.
3) If gassing rates (hydrogen evolution) are unimportant, the
higher antimony content alloys will suffice.
- 86 -

CHAPTER 8
THE ELECTROCHEMICAL PROPERTIES OF SOLID LEAD-BISMUTH
ALLOYS IN SM HZS04
8.1 INTRODUCTION
Bismuth constitutes a major contaminant of primary lead as
it is found concurrent with lead naturally. It is usually removed
from lead supplies by the Kroll-Betterson process which reduces the
bismuth content to 0.1 wt. %. This purification process is carried
out by treating molten lead with calcium and magnesium; the bismuth
forms a variety of intermetallic compounds with these addi ti ves ,
which then float to the surface of the vessel and are removed as
dross. If further purification of lead is desired either electrolytic
refining or the Jollivet process is employed. The Jollivet process
is similar to the Kro1l-Betterson but the drossing agent used is a
more expensive platinum-magnesium alloy. Davey V3l] has stated
that bismuth levels below 1 x 10- 3 wt. % are achievable by the above
mentioned methods. The manufacturers of 'maintenance free' battery
grids usually stipulate removal of bismuth to the lower level
« 1 x 10- 3 wt. %) thus increasing the cost of production. Many
workers have investigated the mechanical and electrochemical properties I
I
evaluate I I
of simple binary and ternary lead-bismuth alloys V,78,128,132-13S] to
the necessity of the expensive removal procedures for bismuth. A
recent review by Ellis and Hampson [21] gives a comprehensive resum~
of this work.
- 87 -

The heightened interest in the bismuth content of lead calcium
alloy for 'maintenance free' applications has led to a controversy
in the necessity to remove bismuth from the base lead alloy.
Ritchie [25,26] carried out casting trials on alloys containing
bismuth and concluded that bismuth has detrimental effects on the
physical properties of lead calcium alloys and should be removed at all
costs. This contradicts previously published work by Dr Cupua [136]
and Morgen [137] who found that bismuth « 12 wt. %) had very little
effect on the physical properties of pure lead. Myers et al. [22-24]
have also investigated the effect of bismuth on lead calcium alloys.
The first two papers [22,23] concern themselves with the mechanical
and physical properties of the bismuth containing alloys and postulate
that bismuth has beneficial effects on ultimate alloy strength and rate
of hardening after quenching. Later Myers [24]concentrated on the
electrochemical properties of bismuth additions to lead calcium alloys
and stated that bismuth additions to the alloy show no adverse
corrosion effects or excessive gassing rates. This is in agreement
with the work of Kilimnik and Rotinyan [138]and Drotschmann [139]who
independently found that bismuth increased the hydrogen overvoltage on
the negative plate of the battery. (This property is very important to
'Maintenance free' battery performance).
This conflict of opinion in the literature concerning tolerable
levels of bismuth led us to carry out our own investigations on binary
lead-bismuth alloys over a wide range of bismuth levels « 3 wt. %) using
linear sweep voltammetry, A.C. impedance and optical/electron
microscopy.

8.2 EXPERIMENTAL
A similar experimental regime to that described in Chapter 5 was
performed on the cast binary lead-bismuth alloys [140]. In an attempt
to simulate industrial practice the working electrodes were prepared
from cast lead alloys which had been allowed to age at room temperature
for a minimum of one month. The composition of the alloys is shown in
Table 8.1. All the electrodes underwent the pretreatment described in
Chapter 4.
Analysis wt. per cent. Code
Si Pb
A - 99.999
S 0.04 remainder
C 0.09 remainder
D 0.3 remainder
E 0.5 remainder
F 1 remainder
G 2 remainder
H 3 remainder
Table 8.1. The composition of the binary
Pb-Si alloys used in the
electrochemical investigation.
- 89 -

8.3 RESULTS AND DISCUSSION
The vo1tammograms in Figures 8.1 to 8.7 correspond to the various
binary lead-bismuth alloys on the first potential excursion to
2,000 mV and the return sweep to 600 mV (Vs. Hg/Hg2S04 in 5M H2S04)
at a constant sweep rate of 50 mY/so The vo1tammograms are similar
to those presented in Chapter 5 for pure lead and the various lead
alloys, hence similar arguments can be applied to explain the
pertinent features of the vo1tammograms. It should, however, be
stressed that the large nucleation overpotentia1 for the formation of
lead dioxide is apparent on the first cycle. The linear sweep
experiments were then continued between the potential limits of
600 mV and 1350 mV and the sweep rate was again kept constant at
50 mY/so The vo1tammograms in Figure 8.8 correspond to the various
lead-bismuth alloys over this restricted potential range after 4 h
continuous potentiodynamic cycling. Each vo1tammogram consists of
a well defined oxidation peak and a less well defined reduction
peak. The anodic current which represents the oxidation of lead
sulphate to lead dioxide does not return to zero at potentia1s greater
than 1350 mV,but starts to increase due to the electrode undergoing
oxygen evolution. These results are very similar to the vo1tammograms
presented for the antimonial and non-antimonial systems in Chapter 5.
The charge contained in the reduction peak is always in the range
85-95% of the oxidation peak, signifying that only a small amount
of current contributes to oxygen evolution per cycle and that the
electrode is fully charged after each cycle. The values for the
anodic'and cathodic peak capacities after 4 h cycling are given in
Table 8.2.
- 90 -

a: e
8
4
o
-4
-8
,
f-
I -
(V
I
.6 .8
, I
I , ,
/ " -
-
I I I , , 1 1.2 1.4 1.6 1.8 2
V FIG, 8,1, INITIAL L,S,V, FOR 3% BISMUTH: SWEEP RATE 50 MV/SEC,
a: e
8
4
o
-4
-8 .6 .8 1 1.2 1.4 1.6 1.8 2
V
F [G, 8,2, INITIAL L,S,V, FOR 2% BISMUTH: SWEEP RATE 50 MV/SEC,

8 a: Si
4 "
0-h===:;;::===========----I
-4
-8 .6 .8 1 1.2 1.4 1.6 1.8 2
V FIG. 8.3. INITIAL L.S.V. FOR 1% BISMUTH: SWEEP RATE 50 MY/SEC.
8 a: Si
4
-4
-8 .6 .8 1 1.2 1.4 1.6 1.8 2
V
FIG. 8.4. INITIAL L.S.V. FOR 0.5% BISMUTH: SWEEP RATE 50 MY/SEC.

a: s
6
2
-2
-6 .6 .8 1 1.2 1.4 1.6 1.8 2
V FIG. 8.5. INITIAL L.S.V. FOR 0.3% BISMUTH: SWEEP RATE 50 MV/SEC.
a: s
6
2
-2
-6 .6 .8 1 1.2 1.4 1.6 1.8 2
V
FIG. 8.6. INITIAL L.S.V. FOR 0.1% BISMUTH: SWEEP RATE 50 MV/SEC.

a: e
6
2
-2
-6 .6 . 8 1 1.2 1.~ 1.6 1.8 2
V
FIG. 8.7. INITIAL L.S.V. FOR 0.05% BISMUTH: SWEEP RATE 50 MV/SEC.

N I 0 -* N -" 0 ..... a:
.35
.25
. 15
.05
-.05
-. 15 600
f
A H
750 900 1050 1200 1350
FIG, g,g, CONSTANT RESPONSE CURVES FOR THE LEAD-BISMUTH ALLOYS OVER THE POTENTIAL RANGE 600-1350 MY AFTER CONTINUOUS CYCLING FOR 4H: SWEEP RATE 50 MY/SEC,

Code i I Charge of anodic Charge of cathode p mA/cm2
Ep/v peak/mC peak/mC
A
B
C
D
E
F
G
H
Table 8.2.
3.5 1.145 2.70 2.30
3.3 1.150 2.50 2.13
2.5 1.160 1.60 1.36
2.9 1.175 1.83 1.68
3.1 1.20 1.92 1. 73
3.4 1.250 2.05 1.84
3.38 1.260 2.35 2.14
3.3 1.280 2.54 2.13
A comparison of i p ' Ep ' charge of anodic peak and cathodic
peak for pure lead CA) and the alloys CB-H) at 50 mV/s in
5M H2S0"
The relationship between peak potential CEp) for the oxidation
peak representing the conversion of lead sulphate to lead dioxide and
sweep rate (v) in the form of an Ep Vs. loglO sweep rate is displayed
in Figure 8.9. This follows the equation developed by Canagaratna
et al. ~~ for describing the formation of lead dioxide at constant
thickness per cycle. The results for the lead-bismuth alloys is in
agreement with the data presented for the various lead alloys in
Chapter 5. As is evident from the straight line plots and the data in
Table 8.2, the potential of the oxidation peak (Ep) shifts positive
with increasing bismuth content. This indicates that the kinetic
barrier required to convert lead sulphate to lead dioxide increases
- 91 -

> "-
0>W
1.3
1. 25
1.2
1. 15
1.1
1. 05
-1 - 1 • 1 -1.2 -1.3 -1.4 -1.5 -1.6 -1.7
Log rSIIEEP RRTE)
FIG. 8.9. PLOT OF Ep VS LOG SWEEP RATE FOR THE LEAD-BISMUTH ALLOYS.

with bismuth content. This is in conflict with the work of Kelly [141]
who states that bismuth has little effect on peak potential. However,
the alloys used in her electrochemical study were prepared from a
low purity lead base in contrast to the high purity lead base used
in this study. The difference ,in impurity levels could explain this
discrepancy.
From Table 8.2, it can be seen that lead undergoes the greatest
anodic attack with bismuth exerting an overall protective effect.
Figure 8.10 shows a plot of anodic peak capacity against bismuth
content. The trend is very similar to that seen for the antimonial
system; the addition of bismuth initially lowers the peak capacity
until it reaches a position of maximum stability at a level of
0.1 wt. '% bismuth. The capacity of the electrodes then continues to
increase with increasing bismuth content. This trend supports the
work of Brynsteva et al. [142] who showed that the resistance to anodic
attack decreases to a minimum at 3.5 wt. % bismuth. Gonzales et al.
[143] Mashouets and Lyandres [144,145] have also shown independently
that bismuth increases the rate of corrosion of various lead alloys.
The observed initial drop in capacity (Figure 8.10) can be explained
in terms of grain refinement caused by the incorporation of bismuth
into the lead lattice. Young [87] has shown that the extent of
corrosion is related to grain size, with the degree of penetration
decreasing with diminishing grain size.
Bismuth has been shown to exhibit some grain refining properties:
Emmerich and Beckmann [1] have studied the effect of bismuth on
lead cable extrusion and found that above 0.02 wt. % bismuth grain
refinement is unmistakable. Myers et al. [24] as a result of their
studies on the effect of bismuth additions to lead calcium alloys
- 92 -

U G
3
2.5
2
1.5 o .5 1.5 2 2.5
COMPOSITION ~t % Bt
FIG. 8.10. PlOT OF CHARGE OF ANODIC PEAK VS BISMUTH CONTENT AFTER 4H CONTINUOUS CYCLING.
3

« 0.1 wt. % Bi), stated that bismuth improves grain refinement and
leads to increased rates of age hardening.
The grain refinement effect of this study is supported by the
micrographs presented in Figures 8.11 to 8.14. The micrographs are
of cast lead alloys which are unetched and microtomed to reveal the
grain structure. Pure lead (Figure 8.11) has the largest grain size
with visible grain boundaries. On addition of bismuth the grain size
decreases (Figures 8.12 to 8.14) resulting in small grain structure
at high bismuth content. This grain refinement causes depletion of
lead at the surface which is available for anodic attack. However, as
the level of bismuth increases, bismuth becomes more available for
dissolution and the effect of grain refinement is outweighed by the
increase in corrodability of the alloy U42]. From our observations
the optimum level for limited anodic corrosion of planar lead-bismuth
alloys is at about 0.1 wt % bismuth.
With continued potentiodynamic cycling,the variation of anodic
peak capacity with cycle number follows a similar trend to that
presented for pure lead and the lead calcium binary alloy (Chapter 5)
The lead bismuth profiles are displayed in Figure 8.15. After about
8,000 cycles the capacity of all the bismuth alloys reaches a constant
value of about 0.8 mC. This profile can be explained in terms of a
sulphation - passivation theory: Initially an extensive, lead dioxide
deposit is formed with continued cycling, this then reaches a
maximum thickness where further attack of the substrate is restricted
and the capacity then deminishes as the electrode passivates.
Passivation is brought about by the restriction of acid reaching the
interior of the porous deposit, this results in a restrictive film of
~. 93 ".

•
'I ...... \
i J J j
" - 1 I ,"" . ~
-' I .• L,,':',i ..... ~ __ •. ..'. _ .cc·
FI0, 8,11, MICROTOMED SECTION OF PURE LEAD, MAGNIFICATION X 50,
FIG, 8,12, MICROTOMED SECTION OF 3% BISMUTH, MAGNIFICATION X 50,

•
FIG, 8,13, MICROTOMED SECTION OF 0,5% BISMUTH, MAGNIFICATION X 50,
FIG, 8,14, MICROTOMED SECTION OF 0,1% BISMUTH, MAGNIFICATION X 50,

3 u
" ..... w '-" R '" a: x: u
oH 2.5
G
F 2
" ... ,' , 0
" .... ' '0 0 , 1.5 .' .' .,'
" .' ,,'
" ,',.'
o· . ,',,'
..... , ,
o 1000 2000 3000 4000 5000
CYCLE NUMBER
FIG, 8,15, VARIATION OF CHARGE OF THE ANODIC PEAK WITH CYCLE NUMBER FOR THE LEAD-BISMUTH ALLOYS.

lead sulphate forming at the metal/lead dioxide interface. Further
evidence is provided by the measurement of the ohmic resistance of
the electrodes after varying cycle times. Table 8.3 displays the
ohmic resistance of the electrode after 4 h, 12 hand 24 h cycling, the
ohmic resistance is obtained by an impedance measurement at 50 kHz.
Alloy
Pb
Pb-Bi (0.04%)
Pb-Bi(0.09%)
pb-Bi (0.3%)
. Pb-Bi(0.5%)
Pb-Bi (1 %)
Pb-Bi (2%)
pb-Bi (3%)
Table 8.3.
Ohmic resistance of the electrode and solu-
tion after varying cycle times
4 h 12 h 24 h
3 il 4 il 6il
2.7 il 3.4 n 5.5 n
2.6 n 3.8 n 5.9 n
2.8 n 3.5 n 6 n
2.8 n 4.1 n 5.2 n
2.7 n 3.9 n 5.4 n
2.8 n 3.6 n 4.9 n
2.7 n 3.9 n 5.1 n
,S,\-"",l.C>"v.. "'''-:0. -±. oD'l..,..5Z., .
The mean value of five separate experiments for
the ohmic resistance of the various lead alloys
after 4 h, 12 hand 24 h cycling (50 kHz)
It is evident from Table 8.3 that there is a formation of a
resistive layer.
Further evidence for the depletion of acid within the porous
matrix which is needed to promote a sulphate barrier is provided by
- 94 -
.

•
FIG. 8.16. S.E.M. MICROGRAPH FOR 3% BISMUTH AFTER 12H CONT-INUOUS POTENTIODYNAMIC CYCLING. MAGNIFICATION X 10,000
FIG. 8.17. S.E.M. MICROGRAPH FOR 2% BISMUTH AFTER 12H CONTINUOUS POTENTIODYNAMIC CYCLING. MAGNIFICATION X 10,000

•
fIG, 8,18, S,E,M, MICROGRAPH FOR 1% BISMUTH AFTER 12H CONTINUOUS POTENTIODYNAMIC CYCLING, MAGNIFICATION X 10,000
FIG, 8,19, S,E,M, MICROGRAPH FOR 0,5% BISMUTH AFTER 12H CONTINUOUS POTENTIODYNAMIC CYCLING, MAGNIFICATION X 10,000

•
FIG. 8.20. S.E.M. MICROGRAPH FOR 0.3% BISMUTH AFTER 12H CONTINUOUS POTENTIODYNAMIC CYCLING. MAGNIFICATION X 10,000
FIG. 8.21. S.E.M. MICROGRAPH FOR 0.1% BISMUTH AFTER 12H CONTINUOUS POTENTIODYNAMIC CYCLING. MAGNIFICATION X 10,000

FIG, 8,22, S,E,M, MICROGRAPH FOR 0,04% BISMUTH AFTER 12H CONTINUOUS POTENTIODYNAMIC CYCLING, MAGNIFICATION X 10,000

the micrographs in Figures 8.16 to 8.22. The micrographs show a surface
morphology which is consistent with the presence of a tight compact
film of lead sulphate. This film, as stressed in Chapter 6, acts as
a semipermeable membrane and blocks the free passage of sUlphate and
bisulphate ion promoting higher pH conditions within the deposit.
This promotes the formation of basic lead sulphates and lead oxides.
The mixed sulphate layer will favour the formation of a lead
dioxide on recharge and lead to the eventual drop in capacity.
Clearly, the lead-bismuth alloys behave in a similar way to both
lead and the lead calcium alloy. However, from the position of
bismuth in the periodic table, it might be expected to behave like
antimony. The use of ionic radius ratios to predict the cycle life
behaviour of bismuth produces a more accurate analysis of its
observed behaviour. Latimer [146] has shown that in strong acids
bismuth is present as BiO+:
2H+ + BiO+ + 3e = Bi + H20
a E "+0.32V
The presence of BiO+ gives a radius ratio value of 0.9 which does
not fall into the range of 0.4 to 0.7 which Burbank [92] stated will
lead to extended cycle life behaviour. This therefore gives further
evidence to support the idea that ionic radius ratio values are
useful in predicting new guest ions for future 'maintenance free'
battery grids.
- 95-
o

8.4 CONCLUSIONS
1) Small additions of bismuth exert a protective effect on pure
lead.
2), Theanodic corrosion of planar lead-bismuth alloys increases
with bismuth content.
3) Low level additions (~ 0.1 wt. %) may be beneficial to lead
alloys. These findings agree with the previous work of
Myers [22-24] and contradicts the conclusions of Ritchie [25,26].
4) The use of ionic radius ratios to predict cycle life has
proved successful for bismuth.
- 96 ~

CHAPTER 9
THE ELECTROREDUCTION PROCESSES OF PLANAR AND POROUS LEAD
DIOXIDE ON VARIOUS LEAD ALLOY SUPPORTS
9.1 INTRODUCTION
The discharge reaction at the positive electrode of the lead
acid battery involves the development of a new phase which results
in totally different electrical properties to those of the underlying
phase. This concept of phase formation is typical of many other
reactions occurring in corrosion and battery technology.
In recent years there has been a renewed interest in electrocrystall
isation reactions. This has resulted in a reconsideration of the
mathematical approaches to the subject, in particular the nucleation
and growth models. The continuous geometric models presented by
Harrison and Thirsk [55], Fleischmann and Thirsk [54] and Armstrong
et al. [56] have been extended and the production of new complimentary
ideas developed. However, the treatment of nucleation theory has remained
essentially the same since the adaptation of the instantaneous and
progressive models developed in the early sixties [58,147]. These models
do not necessarily consider the mechanism of nucleation but rather
depend on the geometry of the growing nuclei. Nuclei can be produced
simultaneously (instantaneous nucleation), or form linearly with
time (progressive nucleation). Once the form of nucleation has been
established, it is the crystal growth patterns which determine the
- 97 -

electrochemical response of the system to a perturbation. The deriva
tion of the equations representing current-time relationship requires
the calculation of the area of the growing centres at any time, t.
At the start of the nucleation and growth process, intercrystal
collision presents no problem, however, when the growing centres
coalesce the mathematical models break down and the overlap problem
must be included in the model. Initially, an approach based on the
theory of Avrami [60] or the related "modified Evans" approach [148],
was adopted to tackle this problem and the derivation has been
discussed in Chapter 3.
The nucleation and growth theories have been extended by
Armstrong and Harrison to account for three dimensional growth. [56,149] •
Recently, a new model has been presented by Fletcher and Matthews,
[150] which attempts to solve the volume transformations for a number
of nucleation and growth processes in what is known as a "2'>D system".
The 2'>D nucleation and growth pattern is so called because the crystals
forming on an electrode surface only extend into one half of the third
dimension as growth into the substrate is forbidden.
Other transient techniques have been used to formulate rate
equations and to study the potential dependence of the rate constant
for nucleation and growth under various conditions. Carslaw and
Jaeger [151] and Frank [152] have also investigated the rate of mass
transport in electrocrystallisation processes in unstirred SOlutions.
Astley et al. [153] and Hills et al. [154] have derived equations to
describe the resulting current-time transients under diffusion control.
Other, non-continuous methods of interpreting nucleation and
growth have been published and calculations of the Monte-Carlo type [155]
~ 98 ~

have been applied to test the validity of the theory of two dimensional
nucleation as derived by the continuous models [156]. New methods
of data analysis are regularly presented in the scientific literature
[157-162] and many of these recent publications contribute significantly
to the overall understanding of nucleation and growth theory.
Recent investigation into the discharge behaviour of lead
dioxide [163] have postulated that the alloy substrate will influence
the nucleation and growth mechanism of the discharge product, lead
sulphate. In this Chapter the electrocrystallisation process of
planar and porous lead dioxide on various pertinent lead alloy
substrates in 5M H2S04 have been investigated and discussed with a
view to identifying new and better alloys for maintenance free
battery applications. In this present study of the discharge
characteristics of lead dioxide, only a limited number of (1"''''.'~),
patterns have bee found to be applicable. Nevertheless, many
t · ent to the system different models hare been applied and those per m
under study are ;omprehensively detailed in Chapter 3. The results
d 'f' t' ns are required presented here, indicate that certain mo 1 1ca 10
to these equations in order to describe real porous systems.
9.2 QUASI-POROUS LEAD DIOXIDE
9.2.1 Experimental
The planar working electrodes were prepared as described in
Chapter 4 from cast and aged alloys as these were felt to best
represent conventional industrial practice: their compositions are
shown in Table 9.1.
- 99 -

Alloy composition in weight per cent
~~ Sb Se Sn Ca Pb
A - - - . - 99.999
B - - 0.3 0.1 remainder
C - - - 0.1 remainder
D 4.5 - - - remainder
E 1.8 0.04 - - remainder
Table 9.1. The composition of the various lead alloy
backings used in the electrochemical
investigation.
The electrode pretreatment and potentiodynamic cycling was similar to
that described previously in Chapter 5. The potentiodynamic cycling
was continued for 1,400 cycles (~10 h) to produce a thick layer of
quasi-porous lead dioxide. This Plant~ type process for lead dioxide
formation was adopted in order to highlight the alloy effect. After
an initial potential hold period of 10 minutes at 1250 mV (Vs. Hg/Hg2S04
reference electrode in 5M H2S04), the residual current fell to a
stable and negligible value. The electrode was then stepped
instantaneously to 600 mV and the resultant current-time transient
recorded. This potential step (1250 mV ~ 600 mY) represents a very ,
vigorous discharge regime. It was felt necessary to adopt this approach
to investigate the alloy effect on the nucleation and growth of lead
sulphate because in practice lead-acid batteries with non-antimonial
grids tend to passivate more readily after deep cycling.
- 100 _

9.2;2 Results and Discussion
Figure 9.1 displays the resultant current-time transients
obtained as a result of a 650 mY potential step on the various lead
alloys after 1,400 potentiodynamic cycles between the lead sulphate
and lead dioxide potential regions. The current-time behaviour is
typical of all the results obtained for the various lead alloy
supports and is indicative of a solid state nucleation and growth
process.
In all of the potential step experiments a current spike was
observed at the front of the rising and falling current transient.
This current spike was attributed to double layer charging due to
its short life (microseconds). The current spike fell to zero before
the rising transient was observed. The subsequent nucleation and
growth transient showed no rotation speed dependence indicating that
the electrode reaction is not under diffusion control. This gives
further evidence that lead ions do not leave the electrode during the
discharge reaction and that the processes is "solid state".
The distinctive shape of the transient can be explained by the
following:
The current initially rises as the lead sulphate nuclei form and
grow. This shape occurs when the transport of material to the
growing centres is not rate determining and the rate of growth
depends solely on geometric factors. Eventually, the size of
the growing nuclei will become limited in all directions as
the centres coalesce and the rate of increase in the current
response will diminish and the transient reaches a maximum.
- 101 -

« g
-3
-2
-1
b
0-2 0-4 06 t Is)
FIG. 9.1. CURRENT - TIME RESPONSE FOR THE CATHQD1C R~DUCTION OF LEADDIOXIDE <1250 MY) ,0 LEAD SULPHATE (bWMV) ON THE VARIOUS LEAD ALLOYS.
« 1.8 r---------.-----~--_.----------r_----~ __ ~ • .....
1.6
1.4
1.2
I
.8
.6
.4
.2
B
o .4 . B 1.2 1.6
512*10- 2
FIG. 9.2. A LINEAR VS t2
PLOT FOR THE VARIOUS NON-ANTIMONIAL ALLOYS.

Finally the current falls to zero when the growing lead sulphate
crystals overlap completely and block the transport of charge
and material to the active sites.
It is shown in Fig. 9.1 that the shape of the transients are
consistent with a progressive nucleation mechanism, that is, the
active nuclei form linearly with time [54]. It can be concluded that
the developed quasi porous lead dioxide deposit does not contain
sufficient nuclei for the reaction to proceed via an instantaneous
mechanism and that the slower progressive nucleation mechanism prevails.
The dimensionality of the growing process can be identified by fitting
the various nucleation and growth equations (Eq. 3.56 to Eq. 3.60) to
the rise and fall of the current-time transients. Dimensionless
curve fitting (i/im Vs. t/tm) has also proved to be the most
satisfactory method for testing the congruence of the results.
To the rising part of the transient various relationships
describing both two and three dimensional growth have been investigated.
A plot of log i Vs. log t gave a slope of 2 indicating the appropriate
power of t. Figures 9.2 and 9.3 show the theoretical i Vs. t 2 plots
for the equation:
(3.43)
p
where: M is the molecular mass of the growing phase.
p is the density of the growing phase.
N is the number of nucleation sites. 0
Z is the nucleation coefficient.
and k is the nucleation rate constant.
- 102-

a: • "--1.6
1.6
1.4
1.2
1
.6
.6
. 4
.2 L-______ ~ ________ ~ ________ ~ ______ ~
o
FIG. 9.3. A LINEAR
N
0-..... -:z: ...J
4
3.5
:5
2.5
2 .5
• 4- • B 1.2
2 i VS t PLOT FOR ANTIMONIAL ALLOYS.
R
1.5 2 2.5 3 3.5
FIG. 9.4. A LINEAR Lni/t2
VS t' PLOT FOR THE NON- ANTIMONIAL _________________________ ALLOYS.
1.8
512*10-2

These straight line plots indicate that the growth of lead sulphate
on lead dioxide follows two dimensional growth kinetics characterised
by equation (3.43) which is derived for the growth of cylinders.
From the linear plots in Figures 9.2 and 9.3 it is possible to extract
kinetic information corresponding to the rate of formation of lead
sulphate. Table 9.2 displays the rate constants for pure lead and the
various lead alloys under study.
Alloy Nucleation rate constant kN x 10-16/moI 2 cm-6sec-1
0
A 7.9
B 20
C 8.6
D 10
E 9.9
Table 9.2. The nucleation rate constants for the
various alloys under electrochemical
investigation.
It is evident that the nucleation of lead sulphate on quasi porous
lead dioxide occurs at a comparable rate on the various antimonial and
non-antimonial alloys; the binary lead calcium alloy is analogous
with a larger rate constant.
To the falling transient, again various relationships have been
fitted and equation (3.58) was found to have the best fit.
- 103 -

-------N~~'r======~======~======~~======r=======,_------t
" -z: ...J
:5
o
E
2 ~ ____ -...l ______ ~ ______ ~ ______ ~ ____ ~
.02 .03 .04
St3 FIG. 9.5. A LINEAR Lni It' VS t' PLOT FOR THE ANTIMONIAL ALLOYS.
• lr-------~------~~------+-------; -" -• B
.6
.4
.2
x
o~------~------_+--------~------~ .5 I 1.5 2 o
FIG. 9.6. DIMENSIONLESS 2-D PROGRESSIVE CURVE FITTING FOR PURE TIT. LEAD. X = EXPT. VALUES, -- = THEORETICAL VALUES.

1. nF1fhMk2ZNot2
= exp
p [
-1fM2ZNok2t 31 3p2 j
(The symbols are as previously described)
(3.58)
This equation represents two dimensional growth with subsequent over-
lap of the growing centres. The theoretical fits of lni/t2 Vs. t 3
are displayed in Figures 9.4 and 9.5. At long times the model was
found to breakdown and the current decay for the experimental data
was slower than that predicted by the geometrical model of Fleischmann
and Thirsk [54]. This is because the theoretical model does not
account for the problems associated with the growing phase as
coverage nears completion.
As previously stated, the congruence of the results can be
further tested by comparing dimensionless plots of the theoretical
equations with those for the experimental data [164]. The theoretical
values can be readily obtained by differentiating the nucleation and
growth equations with respect to time and setting d'i/dt to zero at
the turning point. At this point the current is a maximum (im) and
the time is known (tm). This has been adequately covered in
Chapter 3. Figures 9.6 to 9.10 show the dimensionless fits for the
non-antimonial alloys (A.B. and C.) and the antimonial alloys (D. and
E.) It is shown that the theoretical values obtained for a two
dimensional growth process with progressive nucleation gives a very
good fit over the majority of the transient. However, at long times
the model deviates from the experimental results.
- 104 -

• -..... -•
.8
.8
.4
.2
x O~ ______ ~ ______ ~ ________ +-______ -4
o .S 1 1.5 2
TIT. FIG. 9.7. DIMENSIONLESS 2-D PROGRESSIVE CURVE FITTING FOR LEAD-CALCIUM
TIN. X = EXPT. VALUES, -- = THEORETICAL VALUES.
FIG. 9.8.
• -..... -1~-------+------~~-------+--------T
.8 .
• 8
x
.4
X
.2
X
0 0 .S I.S 2
TlTa DIMENSIONLESS 2-D PROGRESSIVE CURVE FITTING FOR LEAD-CALCIUM, X = EXPT. VALUES, -- = THEORETICAL VALUES.

• -.... -
FIG. 9.9.
• -..... -
0+-___ _+_-----+----_------1-o .5 1 1.5 2
~. TIT. DIMENSIONLESS 2-D PROGRESSIVE CURVE FInING FOR 5% ANTIMONY, X ± EXPT. VALUES. -- = THEORETICAL VALUES.
1~--------+-------~~--------~--------~
.8
.8
.4
x .2
x
O~---~----+_------__ --------I-o .5 1 1.5 2
TIT. FIG. 9.10. DIMENSIONLESS 2-D PROGRESSIVE CURVE FInING FOR 1.8% ANTIMONY,
X = EXPT. VALUES, -- = THEORETICAL VALUES.

9.3 PASTED POROUS LEAD-DIOXIDE
9.3.1 Experimental
The porous pasted working electrodes were of the design
described in Chapter 4. The automotive battery paste was pressed
into a teflon cavity terminated with a shaped lead alloy support.
The alloy backing acting as a current collector. The pasted
electrodes were cured in order to limit the free lead content. The
oxidation of the lead powder was catalysed by the water present,
hence the curing process took place in 100% humidity at 50oC. The
humidity also limits the shrinkage of the paste due to water loss.
Finally the electrodes were dried at about 100"C before formation to
lead dioxide. The pasted electrodes were then galvanostatically
oxidised in 2M H2S04 until the electrode reached a constant and
stable potential and oxygen was freely evolved from the electrode
surface (about 24 h). The porous working electrodes were then transferred
to a standard three limbed cell containing 5M H2S04 and potentiostatically
held at 1200 mV (Vs. Hg/Hg2S04 reference electrode) for 1 hr to
allow the acid to equilibrate deep within the pores of the electrode.
After this potential hold,the electrode was potentiostatically stepped
to a new potential and the current-time transient recorded. The size
of the potential step was varied on the pure lead electrode to
investigate the effect of overpotential on the rate and mechanism of the
electrocrystallisation processes occurring. The effect of the backing
alloy was also investigated.
- 105 -

9.3.2 Results and Discussion
Figures 9.11 to 9.17 present representative current-time transients
for the discharge reactions of a lead dioxide electrode on a pure lead
backing at different overpotentials. A freshly prepared and charged
electrode was used for each potentiostatic pulse experiment. The
different overpotentials represent typical discharge characteristics of
the positive plate of the lead acid battery under normal operating conditions.
Each transient shows an initial fall followed by a current peak (Figure
9.11- 9.17). The initial falling transient cannot be assigned to
double layer charging as in the quasi-porous system due to the extent
of the time scale (seconds), and therefore must be accounted for in
the reaction mechanism. The current peak is typical for a solid state
nucleation and growth process as described by the geometric models
originally developed by Fleischmann and Thirsk [54]. Further evidence
for a solid state mechanism is that the transients are rotation speed
independent, hence the reaction does not proceed via a soluble solution
species. The overall shape of the transient is typical of many electro
crystallisation reactions involving the formation of a passivating film
under potentiostatic conditions [77,78,132]. A satisfactory description
of the mechanism for these types of transients is often difficult due to
the problems in modelling the formation of an insulating film on the
electrode, where the surface eventually becomes blocked and therefore
inactive.
Dawson [165] attempted to model the discharge reaction of electro
deposited lead dioxide at low overpotentials using a dissolution
precipitation mechanism. Rotating ring disc studies have failed to
- 106 -

5
2
1
o o
n=50mV
1000 2000 3000 TIME/S
FIG. 9.11. THE CURRENT-TIME RESPONSE FOR THE REDUCTION OF POROUS LEAD DIOXIDE TO LEAD SULPHATE ON A PURE LEAD BACKING. POTENTIAL STEP 50 MV (1200-1150 MV).
Cl: e
"I-
15
~ 12 0:: 0:: :;:) U
9
6
3
o
n=90mV
o 400 800 1200 1600 2000 2400 TIME/S
FIG. 9.12. THE CURRENT-TIME RESPONSE FOR THE REDUCTION OF POROUS LEAD DIOXIDE TO LEAD SULPHATE ON A PURE LEAD BACKING. POTENTIAL STEP 90 MV (1200-1110).

a: e
...... I-
15
~ 12 a::: a::: ::J u
9
6
3
o
n=100mV
o 400 800 1200 1600 2000 2400 TIME/S
FIG, 9,13, THE CURRENT-TIME RESPONSE FOR THE REDUCTION OF POROUS LEAD DIOXIDE TO LEAD SULPHATE ON A PURE LEAD BACKING, POTENTIAL STEP100MV (1200-1100 MV),
25 a: e
...... I-
~ 20 a::: a::: ::J u
15
10
5
o
n=120mV
o 200 400 600 800 1000 1200 TIME/S
FIG, 9,14, THE CURRENT-TIME RESPONSE FOR THE REDUCTION OF POROUS LEAD DIOXIDE TO LEAD SULPHATE ON A PURE LEAD BACKING, POTENTIAL STEP 120 MV (1200-1080 MV),

Cl: e , I-
30
~ 24 et: et: ;:)
U
18
12
6
o
n=130mY
o 100 200 300 400 500 600
TIME/S FIG. 9.15. THE CURRENT-TIME RESPONSE FOR THE REDUCTION OF
POROUS LEAD DIOXIDE TO LEAD SULPHATE ON A PURE
. 30 Cl: e , I-
~ 24 et: et: ;:) U
18
12
6
o
LEAD BACKING. POTENTIAL STEP 130 MV (1200-1170 MV) •
n=160mY
o 100 200 300 400 500 600
TI ME/S FIG. 9.16. THE CURRENT-TIME RESPONSE FOR THE REDUCTION OF
POROUS LEAD DIOXIDE TO LEAD SULPHATE ON A PURE LEAD BACKING. POTENTIAL STEP 160 MV (1200-1140 MV).

30 cc & "-I-
~ 24 0:: 0:: ::::l U
18
12
6
o o
n=200mV
100 200 300 400 500 600 ~
TIMElS FIG. 9.17. THE CURRENT-TIME RESPONSE FOR THE REDUCTION OF
POROUS LEAD DIOXIDE TO LEAD SULPHATE ON A PURE LEAD BACKING. POTENTIAL STEP 200 MV (1200-1000 MV) •
cc e
"I:z: lIJ
• 8
~ .75 ::::l u
.7
.65
.6 2.5 3
n=50mV
3.5 4 4.5 5 5.5 *1015/S12
FIG. 9.18. A LI NEAR i VS t 2 PLOT FOR THE 50MV POTENT! AL STEP.

identify any soluble Pb 2+ species formed during the discharge reaction
in sulphuric acid [169J. Also the solubility of Pb 2+ is at a minimum in
5M H2S0 4 [5], therefore Dawson's hypothesis is highly improbable. A more
likely mechanism to account for the current-time response is suggested
by Harman et al. [166]. The suggested mechanism proposed to account
for the results presented here (Figures 9.11 to 9.17) takes place via
a two stage process involving an adsorbed Pb 2+ intermediate on the
porous lead dioxide surface. The existence of an adsorbed intermediate
is highly probable on lead dioxide as it has been shown to have
extensive adsorbitive properties [99]. Initially, after the potentio-
static pulse has been applied to the electrode, the current response
will be at a maximum. This is a result of the large rate of formation
of the adsorbed Pb 2+ species. As time progresses, the rate of formation
of the adsorbed species decreases and the current response of the system
correspondingly decreases as the available surface area of the electrode
diminishes. The concentration of the intermediate Pb 2+ species in the
close vicinity of the electrode surface then reaches a maximum. This
reaction can be represented by equation (9.1).
kf + Pb4+ < ) PbS04 d - 2e a s
kb (9.1)
Once the concentration of adsorbed species has reached an equilibrium
value, the rate determining reaction will be the incorporation of lead
sulphate into the lattice, equation (9.2).
kl PbS04ads --+ PbS04lat (9.2)
- 107 -

As this stage is rate determining, the current response of the system will
follow the typical geometric models as described previously in Chapter 3.
From the rising transients in Figure 9.11-9.17, it is possible to
identify the nucleation and growth process. However, only tentative
suggestions can be made as the initial current spike influences the
response of the system in the latter stages. As stated previously, the
dimensionality of the growth process can be identified by fitting the
various nucleation and growth equations (Equations 3.56 to 3.60) to the
rising part of the current peak. Various relationships describing both
two and three dimensional growth have been investigated and the equation
giving the best fit was found to be equation (3.43) and indicates that
i = (3.43)
p
(the symbols are as discussed previously) .
the growth of lead sulphate on porous lead dioxide follows a two dimensional
growth process with progressive nucleation which is similar to that
obtained on the quasi-porous lead dioxide electrodes. Figures 9.18 to
9.20 show the theoretical i Vs. t 2 plots for the rising part of the transient.
To the falling transient no appropriate theoretical equation gave an
acceptable fit, this is most likely due to the limitations of the nucleation
and growth equations to planar electrodes [54,55].
From the slope of the rising transient it is possible to extract
kinetic data. However, due to the influence of the initial falling transient
on the subsequent solid state growth process, only comparative figures
are given rather than absolute values. The slope of the plots in Figures
9.18 to 9.20 have been used to calculate the nucleation rate constant
- 108-

10 a: & ..... .....
:z: 9 lJJ
0::: 0::: ~ u
8 n=100mV x
7
6 n=90mV
5 1 2.8 4.6 6.4 8.2 10
*1013/S12
FIG. 9.19. A LINEAR i VS t' PLOT FOR THE 90 MY AND 100 MY POTENTIAL STEP.
a: &
..... ..... :z: lJJ 0::: 0:::
30
B 25
20
15 2 4
n=160mV
n=130mV
n=120mV
6 8 10 *10f2lSf2
FIG. 9.20. A LINEAR ~ VS t' PLOT FOR THE 120 MY, 130 MY, 160 MY AND 200 MY POTENTIAL STEP.

using equation 3.43. The rate constants were found to vary with over-
potential (Table 9.4).
, n/mV Nucleation rate constant kZN
0 x 10-17/molZcm-6sec-l I
50 3.1 X 10⁻⁴
90 0.22
100 0.51
120 3.7
130 4.6
160 14
200 15
Table 9.4. The potential dependence of the nucleation rate constant
for the formation of lead sulphate in 5M HzS04
The increase in the rate constant explains the shift of the current peak
to shorter times with increasing overpotential. When equation (3.43) is
differentiated and di/dt is set to zero, the time of the current maxima
(tm) can be related to the nucleation constant, No and the rate constant,
k.
t 3 = m (9.3)
Therefore, as the rate constant increases with overpotential, tm will
decrease. A plot of log kZN Vs. n is presented in Figure 9.21 and gives o
- 109 -

N -::.::: o
:z Cl
-10
j -12
-14
-16
-18
-20
I!J
I!J
o 20 40 60 80 100 120 140 160 180 200
'9 /mV
FIG. 9.21. A LINEAR PLOT OF LOG K2 Nb VS OVERPOTENTIAL.

a: e
10
8
6
4
2
o o 10
Pb-Ce.
20 30 40 50 •
M In
FIG. 9.22. THE CURRENT-TIME RESPONSE FOR THE REDUCTION OF POROUS LEAD DIOXIDE TO LEAD SULPHATE ON A LEAD-
a: e
10
8
6
4
2
o o
CALC IUM BACK I NG • POTENT! AL STEP 100 MV (1200-1100 MV),
Pb-Ce.-Sn
10 20 30 40 50
Mln
FIG. 9.23. THE CURRENT-TIME RESPONSE FOR THE REDUCTION OF POROUS LEAD DIOXIDE TO LEAD SULPHATE ON A LEADCALCIUM-TIN BACKING. POTENTIAL STEP 100 MV (1200-1100MV).

Cl: &
10
8
6
4
2
o o 10
SI. Sb
20 30 40 so Mln
FIG. 9.24. THE CURRENT-TIME RESPONSE FOR THE REDUCTION OF POROUS LEAD DIOXIDE TO LEAD SULPHATE ON A 5% ANTIMONY BACKING. POTENTIAL STEP 100 MV (1200-1100 MV).
Cl: &
10
8
6
4
2
o o 10
1. 81. Sb
20 30 40 SO
Mln FIG. 9.25. THE CURRENT-TIME RESPONSE FOR THE REDUCTION OF
POROUS LEAD DIOXIDE TO LEAD SULPHATE ON A 1.8% ANTIMONY BACKING. POTENTIAL STEP 100 MV (1200-1100 MV).

a s lope of 130 mY per decade. However, KNo' not .K2NO is proportional
to current and hence the slope is equivalent to a tafel type slope of
65 mY per decade. This indicates that the discharge of lead dioxide
takes place via a two electron transfer. This provides further evidence
that the discharge reaction occurs via a two dimensional progressive
nucleation and growth process.
Figures 9.22 to 9.25 present typical current-time transients
for the various lead alloys. The overpotential was fixed at 100 mY
which is typical potential drop for a normal discharge curve. The
transients are very similar to those presented for pure lead and again
a similar progressive two dimensional nucleation and growth model can
be applied to the data. It can therefore be concluded
that the alloy substrate has no visible effect on the mechanism of
discharge for lead dioxide.
9.4 CONCLUSIONS
1) The data presented indicates that the discharge reaction of lead
dioxide occurs via a two dimensional growth process with
progressive nucleation.
2) The alloy substrate was also shown to have little, if any, effect
on the current-time response of the reaction. It must be stressed
that there is difficulty in analysing and interpreting the data
because the presently developed nucleation and growth models do
not take into account the porosity and complexity of the reaction
under discussion. However, it was felt that the present models
are satisfactory for comparative results to be discussed.
-110 -

CHAPTER 10
FINAL DISCUSSION
The cyclic voltammetric studies in Chapter 5 showed that pure lead
undergoes greater anodic attack than the antimonial and non-antimonial
alloys which exert some overall protective effect. The shape of the
voltammograms and A.C. impedance studies also indicated that the
electrochemically formed lead dioxide exhibits a higher degree of
porosity on the antimonial alloys than on the other alloys. This
was supported by evidence obtained by scanning electron microscopy.
(Chapter 6)
The corrosion studies on the various lead alloys in Chapter 7
revealed a difference in the mode of anodic attack, a factor important
in developing better alloys for maintenance free applications, as
localised corrosion is far more destructive than uniform corrosion.
The non-antimonial alloys all exhibit uniform corrosion with the lead
calcium binary alloy showing clearly the dissolution of the intermetallic
particles of Pb3Ca. It was demonstrated that for the antimonial
alloys the mode of attack depended on antimony content. At low
antimony concentrations «5% Sb), anodic attack was generally
confined to the grain boundaries. As the antimony concentration
increased, anodic attack occurred at the inter-dendritic network of
eutectic. Hence, at higher antimony content (>5% Sb), the corrosion
attack was greater but less destructive due to its uniform nature.
- 111 -

This work could be extended to include a comprehensive X-ray diffraction
study on the corrosion product to identify a and 8 lead dioxide ratios.
It would also be of interest to ascertain grain boundary pentration and
corrosion depth using photo current spectroscopy.
On continuous potentiodynamic cycling the non-antimonial alloys
were found to passivate more readily than those containing antimony
(Chapter 5). This was attributed to a non-conducting film of lead
sulphate forming at the electrode/lead dioxide interface. A.C. impedance
studies also showed the formation of a resistive film with continued
cycling.
The reasons for the difference in behaviour of the alloys was
attributed to morphological differences in the formed lead dioxide
layer (Chapter 6). The porous lead dioxide film which forms on
the antimonial alloys allows the free diffusion of acid deep into
the pores of the electrode. Under these conditions, the polymorph,
8 lead dioxide, is thermodynamically stable, and has been shown to
promote long cycle life [10]. The hon-antimonial alloys develop a
tight compact film which effectively blocks the penetration of acid
to the Pb02/Pb interface. An increase in pH develOps in the porous
mass where the formation of a lead dioxide will be thermodynamically
favourable along with lead monoxide and basic lead sulphates depending
on potential. These compounds have been shown to resist re-oxidation
[10] and so limit cycle life. In calcium containing alloys, it was
postulated that the passivation is brought about by a binary film of
calcium SUlphate and lead SUlphate (Chapter 5).
Further work could be carried out to identify calcium sulphate,
tin dioxide and other alloy corrosion products in the lead dioxide
- U2- -

film using advanced analytical techniques such as electron probe
analysis, neutron diffraction and energy dispersive techniques (EDAX).
The results in Chapters 5 and 6 also suggest that if the
morphology of the surface film on the non-antimonial alloys could be
disturbed to allow the free passage of acid, then the cycle life
performance of the alloys may be prolonged. This hyphothesis could
be tested by the study of alloy additions such as magnesium and
aluminium which are known to increase the corrosion rate of the non
antimonial alloys [80]. The dissolution of the ions from the electrode
surface may be sufficient to disrupt the lead dioxide film and allow
the free passage of acid.
The potentiostatic pulse experiments in Chapter 9 were used to
elucidate the discharge mechanism of planar and porous lead dioxide.
They have indicated that the reaction proceeds via a 2- dimensional
progressive nucleation and growth process. At present the nucleation
and growth theory is not sufficiently advanced to take into account
real porous systems and needs to be developed further if the
differences the alloy substrate imparts are to be identified. At
present,work is underway at Loughborough University to develop the
nucleation and growth theory to this level [166].
In Chapter 5 it was suggested that ionic radius ratios could
be used to predict new alloys for maintenance free applications. This
has proved successful in the electrochemical study of bismuth
additions to lead (Chapter 8). In this study it was found that small
additions of bismuth «3%) had little effect on the electrochemistry
and cycle life performance of pure lead. It would however, be beneficial
to test the ionic radius ratio theory on a larger selection of alloy
additives.
- 113-

REFERENCES
[1] W. Hofmann, "Lead' and Lead Alloys", Springer-Verlag, Berlin
(1970) .
[2] "Lead", Lead Development Association, London (1985).
[3] G. P1ant~, Compt. rend., 50, (1860), 640-642.
[4] G.W. Vinal, "Storage Batteries", 4th ed., Wiley, New York,
(1955).
[5] H. Bode, "Lead-Acid Batteries", Wiley, New York, (1977), 374.
[6] J. Burbank, A.C. Simon and E. Wil1ihnganz, in P. Delahay and
C.W. Tobias (Eds.), Adv. E1ectrochem., ~, (1971), 157-251.
[7] O. Lodge, Nature, ~~, (1882),602 : 27, (1883),583.
[8] C. Fery and C. Cheneveau, Rev. Gen. Elec., !~, (1926), 296.
[9] E.H. Riesenfie1d and H.Z. Sass, E1ectrochem., ~9, (1933),219.
[10] M. llarak, "E1ectrochemica1 Power Sources", lEE Energy Series,
(1980), 165.
[11] J.H. Gladstone and A. Tribe, Nature, ~6, (1882), 342 26,
(1882), 602 : 27, (1883), 583.
[12] D.N.J."Craig and G.W. Vina1, Res. Nat. Bar. Stds., ,!i.. (1935)
449.
[13] W.H. Beck and W.F.K. Wynne-Jones, Trans. Faraday Soc., ~,
(1956) 1260.
[14] C.S. Barrett, Indust. Eng. Chem., ~, (1933), 297.
[15] S. Hattori, M. Yamaara, M. Kono, M. Yamone, H. Hakashima and
~. Yamashita, ILRZO Project LE-197, Semi-annual report (1974).
[16] E.J. Wade "Secondary Batteries", The Electricians Printing and
Publishing Co., (1902), 14.
[17] M. Barak "Electrochemica1 Power Sources" lEE Energy Series
(1980) 216-220.
- 114 -

[18] J. L. Dawson, M.1. Gillibrand and J. Wilkinson "Power Sources 3"
(D.H. Co1lins, ed.) Oriel Press, Newcast1e-upon-Tyne (1970), 1.
[19] P. Reutschi and R.T. Angstadt, J. E1ectrochem. Soc., Ill, (1964),
1323.
[20] I.K. Gibson, Chloride Technical Ltd., Project report No. 4280,
(1981) .
[21] S.R. E11is, M. Johnson, M.P. Brennan and N.A. Hampson,
Surface Technology, ~, (1985), 11-16.
[22] M. Myers, H.R. Van Handle and C.R. Di Martin, J. E1ectrochem.
Soc., .!~, (1974), 1526.
[23] M. }!yers, Presentation at 87th B.C.I. Convention (1975).
[24] J.L. Devitt and M. Myers, J. Electrochem. Soc., 123, (1976),
1769.
[25] E.J. Ritchie, ILRZO, Research Project LE82 and LE84, Progress
report No. 9 (1970).
[26] E.J. Ritchie, ILRZO, Research Project LE82 and LE84, Final
report (197l).
[27] M.J. Sparnaay, "The Electrical Double Layer", Pergamon Press,
Oxford (1972).
[28] H. He1mholtz, Wied. Ann., 2-, (1879), 377.
[29] A. Gouy, J. Phys.,·~, (1910) 457.
[30] D.L. Chapman, Phi1. Mag., ~, (1913), 457.
[31] D. Stern, Z. E1ektrochem., 30, (1924), 508.
[32] D.C. Grahame, Chem. Rev., ~, (1947), 441.
[33] M.A. Devanathan, J.O'M Bockris and K. MUller, Proc. Roy. Soc.,
London, 274, (1963), 55.
[34] T. Erdey-Grut and M. Vo1mer, Z. Physik Chem., 105, (1930), 203.
- 115 -

[35] J. Tafel, Z. Physik Chern., ~, (1905), 641.
[36] R. Pointe11i, Z. Elektrochern., ~ (1951), 128.
[37] G. Archdale and J.A. Harrison, J. E1ectroanal. Chern., ~,
(1972), 21.
[38] D. Sirnonsson, Ph.D. Thesis, Inst. Kernisk. Teknologi, Kung1,
Tekniska Hogskolan, Stockholm (1973).
[39] R. de Levie, in P. De1ahay (Ed.), Adv. Electrochern., 6, (1967),
329.
[40] J.O'M Bockris and S. Srinivasan, in "Fuel Cells: Their
Electrochemistry", MCGraw-Hill, New York (1969).
[41] J. Newrnan and W. Tiedrnann, Am. Inst. Chern. Eng. J., ~,
(1975), 25.
[42] A. Winsel, Z. Elektrochern., 66, (1962), 409.
[43] L.A. Matheson and N. Nichols, Trans. Electrochern. Soc., 73,
(1938), 193.
[44] P. Delahay, in "New Instrumental Methods in Electrochernistry",
Interscience Publishers Inc., New York (1966).
[45] R.S. Nicho1san and J. Shain, Anal. Chern., ~~, (1964), 706.
[46] W.M. Schwarz and J. Shain, J. Phys. Chern., 69, (1965),30.
[47] A. Sevick, ColI. Czech. Chern. Cornrn., ~, (1964), 706.
[48] W. Kernu1a and Y. Agabe, Z. E1ektrochern., ~~ (1955), 494.
[49] J.E.B. Rand1es, Trans. Faraday Soc., 44 (1948), 322, 327.
[50] L. Gierst, in "Trans. Syrnp. Electrode Proc. Philadelphia",
Wi1ey, New York (1959), 109.
[51] J.E.B. Rand1es, Discuss. Faraday Soc., 1, (1947), 11.
[52] K. Hladky, L.M. Callow and J.L. Dawson, Br. Corros. J., ~,
(1980), 20-25.
[53] E. Warburg, Ann. Physik., 67, (1899), 493; ~, (1901), 125.
- 116 -

[54] M. F1eischmann and H.R. Thirsk, Adv. E1ectrochem. E1ectrochem.
Eng., ~, (1963), 128.
[55] J.A. Harrison and H.R. Thirsk, in A.J. Bard (Ed.) E1ectroana1.
Chem., ~J (1971), 67.
[56] R.D. Armstrong and J.A. Harrison, J. E1ectrochem. Soc., 116,
(1969), 328.
[57] E. Hameenoja and N.A. Hampson, J. App1. E1ectrochem., 14
(1984), 449-459.
[58] M. F1eischmann and H.R. Thirsk, E1ectrochimica. Acta., ~.'
(1959), 146.
[59] A. Bewick, M. Fleischmann and H.R. Thirsk, Trans. Faraday Soc.,
58, (1962), 2200.
[60] M. Avrami, J. Chem. Phys., '!J (1939), 1103; ~ (1940), 212;
2.. (1941) 177.
[61] R.D. Armstrong, M. F1eischmann and H.R. Thirsk, J. E1ectroana1.
Chem., Q., (1966), 208.
[62] S. Webster, P.J. Mitche11, N.A. Hampson and J.1. Dyson, Surface
Technology, ~, (1984), 105-116.
[63} S. Kelly, N.A. Hampson, S.A.G.R. Karunathilaka and R. Leek,
Surf. Technol., ~, (1981), 349-355.
[64] H.F. Haring and U.B. Thomas, Trans. Electrochem. Soc., 68,
(1935), 293.
[65] S. Webster, P.J. Mitche11, N.A. Hampson and J.1. Dyson, J.
Electrochem. Soc., 133, (1986), 133-136.
[66] H.S. Penesar in D.H. Co11ins (Ed.), "Power Sources 3", Oriel
Press, Newcastle-upon-Tyne (1971).
[67] J.P. Carr, N.A. Hampson and R. Taylor, J. E1ectroanal. Chem.,
33, (1971), 109.
- 117 -

[68] M.P.J. Brennan and N.A. Hampson, J. E1ectroana1. Chem., 48,
(1973), 465; g, (1974), 1.
[69] T.F. Sharpe, J. E1ectrochem. Soc., ~24, (1977), 168.
[70] J.G. Sunderland, J. E1ectroana1. Chem., 2!, (1976), 341-345.
[71] W. Visscher, J. Power Sources, ~, (1977), 257.
[72] J.A. Bia1acki, N.A. Hampson and K. Peters, J. Appl. E1ectrochem.,
~3.-, (1982), 627.
[73] T.G. Chang, M.M. Wright and E.M.L. Va1eriote, in D.H. Co11ins
(Ed.) "Power Sources 6" (1976), 69.
[74] P. Casson, N.A. Hampson and K. Peters, J. E1ectrochem. Soc.,
g~.-, (1977), 11.
[75] M. F1eischmann and H.R. Thirsk, Trans. Faraday Soc., ~!, (1955),
71.
[76] S.G. Canagaratna, P. Casson, N.A. Hampson and K. Peters,
J. E1ectroana1. Chem., 79, (1977), 273.
[77] J. Bia1acki, Ph.D. Thesis, Loughborough University of Technology
(1983) .
[78] S. Ke11y, Ph.D. Thesis, Loughborough University of Technology
(1981) •
(79] J.A. Gonza1ez, J.J. Royeu1a and S. Feliu, Werst. Korros.,
~, (1975), 758.
[80] J. McWhinnie, Ph.D. Thesis, UMIST (1978).
[81] M.P.J. Brennan, B.N. Stirrup and N.A. Hampson, J. App1.
E1ectrochem. ,.~, (1974), 49-52.
[82] V. Dane1 and V. P1ichon, E1ectrochima. Acta., 28, (1983), 785.
[83] M. Maja and A. De1mastro, J. E1ectrochem. Soc., 131, (1984),
2756.
- 118 -

[84J P. Ruetschi and B.D. Cahan, J. Electrochem. Soc., 104,
(1957) 406.
[85J J.J. Lander, J. Electrochem. Soc., ?9, (1947), 467.
[86J J.L. Dawson in A.T. Kuhn (Ed.) "The E1ectrochemistry of Lead",
Academic Press, London, (1979), 309-365.
[87J J.A. Young, Proc. Battery Council International, (1975), 127-133.
[88J R.D. Prengaman, Paper 9, E1ectrochemica1 Society Fall Meeting,
Las Vagas (1976).
[89J R.D. Prengaman, "Advanced Lead Alloys for Maintenance Free
Batteries", LDA Report, London.
[90J M. Pourbaix, "Atlas d'Equilibres E1ectrochimiques", p.487,
Gauthier Vi11ars Paris (1963).
[91J J. BUrbank, in D.H. Collins (Ed.) "Power Sources 3", Oriel Press,
Newcast1e-upon-Tyne, (1970), 13.
[92J J. Burbank, Naval Research Laboratory Report No. 7256, (1971).
[93J D.E. Swets, J. E1ectrochem. Soc., 120, (1973).
[94J K. Purcell and J. Kotz, "Inorganic Chemistry", Ho1t-Saunders,
London (1971).
[95J L. Pauling, "The Nature of the Chemical Bond" 3rd Edition,
Corne11 University Press, (1960).
[96J E.J. Ritchie and J. Burbank, J. E1ectrochem. Soc., 117, (1970),
299.
[97J P. Casson, N.A. Hampson and M.J. Wi11ars, J. Electroana1. Chem.,
97, (1979), 21.
[98] N.A. Hampson, S. Ke11y and K. Peters, J. App1. E1ectrochem., ~,
(1981), 751-763.
[99J J.P. Carr, N.A. Hampson and R. Tay1or, J. E1ectroana1. Chem.,
§£.. (1978), 201.
- 119 -

[100] M. Keddam, Z. Stoynov and H. Takenouti, J. App1. E1ectrochem.,
I, (1977), 539-544.
[101] R. Darby, J. E1ectrochem. Soc., 116, (1966), 392; 496.
[102] P. Ruetschi, J. E1ectrochem. Soc., 120, (1975), 3.
[103] K. Huber, Z. E1ectrochem., ~~, (1955), 693.
[104] P. De1ahay, M. Pourbaix and P. Van Dysse1berrghe, J. E1ectrochem.
Soc., ~~.' (1951),57.
[105] S.C. Barnes and R.T. Mathieson, in D.H. CoUins (Ed.),' "Batteries
2", Pergamon Press, Oxford (1965).
[106] P. Ruetschi and R.T. Angstaridt, J. E1ectrochem. Soc., 105, (1958),
555.
[107] J. Burbank, J. E1ectrochem. Soc., 103, (1956); !04, (1957);
106, (1959).
[108] L.M. Levinzon, I.A. Aguf and M.A. Dasogan, J. App1. Chem.,
USSR., ~~, (1966), 556.
[109] D. Pavlov, E1ectrochima. Acta., ~, (1968), 2051.
[110] D. Pavlov, C.N. Poulieff, E. K1aja and N. I ordanov , J. E1ectro-
chem. Soc., 1~, (1969), 316.
[Ill] D. Pavlov and N. Iordanov, ibid, 117, (1970), 1103.
[112] D. Pavlov, Ber. Bunsenges. Phys. Chem., Z!, (1967), 398.
[113] D. Pavlov and R. Popova, E1ectrochima. Acta., ~, (1970), 1483.
[114] P. Ruetschi and B.D. Cahan, J. Electrochem. Soc., 60, (1958), 369.
[U5] J. Buchanan, Ph.D. Thesis, Southampton University (1985).
[116] N.E. Bagshaw and K.P. Wilson, E1ectrochim. Acta., !Q, (1965).
[117] J. Lander, J. E1ectrochem. Soc., 98, (1951), 213; ~~, (1951);
220; 103, (1956), 1.
[118] J. Burbank, J. Electrochem. Soc., 103, (1956), 86; !04, (1957),
693; 106, (1959), 369.
- 120 -

.-------------------------------------------------------
[119] K.R. Bullock, M.A. Butler, J. Electrochem. Soc., 133, (1986),
1085.
[120] A.A. Abou1 Azim, K.M. E1-Sobki and A.A. Khedr, Corrosion Science,
17, (1977); 415-423.
[121} M.A. Fawiy, G.H. Sedahmed and A.A. Mohamed, Surface Technology,
14, (1981), 257-264.
[122} N.R. Young, Chemistry and Industry, July (1980), 529-532.
[123] G.V. Raynor, The Institute of Metals (1951).
[124} U.K. Patent 622.512.
[125} German Patent, 2, 151, 733.
[126] U.S. Patent, 2, 148, 741.
[127} V. Huebner and A. Ueberschaer, 5th Int'l. Lead Conference,
Paris (1974).
[128] K.A. Dasojan, Dok. Akad. Nauk., USSR., 107, (1956), 863.
[129] E.D. Hondros and M.P. Seah, International Metals Reviews, 222,
(1977), 262-301.
[130] M. Hansen, "Constitution of Binary Alloys", McGraw-Hill, New York
(1958) .
[131] T. R.A. Davey, J. Metals, ~, (1956), 341.
[132] P. Casson, Ph.D. Thesis, Loughborough University of Technology
(1979) .
[133] J. Greenwood, Metal Rev., f3, (1961), 279.
[134] N.L. Parr, A. Mascott and A.J. Cracker, J. Inst. Met., 87,
(1957), 321.
[135] G. Kostorz and S. Mihailovich, Inst. Conf. Strength and Metal
Alloys Conf. Proc., !, (1970), 304.
[136] C.L. DI Cupua and M. Arnone, Atti. Acad. Lincei., ~, (1924),
28.
- 121 -

[137]
[138]
[139]
[140]
[141]
[142]
[143]
R.A. Morgen, L.G. Stevenson, F.C. Nix and E.H. Roberts, Am.
Inst. M.N. Met Eng. Tech. Pub., i, (1982).
A.B. Ki1imnik and A.L. Rotinyan, E1ectrokhimga, ~, (1969) 1234.
C. Drotschmann, Batterien, ~ (1965), 761.
S. Webster, P.J. Mitche11, N.A. Hampson and J.I. Dyson, I. Chem.
E. Symposium Series, ~ (1986), 199-209.
N.A. Hampson, S. Kelly and K. Peters,J. E1ectrpchem. Soc., 127 (1982).
V.J. Bryntseva, V.G. Bandzhe, Yu. D. Danaev, G.Z. Kiryakov and
L.A. Tskhe, Zasch Meta11, ~, (1967), 504.
J.A. Gonza1es, M. Rveju1a and S. Fe1ai, Rev. Met. (Madrid), r, (1971), 105.
[144] V.P. Mashouets and A.Z. Lyandres, Zhur. Prikl. Khim., ~,
(1948) 441.
[145] V.P. Mashouets and A.Z. Lyandres, Zhur. Prik1. Khim., 20,
(1947), 347.
[146] W.M. Latimer, "The Oxidation States of the Elements and their
Potential in Aqueous Solution", Prentice Hall, Eng1ewood Cliffs,
NJ., 2nd Edn. (1952).
[147] M. Fleischmann and H.R. Thirsk, E1ectrochim. Acta., ~.' (1960), 22.
[148] U.R. Evans, Trans.Faraday Soc., ~, (1945), 365.
[149] W. Davison and J.A. Harrison, J. E1ectroana1. Chem., 44, (1973), 213.
[150] J. F1etcher and D.B. Matthews, J. App1. E1ectrochem., 1~, (1981), 1.
[151] H.S. Cars1aw and J.J. Jaeger, in "Conduction of Heat in Solids",
C1arendon Press, Oxford (1959).
[152] F.C. Frank, Proc. R. Soc., London, Ser. A., 3~, (1956),586.
[153] D.J. Ast1ey, J.A. Harrison and H.R. Thirsk, Trans. Faraday Soc.,
64, (1967) 192.
- 122 -

[154] G.J. Hills, J. Thompson and D.J. Shifferin, Electrochim. Acta,
~, (1974), 657.
[155] R.G. Barradas, P.T. Boag and T.J. Vandernoot, J. Electroanal.
Chem., 151, (1983), 23-32.
[156] R.G. Baradas, D.A. Rennie and T.J. Vandernoot, J. Electroanal.
[157]
[158J
[159J
[160]
[161]
Chem., 144, (1983), 455-458.
S. Fletcher, J. Electroanal. Chem., }18, (1981), 419-432.
W. Kappus, E1ectrochim. Acta, 28, ~, (1983), 1529-1537.
E. Bosco and S. K. Rangaraj an, J. E1ectroanal. Chem., 134,
(1982), 213.
M.Y. Abyaneh and G. Halvorsen, J. E1ectroana1. Chem., 149,
(1983), 263-265.
R.L. Deutscher and S. F1etcher, J. E1ectroana1. Chem., 153,
(1983), 67-77.
[162] S. F1etcher, E1ectrochima. Acta, ~~, (1981), 211-217.
[163J J. Bia1acki, N .A. Hampson and F. Wilson, J. Appl. Electrochem.
15, (1985), 99-105.
[164] S. Webster, P.J. Mitche11, N.A. Hampson and J.I. Dyson, J.
E1ectrochem. Soc., 133, (1986), 137-139.
[165J J.L. Dawson, M.E. Rana, B. Munasiri and J. McWhinnie, in J.
Thompson (Ed.), "Power Sources 7", Academic Press, London (1979).
[166J N.F. Harman, P.J. Mitche11, in press,
[167] J.R. Vi1e11a and D. Beregekoff, Industr. Engng. Chem., 19 (1927)
1049.
[168] A. Schrader, Atzheft, 4th Ed. Berlin, Borntraeger (1957).
[169] S.R. E11is, private communication.
- 12.3-

APPENDIX
Preparation of lead microsections for examination of structure.
Lead is a very soft and ductile metal with a low melting
point of 327.3°C [1]. These physical properties cause considerable
problems when preparing specimens and finishing microsections for
microscopy. On polishin&the sample can easily become deformed even
under low pressure, giving rise to deformation which in turn changes
the structure of the alloy under investigation. Consequently, it is
essential to avoid all unnecessary polishing, excessive friction and
heating. This can be achieved by hand polishing on silicon carbide
paper (600 and 1200 grit) under a continuous flow of water. The
running water removes any dust formed and so helps limit deformation.
This is followed by polishing on a wool cloth with distilled water,
a few drops of dilute nitric acid and No. 1 alumina as the polishing
medium. Finally the sample is etched with 10% nitric acid or Vilella
solution [167] to remove any oxide film formed on polishing. For
microscopic observation of the alloy surface, the sample is rinsed
in distilled water to remove any adhering alumina, dipped in absOlute
alcohol and dried in hot air. It is important that the finished section
is not handled to avoid the formation of scratches. Photomicrographs
are taken as soon as possible, as samples tarnish readily in air.
A faster and more simple sample preparation technique is the microtome
method. This involves using a freshly 'broken' glass microtome blade
to remove the surface layer of the specimen. The first shavings of
- 124 -

10~m are removed, decreasing to l~M in thickness. Again the surface
oxide layer can be removed by etching in Vilella's solution or 10%
nitric acid. This technique has many advantages over the other
sample preparation techniques; it is quicker and it also limits
contamination of the sample by silicon carbide or alumina which is
very important if electrochemical measurements are to be carried out' on the
prepared sample.
In order to emphasise grain boundaries it may be necessary to
further etch the sample after polishing or microtoming. The most
important etching medium for lead and lead alloys were compiled by
Schrader in her etching manual, "Atzheft" [168] and some of the
important etches are summarised below:
Macroscopic etching of grain surfaces.
Development of microstructure and
grain boundaries.
Macroetch of pure lead and lead
bismuth alloy
Lead antimony alloys up to 2% Sb
- 125 -
Normal Vilella etching
medium: 16 cm3 nitric acid,
16 cm3 glacial acetic acid,
68 cm3 glycerol, etch for a
few minutes.
As above, etch for a few
seconds.
100 cm3 H20, 25 cm3 glacial acetic
acid, 20 cm3 H202(30%), 20 cm3
HN0 3, etch for 2 to 10 minutes.
3 parts glacial acetic acid, 1 part
of H2D.2 (9%), etch for 10 to 30
minutes depending on depth of
deformed layer. If necessary subse
quent treatment in conc. nitric acid.

Lead antimony alloys.
Unalloyed lead and lead calcium
alloy.
For lead-antimony above 2% Sb, lead
tin up to 3% Sn, unalloyed lead.
- 126-
3 part glacial acetic acid, 1 part
H202 (30%), etch 6 to 15 sec.
2 parts glacial acetic acid, 1 part
H202 (30%) etch 8 to 15 sec.
Electrolytic etching in 60 cm3 pure
perchloric acid and 40 cm3 water.
The specimen is the cathode a Pt.
spiral the anode,etch 0.75 to
1.5 min.

\