oxalic acid based chemical systems for electrochemical mechanical
TRANSCRIPT

OXALIC ACID BASED CHEMICAL SYSTEMS FOR
ELECTROCHEMICAL MECHANICAL PLANARIZATION OF COPPER
by
Viral Pradeep Lowalekar
A Dissertation Submitted to the Faculty of the
DEPARTMENT OF MATERIALS SCIENCE AND ENGINEERING
In Partial Fulfillment of the Requirements For the Degree of
DOCTOR OF PHILOSOPHY
In the Graduate College
THE UNIVERSITY OF ARIZONA
2 0 0 6

THE UNIVERSITY OF ARIZONA GRADUATE COLLEGE
As members of the Dissertation Committee, we certify that we have read the dissertation prepared by Viral Pradeep Lowalekar entitled Oxalic Acid Based Chemical Systems for Electrochemical Mechanical Planarization of Copper and recommend that it be accepted as fulfilling the dissertation requirement for the Degree of Doctor of Philosophy _______________________________________________________________________ Date: 06/30/06 Srini Raghavan _______________________________________________________________________ Date: 06/30/06 William Davenport _______________________________________________________________________ Date: 06/30/06
David Poirier Final approval and acceptance of this dissertation is contingent upon the candidate’s submission of the final copies of the dissertation to the Graduate College. I hereby certify that I have read this dissertation prepared under my direction and recommend that it be accepted as fulfilling the dissertation requirement. ________________________________________________ Date: 06/30/06 Dissertation Director: Srini Raghavan

3
STATEMENT BY AUTHOR This dissertation has been submitted in partial fulfillment of requirements for an advanced degree at the University of Arizona and is deposited in the University Library to be made available to borrowers under rules of the Library. Brief quotations from this dissertation are allowable without special permission, provided that accurate acknowledgment of source is made. Requests for permission for extended quotation from or reproduction of this manuscript in whole or in part may be granted by the head of the major department or the Dean of the Graduate College when in his or her judgment the proposed use of the material is in the interests of scholarship. In all other instances, however, permission must be obtained from the author.
SIGNED: Viral P. Lowalekar

4
ACKNOWLEDGEMENTS
First and Foremost, I would like to sincerely thank my advisor, Prof. Srini Raghavan
for his guidance and support in the completion of this dissertation. I want to send my
deepest appreciation to Prof. Raghavan for his advice and encouragement. Prof.
Raghavan has been very kind, patient and has always given me opportunity to explore
areas outside my research. Over the years, I have learned a lot from him for which I
would always remain indebted to him.
I would also like to thank my committee members: Prof. William Davenport and Prof.
David Poirier for being on my committee and taking time to read my dissertation. I would
also like to thank Dr. Jeffrey Sczechowski for proof reading my dissertation. I want to
acknowledge Dr. Kenneth Nebesny and Dr. Paul Lee with chemistry department for
helping me with the XPS characterization. My thanks and appreciations are also due to
Dr. Wayne Huang and Dr. Subramanian Tamilmani. As a friend and former fellow
graduate student, they taught me a lot during the early part of my graduate life and helped
me throughout. I would like to appreciate the help of Mr. Ashok Muthukumaran in
performing certain experiments. I would like to thank all my current and past research
colleagues and fellow graduate students who have made my graduate experience a
memorable one.
I must also acknowledge the financial support provided NSF/SRC Engineering
Research Center for Environmentally Benign Semiconductor Manufacturing.
I would like to thank all my friends in and around Tucson to making my stay here, an
enjoyable one. Finally, and most importantly, I want to convey my love and gratitude to
my parents, Mr. Pradeep Lowalekar and Mrs. Prerna Lowalekar, my brother, Mr. Vishal
Lowalekar, and my grandparents, for their unconditional love, affection, support, and
prayers, without which this would not have been possible. Last but not the least, I would
like to thank God for everything.
5
TABLE OF CONTENTS TABLE OF CONTENTS.................................................................................................... 5 LIST OF ILLUSTRATIONS.............................................................................................. 8 LIST OF TABLES............................................................................................................ 13 ABSTRACT...................................................................................................................... 16 CHAPTER 1: INTRODUCTION..................................................................................... 18
1.1. Introduction............................................................................................................ 18 1.2. Research Objectives............................................................................................... 24
CHAPTER 2: BACKGROUND....................................................................................... 25
2.1. Chemical Mechanical Planarization ...................................................................... 25 2.1.1. CMP Tools ...................................................................................................... 30 2.1.2. CMP Consumables – Pads .............................................................................. 33 2.1.3. CMP Consumables – Slurries ......................................................................... 36 2.1.4. CMP Mechanisms........................................................................................... 38
2.1.4.1. Oxide CMP .............................................................................................. 38 2.1.4.2. Tungsten CMP ......................................................................................... 39
2.1.5. Copper CMP ................................................................................................... 43 2.1.5.1. Nitric Acid Based Chemistries................................................................. 43 2.1.5.2. Ammonia Based Chemistries................................................................... 46 2.1.5.3. Hydrogen Peroxide Based Chemistries ................................................... 49 2.1.5.4. Hydroxylamine Based Chemistries.......................................................... 50 2.1.5.5. Iodate Based Chemistries......................................................................... 54
2.2. Integration Issues in Copper CMP for 65 nm Technology Node and Beyond ...... 59 2.2.1. Need for Low-k Materials............................................................................... 59 2.2.2. Integration Challenges for Copper/Low-k Interconnects ............................... 65
2.3. Electrochemical Mechanical Planarization (ECMP) ............................................. 71 2.3.1. Introduction..................................................................................................... 71 2.3.2. The ECMP Process ......................................................................................... 71 2.3.3. Topographic Control....................................................................................... 74 2.3.4. Line Resistance ............................................................................................... 75 2.3.5. Environmental Advantages............................................................................. 75
2.4. Pads/Electrodes for ECMP .................................................................................... 78 2.5. Chemistries for ECMP........................................................................................... 82 2.6. Importance of Static Etching in ECMP ................................................................. 87 2.7. Inhibitors for Copper.............................................................................................. 91 2.8. Oxalic Acid Based Chemistries ............................................................................. 97

6
TABLE OF CONTENTS - Continued CHAPTER 3: EXPERIMENTAL SET-UP AND MATERIALS .................................. 100
3.1. Theoretical Work ................................................................................................. 100 3.1.1. Potential – pH Diagrams............................................................................... 100
3.2. Experimental Methods ......................................................................................... 103 3.2.1. Laboratory Scale Electrochemical Mechanical Abrasion Cell (EC-AC) ..... 103 3.2.2. ECMP Experiment in EC-AC Tool .............................................................. 106 3.2.3. Static (no abrasion) Experiment in EC-AC Tool.......................................... 109
3.3. Electrochemical Measurements ........................................................................... 110 3.3.1. Potentiodynamic Polarization ....................................................................... 110 3.3.2. Anodic Polarization ...................................................................................... 116 3.3.3. Potentiostatic Experiments............................................................................ 117 3.3.4. Galvanostatic Experiments ........................................................................... 118
3.4. Cyclic Voltammetry............................................................................................. 119 3.5. Quartz Crystal Microbalance (QCM) .................................................................. 124 3.6. Chemical and Physical Analysis.......................................................................... 128
3.6.1. Atomic Absorption Spectrophotometry (AAS) ............................................ 128 3.6.2. Surface Profile Measurements ...................................................................... 129 3.6.3. Four Point Probe ........................................................................................... 133 3.6.4. X-ray Photoelectron Spectroscopy (XPS) .................................................... 136 3.6.5. pH Measurements ......................................................................................... 136
CHAPTER 4: RESULTS AND DISCUSSION.............................................................. 138
4.1. Potential-pH Diagrams......................................................................................... 138 4.1.1. Copper–Oxalic Acid–Water System............................................................. 138 4.1.2. Copper–Oxalic Acid–BTA–Water System................................................... 141 4.1.3. Copper–Oxalic Acid–TSA–Water System ................................................... 144
4.2. Anodic Dissolution of Copper in Oxalic Acid Solutions..................................... 147 4.2.1. Etch Rate of Copper in Oxalic Acid Solution at Different Applied Potentials....................................................................................................... 147 4.2.2. Identification of Inhibitors ............................................................................ 151
4.3. ECMP of Copper in the Presence of Abrasive Particles...................................... 154 4.3.1. Removal Rates of Copper during Abrasion in Oxalic Acid Solution – Need for Inhibitors........................................................................................ 154 4.3.2. Removal Rates of Copper during Abrasion in Oxalic Acid Solution – Effect of BTA as Inhibitor ............................................................................ 156 4.3.3. Removal Rates of Copper during Abrasion in Oxalic Acid Solution – Effect of TSA as Inhibitor.......................................................................... 159
4.3.3.1. Removal Rates of Copper in Oxalic Acid Solution Containing TSA – Effect of Particle Concentration............................................................. 162 4.3.3.2. Removal Rates of Copper in Oxalic Acid Solution Containing TSA – Effect of solution pH.............................................................................. 164

7
TABLE OF CONTENTS - Continued 4.3.3.3. Galvanostatic Study of Copper Removal in Oxalic Acid Solution Containing TSA – Effect of Current Density ........................................ 167 4.3.3.4. Galvanostatic Study of Copper Removal in Oxalic Acid Solution Containing TSA – Effect of Particles .................................................... 170 4.3.3.5. Galvanostatic Study of Copper Removal in Oxalic Acid Solution Containing TSA – Effect of Time before Polishing .............................. 172
4.4. ECMP of Copper in the Absence of Abrasive Particles ...................................... 175 4.4.1. Removal Rates of Copper during Abrasion in Oxalic Acid Solution – Effect of Concentration................................................................................. 176 4.4.2. Galvanostatic Study of Copper Removal in Oxalic Acid Solution Containing TSA– Effect of Current Density ................................................ 178 4.4.2. Galvanostatic Study of Copper Removal in Oxalic Acid Solution Containing TSA – Effect of TSA Concentration.......................................... 181 4.4.3. Galvanostatic Study of Copper Removal in Oxalic Acid Solution – Comparison of BTA and TSA as Inhibitor ................................................... 184
4.5. Passivation Kinetics of Copper in Oxalic Acid Solution Containing TSA ......... 187 4.5.1. Dissolution of Copper in Oxalic Acid .......................................................... 187 4.5.2. Copper Dissolution in Oxalic Acid Containing TSA ................................... 188 4.5.3. Effect of TSA Concentration on Copper Dissolution in Oxalic Acid .......... 191 4.5.4. Comparison of TSA and BTA as Inhibitors for Copper in Oxalic Acid Chemistry...................................................................................................... 192 4.5.5. Inhibition Efficiency ..................................................................................... 196
4.6. Cyclic Voltammetry (CV).................................................................................... 199 4.6.1. Oxidation of Oxalic Acid.............................................................................. 199 4.6.2. Oxidation of Thiosalicylic Acid (TSA) ........................................................ 200 4.6.3. Cyclic Voltammetry (CV) and Quartz Crystal Microbalance (QCM) Studies in Cu/TSA System............................................................................ 203
4.7. XPS Characterization of Passive Film................................................................. 206 4.8. Mechanism of Passivation ................................................................................... 216
CHAPTER 5: CONCLUSIONS AND FUTURE WORK.............................................. 219
5.1. Conclusions.......................................................................................................... 219 5.2. Future Work ......................................................................................................... 224
REFERENCES ............................................................................................................... 225

8
LIST OF ILLUSTRATIONS Figure 1.1: Trends in logic and memory devices [1.4]. ............................................... 19 Figure 1.2: Cross sectional view of MOSFET device with three levels of metal interconnects: a) Surface topography without any planarization, b) planarized surface without topography buildup [1.7]........................... 22 Figure 2.1: Schematic of copper damascene process.(1) Electrodeposition of copper to fill vias and trenches. (2) Bulk copper removal. (3) Barrier metal removal and overpolish.................................................................... 28 Figure 2.2: Measurement of planarity [2.5] ................................................................. 29 Figure 2.3: Schematic of CMP tools: (a) rotary, and (b) orbital [2.7 -2.9].................. 32 Figure 2.4: Mechanism of tungsten CMP proposed by Kaufman et al. [2.31]. ........... 41 Figure 2.5: Pourbaix diagram for W-H2O system ....................................................... 42 Figure 2.6: Pourbaix diagram for Cu-H2O system. [Activities of dissolved copper species = 0.1 M, 10-3 M and 10-6 M] ........................................................ 45 Figure 2.7: Polish rate and etch rate of copper in nitric acid slurries [2.39]................ 45 Figure 2.8: Effect of NH4OH concentration on copper removal rate [2.41]................ 47 Figure 2.9: Pourbaix diagram for Cu-NH3-H2O system .............................................. 48 Figure 2.10: Pourbaix diagram for Cu-hydroxylamine-H2O system overlaid on hydroxylamine-H2O system...................................................................... 53 Figure 2.11: Removal rate of copper in 0.5 M hydroxylamine solution as a function of pH. .......................................................................................... 53 Figure 2.12: Removal rates of copper disk with slurry containing 3% MoO2 and varying concentration of KIO3 at pH 4 [2.58]. ......................................... 57 Figure 2.13: Schematic of interconnect. ........................................................................ 60 Figure 2.14: Variation of time delay as a function of device generation [2.60]. ........... 62

9
LIST OF ILLUSTRATIONS - Continued Figure 2.15: (a) Cross-section SEM micrograph showing delamination of low-k film undergone CMP [2.66] and (b) Variation of time to CMP-induced delamination as function of modulus of low-k film [2.65, 2.66].............. 67 Figure 2.16: Relation between copper removal rate and applied charge [2.73]. ........... 73 Figure 2.17: Schematic representation of an ECMP process......................................... 73 Figure 2.18: Effect of downforce on low-k (k<2.5) wafers, shows peeling at high downforce and no peeling under ECMP................................................... 77 Figure 2.19: Schematic of pad/electrode structure used by Wada et al. [2.78]. ............ 79 Figure 2.20: Carbon polishing pad used by Kondo et al. [2.79]. [Inset: Electro-cell structure fabrication in carbon pad]. ......................................................... 80 Figure 2.21: Mechanism for electropolishing of copper in DI water as proposed by Wada..................................................................................... 84 Figure 2.22: Change in topography of copper by planarization in presence of inhibitor during ECMP process. ............................................................... 89 Figure 2.23: Change in topography of copper while polishing in aggressive chemistry with high static etch rate. .......................................................... 90 Figure 2.24: Chemical structure of various copper corrosion inhibitors. ...................... 96 Figure 2.25: Speciation diagram for oxalic acid - water system.................................... 99 Figure 3.1: Typical setup of the laboratory scale electrochemical abrasion cell (EC-AC tool)............................................................................................ 104 Figure 3.2: Cross-sectional view of the EC-AC tool. ................................................ 105 Figure 3.3: Schematic showing the offset between the pad and the copper sample.. 107 Figure 3.4: Tafel plot for simple system shown Tafel relationships and Tafel slopes [3.17]. ................................................................................. 113 Figure 3.5: Tafel plot of mixed electrode system of hydrogen and zinc electrodes [3.17]...................................................................................... 114

10
LIST OF ILLUSTRATIONS - Continued Figure 3.6: Schematic of potential sweep during cyclic voltammtery....................... 120 Figure 3.7: Cyclic voltammogram for a reversible single electron transfer reaction. 120 Figure 3.8: Influence of potential scan rate on voltammogram of a reversible reaction.................................................................................................... 123 Figure 3.9: Cyclic voltammogram for an irreversible reaction.................................. 123 Figure 3.10: Schematic of the front and rear side of the gold coated quartz crystals [3.19].......................................................................................... 126 Figure 3.11: Schematic of the QCM interfaced with a potentiostat to study the mass change of the sample with simultaneous electrochemical measurements [3.19]. .............................................................................. 127 Figure 3.12: Schematic diagram of a Alpha Step 200 surface profiler........................ 131 Figure 3.13: Preparation of abraded sample for step height measurement using profilometery........................................................................................... 132 Figure 3.14: Schematic representation of a four point probe technique. ..................... 135 Figure 4.1: Potential-pH diagram for copper-oxalic acid-water system for dissolved copper activity of 10-6 M. Note: indicate different overpotential values (0, 300 mV, 500 mV and 750 mV) for copper exposed to 0.1 M oxalic acid at pH 4....................................................... 140 Figure 4.2: Potential-pH diagram for copper-oxalic acid-BTA-water system: (a) BTA concentration of 0.005 M, and (b) 0.01 M BTA. Note: indicate different overpotential values (0, 300 mV, 500 mV and 750 mV) for copper exposed to 0.1 M oxalic acid at pH 4.............. 143 Figure 4.3: Potential-pH diagram of copper-TSA-water system overlapped on copper-oxalic acid-water system. Note: indicate different overpotential values (0, 300 mV, 500 mV and 750 mV) for copper exposed to 0.1 M oxalic acid at pH 4....................................................... 146 Figure 4.4: Static etch rate of copper in oxalic acid solution as a function of concentration and overpotential............................................................... 149

11
LIST OF ILLUSTRATIONS - Continued Figure 4.5: Estimated static rate of copper in oxalic acid solution as a function of concentration and overpotential (calculated from current density values). .................................................................................................... 150 Figure 4.6: Tafel polarization of copper in 0.1 M oxalic acid solution (pH 4) in presence and absence of BTA and TSA. ................................................ 153 Figure 4.7: Effect of oxalic acid concentration on removal rate of copper at potential of 500 mV with respect to OCP............................................... 155 Figure 4.8: (a) Removal rates (b) current vs. time profile of copper exposed to 0.1 M oxalic acid solution containing 0.001 M BTA and 1% SiO2 as a function of overpotential. [Note: 1μA/cm2 ≈ 0.2 Å/min of copper] .... 158 Figure 4.9: (a) Removal rate (b) Current vs. time profile of copper exposed to 0.1 M oxalic acid solution containing 0.01 M TSA and 1% SiO2 as a function of overpotential. [Note: 1μA/cm2 ≈ 0.2 Å/min of copper] ....... 161 Figure 4.10: Effect of silica concentration on removal rate of copper at 750 mV overpotential. ......................................................................................... 163 Figure 4.11: Removal rate of copper in 0.1M oxalic acid containing 0.01 M TSA as a function of solution pH at overpotential of 750 mV....................... 166 Figure 4.12: Variation of potential with time during abrasion of copper in 0.1 M oxalic containing 0.01 M TSA and 1% SiO2 for applied current densities of (a) 0.11 mA/cm2 and (b) 0.61 mA/cm2............................... 169 Figure 4.13: Effect of particle concentration on (a) measured potential, and (b) on copper removal rate in 0.1 M oxalic containing 0.01 M TSA. .... 171 Figure 4.14: Effect of time before polishing on removal rate of copper exposed to 0.1 M oxalic acid containing 0.01 M TSA and 1% SiO2 at a constant current density of 0.61 mA/cm2. ............................................................ 174 Figure 4.15: Removal rate of copper in the absence of particles as a function of oxalic acid concentration at overpotential of 750 mV. .......................... 177 Figure 4.16: (a) Removal rates and (b) potential vs. time profiles for copper abraded in presence of 0.3 M oxalic acid containing 0.01 M TSA at pH 4.................................................................................................... 180
12
LIST OF ILLUSTRATIONS - Continued Figure 4.17: (a) Removal rates and (b) potential vs. time profiles for copper abraded in solution containing 0.3 M oxalic acid and various concentrations of TSA at pH 4............................................................... 183 Figure 4.18: Comparison of BTA and TSA as inhibitor for copper exposed to 0.3 M oxalic acid solution at pH 4.......................................................... 186 Figure 4.19: Effect of oxalic acid concentration on mass change of copper coated QCM crystal at overpotential of 750 mV. .............................................. 189 Figure 4.20: Mass change of copper exposed to 0.1 M (top) and 0.5 M (bottom) oxalic acid containing 0.01 M TSA at different overpotential conditions................................................................................................ 190 Figure 4.21: Effect of TSA concentration on mass change of copper exposed to 0.3 M oxalic acid at overpotential of 750 mV. ...................................... 194 Figure 4.22: Mass change for copper exposed to 0.3 M oxalic acid at pH 4 containing (a) 0.005 M TSA and (b) 0.005 M BTA as a function of overpotential. ......................................................................................... 195 Figure 4.23: Comparison of inhibition efficiency of BTA and TSA in 0.3 M oxalic acid as a function of overpotential. ............................................. 198 Figure 4.24: Cyclic voltammogram for 0.01 M oxalic acid at pH 4, on platinum working electrode................................................................................... 202 Figure 4.25: Cyclic voltammogram for 0.01 M TSA at pH 4, on platinum working electrode................................................................................... 202 Figure 4.26: Mass change recorded during cyclic voltammetry experiment of copper exposed to 0.01 M TSA solution at pH 4 (no oxalic acid)......... 205 Figure 4.27: XPS spectra of (a) as received TSA solid and (b) copper exposed to solution containing 0.01 M TSA............................................................ 207 Figure 4.28: XPS spectra of Cu 2p1/2 and 2p3/2 peaks showing presence of cupric states on the surface. .............................................................................. 208

13
LIST OF ILLUSTRATIONS - Continued Figure 4.29: XPS spectrum of (a) carbon (C 1s) peaks and (b) oxygen (O 1s) peaks for copper surface (washed with ethanol) exposed to 0.01 M TSA and.for comparison, as received TSA standard spectrum is also shown. .................................................................................................... 211 Figure 4.29(c): XPS spectrum of sulfur 2p peaks for copper surface (washed with ethanol) exposed to 0.01 M TSA and. For comparison, as received TSA standard spectrum is also shown. .................................................. 212 Figure 4.30: Attachment of TSA molecule to the copper surface. ............................. 212 Figure 4.31: XPS spectrum of sulfur 2p peaks obtained from oxidized TSA film shown disulfide formation. .................................................................... 215 Figure 4.32: Complete structure of TSA film on the copper surface......................... 215 Figure 4.33: Schematic representation of proposed mechanism. .............................. 218

14
LIST OF TABLES
Table 1.1: Microprocessor interconnect technology requirement predicted in ITRS 2005 [1.5]. ............................................................................................. 20 Table 1.2: DRAM interconnect technology requirement predicted in ITRS 2005 [1.5]. 21 Table 2.1: Degree of planarity [2.5]................................................................................ 29 Table 2.2: List of major types of pads and their properties [2.13]................................... 35 Table 2.3: Calculated values of Ecorr and icorr for different oxidizers............................... 44 Table 2.4: Dissolution and removal rates of copper in various slurry chemistries investigated by Lee et al………………….………………………………....56 Table 2.5: Removal rates and dissolution rate of copper films at pH 4 Slurry A: 3wt% MoO2 + 3 wt% KIO3…………….………………...….....58 Table 2.6: Assumed values to create figure 2.11………………..………………….…...62 Table 2.7: List of candidate low-k materials [Bold are true low-k]…………..….……..63 Table 2.8: MPU Interconnect technology requirements - near term years…..…….……64 Table 2.9: Comparison of properties of low-k materials and oxide..…………….……..66 Table 2.10: Summary of copper disk electropolishing data……………………………..84 Table 3.1: Free energy of formation of various ligands and their copper complexes estimated using group estimation method.................................................... 102 Table 4.1: Measured current densities as a function of oxalic acid concentration and overpotential. ............................................................................................... 149 Table 4.2: Comparison of actual and estimated dissolution rate of copper .................. 150 Table 4.3: Open circuit potentials and Tafel parameters of copper in 0.1 M oxalic acid solution (pH 4) in the presence and absence of additives. ................... 152 Table 4.4: Dissolution rate of copper as a function of oxalic acid concentration and overpotential. ............................................................................................... 189

15
LIST OF TABLES - Continued Table 4.5: Oxidation potentials of some organic compounds………...……………….200 Table 4.6: Atomic concentrations of elements detected in TSA standard and on copper sample exposed to 0.01 M TSA solution. ........................................ 208
16
ABSTRACT
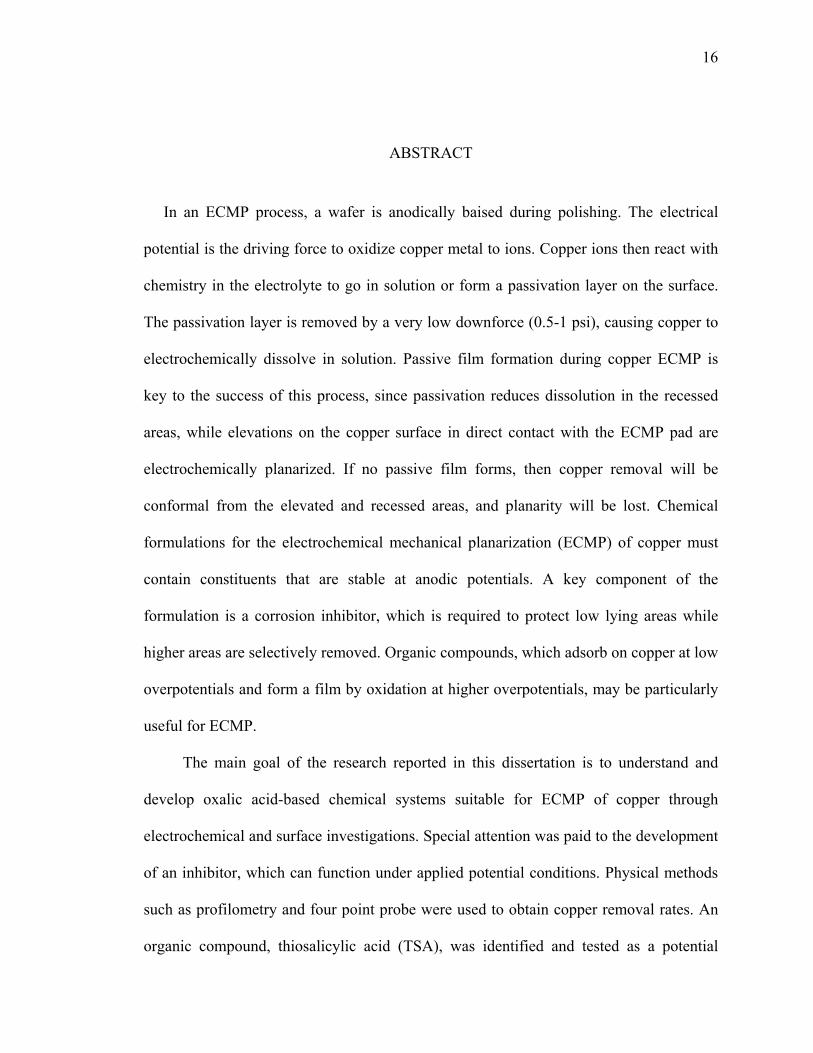
In an ECMP process, a wafer is anodically baised during polishing. The electrical
potential is the driving force to oxidize copper metal to ions. Copper ions then react with
chemistry in the electrolyte to go in solution or form a passivation layer on the surface.
The passivation layer is removed by a very low downforce (0.5-1 psi), causing copper to
electrochemically dissolve in solution. Passive film formation during copper ECMP is
key to the success of this process, since passivation reduces dissolution in the recessed
areas, while elevations on the copper surface in direct contact with the ECMP pad are
electrochemically planarized. If no passive film forms, then copper removal will be
conformal from the elevated and recessed areas, and planarity will be lost. Chemical
formulations for the electrochemical mechanical planarization (ECMP) of copper must
contain constituents that are stable at anodic potentials. A key component of the
formulation is a corrosion inhibitor, which is required to protect low lying areas while
higher areas are selectively removed. Organic compounds, which adsorb on copper at low
overpotentials and form a film by oxidation at higher overpotentials, may be particularly
useful for ECMP.
The main goal of the research reported in this dissertation is to understand and
develop oxalic acid-based chemical systems suitable for ECMP of copper through
electrochemical and surface investigations. Special attention was paid to the development
of an inhibitor, which can function under applied potential conditions. Physical methods
such as profilometry and four point probe were used to obtain copper removal rates. An
organic compound, thiosalicylic acid (TSA), was identified and tested as a potential

17
corrosion inhibitor for copper. TSA offers better protection than the conventionally used
benzotriazole (BTA) by oxidizing at high anodic potentials to form a passive film on the
copper surface. The passive film formed on the copper surface by addition of TSA was
characterized by X-ray photoelectron spectroscopy. The oxidation potential of TSA was
characterized using cyclic voltammetry. The passivation and repassivation kinetics was
investigated in detail and a passivation mechanism of copper in oxalic acid in the
presence of TSA is proposed. Copper removal experiments were performed on a
specially designed electrochemical abrasion cell (EC-AC) in both the presence and
absence of inhibitors. The effect of anodic potentials on the dissolution of copper was
studied to identify suitable conditions for the electro-chemical mechanical planarization
process.
18
CHAPTER 1: INTRODUCTION
1.1. Introduction
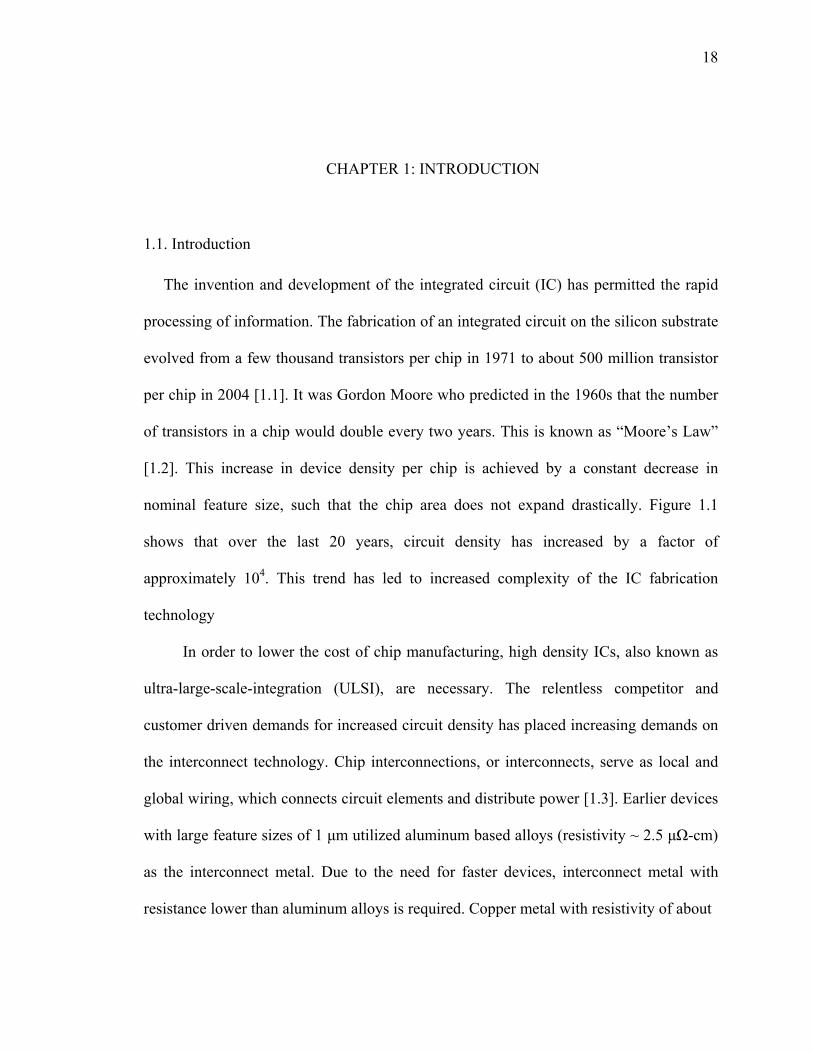
The invention and development of the integrated circuit (IC) has permitted the rapid
processing of information. The fabrication of an integrated circuit on the silicon substrate
evolved from a few thousand transistors per chip in 1971 to about 500 million transistor
per chip in 2004 [1.1]. It was Gordon Moore who predicted in the 1960s that the number
of transistors in a chip would double every two years. This is known as “Moore’s Law”
[1.2]. This increase in device density per chip is achieved by a constant decrease in
nominal feature size, such that the chip area does not expand drastically. Figure 1.1
shows that over the last 20 years, circuit density has increased by a factor of
approximately 104. This trend has led to increased complexity of the IC fabrication
technology
In order to lower the cost of chip manufacturing, high density ICs, also known as
ultra-large-scale-integration (ULSI), are necessary. The relentless competitor and
customer driven demands for increased circuit density has placed increasing demands on
the interconnect technology. Chip interconnections, or interconnects, serve as local and
global wiring, which connects circuit elements and distribute power [1.3]. Earlier devices
with large feature sizes of 1 μm utilized aluminum based alloys (resistivity ~ 2.5 μΩ-cm)
as the interconnect metal. Due to the need for faster devices, interconnect metal with
resistance lower than aluminum alloys is required. Copper metal with resistivity of about

19
Figure 1.1: Trends in logic and memory devices [1.4].

20
1.67 μΩ-cm is the metal of choice for fabrication sub-micron devices. The increase in
device density requires the use of multilevel metallization schemes with metal and
dielectric layers. Silicon dioxide (dielectric constant, k~ 4), is currently the preferred
material for use as the interlayer dielectric between the metal layers. However, novel
low-k materials will soon replace silicon dioxide in order to reduce the resistance-
capacitance (RC) delay.
The 2005 International Technology Roadmap for Semiconductors (ITRS) predicts that
devices with 18 nm (DRAM ½ pitch) technology node for both logic (microprocessor)
and memory chips with copper metallization will be used in the year 2018 (Table 1.1 and
Table 1.2) [1.5]. It also predicts the need for 14 metal layers for the microprocessor and 4
layers for the memory devices for 18 nm technology node.
Table 1.1: Microprocessor interconnect technology requirement predicted in ITRS 2005 [1.5].
21
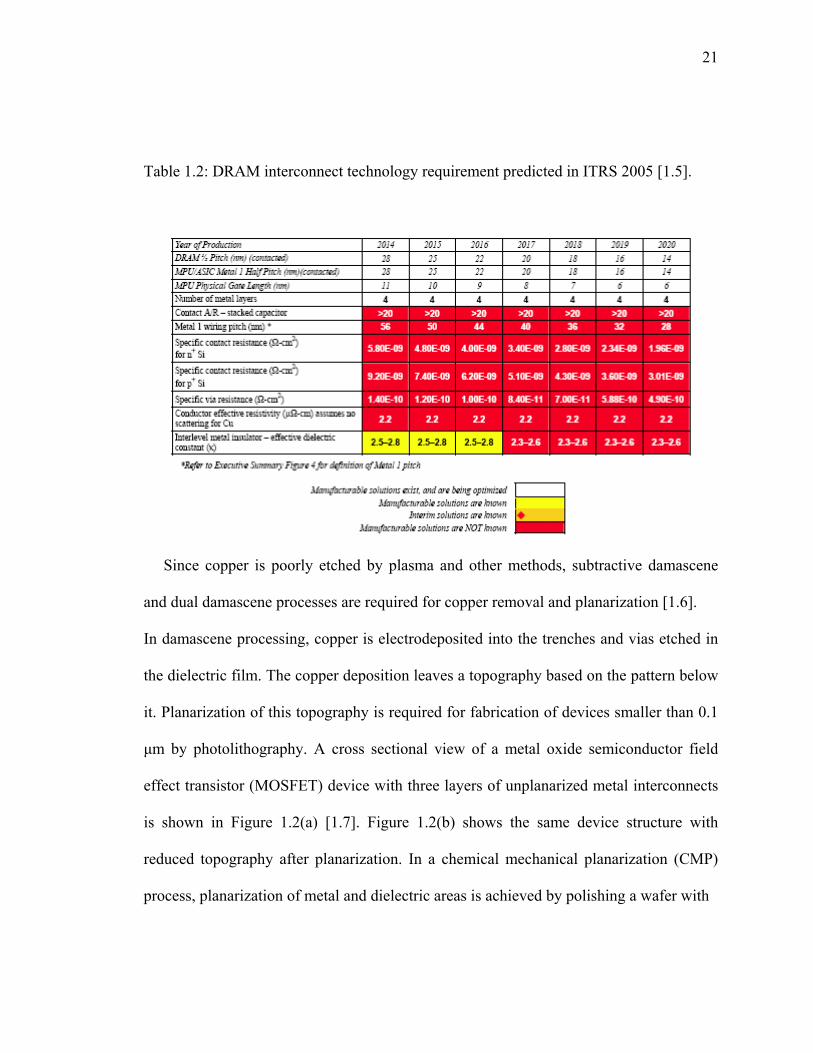
Table 1.2: DRAM interconnect technology requirement predicted in ITRS 2005 [1.5].
Since copper is poorly etched by plasma and other methods, subtractive damascene
and dual damascene processes are required for copper removal and planarization [1.6].
In damascene processing, copper is electrodeposited into the trenches and vias etched in
the dielectric film. The copper deposition leaves a topography based on the pattern below
it. Planarization of this topography is required for fabrication of devices smaller than 0.1
μm by photolithography. A cross sectional view of a metal oxide semiconductor field
effect transistor (MOSFET) device with three layers of unplanarized metal interconnects
is shown in Figure 1.2(a) [1.7]. Figure 1.2(b) shows the same device structure with
reduced topography after planarization. In a chemical mechanical planarization (CMP)
process, planarization of metal and dielectric areas is achieved by polishing a wafer with

22
Figure 1.2: Cross sectional view of MOSFET device with three levels of metal interconnects: a) Surface topography without any planarization, b) planarized surface without topography buildup [1.7].

23
uneven topography on a polymeric pad held by a rotating platen using colloidal slurry
consisting of sub-micron sized abrasive particles. An essential feature of CMP is its
ability to planarize multiple materials in one step with good planarity in the nanometer
size range.
The constant decrease in line width of the copper features has made the integration of
low-k dielectrics into the interconnect scheme a requirement. Substantial problems arise
for copper CMP with the introduction of porous low-k materials. As compared to silicon
dioxide, such materials have significantly lower hardness and Young’s modulus, due to
which they have difficulty withstanding the force applied during CMP. As a result,
delamination, material deformation and crack formation occurs during CMP [1.8-1.10].
Hence, the CMP process is moving towards a low pressure regime (1 psi). To compensate
for the reduction of mechanical forces, the chemical aspects have to be enhanced so that
the process requirements such as removal rate and planarity are not sacrificed. This has
led to introduction of electrochemical mechanical planarization (ECMP). In an ECMP
process, the copper film on the wafer is anodically biased while low pressure is applied
during polishing. During ECMP, the removal rate is controlled by varying the applied
potential. Due to the chemistry-intensive nature of the process, static etching of copper in
recessed areas not abraded by a pad is a major problem. Static etching can be avoided by
use of corrosion inhibitors. Addition of corrosion inhibitor to the ECMP electrolyte
results in formation of passive film on the copper surface. The passive film formed on the
higher areas is removed due to the mechanical action of the pad, causing copper to
dissolve electrochemically. However, in recessed areas, passive film inhibits copper

24
dissolution. Passive film formation during copper ECMP is critical to its success. A
major requirement of the passive film is it must be easily removed with low pressure in
higher areas, but at the same time must also reduce the static dissolution rate to almost
zero in the recessed areas. In addition, the passive film must remain stable at high anodic
potentials used for ECMP. Benzotriazole (BTA) is a commonly used corrosion inhibitor
for copper.
1.2. Research Objectives
The main goal of this research is to develop a chemical system suitable for ECMP of
copper through electrochemical investigations. Specific objectives are as follows:
1. Construct potential-pH diagrams to understand interaction between copper and
various additives.
2. Identify compounds that can inhibit copper corrosion. Special attention has been
paid to identification of inhibitors that can function effectively under anodic
potential conditions used in ECMP.
3. Identify suitable potential conditions by characterizing removal rates of copper
under static and abrasion conditions in oxalic acid chemistries with suitable
inhibitors using a research type CMP apparatus.
4. Compare the effectiveness of the new inhibitor with that of commonly used BTA.
5. Propose a mechanism of inhibition under ECMP conditions.

25
CHAPTER 2: BACKGROUND
2.1. Chemical Mechanical Planarization
Traditionally, chemical mechanical planarization (also referred to as chemical
mechanical polishing or CMP) was used for optical finishing of glass surfaces [2.1, 2.2].
IBM first introduced CMP in the1980s to planarize metal and interlevel dielectrics (ILD)
for fabrication of very large-scale integrated circuits (VLSI) [2.3]. In principle, CMP is a
process of smoothing and planning a surface through the combination of chemical
reactions and mechanical forces. CMP is the preferred planarization step in deep sub-
micron IC manufacturing to remove topography from silicon dioxide, metal, and
polysilicon surfaces. CMP is most widely used in the back end of line integrated circuit
(IC) manufacturing. The back end line process steps involve a thin multilayer deposition
of metal and dielectric materials to form interconnections between active components of
a circuit (e.g. transistors) and the outside world. The goal of the CMP process is to
planarize step heights caused by deposition of thin films over existing non-planar features
(i.e., vias and trenches) so that the photolithographic depth of focus is maintained and
further levels can be added onto a flat surface [2.4].
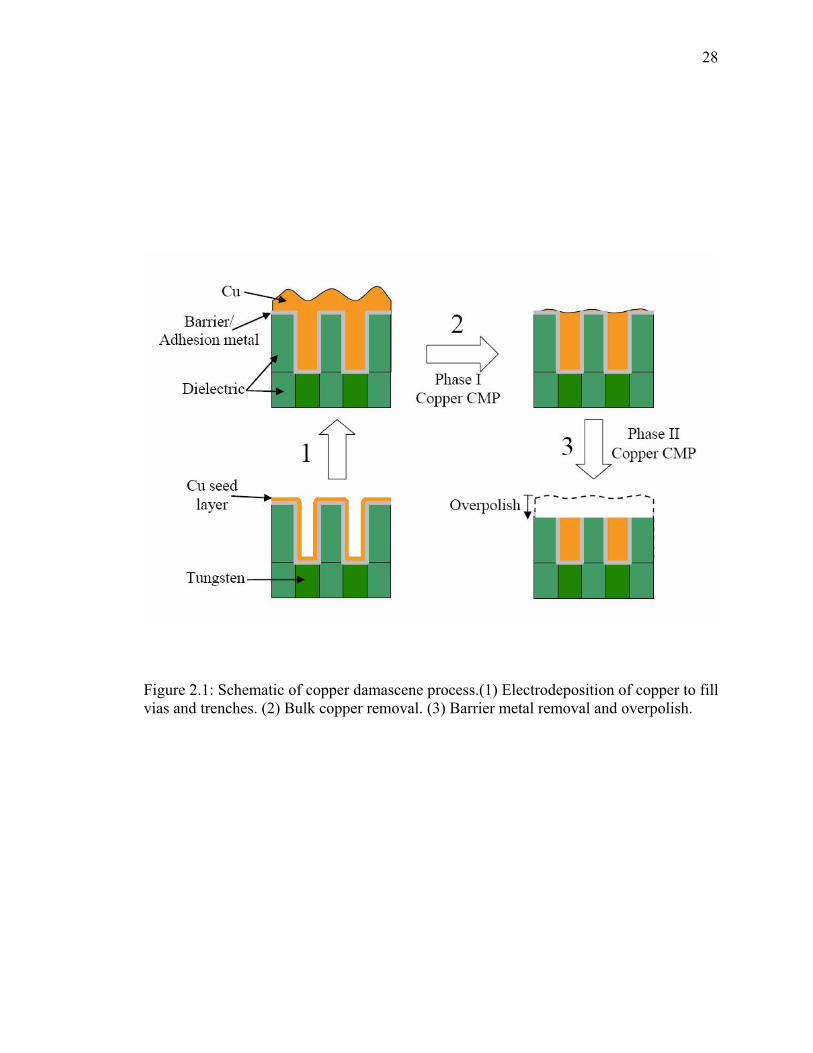
CMP is currently the most cost-effective technique for removing excess
electrodeposited copper and reducing topography by planarizing copper. As shown in
Figure 2.1, the first step is deposition of a copper seed layer by physical vapor deposition
(PVD) into vias and trenches followed by electroplating. The filling and over filling of
the vias and trenches leave a severe topography on the metal surface. Copper CMP is

26
typically performed in two phases. The first phase is bulk copper removal as shown in
Figure 2.1, Step 2. This is usually achieved by a slurry chemistry that has a high copper
dissolution rate of 300 to 500 nm/min. At the end of phase I, a very thin flat layer of
copper remains, without exposing the barrier and dielectric layers. Phase II involves
removal of remaining copper and the barrier metal (e.g. TaN). The chemistry used in
phase II polishing usually focuses on the removal of barrier metal. The overall removal
rate in this phase is typically around 50 nm/min. The selectivity between copper and the
barrier metal is ideally one-to-one, but is often two-to-one. At the end of phase II, the
dielectric materials are overpolished. This is done to ensure that no copper or barrier
metals are left on the dielectric surface that may cause a short circuit between conducting
copper lines.
The surface topography following CMP processing is evaluated on two scales: local
and global planarity. Figure 2.2 shows the topography developed when a metal is
deposited on a surface that has a dielectric feature of step height D1. The height of the
metal over dielectric is M1 and that in the trench is M2. The step height between the two
areas is designated is D2. The planarization angle θ is described as
⎟⎠⎞
⎜⎝⎛= −
RD21tanθ (2.1)
where R is planarization length or step coverage distance and is defined as taper distance
from the edge of the step to the next level of topography [2.5, 2.6]. Local planarization is
defined as the process in which the step coverage distance is in the range of < 100 μm.
Similarly, the process in which the planarization length is in the range of millimeters is

27
termed global planarization. In areas of high pattern density, R will decrease in relation to
D2, thereby increasing θ. In areas of low pattern density, θ will be low. The step height
reduction (SHR) is defined as
)()(1
2
2
ionplanarizatpreDionplanarizatpostDSHR
−−
−= (2.2)
Planarity can be achieved only if the reduction of M1 is greater than M2. The degrees
of planarity are tabulated in Table 2.1. Due to its ability to achieve global planarity
(θ < 0.5o), the CMP process is considered as the best planarization technique. In copper
CMP, the goal is not only to achieve planarity but also to reduce D2 to zero and remove
M1 completely. The biggest challenge in the CMP process is to achieve optimal step
height reduction without introducing additional defects. Typical defects commonly
observed after CMP are dishing and erosion. Dishing is generally seen in the areas of low
pattern density, while erosion is seen in the areas of high pattern density.
28
Figure 2.1: Schematic of copper damascene process.(1) Electrodeposition of copper to fill vias and trenches. (2) Bulk copper removal. (3) Barrier metal removal and overpolish.

29
Figure 2.2: Measurement of planarity [2.5]
Table 2.1: Degree of planarity [2.5].
Planarity R (μm) θ
Surface smoothing 0.1-2.0 > 30o
Local planarization 2-100 30o-0.5o
Global planarization > 1000 < 0.5o

30
2.1.1. CMP Tools
The first generation of CMP polishers used a single robot system to move the wafer
and hold it on the carrier. The polisher comprised of two platens, one covered with a hard
pad for bulk material removal, the other with a soft pad for buffing. The major issues
with these polishers were platen wobble and low throughput. In the traditional polisher,
both the platen and the wafer moved in rotary motion, hence the name rotary tool. A
schematic of various CMP tools is shown in Figure 2.3. The magnitude of offset between
the axis of rotation of carrier and the platen determines the relative velocity between the
pad and the wafer [2.7]. The relative velocity is a very important factor, which influences
the removal rate of the material. In an orbital polisher, the platen moves in an orbital
fashion while the carrier is rotated [2.8].
Today’s CMP tool is one of the most complex pieces of equipment on the fab floor
with various mechanical and electrical control systems. The major parts of the tool are
the platen and the wafer carrier. The platen is a large circular disc on which the pad is
mounted. Depending on the complexity and generation of the tool, the number of platens
can vary from one to three. The tools that are generally used for copper CMP have three
platens, each designed to perform specific task. The bulk copper removal takes place on
the first platen, followed by removal of remaining copper on the second platen and
stopping at the barrier metal. The wafer is then transferred to the third platen where the
barrier film is removed and the polishing is stopped at the interlayer dielectric (ILD). The
wafer carrier transfers the wafers from one platen/pad combination to another and presses

31
the wafer against the pad at a specific operating pressure (~8-9 psi). The use of multiple
platens allows the use of different slurries and pads as per the process requirement.

32
Figure 2.3: Schematic of various CMP tools: (a) rotary, and (b) orbital [2.7 -2.9].

33
2.1.2. CMP Consumables – Pads
The polishing pad has a dominating effect on CMP process performance. The
polishing pad is made up of a matrix of cast polyurethane foam along with filler material
to control the hardness and other mechanical properties of the pad. Polyurethanes have
the unique property of combining high strength, hardness, and modulus combined with
high elongation at failure. The pad plays a crucial role in process optimization as it
distributes the slurry under the wafer, executes the polishing action, and transmits the
normal and shear forces for polishing. A pad is typically characterized by its hardness,
density, and compressibility [2.10, 2.11]. The most important factor taken into
consideration while selecting a pad is its hardness. If the pad is very soft, it will conform
to the shape of the pattern and hence global planarity will not be achieved. Alternatively,
if the pad is very hard, it will lead to defects such as scratching. A stacked pad consisting
of an IC 1000 top layer and a Suba IV soft pad is currently the pad system of choice with
IC 1000 making contact with the wafer surface.
It has been reported [2.12] that different pad surface textures show different
material removal mechanisms. Thus, an important factor that should be considered during
pad selection is the shape of the grooves and the asperities. The main function of these
asperities and grooves is to carry and transfer the slurry to the wafer surface. While
perforated, XY and K-grooved pads are most commonly used, many groove designs are
commercially available. Some of the more novel designs enhance slurry distribution,
reducing the amount of slurry used without much wastage. During the polishing process,
the abrasive particles in the slurry can be caught between the asperities of the pad. The

34
resulting smoothing of the pad surface causes the wafer to hydroplane, reducing material
removal rate. This problem is eliminated by pad conditioning. The pad is continuously
conditioned by a wire brush or a disc with embedded diamond particles, which remove
the slurry particles from blocked asperities, and roughen the pad surface. Some of the
major types of pads with their key features, properties, and typical application are
summarized in Table 2.2 [2.13].
A fixed abrasive pad (FAP) is a new generation of pads that has emerged as a
potential replacement for slurry based pads. In a fixed abrasive pad, the abrasive particles
are embedded in the pad matrix. The abrasive particles are bonded to the polycarbonate
layer of the pad. The surface of these pads has evenly distributed micro replicated
structures in which abrasive particles are embedded. As with the groove designs, different
types of FAP designs are available with the most common being pyramid and pole
designs. It has been reported that the polishing of shallow trench isolation (STI)
structures with fixed abrasive pads leads to high removal rates with superior uniformity
and planarity, and without dishing [2.14].

35
Table 2.2: List of major types of pads and their properties [2.13].

36
2.1.3. CMP Consumables – Slurries
The slurry is one of the most important consumables in CMP process as it plays two
key roles of providing chemical and mechanical effects during polishing. The CMP
process is influenced to a great extent by numerous slurry parameters such as pH,
solution chemistry, charge type, concentration and size of abrasives, complexing agents,
oxidizers, buffering agents, surfactants, corrosion inhibitors, etc. Some important
functions of slurry are: (1) to act as a lubricant by reducing the frictional forces between
the pad and the wafer, (2) to dissipate the heat generated due to friction and (3) to
transport the reactants to the wafer surface and byproducts away from the surface. A
typical CMP slurry consists of an oxidant, abrasive particles, and proprietary additives.
The abrasive particles transfer the mechanical load from the pad to the wafer surface.
Alumina (Al2O3) and silica (SiO2) particles are the commonly used abrasives [2.15, 2.16].
Some of the new abrasives under investigation [2.17-2.20] are zirconium oxide (ZrO2)
and cerium oxide (CeO2). The size of these abrasives and the concentration range varies
from 80 – 200 nm and from 0.5% -10%, respectively. Oxide CMP slurries use high
concentration of abrasives (10%) as the removal rate is mostly due to mechanical
abrasion. This is not true for metal CMP since the removal rate is controlled by oxidizer
and complexing agent concentrations. Thus, metal CMP slurries use a low concentration
of abrasive particles (3%). For slurry to be viable for CMP application, the abrasive
particles must remain stable (suspended) over a long period without agglomeration. The
stability of abrasive particles in the slurry is determined by its pH. Normally dispersants
such as polyacrylic acid are added to maintain good dispersion of solids. The current

37
trend in the industry is to move towards abrasive free slurries for CMP [2.21-2.23]. This
in turn reduces the number of defects caused by the abrasives and makes it easier to
dispose off the CMP waste.
The material to be polished determines the nature and amount of chemical
components in the slurry. For example, slurries used for oxide CMP are generally
alkaline in nature (pH 9 -11). The pH is adjusted by the addition of potassium hydroxide
(KOH), ammonium hydroxide (NH4OH), etc [2.24]. The slurries used for metal CMP are
acidic in nature. For example, the pH of copper CMP slurry varies from 3 to 6 while that
of tungsten CMP varies from 2 to 4. Metal CMP slurries comprises of oxidizers,
complexing agents, corrosion inhibitors and pH buffers. Commonly used oxidizers are
hydrogen peroxide (H2O2), hydroxylamine (NH2OH), potassium ferricyanide
(K3Fe(CN)6), potassium iodate (KIO3) and ferric nitrate (Fe(NO3)3). The complexing
agents are added to ensure the solubility of the metal in solution. In many slurries the
oxidizer can also act as a complexing agent for the metal. The best example is the use of
hydroxylamine based slurries for copper CMP. The combination of oxidizer and
complexing agent makes the slurry a very strong etchant. As the metal film coming in for
CMP has surface topography, planarity can only be obtained if the low lying areas are
protected while the higher areas are being polished. This is achieved by the addition of
corrosion inhibitors, which form a passive film over the metal surface, and stop static
dissolution of the metal film. A common such corrosion inhibitor for copper is
benzotriazole (BTA).

38
2.1.4. CMP Mechanisms
2.1.4.1. Oxide CMP
Even though oxide CMP has been developed based on glass polishing for optical
lenses, the mechanisms required to explain oxide CMP are complex. The first
contributing process is heating of the wafer by friction. As SiO2 abrasives are used for
oxide CMP, the rubbing action of these abrasives on the SiO2 layer creates localized
heating due to the poor thermal conductivity of amorphous SiO2. Since water in the slurry
is the coolant, the abrasives are cooled more effectively than the oxide layer. The increase
in temperature of silica decreases its hardness, which leads to plastic deformation of the
oxide layer [2.25]. The second contributing process is hydration of the oxide during this
plastic deformation. Water readily enters the oxide during plastic deformation and reacts
with the silica network in the following manner
H2O + Si-O-Si → Si-OH + HO-Si
]][[][
2
2
SiOSiOHOHSiKeq −−
−=
The reaction between water and the silica network is such that almost all the water related
species exist in the form of hydroxyl [2.26-2.29]. Water incorporation decreases oxide
hardness due to increased plasticity and decreases mechanical strength [2.29]. Thus
plastic deformation of oxide assisted by frictional heating and oxide hydration results in a
softer hydrated surface layer. This softer layer is removed by the plowing action of the
abrasive particles.

39
It has been reported that the use of CeO2 based slurries for oxide CMP results in
higher removal rates. Cook proposed that at alkaline pH, the first step is formation of
≡ Si-O- species due to surface hydration of the oxide. This is followed by the reaction of
≡ Si-O- with Ce-OH sites to form a ≡ Si-O-Ce ≡ linkage. The OH- ions in the slurry
attack this linkage which results in removal of Si from the surface as a Si(OH)4 species,
with all the four tetrahedron bonds broken [2.30].
The mechanism for metal CMP is very complex and depends on the nature of the
metal. In general, metal CMP involves corrosion, complexation, and passivation of metal
when exposed to aqueous solution. Depending on the pH of the solution and additives,
the stability of metal, metallic ions, metal complex changes, resulting in its removal.
2.1.4.2. Tungsten CMP
Kaufman et al [2.31] proposed one of the earlier mechanisms for tungsten CMP. They
proposed that global planarization of tungsten can be easily achieved in slurries that help
the formation of a WO3 passive film The slurry investigated was potassium ferricyanide
[K3Fe(CN)6] based. The passivation of tungsten is a result of the following oxidation
reaction:
W + 6Fe(CN)63- + 3H2O → WO3 + 6Fe(CN)6
4- + 6H+
This passive film is dense, non-porous, and softer than tungsten, which prevents diffusion
of corrosive components and makes the removal of tungsten easier. Thus, polishing of

40
tungsten occurs in 3 steps: (1) formation of WO3 passive film on the surface, (2) removal
of this film in high areas as a result of abrasion due to pad contact and (3) repassivation
of the abraded area. This is schematically shown in Figure 2.4. The low-lying areas are
always protected due to the presence of passive film since there is no pad contact.
However, this mechanism is limited to acidic pH values. Figure 2.5 shows a potential-pH
diagram for the W-H2O system drawn for a dissolved tungsten concentration of 10-4 M.
Tungsten forms an oxide (WO3) only if the pH of slurry is less than 2. Above pH 2, the
dissolved species of tungsten (W12O396-, W12O41
10-, WO42-) are stable. Thus, a slurry pH
of greater than 2 would actively dissolve tungsten in the following manner.
W + 6Fe(CN)63- + 4H2O → WO4
2- + 6Fe(CN)64- + 8H+
It is important to note that the thickness of the WO3 film was determined to be only 1-1.5
nm, while the removal rate observed was in the neighborhood of 110 – 150 nm/min. The
proposed passivation – abrasion – repassivation mechanism does not hold true in the
presence of these observations. Hence, the passivation mechanism is not the only one
responsible for tungsten removal.
Kneer et al. [2.32] characterized the passivation behavior of tungsten in various
chemistries by measuring corrosion potential (Ecorr) as a function of time. They found that
during abrasion, Ecorr shifted to more negative values, signifying removal of the oxide
layer and exposure of the tungsten metal. When abrasion was stopped, Ecorr shifted to
more positive values, showing signs of repassivation. A careful observation of polished
tungsten film by atomic force microscopy (AFM) indicated that corrosion assisted
fracture may be an important removal mechanism for tungsten during CMP.

41
Figure 2.4: Mechanism of tungsten CMP proposed by Kaufman et al. [2.31].

42
Figure 2.5: Pourbaix diagram for W-H2O system
0 2 4 6 8 10 12 14-2.0
-1.5
-1.0
-0.5
0.0
0.5
1.0
1.5
2.0
W12O396-
W12O4110- WO4
2-WO3
WO2
W
E (v
olts
)
pH
W = 0.0001 M
43
2.1.5. Copper CMP The demand for fast signal propagation in integrated circuits has led to the
introduction of copper as the metal of choice for interconnect applications. The bulk
resistivity of copper is 1.7 μΩ-cm and it has a higher resistance to electromigration than
aluminum [2.33, 2.34]. In today’s integrated circuits, except for the first level of
metallization, where copper contamination of silicon devices is a problem, copper
interconnects for long transmission lines is a standard in multilevel interconnects. The
steps involved in the fabrication of copper damascene structures were discussed in
Section 2.1.
Planarization of copper damascene structures is very challenging because copper is
both electrochemically noble and chemically active. Figure 2.6 shows a potential-pH
diagram for the Cu-H2O system constructed for different dissolved copper concentrations.
At acidic pH values (pH < 4), copper metal is unstable and easily dissolves as Cu2+ ions
in solution. Similarly at alkaline pH conditions (pH > 13), copper dissolves in the form of
HCuO2- and CuO2
2- species. The amount of dissolved copper can change the stability of
various copper species. As the dissolved copper concentration increases, the Cu2+/CuO
stability line shifts towards left from pH 7 to 4, and the stability region of CuO expands
into alkaline pH values.
2.1.5.1. Nitric Acid Based Chemistries
Initial research by Steigerwald et al. [2.35-2.38] investigated copper CMP in nitric
acid based slurries containing alumina particles. Figure 2.7 shows the removal rate of

44
copper as a function of nitric acid concentration. The removal rate of copper without
nitric acid was ~ 1.2 μm/min. No significant increase in removal rate was observed above
the nitric acid concentration of 2 wt%. The etch rate of copper was also found to increase
with HNO3 concentration. It was concluded that the dominant removal mechanism in
nitric acid-based slurries was mechanical abrasion of the surface followed by chemical
dissolution of the abraded surface.
D. C. polarization and A.C. impedance spectroscopy techniques were used by Carpio
et al. [2.36] to investigate copper removal in variations of KMnO4 and HNO3 chemistries
containing silica and alumina abrasives. This study found that the calculated corrosion
potential (Ecorr) and corrosion current density (icorr) values did not shift significantly with
abrasion for HNO3 based slurries, signifying that nitric acid is a strong copper etchant.
The calculated values of Ecorr and icorr for both the oxidants are listed in Table 2.3.
Potentiodynamic curves obtained with and without abrasion in an unbuffered 3% solution
of KMnO4 showed a decrease in Ecorr and increase in icorr due to removal of the
passivation layer during abrasion. However, low polish rates of 50 nm/min were seen in
both acidic and basic conditions. Hence, KMnO4 was declared to have limited application
in copper CMP slurries.
Table 2.3: Calculated values of Ecorr and icorr for different oxidizers.
Solution Abrasion
Ecorr (V)
Abrasion
Icorr (mA/cm2)
No abrasion
Ecorr (V)
No abrasion
Icorr (mA/cm2)
HNO3 (1 wt%) -0.0563 1.254 0.0556 1.408
HNO3 (5 wt%) -0.022 11.15 -0.0467 6.101
KMnO4 (3 wt%) -0.485 1.238 -0.274 0.1182

45
Figure 2.6: Pourbaix diagram for Cu-H2O system. [Activities of dissolved copper species = 0.1 M, 10-3 M and 10-6 M]
Figure 2.7: Polish rate and etch rate of copper in nitric acid slurries [2.39].
3
0 1 2 3 4 5 6 7 8 9 10 11 12 13 14-1.00
-0.75
-0.50
-0.25
0.00
0.25
0.50
0.75
1.00
1.25
1.50
[Cu] = 0.1 [Cu] = 10− 3
[Cu] = 10− 6
HCuO2−
CuO22−
Cu2O
CuO
Cu
Cu2+
Pote
ntia
l (V)
vs
SHE
pH

46
2.1.5.2. Ammonia Based Chemistries
Luo et al. [2.39-2.41] investigated copper polishing in alkaline CMP slurries
containing NH4OH (pH =11). Figure 2.8 shows the removal rate of copper as a function
of ammonia concentration. The removal rate of copper increased to 210 nm/min as the
NH4OH concentration was increased to 0.3% by weight. The removal rate leveled off
with a further increase in NH4OH concentration. The potential-pH diagram for the Cu-
NH3-H2O system is shown in Figure 2.9. The diagram was constructed for a dissolved
copper concentration of 10-6 M and ammonia concentration of 0.1 M. The diagram
showed that in acidic pH conditions (pH < 4), copper is stable as dissolved Cu2+ species.
At near neutral and alkaline conditions, pH > 4, copper is stable in the form of copper-
amine complexes, Cu(NH3)x2+ (where x = 1 to 5). In more reducing conditions,
Cu(NH3)2+ may exist as well. Alkaline copper CMP slurries are generally not
recommended due to lack of selectivity between the copper and interlayer dielectric
(ILD) such as SiO2. This is because copper passivates while SiO2 is attacked at high pH
values.
The effect of adding an extra oxidizer, NaClO3, on the copper removal rate in NH4OH
solution (6 wt%) was also investigated. It was found that the addition of an oxidizer
increased copper removal rate significantly from 250 nm/min, in the absence of oxidizer,
to 450 nm/min at 0.1 M NaClO3. Polishing of copper was also carried out in ammonium
salts such as NH4NO3 and (NH4)2SO4. The removal rates obtained were similar to those
obtained with NH4OH based slurries. This is more advantageous because the loss of SiO2
will be minimized in ammonium salts.

47
Figure 2.8: Effect of NH4OH concentration on copper removal rate [2.41].

48
Figure 2.9: Pourbaix diagram for Cu-NH3-H2O system
0 1 2 3 4 5 6 7 8 9 10 11 12 13 14-2.0
-1.5
-1.0
-0.5
0.0
0.5
1.0
1.5
2.0
Cu(
OH
) 42-
Cu(NH3)52+
Cu(
NH
3) 42+
Cu(
NH
3) 32+
Cu(
NH
3) 22+C
u(N
H3)2+
Cu(NH3)2+Cu(NH3)
+
Cu2+
E vs
. SH
E (V
)
pH
Cu = 10-6 M, N = 1 M
Cu
Cu(OH)3-

49
2.1.5.3. Hydrogen Peroxide Based Chemistries
Hydrogen peroxide (H2O2) is the most commonly used oxidizing agent in copper
CMP slurries. Hydrogen peroxide is a weak acid, which decomposes in water even at
room temperature. It acts as an oxidizing agent by accepting one or two electrons in
acidic conditions as shown in following equations [2.42].
OH2e2H2OH 222 →++ −+
OHOHeHOH 222 +•→++ −+
The hydroxyl radicals (·OH) formed in the second reaction have a higher oxidizing power
than the hydrogen peroxide itself.
Du et al. [2.43] investigated CMP removal rates and static etch rates of copper in H2O2
solutions at pH 4. They found that the copper removal rate increased with H2O2
concentration and reached a maximum of 180 nm/min in 1% H2O2. With further increase
in H2O2 concentration, the removal rate decreased and then leveled off beyond 5% H2O2.
The static removal rate was an order of magnitude lower than the polishing removal rate
but followed a similar trend. The decrease in copper removal rate with increasing H2O2
concentrations was attributed to the passivation of the copper surface. This is also evident
from the potential-pH diagram for the Cu-H2O system shown in Figure 2.6. It was
concluded that at low peroxide concentrations, copper removal was controlled by
electrochemical dissolution, while at high peroxide levels, the removal rate was
controlled by mechanical removal of copper oxide and its subsequent dissolution.
Normally peroxide based slurries contain some complexing agents to increase the
removal rates. Hirabayashi et al. [2.44] investigated slurries containing hydrogen

50
peroxide and glycine for copper CMP. Static etch rates and CMP removal rates were
characterized as a function of H2O2 concentration. Both the static etch rate and the CMP
removal rate decreased with an increase in H2O2 concentration at a constant glycine
concentration of 0.1 wt%, Beyond 5 wt% H2O2, the static rate was not measurable but the
polishing rate remained at 10 to 40 nm/min. This behavior was attributed to the oxidation
of copper at higher H2O2 concentrations.
2.1.5.4. Hydroxylamine Based Chemistries
Hydroxylamine (NH2OH) has been actively tested as a replacement for hydrogen
peroxide in copper CMP slurries [2.45-2.49]. Hydroxylamine tends to function as an
oxidizing agent at acidic pH values and as a reducing agent at alkaline pH values [2.50].
Hydroxylamine is a weak back characterized by a pKb of 8.2. The dissociation reactions
for hydroxylamine are as follows:
NH3OH+ ↔ NH2OH + H+ K1 = 1.58 x 10⁻⁶
NH2OH ↔ NH2O- + H+ K2 = 1.99 x 10⁻¹⁴
A potential-pH diagram for copper-hydroxylamine-water system superimposed
on the diagram for hydroxylamine-water system is shown in Figure 2.10. The species
considered in constructing the hydroxylamine-water diagram were NH2OH, NH3OH+,
NO3−, HNO3, NO2
−, and HNO2. Since the thermodynamic stability of the ammonia
species is higher than the hydroxylamine species, if the ammonia species NH3 and NH4+,
were considered in the construction of diagram, they would replace the stability fields of
NH2OH and NH3OH+. The diagram was generated for a dissolved copper concentration

51
of 10-4 M and hydroxylamine concentration of 0.5 M. It may be noted that the
hydroxylammonium cation (NH3OH+) is stable in acidic conditions and can be oxidized
to nitrite/nitrous acid (NO2−/HNO2). Further increase in potential can oxidize the
NO2−/HNO2 species to nitrate species (NO3
-). Based on the reduction potential of the
HNO2/NH3OH+ couple, NH3OH+ is not likely to oxidize copper to cupric ion under
acidic conditions. Both nitrous acid and nitrite can oxidize copper in a wide range of pH
values. The E-pH relations for the reduction of NH3OH+ to NH4+ and NH2OH to NH3 are
plotted as dotted lines in the diagram, since ammonia species were excluded from the
calculations. Copper forms 1:1 and 1:2 complexes ([Cu(NH2OH)]2+ and
[Cu(NH2OH)2]2+ ) with hydroxylamine, which are stable in the pH range of 4-7.
Tamilmani et al. [2.51] carried out static dissolution and abrasion experiments on
copper samples exposed to 0.5 M hydroxylamine solution at a different pH. Figure 2.11
shows removal rates as a function of solution pH. It was found that the highest
dissolution of copper occurred around pH 6 (85 nm/min), with the rate decreasing very
rapidly at pH values above 7 and below 5. Abrasion experiments carried out at a
downforce of 4 psi with 4% silica slurry showed that the removal rate followed a similar
trend with a maximum removal at pH 6 (~ 130 nm/min). The addition of corrosion
inhibitors such as benzotriazole (BTA) and salicylhydroxamic acid (SHA) resulted in a
static etch rate of less than 0.1 nm/min and polish rates of 17 and 40 nm/min. The
dissolution of copper was envisioned to take place in three steps: (1) formation of nitrite
from hydroxylamine through disproportionation aided by the catalytic effect of cupric
ions, if available, (2) oxidation of copper by nitrite and (3) complexation of copper ions.

52
Carter and Small [2.52] proposed a free radical based dissolution mechanism of
copper in hydroxylamine. Using electron spin resonance (ESR) technique, they found
that when sulfuric acid was used for pH adjustments (HSO3)2NO• free radicals were
generated. It was proposed that the free radical causes oxidation of copper by catalytic
mechanism. The oxidant would become available (replenished) in controlled amounts as
it is being consumed during the metal removal step.
Huang [2.53] performed a series of electrochemical measurements and capillary
electrophoresis analysis on copper hydroxylamine system. From the electrochemical
polarization of copper at pH 6, it was found that the oxidation reaction is dependent on
hydroxylamine concentration while the reduction reaction is not. The oxidation reaction
is due to oxidation of copper followed by hydroxylamine complexation. A reduction peak
of NO to NO- was observed at -0.5 V from voltammetry studies. The presence of NO in
hydroxylamine solution is due to the auto-oxidation/reduction reactions of
hydroxylamine. Huang proposed that the reduction of nitric oxide (NO) to hyponitrous
(H2N2O2) via nitroxyl (HNO or NO-) intermediate at pH 6 was responsible for the
oxidation of copper. It was determined using capillary electrophoresis analysis that the
reduction of NH2OH to NH4+ did not occur to any significant extent.
Copper dissolution experiments conducted in hydroxylamine solution at pH 6 revealed
the dissolution reaction was first order with respect to hydroxylamine concentration with
rate constant k estimated to be 109.6 nm min-1mol-1 [2.53]. Using a rotating disc
electrode, Osseo-Asare and Al-Hinai found a similar relationship at pH 6 [2.54].

53
Figure 2.10: Pourbaix diagram for Cu-hydroxylamine-H2O system overlaid on hydroxylamine-H2O system.
Figure 2.11: Removal rate of copper in 0.5 M hydroxylamine solution as a function of pH.
0 2 4 6 8 10 12 14-2.0
-1.5
-1.0
-0.5
0.0
0.5
1.0
1.5
2.0
NH2OH => NH
3
NH3OH+ => NH
4+
Cu(
NH
2OH
) 22+
Cu(
NH
2OH
)2+
Cu2O
CuOCu2+
Cu
NO3-
NO2-
HNO2
NH3OH+ NH2OH
Pote
ntia
l, (V
vs
SHE)
pH
Cu = 10-4 M, N = 0.5 M N = 0.5 M
0
250
500
750
1000
1250
1500
0 1 2 3 4 5 6 7 8 9 10pH
Rem
oval
rate
, (?
/min
)
Static - ECStatic - AAPolishing - AA
Rem
oval
rate
, (Å
/min
)
0
250
500
750
1000
1250
1500
0 1 2 3 4 5 6 7 8 9 10pH
Rem
oval
rate
, (?
/min
)
Static - ECStatic - AAPolishing - AA
Rem
oval
rate
, (Å
/min
)
54
2.1.5.5. Iodate Based Chemistries
Iodate based slurries have been tested as a replacement to peroxide based slurries for
copper CMP. It has been proposed by Luo et al. [2.55] that, at KIO3 concentration above
2 wt%, a protective film of Cu(IO3)2 is formed on the surface of copper, which makes
iodate based slurries promising for copper CMP. Lee et al. [2.56] investigated iodate and
iodine based slurry chemistries with a goal of forming a copper compound passive layer
instead of an oxide layer on the surface in order to obtain high removal rates without any
surface damage. They used potassium iodate (KIO3) and iodine (I2) solution as a copper
oxidizer, benzotriazole (BTA) as an inhibitor, and potassium iodide (KI) as an additive to
supply iodide ions. Potentiodynamic measurements showed a passive region of copper in
0.1 M KIO3 slurry between pH 6 and 8. This passivation was due to formation of oxide
layer on the surface, as revealed by EDS. Abrasion of copper in 0.1 M KIO3 slurry at pH
4, showed localized corrosion areas on the surface with lower removal rate of 21 nm/min
and a static dissolution rate of 3 nm/min. Addition of 10-2 M KI to 0.1 M KIO3 also
resulted in lower removal rates. The reason behind lower rates was attributed to
incomplete formation of CuI layer on the surface. To enable faster formation of CuI layer,
iodine (I2) based solution were used because I2 is oxidizer to copper and forms CuI layer.
The reduction reactions of iodate and iodine are as follows.
IO3- + 6H+ + 6e- ↔ I- + 3H2O
I2 + 2e- ↔ 2I-
It was found that addition of 0.01 N I2 was very effective in forming the CuI passive layer
at pH 4 in KIO3 slurries and resulted in high removal rate of 170 nm/min with a static rate

55
of less than 0.1 nm/min. The removal rates obtained in various chemistries are listed in
Table 2.4.
The effect of pH on the removal rate of copper in iodate based slurries was
investigated by Du et al. [2.57]. Polishing of high purity copper discs was carried out in
0.1 M KIO3 based slurries containing alumina particles. The pH was varied from 2 to 10.
A low removal rate of 50 nm/min was observed at pH 2. This was attributed to fast
interaction between copper and KIO3 leading to precipitation of CuI on the pad as shown
by XPS analysis. The precipitation of CuI made the pad glossy, resulting in low removal
rates. The maximum removal rate of 120 nm/min occurred at pH 4, with removal rate
decreasing with increasing slurry pH.
Hegde et al. [2.58] investigated the feasibility of using molybdenum oxide abrasives
(MoO2) with potassium iodate (KIO3) as the oxidizing agent for copper CMP. Figure
2.12 shows copper disk removal rates as a function of weight percent KIO3 in MoO2
slurry at pH 4. The copper disk removal rate increased from 90 nm/min in the absence of
KIO3 to 750 nm/min at 3 wt% KIO3. It was also observed that the copper disk removal
rate with KIO3 solution was only 30 nm/min while that with the solution of MoO2-KIO3
slurry was ~268 nm/min. This increase in copper disk removal rate indicated the presence
of additional reactive species in the MoO2-KIO3 slurry apart from KIO3.
Colorimetric tests performed with a starch solution showed that KIO3 continuously
oxidizes MoO2 to MoO3, which exists as MoO42-, a soluble Mo (VI) species under acidic
conditions, while KIO3 itself is reduced to I2. The pertinent reactions are as follows:

56
Table 2.4: Dissolution and removal rates of copper in various slurry chemistries investigated by Lee et al. [2.56].
Slurry Chemistry pH Dissolution rate
(nm/min)
Removal rate
(nm/min)
4 3 21
6 0.2 6
0.1 M KIO3
8 0.1 8.5
6.5 0 7.5
0.1 M KIO3 and 10-2 M KI 8 0 8.5
4 0 170
6 0 19
0.1 M KIO3 and 10-3 M BTA
8 0 4
4 0.1
6 0
10% H2O2
8 0

57
Figure 2.12: Removal rates of copper disk with slurry containing 3% MoO2 and varying concentration of KIO3 at pH 4 [2.58].

58
MoO2 + 2H2O → MoO42- + 4H+ + 2e-
2IO3- + 12H+ + 10e- → I2 + 6H2O
Combining the above reaction gives,
5MoO2 + 4H2O + 2IO3- → 5MoO4
2- + 8H+ + I2
It was also observed that the copper disk removal rates with a MoO2-KIO3 slurry aged for
a day were far lower (~30 nm/min) than those with the fresh slurry (~750 nm/min). It was
confirmed by colorimetric tests that this was due to evaporation of most of the I2
generated in the aged slurry. They concluded that the in situ generation of I2 in MoO2-
KIO3 slurries is responsible for the higher copper removal rates, with MoO2 acting both
as a chemical reactant and as an abrasive.
The dissolution rate of copper blanket film in MoO2-KIO3 slurry along with several
additives at pH 4 was also investigated. Table 2.5 lists the removal rate and dissolution
rates in this slurry containing several additives such as BTA and polyacrylic acid (PAA).
Furthermore, both tantalum and thermal oxide blanket film removal rates with this slurry
were only 2 nm/min, resulting in a very high and desirable Cu:Ta:oxide selectivity of
~500:1:1, which shows these slurries are promising candidates for copper CMP.
Table 2.5: Removal rates and dissolution rate of copper films at pH 4 (Slurry A: 3 wt% MoO2 + 3 wt% KIO3) [2.58].
Slurry Composition Removal rate (nm/min) Dissolution rate (nm/min)
Slurry A 695 ± 28 43
Slurry A + 1 mM BTA 471 ± 23 6
Slurry A + 1 wt% PAA 997 ± 36 38

59
2.2. Integration Issues in Copper CMP for 65 nm Technology Node and Beyond
2.2.1. Need for Low-k Materials
The integrated circuit is a dynamic device that operates by transforming electrical
inputs into appropriate outputs in some prescribed time interval. Therefore, the overall
circuit speed is of paramount importance. This circuit speed has been steadily improving
as device and wiring dimensions have shrunk. As a result, not only must the resistance of
a single wire be considered, but also, the impedance of the interconnect structure, which
is made up of complicated array of wires separated by insulating material. A schematic
representation of such a structure is shown in Figure 2.13.
In the figure, R is the series resistance of the wire, C is the capacitance between
adjacent wires on the same level of metal, and C' is the capacitance between the wiring
levels. Thus, both the resistance of the wiring and the characteristic capacitance of the
insulator determines the “RC” time constant of the interconnect. The time delay of an
electrical signal propagating through the interconnect structure is then equal to the
reciprocal of the time constant. Based on this relation, it can be stated that the
performance of the interconnect array can be improved by decreasing the dielectric
constant of the insulator as well as resistivity of the conductor metal.
If the semiconductor device dimensions were large, the circuit speed would be
dominated almost entirely by the time constants associated with transistor operation and
not by interconnect structure. This is not the case, however, when the device dimensions
shrink. Figure 2.14 shows the variation of time delay in picoseconds as a function of
device generation. In this figure, the dashed curve represents signal delay associated with

60
Figure 2.13: Schematic of interconnect.
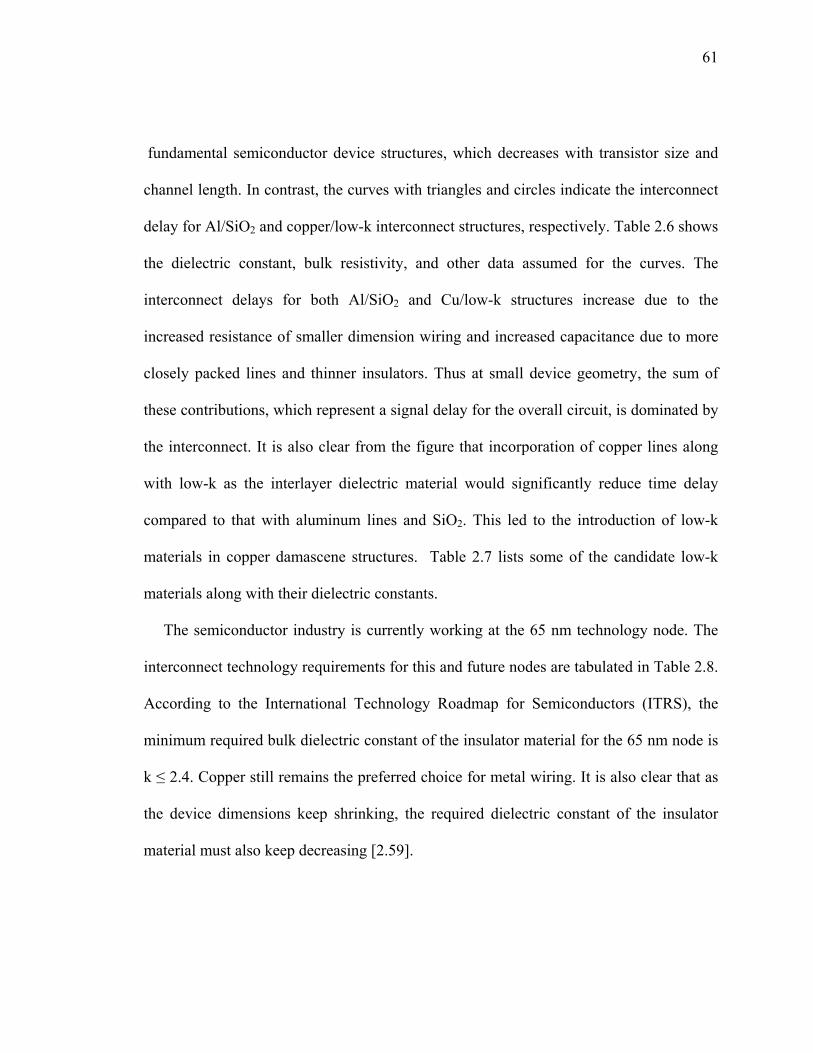
61
fundamental semiconductor device structures, which decreases with transistor size and
channel length. In contrast, the curves with triangles and circles indicate the interconnect
delay for Al/SiO2 and copper/low-k interconnect structures, respectively. Table 2.6 shows
the dielectric constant, bulk resistivity, and other data assumed for the curves. The
interconnect delays for both Al/SiO2 and Cu/low-k structures increase due to the
increased resistance of smaller dimension wiring and increased capacitance due to more
closely packed lines and thinner insulators. Thus at small device geometry, the sum of
these contributions, which represent a signal delay for the overall circuit, is dominated by
the interconnect. It is also clear from the figure that incorporation of copper lines along
with low-k as the interlayer dielectric material would significantly reduce time delay
compared to that with aluminum lines and SiO2. This led to the introduction of low-k
materials in copper damascene structures. Table 2.7 lists some of the candidate low-k
materials along with their dielectric constants.
The semiconductor industry is currently working at the 65 nm technology node. The
interconnect technology requirements for this and future nodes are tabulated in Table 2.8.
According to the International Technology Roadmap for Semiconductors (ITRS), the
minimum required bulk dielectric constant of the insulator material for the 65 nm node is
k ≤ 2.4. Copper still remains the preferred choice for metal wiring. It is also clear that as
the device dimensions keep shrinking, the required dielectric constant of the insulator
material must also keep decreasing [2.59].

62
Figure 2.14: Variation of time delay as a function of device generation [2.60].
Table 2.6: Assumed value to create figure 2.11
Material Properties and
assumed values
Al 3.0 μΩ-cm
Cu 1.7 μΩ-cm
SiO2 K = 4.0
Low K K = 2.0
Al & Cu 0.8 μm Thick
Al & Cu line 436 μm Long
(μm)

63
Table 2.7: List of candidate low-k materials. [Bold are true low-k]
Material Dielectric constant (k)
SiO2 4.0
FSG 3.4 – 3.8
HSQ (Hydrogensilses-quioxane) 2.8 – 3.0
Inor
gani
c
Die
lect
rics
Porous Silica 1.8 – 2.4
SiLK 2.6
Porous SiLK 2.2
SiOC 2.7 – 2.9
Porous SiOC 2.2 – 2.5
MSQ (methylsilses-quioxane) 2.7 – 2.9
Porous MSQ 1.8 – 2.5
Polyimide 3.0 – 3.5
Parylane 2.2 – 3.0
Organic Polymer
Tefron 2.0 – 2.5
Amorphous Carbon (F-doped) < 2.5
Org
anic
Die
lect
rics
CDO (carbon doped oxide) ~ 2.6

64
Table 2.8: MPU interconnect technology requirements - near term years [2.61].

65
2.2.2. Integration Challenges for Copper/Low-k Interconnects
The major difficulty with some of the low-k dielectric materials listed in Table 2.7 is
that in order to obtain a low dielectric constant, other material properties are generally
modified in an undesirable direction. For example, introducing porosity into these
materials reduces the dielectric constant. However, introduction of porosity reduces the
mechanical strength and hardness of these materials. Table 2.9 compares the properties of
low-k materials and oxide. The mechanical strength and hardness of the low-k insulator
are much less than that of vitreous silica. This directly affects CMP because the
downforce and rotation rates must be lowered to avoid mechanical damage and
scratching [2.62-2.64]. Conventional CMP processing for Cu/SiO2 structures uses
downforce of 8-9 psi. With the introduction of low-k materials, the CMP process must be
carried out at very low downforce of < 1 psi. This also requires the development of new
consumables such as slurries and pads. Abrasive free slurries are currently being
introduced to increase selectivity and to reduce defectivity on copper such as scratching,
erosion, and dishing. Another issue is layer-to-layer adhesion. As the mechanical strength
of the low-k materials is drastically reduced due to porosity, exposure of Cu/low-k
structure to conventional CMP leads to delamination of the low-k film. Figure 2.15(a)
shows an SEM cross-section of delamination in low-k film. In addition, a decrease in the
dielectric constant of the low-k material also makes it mechanically weak. This in turn
reduces the time to CMP-induced delamination. The time before the CMP-induced
delamination occurs can be increased by performing CMP at lower downforce pressures.
This is shown in Figure 2.15(b).

66
Table 2.9: Comparison of properties of low-k materials and oxide
Property Low-k Oxide
Density (g/cm3) 1.03 2.2
Dielectric Constant ~ 1.9–2.5 4.0
Modulus (GPa) ~ 3–9 55–70
Hardness (GPa) ~ 0.3–0.8 3.5
Coefficient of Thermal Expansion (ppm/K) ~ 10–17 0.6
Porosity (estimated) ~ 35–65% N/A
Average Pore Size < 2.0–10 nm N/A
Thermal Conductivity (W/m K) 0.26 1.4

67
Figure 2.15: (a) Cross-section SEM micrograph showing delamination of low-k film undergone CMP [2.65] and (b) Variation of time to CMP-induced delamination as function of modulus of low-k film [2.65, 2.66].
(a)
(b)

68
A typical mechanism of conventional copper CMP is mechanical abrasion followed by
chemical dissolution of the abraded material. However, with low-k materials, more of the
‘chemical’ aspect is necessary so that the downforce pressures can be reduced to maintain
low-k material integrity [2.67].
In an earlier study, Borst et al. [2.68] investigated low abrasive content slurries for
copper CMP. Two types of commercial slurries from Cabot Microelectronics Corporation
were tested. Slurry 1 contained 3 wt% Al2O3 with pH ~ 7 and slurry 2 was weakly acidic
in nature (pH 4) and contained 0.5 wt% Al2O3. As the abrasive content was reduced, an
aggressively reacting chemical component was added along with a corrosion inhibitor.
The exact name of the chemical was not disclosed. The polishing was carried out with a
rotary polisher using stacked concentric grooved pads. Both slurries were tested for low
downforce (~ 1 psi) and high downforce (~ 3 psi). It was found that slurry 2 had
approximately two-thirds the removal rate (600 nm/min) of slurry 1 at high downforce
(900 nm/min). For low downforce, the rate of slurry 2 (200 nm/min) was approximately
half of the rate of slurry 1 (450 nm/min). Careful observation of the polished surface
topography showed that the slurry with its low abrasives content was able to achieve
reduced dishing, erosion, and copper loss due to corrosion by taking advantage of
corrosion inhibitors. This was not the case with slurry containing a higher abrasive
content where more dishing and erosion of copper was observed. In the absence of
corrosion inhibitor, a very high copper loss due to corrosion was observed for both
slurries. No damage to the underlying low-k film was observed when CMP was carried
out using slurry 2 at low downforce.
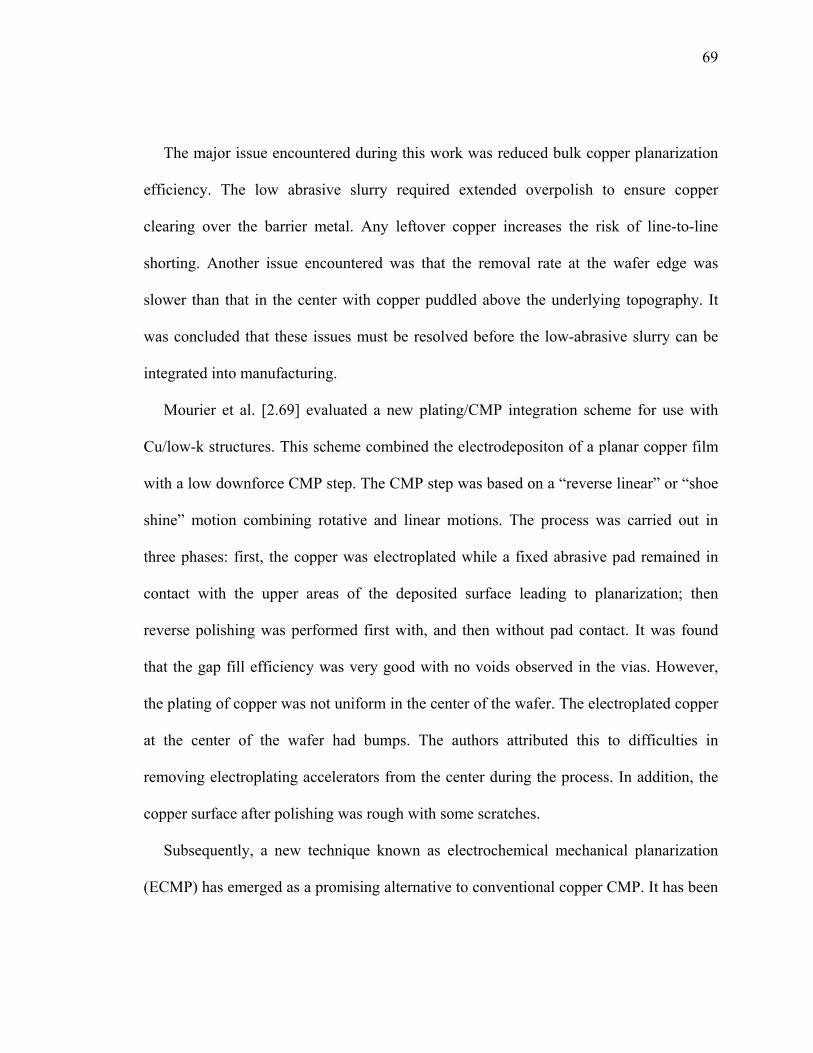
69
The major issue encountered during this work was reduced bulk copper planarization
efficiency. The low abrasive slurry required extended overpolish to ensure copper
clearing over the barrier metal. Any leftover copper increases the risk of line-to-line
shorting. Another issue encountered was that the removal rate at the wafer edge was
slower than that in the center with copper puddled above the underlying topography. It
was concluded that these issues must be resolved before the low-abrasive slurry can be
integrated into manufacturing.
Mourier et al. [2.69] evaluated a new plating/CMP integration scheme for use with
Cu/low-k structures. This scheme combined the electrodepositon of a planar copper film
with a low downforce CMP step. The CMP step was based on a “reverse linear” or “shoe
shine” motion combining rotative and linear motions. The process was carried out in
three phases: first, the copper was electroplated while a fixed abrasive pad remained in
contact with the upper areas of the deposited surface leading to planarization; then
reverse polishing was performed first with, and then without pad contact. It was found
that the gap fill efficiency was very good with no voids observed in the vias. However,
the plating of copper was not uniform in the center of the wafer. The electroplated copper
at the center of the wafer had bumps. The authors attributed this to difficulties in
removing electroplating accelerators from the center during the process. In addition, the
copper surface after polishing was rough with some scratches.
Subsequently, a new technique known as electrochemical mechanical planarization
(ECMP) has emerged as a promising alternative to conventional copper CMP. It has been

70
reported [2.70] that this technique is best suited for copper/low-k structures at the 65 nm
device node and beyond.

71
2.3. Electrochemical Mechanical Planarization (ECMP)
2.3.1. Introduction
The limitations of conventional slurry based CMP became evident at the 65 nm node.
Applying a typical process downforce (~2-3 psi) causes too much dishing and erosion,
resulting in high electrical resistance across various pattern densities. Electrochemical
mechanical planarization (ECMP), on the other hand, is a process in which the removal
rate is directly controlled by an applied electric charge. It is a highly efficient, high
removal rate process, which operates independent of downforce (< 0.5 psi). This
technology uses electrolyte chemistry instead of an abrasive slurry and features a high
planarization efficiency. The inherently low downforce of this approach is 5 – 10 times
lower than conventional CMP, which in turn minimize stress and enables true low-k
materials at the 65 nm device node and beyond. ECMP is also significantly less
expensive and more productive than conventional CMP. The consumables cost for ECMP
is around 30% less than that for conventional CMP [2.71, 2.72].
2.3.2. The ECMP Process
Economikos et al. [2.73] proposed that the ECMP process relies on the principle of
current affecting the dissolution of copper atoms into a solution, which is directly related
to the removal rate. As copper is removed, a Cu2+ complex dissolves into a solution and
two electrons are released as follows:

72
Cu → Cu2+ (complex) + 2e-
Therefore, the copper removal is directly proportional to the presence of electric charge
as shown in Figure 2.16. Controlling the electrical charge alone cannot determine the
copper profile removed from the wafer. To have a relation between endpoint and profile,
a three zone counter electrode was designed to achieve precise removal on different areas
of the wafer. The profile can be controlled by adjusting each zone’s voltage [2.74].
The ECMP process flow is similar to the conventional multi-platen process flow.
However, in the first step, bulk copper is removed by electrochemical mechanical
polishing combined with precision charge endpoint and electrochemical profile control.
The remaining, very thin, planar copper film and barrier layer are removed using
conventional slurry based CMP process, which operate at low downforce (~0.6 psi) with
high precision. An important component of the ECMP process is a mathematical model,
developed to calculate the post ECMP copper profile, based on in-situ real time detected
current. The thickness of incoming copper film on each wafer is automatically measured
to accurately control the bulk copper removal and detect the endpoint. The entire ECMP
process is controlled by an algorithm, which sets the post-profile of the desired remaining
copper thickness and computes the optimal charge required for the process. This
algorithm based control technique provides a tight, repeatable and reliable control of the
endpoint, independent of incoming film variations. High copper removal rate in excess of
6,000 Ǻ/min is achieved with nearly no shear force being applied to the wafer. The
ECMP liquid chemical delivery system mixes electrolyte chemicals as needed, and
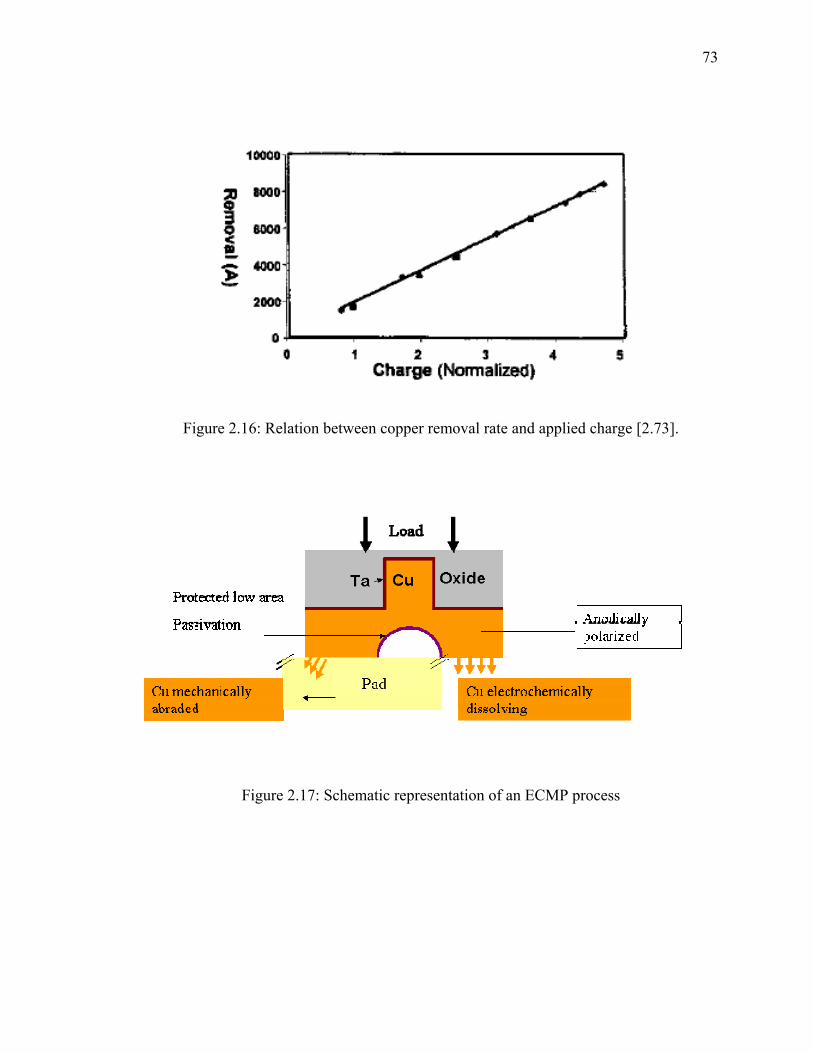
73
Figure 2.16: Relation between copper removal rate and applied charge [2.73].
Figure 2.17: Schematic representation of an ECMP process

74
delivers them to the wafer at a low flow rate. Within the ECMP platen, the electric charge
is applied to multiple independent electrochemical zones, controlling within-wafer
removal rates to adjust for variations in topography [2.74]. This in turn creates a planar
and uniform copper profile across the wafer surface.
Copper removal is localized in areas where the pad contacts the wafer, while the
recessed areas, where there is no pad contact, undergo virtually no removal, as shown in
Figure 2.17. This is achieved by the addition of corrosion inhibitors. A passivation
mechanism, in which a layer of passive film forms almost instantly on non-contact areas,
is the key to this process. The passive film must have excellent chemical stability but
poor mechanical stability, so that it can be removed easily by the application of a very
small downforce. In high lying areas of the wafer that contacts the pad, the passive film is
removed and electrochemical dissolution of the copper occurs. At the same time, the
passive film suppresses removal in the low-lying areas. The passivation layer has a much
higher electrical resistance that the passivation free areas contacted by the pad, allowing
electrochemical copper removal to be localized to the pad contact zone [2.75, 2.76].
2.3.3. Topographic Control
Ideally, the absence of material removal in the protected recessed areas during the
ECMP process eliminates device pattern dependence, providing uniform planarization
across both dense arrays and large open areas or trenches. The key effect of this pattern
independence is a significant reduction of dishing and erosion. In addition, the
subsequent polishing steps are rendered much easier and more uniform due to the

75
uniform profile of the post ECMP layer. The reduction in downforce also effectively
avoids peeling and microscratches, common in conventional slurry-based CMP. Figure
2.18 compares cross-section SEM micrographs of wafers exposed to ECMP and regular
CMP. However, the pattern dependence of copper ECMP has not yet been thoroughly
studied and quantified. Some literature [2.71, 2.72] reports the pattern dependence to be
small. However, some researchers have observed that during copper ECMP, feature depth
decreases rapidly for the narrowest features and quite slowly for the widest features.
2.3.4. Line Resistance
Electrical results have shown that the isolated line resistance for advanced low-k
dielectric wafers polished with ECMP is ~ 130% lower than typical CMP, indicating
improved erosion performance.
2.3.5. Environmental Advantages
The disposal of regular CMP slurries has always been an issue due to the presence of a
large amount of abrasive particulates. It usually requires expensive tools, which can
concentrate the abrasives and reduce the slurry volume. The electrolyte used in the
ECMP process drastically reduces disposal complexity and cost. The electrolyte
chemicals can be easily neutralized and are no more difficult or expensive to dispose off
than many other standard industrial chemicals [2.77].

76
The potential advantages of using ECMP process include:
1. Better and more selective planarization, both locally and globally on the wafer
2. Less bulk copper needs to be plated because the ECMP process is more
controllable
3. Reduced risk of film delamination and damage to low-k due to lower downforce
4. Less dishing and scratching of the copper surface
5. Elimination of slurry particles
6. Precise electrochemical endpoint detection
7. low consumable costs and less waste generation

77
.
Figure 2.18: Effect of downforce on low-k (k<2.5) wafers, shows peeling at high downforce and no peeling under ECMP.
Cu Peeling CMP (3-9 psi)
No Cu Peeling ECMP (< 0.5 psi)

78
2.4. Pads/Electrodes for ECMP
The pad/electrode structure used by Wada et al. [2.78] in their investigations is shown
in Figure 2.19. The electrode consists of two parts: a processing electrode (cathode) used
to remove the copper film, and a feeding electrode (anode) used to supply current. Both
electrodes touch the copper film on the wafer. An ion exchange material serving as a
catalyst is placed on the surface of the electrode body. The ion exchange material and
copper film are then brought in contact. An electrolyte is supplied to the interface of
wafer/ion exchanger interface, the ion exchanger, and the interface of the electrode
body/ion exchanger. The current flows from the anode, through the copper film and the
electrolyte towards the cathode. The ion exchanger increases the ionic concentration of
the electrolyte. Removal of copper film takes place underneath the processing electrode.
Several of these electrode combinations are placed across the platen to increase the total
area of the cathode. To ensure uniformity across the wafer, the electrodes and the wafer
move relative to each other.
Another design developed by Knodo et al. [2.79] used a three layer polishing pad
made of carbon. The pad consisted of a surface carbon layer as an anode, an intermediate
insulating layer, and an underlying cathode sheet. More than a hundred electro-cells, each
about 5 mm thick, were fabricated within this structure as shown in Figure 2.20. The
insulating layer between the anode and the cathode also acted as a cushion to improve
within wafer non-uniformity. A soft carbon material was used as the anode to avoid

79
Figure 2.19: Schematic of pad/electrode structure used by Wada et al. [2.78].

80
Figure 2.20: Carbon polishing pad used by Kondo et al. [2.79]. [Inset: Electro-cell structure fabrication in carbon pad].

81
damage to the copper surface. The power supply was connected at the edge of the pad.
An adhesive sheet was used to stick the carbon pad onto the CMP platen. This provided
the flexibility of converting a CMP system into an ECMP system by replacing the
conventional polyurethane pad with the carbon one. The electrolyte for polishing was
supplied through small holes in the platen. First, the electrolyte is filled in all electro-cells
in the carbon pad, then flows along the channel fabricated in the insulating layer, and
drains outside to the edge of the pad. This design allows the Cu2+ ions to be carried
outside the pad during ECMP and prevents the electroplating of copper on the cathode
surface. If a copper film is deposited on cathode, it is easily delaminated during ECMP
and often causes scratching on the wafer surface. This also reduces the ECMP cost due to
longer pad life.

82
2.5. Chemistries for ECMP
Wada et al. [2.78] investigated the feasibility of electrochemical polishing (ECP) of
copper in de-ionized water (DI). A specially designed pad/electrode system described in
Section 2.4 was used. The process involved copper removal through the electrochemical
interaction of OH- ions in DI water and the surface atoms of copper film. The idea was to
protect the surface of copper from contamination by electrolyte ions. In addition, the use
of DI would reduce the cost, as no post-processing of the waste fluid is required. Copper
removal rate was characterized as a function of pressure, current density, and relative
speed between the wafer and the electrode. It was found that pressure and relative speed
had virtually no effect on removal rate (~ 200 nm/min), while the rate increased linearly
with current density. They concluded that, based on the appropriate setting of current
density, copper removal rates as high as 800 nm/min to 1600 nm/min can be obtained. In
addition, a very high degree of planarity was achieved. According to the proposed
mechanism, the contact between the high lying areas of the film and the ion exchanger
(Figure 2.19) increased the conductivity of DI water. This resulted in removal of the film.
Alternatively, the low-lying areas were not in contact with the ion exchanger, hence the
conductivity of DI water remained low. Thus, removal in low lying areas takes place very
slowly. It is because of this difference that the high lying areas of the film are selectively
removed, and planarity is achieved. This is schematically shown in Figure 2.21.
A study by Huo et al. [2.80, 2.81] examined the feasibility of copper electrochemical
polishing in solutions of phosphoric acid, sulfuric acid, sodium chloride, ethylene glycol,
and hydroxyethylidenediphosphonic acid (HEDP), with or without organic and inorganic

83
additives. Anodic polarization of copper carried out using rotating disk electrode (RDE)
showed a limiting current plateau region for most of these solutions. Polishing
experiments were carried out in potentiostatic mode, with potentials corresponding to the
middle point of the limiting current plateau on the polarization curves. Initial polishing
experiments were carried out on copper disks. The copper surface, before and after ECP,
was characterized using atomic force microscopy (AFM) for surface roughness. A
surface with roughness (Ra) of < 10 nm was considered smooth. The observed removal
rate (Rd) and surface roughness for various chemistries are listed in Table 2.10. Polishing
in solutions of phosphoric acid, HEDP, and phosphoric acid containing additives such as
CuO, ethylene glycol and sodium tripolyphosphate, resulted in a smooth copper surface.
However, a rough surface was seen after polishing in ethylene glycol-sodium chloride,
sulfuric acid and sulfuric acid-sodium nitrate solutions. Thus in the next part of the study,
the polishing of patterned electroplated copper films was carried out in phosphoric acid
and HEDP solutions. It was found that protruding areas on the film were not planarized in
phosphoric acid while a good planarization was obtained in HEDP solutions due to
formation of a salt film.
A potentiodynamic polarization technique was employed by Chang et al. [2.82, 2.83]
to analyze electrochemical behavior of copper electropolishing in phosphoric acid
(H3PO4) solutions. They found that the limiting current density increased as the H3PO4
concentration decreased. This behavior was attributed to an increase in conductivity of
electrolytes with a decrease in H3PO4 concentration, thus promoting the diffusion of the

84
Figure 2.21: Mechanism for electropolishing of copper in DI water as proposed by Wada et al. [2.78].
Table 2.10: Summary of copper disk electropolishing data.
Solution iL, mA Rd, μm/min Ra, nm
30-100% H3PO4 + 0-2 M CuO 20-200 0.44-4.4 5-29
70% H3PO4 + 5-25% ethylene glycol 14-50 0.3-1.1 5-8
70% H3PO4 + 0.1-0.5 M Na5P3O10 32-50 0.7-1.1 7-17
20-80% HEDP + 10-30% H3PO4 14-167 0.3-3.7 6-243
20-100% ethylene glycol + 1-2 M NaCl 20-50 0.44-1.1 63-91
20% H2SO4 + 0-2 M NaNO3 70-80 1.54-1.75 72-279

85
dissolved metal ions into the bulk electrolyte and enhancing the limiting current. The
polishing rates of electroplated copper film were 500, 1000, and 1500 nm/min for 85%,
70% and 50% H3PO4 electrolytes, respectively. After polishing at 1.3 volts in 85% H3PO4
electrolyte, the average roughness of the polished surface was 1.1 nm, as compared to
15.2 nm before electropolishing.
Goonetilleke et al. [2.84, 2.85] studied the basic electrochemical aspects of ECMP of
copper for designing appropriate voltage treatments in peroxide based glycine solution
containing additives at pH 4. Corrosion parameters were measured using triangular
voltage pulses defined with Emin = -0.5 V, Emax = 1.0 V and υ = 0.1 V/sec in four
electrolytes: (1) 0.05 M KNO3, (2) 0.05 M KNO3 + 1 wt% glycine, (3) 0.05 M KNO3 + 5
wt% H2O2, and (4) 0.05 M KNO3 + 5 wt% H2O2 + 1 wt% glycine. Strong passivation
was not observed, except that the anodic branches of peroxide containing solutions (3 and
4) showed a weak feature associated with CuO/Cu(OH)2 formation. No effect of voltage
treatment was observed on the anodic and cathodic slopes for all the four solutions. The
dissolution of copper was controlled with a voltage program containing N number of
triangular pulses using Emin = 0.4 V, Emax = 1.2 V and υ = 0.1 V/sec. N was varied
between 2 and 14, which gave total voltage treatment times in the range of 32-224
seconds. Both the solution pH and the mass of copper sample were measured before and
after each voltage treatment. The dissolution rates were 160, 133, 28, and 215 nm/min for
solutions 1, 2, 3, and 4 respectively. It was inferred that the presence of H2O2 in KNO3
electrolyte acts against voltage activated dissolution of copper by forming insulating
oxide on the copper surface. This effect of H2O2 is counteracted by glycine, which

86
chemically dissolves CuO and forms soluble copper-glycine complexes. The dissolution
rate of copper in the KNO3-glycine-peroxide solution was similar to that obtained in only
KNO3, as well as KNO3 containing glycine. However, the acidity of the KNO3 solution in
the absence of additives changed over time due to the decomposition of NO3- ions during
the strong voltage treatments. This would be of particular concern in ECMP as such an
increase in electrolyte pH could activate oxidation reactions and reduce the copper
dissolution rate. Thus copper dissolution cannot be efficiently controlled in KNO3 only
solution, which would hinder its ECMP applicability.
87
2.6. Importance of Static Etching in ECMP
Planarization can only be achieved if the low-lying areas remain intact while the
higher areas are removed during polishing. This high removal rate selectivity between the
higher areas and lower areas is critical for both ECMP and conventional CMP processes.
In ideal chemistry and conditions, the removal of topography by planarization takes place
as shown in Figure 2.22. M1 is the thickness of the metal on the inter-layer dielectric
(ILD) and M2 is the thickness of the metal in the trench. Polishing proceeds by
considerable reduction of M1, while no or very small reduction of M2 takes place.
Planarization is finally achieved when M1 becomes equal to M2. This is commonly seen
in conventional CMP slurries containing oxidants such as peroxide, which forms a
passive oxide film on the copper surface [2.86-2.89].
This is not the case when oxidizers such as nitric acid or hydroxylamine are used.
These chemistries dissolve copper very rapidly and in turn reduce the removal rate
selectivity between high and low lying areas. The change in topography of copper while
polishing in an aggressive chemistry is shown in Figure 2.23. As polishing proceeds, the
thickness of the metal over ILD (M1) is reduced due to combined chemical and
mechanical effect. The thickness of the metal (M2) in the trench, which is free from pad
contact, also decreases due to chemical dissolution. This phenomenon is known as static
etching. On further polishing, the thickness of the metal M2 in the trench falls below the
dielectric step height, while M1 gets reduced. Planarity cannot be achieved in this
situation. Static etching is of particular concern in nitric acid and hydroxylamine
chemistries where the copper etch rates are 0.9 μm/min and 85 nm/min respectively

88
[2.90]. Since copper is electrochemically active, static etching is also a major concern in
copper ECMP. Static etching would not pose a problem if the ratio of polish rate to etch
rate was high, but a high static rate can cause problems even after polishing is stopped.
The leftover slurry on the wafer surface would continue to attack copper during the
transfer to the next platen or to a post-CMP clean step. Thus, static etching is controlled
by the addition of inhibitors, which reduce or prevent chemical dissolution by formation
of a passive film on the copper surface [2.91].
Passive film formation is very critical for the success of copper ECMP, since
elevations on the copper surface are in direct contact with the pad and are
electrochemically planarized, while the recessed areas are protected by the passive film.
This is also shown in Figure 2.22. The nature and properties of passive film affects the
downforce pressure required for passive film removal, the copper removal rate, and the
extent of dishing. If there is no passive film formation, copper removal will be conformal
all over the surface and planarity cannot be achieved. On the other hand, a thick non-
porous passive film will require a large downforce, increasing the probability of
damaging low-k dielectrics. The major requirements of a passive film for ECMP
application are: (1) passive film must form at surface recesses, whereby the copper
removal rate is nearly zero, (2) passive film must be stable at anodic potentials, and (3)
the passive film must be easily removed when it does come in contact with the pad.

89
Figure 2.22: Change in topography of copper by planarization in presence of inhibitor during ECMP process.
ILD
Cu
ILDCu
Final Topography
Pad
Planarized surface
ILD
CuM1
M2
Initial Topography
Passive filmStatic area
ILD
Cu
Passive film Protects copper
PadCu electrochemically dissolving
ILD
Cu
ILDCu
Final Topography
Pad
Planarized surface
ILD
CuM1
M2
Initial Topography
Passive filmStatic area
ILD
Cu
Passive film Protects copper
PadCu electrochemically dissolving

90
Figure 2.23: Change in topography of copper while polishing in aggressive chemistry with high static etch rate.

91
2.7. Inhibitors for Copper
Benzotriazole (BTAH, C6H5N3) is one of the most commonly used corrosion
inhibitors for copper. It is widely used as an additive in copper CMP slurries [2.91-2.94].
The interaction between copper and benzotriazole (BTAH) has been extensively
investigated [2.95, 2.96]. It has been reported that both BTAH and the BTA ion (C6H4N3-
), form a chemisorbed layer on the copper as well as cuprous oxide surface. The
interaction is by formation of insoluble cuprous surface complex, as shown by following
reaction
Cu + BTAH → CuBTA + H+ + e-
Under certain conditions, formation of a thick, multilayered film has been demonstrated
[2.97]. Chan and coworkers used surface enhanced Raman spectroscopy (SERS) to study
adsorption of benzotriazole on copper in aqueous electrolytes, as a function of pH. The
spectral features for BTAH and BTA- showed surface attachment via a pair of triazole
nitrogen with a tilted or vertical orientation [2.98, 2.99]. Vogt et al.’s [2.100, 2.101]
observations using a scanning tunneling microscope (STM) showed chains and clusters
of BTA molecules at low concentrations signifying incomplete surface coverage. A thick
multilayer film incorporating small amounts of oxidized copper was observed with
increase in BTA concentration. XPS analysis by Tamilmani [2.102] on BTA films
formed in hydroxylamine solutions showed that the passive BTA film is actually a
cuprous-BTA complex.
It has been reported that in only certain chemistries, benzotriazole is an effective
corrosion inhibitor for copper [2.103]. A study by Bastidas et al. [2.104, 2.105] compared

92
the efficiency of benzotriazole and 2-amino-5-mercapto-1,3,4-thiadiazole (AMT) as a
corrosion inhibitor for copper exposed to 5 wt% citric, sulfuric and hydrochloric acid
solutions. The experimental techniques used were weight loss, DC polarization,
polarization resistance, and electrochemical impedance spectroscopy. The DC
polarization results showed that in citric acid solution, AMT is a cathodic inhibitor while
BTA operates on anodic branch. Both AMT and BTA act as anodic inhibitors in sulfuric
acid solution, but act as cathodic inhibitors in hydrochloric acid solution. Gravimetric
tests showed that the inhibition efficiency of AMT was higher than that of BTA for
sulfuric and hydrochloric acids. In citric acid solution, inhibition efficiencies of both
BTA and AMT were similar.
The use of BTA nowadays is quite limited due to environmental concerns. Otmačić et
al. [2.106] investigated nontoxic imidazole derivatives as corrosion inhibitors for copper
in acidic and near neutral 3% sodium chloride solutions using electrochemical
polarization and weight loss techniques. The structure of various imidazole derivates
along with BTA and other inhibitors is shown in Figure 2.24. The results showed that
compounds with higher molecular weight have better inhibiting properties. The inhibitors
that do not contain a phenyl ring had a higher influence on the cathodic reaction, while
those having a phenyl ring influenced the anodic reaction to a much greater extent. The
best corrosion inhibitor was determined to be 4-methyl-1-phenyl imidazole. The free
energy of adsorption calculations indicated that imidazole derivates physisorbed on the
copper surface.

93
In addition to high inhibition efficiency, the corrosion inhibitor used in the electrolyte
for ECMP of copper must also remain stable at high anodic potential conditions. The
passive film formed due to the inhibitor must have excellent chemical stability but poor
mechanical stability, so that it can be removed by low downforce. Hong et al. [2.107]
demonstrated the use of ammonium dodecyl sulfate (ADS) surfactant as a corrosion
inhibitor for ECMP of copper in hydrogen peroxide-glycine solutions. The inhibition
efficiencies of ADS and BTA were studied in 5 wt% H2O2 containing 1 wt% glycine at
pH 4, using moderate to strong anodic voltage activation and potentiodynamic
polarization measurements. At overpotential of 370 mV, the inhibition efficiency of ADS
was 85% while that of BTA was 10%. With an increase in overpotential to 1.2 V, the
inhibition efficiency of ADS decreased to 65% while that of BTA remained the same.
The recorded corrosion currents (icorr) for ADS and BTA were 66 μA/cm2 and 290
μA/cm2 respectively. Thus, it was concluded that ADS can serve as an effective corrosion
inhibitor for ECMP of copper.
The effectiveness of BTA and salicylhydroxamic acid (SHA) on copper dissolution in
0.5 M hydroxylamine solution at pH 6, was studied as a function of overpotential by
Tamilmani et al. [2.102]. In the absence of inhibitors, the copper dissolution rate
increased from 85 nm/min at the open circuit potential (OCP) to 240 nm/min at an
overpotential of 250 mV. At approximately 250 mV, the dissolution rate decreased to 120
nm/min due to the decomposition of hydroxylamine to form nitrate (NO3-) at higher
overpotentials. In the presence of 0.01 M BTA and SHA, the copper dissolution rates
were low (< 50 Ǻ/min) at OCP and 250 mV overpotential conditions. The dissolution rate

94
of copper increased to 180 nm/min for BTA and 30 nm/min for SHA at an overpotential
of 750 mV. This indicates that both BTA and SHA offer very little protection to copper at
higher overpotentials. Anodic polarization curves showed a rapid increase in current due
to breaking of the passivation layer above 250 mV overpotential, which in turn resulted
in higher dissolution rates. Removal rates of copper under abrasion conditions were also
studied. At 250 mV overpotential, the copper removal rates during abrasion were 20
nm/min and 80 nm/min for 0.01 M BTA and SHA respectively. The static dissolution
rates were very low for both inhibitors. With a decrease in BTA and SHA concentration
to 0.005 M, the removal rate increased to 200 nm/min. Unfortunately, the static
dissolution rates also increased to 160 nm/min for BTA and 50 nm/min for SHA. These
results indicate that, even in the presence of corrosion inhibitors like BTA and SHA,
planarity cannot be achieved in 0.5 M hydroxylamine solution. This is due to the
breakdown of the passive film at higher anodic overpotentials and the resulting increase
in the static dissolution rate of copper in recessed areas.
An inhibitor that has an inhibition efficiency of 100% is ideal for ECMP applications.
The use of such an inhibitor in ECMP electrolyte would lead to zero static dissolution
rate of copper in the recessed areas. An organic compound having redox properties would
be the inhibitor of choice. The current work introduces a new inhibitor thiosalicylic acid
(TSA) with redox properties, which shows zero static dissolution rates at high anodic
overpotential conditions.

95
Thiosalicylic acid (TSA) a derivative of salicylic acid, has two acid dissociation
constants pKa1 and pKa2 corresponding to deprotonation of the carboxyl and sulfhydryl
groups. The pertinent reactions are as follows:
C7H6O2S → C7H5O2S- + H+ pKa1 = 4.65
C7H5O2S → C7H4O2S2- + H+ pka2 = 9.40
It has been reported [2.108] that TSA complexes with copper ions depending on the
solution pH. The complexation equilibria were studied spectrophotometrically. In the pH
range of 1.0-2.5, the interaction of cupric ions with TSA (LH2) occurs according to
following equilibrium:
Cu2+ + LH2 ↔ CuLH+ + H+ log k = 2.30
In the pH range of 3.0-5.5, the CuLH+ species is deprotonated further as follows:
CuLH+ ↔ CuL + H+ log k = -1.52
The above two reactions can be combined and a single chelate equilibrium for pH range
of 1.0–5.5, can be derived as under:
Cu2+ + LH2 ↔ CuL + 2H+ log k = 11.02
Above pH 5.5, the hydrolysis of cupric-TSA complex occurs. It was thus concluded from
this study that TSA formed a monoligated complex with copper(II). The proton released
as a result of complexation with copper(II) is the sulfhydryl proton of TSA. In this
dissertation, TSA was tested as corrosion inhibitor for copper ECMP applications.

96
Figure 2.24: Chemical structure of various copper corrosion inhibitors.
97
2.8. Oxalic Acid Based Chemistries
Oxalic acid is a carboxylic bidentate complexing agent, which is commonly used in
cleaning of rust out of automobile radiators and steam boilers [2.109] and the leaching of
several metals and metal oxides [2.110-2.113]. In aqueous solutions, oxalic acid exists in
three different forms, namely, H2C2O4, HC2O4-, and C2O4
2-. The equilibria among these
are depicted as follows:
H2C2O4 ↔ HC2O4- + H+ pKa1 = 1.25
HC2O4- ↔ C2O4
2- + H+ pKa2 = 4.26
The distribution of oxalic acid species as a function of pH in oxalic acid-water system is
shown in Figure 2.25. The speciation diagram was construed for a total oxalic acid
concentration of 0.1 M. As shown in the figure, H2C2O4 predominates at pH values below
1.25 (pKa1), while C2O42- predominates at pH values above 4.26 (pKa2). The mono-
protonated species HC2O4- dominates at intermediate pH values. Oxalic acid has been
tested as a complexing agent in copper CMP slurries and in post CMP cleaning
formulations [2.114].
Gorantla and coworkers [2.115] investigated the dissolution and CMP behavior of
copper in 0.065 mol dm-3 oxalic acid containing 5 wt% H2O2 as a function of pH. At the
natural pH of the system (~1.5), the dissolution rate was 30 nm/min while the polish rate
was 1500 nm/min. The copper surface after dissolution experiments revealed the
presence of a bluish film. The dissolution rate of copper increased with pH until pH 3.0,
above which the rate decreased. The surface of the copper coupon was bright without any
sign of bluish film observed at pH 1.5. The potentiodynamic polarization experiments

98
showed formation of a strong passivation film on the surface of copper for pH 1.5, while
no such film was formed at the other pH values. The open circuit potential (OCP)
measurements during polishing at pH 1.5 indicated a gradual increase in the potential
when the polishing was stopped. This behavior was attributed to a gradual growth of a
modified surface film on copper. When the polishing was resumed, the OCP value
stabilized back at its earlier lower value prior to the stoppage of polishing. It was thus
inferred that pH plays a very important role in determining the chemical interactions
between oxalic acid and the copper surface. The strong complexing ability of oxalic acid
makes it desirable for use in the ECMP electrolyte. The oxalic acid based electrolyte also
requires the use of a corrosion inhibitor to control static dissolution rate.

99
Figure 2.25: Speciation diagram for oxalic acid - water system.
0 2 4 6 8 10 12 140.0
0.1
0.2
0.3
0.4
0.5
0.6
0.7
0.8
0.9
1.0
1.1
[C2O42-]
[HC2O4-]
Frac
tion
pH
[H2C2O4]

100
CHAPTER 3: EXPERIMENTAL SET-UP AND MATERIALS
3.1. Theoretical Work
3.1.1. Potential – pH Diagrams
Potential-pH diagrams were constructed using a commercially available software
program called STABCAL [3.1]. The standard free energy of formation (ΔG0f) of oxalic
acid, citric acid, and their respective copper complexes was obtained from the literature.
However, the standard free energy values of benzotriazole (BTAH), thiosalicylic acid
(TSA) and their respective copper complexes were not available in the literature. A
technique known as group estimation method was used to estimate the free energy values
of BTAH and TSA [3.2, 3.3]. To estimate the free energy, the chemical structure of an
organic compound is first broken into its constituent functional groups. Each functional
group has an assigned free energy contribution value. In this method, all the functional
groups and organic compounds are represented in their ionic states in aqueous solution.
For example, a carboxylic acid group (–COOH) is represented as an anion (–COO-). The
value for each functional group is added to a constant base value (also known as origin)
of -23.6 kcal/mol. If a particular group occurs multiple times within the chemical
structure, its free energy contribution value is multiplied by number of occurrences and
then added to the origin value. Using the estimated free energy value for the ligands, the
free energy of formation of each copper complex was calculated using stability constant
data [3.4]. The estimated free energy values of BTA, TSA and their copper complexes

101
are tabulated in the Table 3.1. The accuracy of this method was tested by calculating free
energy values of common organic compounds and comparing the values with those in the
literature. For example, the free energy of the triply charged citrate ion -1162.7 kJ/mol
and that calculated with group estimation method is -1163.5 kJ/mol [3.5]. It can be seen
that these values almost match each other. This shows that the group estimation method
can produce accurate results.

102
Table 3.1: Free energy of formation of various ligands and their copper complexes estimated using group estimation method.
Species Estimated free energy of formation
(∆G0f) (kJ/mol)
BTAH 218.82
TSA -209.61
CuBTA 227.94
CuTSA -133.05

103
3.2. Experimental Methods
3.2.1. Laboratory Scale Electrochemical Mechanical Abrasion Cell (EC-AC)
A specially designed electrochemical abrasion cell was used for all the removal rate
and electrochemical studies (Figure 3.1). The cross-sectional view of this research tool is
schematically shown in Figure 3.2. The EC-AC tool can be viewed as an “upside-down”
version of an industrial CMP tool. The main advantages of this “inverted” design are: (1)
it provides flexibility of performing electrochemical measurements on electroplated
copper films deposited on silicon wafers, during abrasion conditions, and (2) the
chemical solutions used during experiments can be collected for further analysis. Many
researchers have used a rotating disk electrode (RDE) setup pressed against a pad to
simulate copper CMP and ECMP [3.6-3.10]. Such a setup does not exactly simulate
copper ECMP or CMP. The reason is that the RDE setup uses bulk copper samples,
which may possess different electrical and physical properties than electroplated copper
films.
The laboratory scale EC-AC tool can be divided into two parts: (1) the top part
consists of pad, stepper motor, and load cells, and (2) the bottom part consists of Teflon®
vessel, copper sample, and a stainless steel table with bottom stepper motor.

104
Figure 3.1: Typical setup of the laboratory scale electrochemical abrasion cell (EC-AC tool).

105
Figure 3.2: Cross-sectional view of the EC-AC tool.

106
3.2.2. ECMP Experiments in the EC-AC Tool
A typical ECMP experiment was conducted as follows: The bottom part was first
assembled by placing a circular copper metal plate (0.16 cm thick) on top of the stainless
steel table, with a Teflon® insulating plate between them. A diced copper plated wafer
sample of size 4 cm x 4 cm was then placed on the circular copper plate. An electrical
contact was established between the copper film and the bottom copper plate, by
wrapping a thin piece of aluminum foil around the wafer edge. This made the copper film
the working electrode. The Teflon® vessel with a hole in the bottom was then placed on
the copper sample. This Teflon® vessel holds the electrolyte. A Viton® o-ring was used
as a seal between the Teflon® vessel and the copper sample surface. The o-ring serves
two purposes: (1) it prevents the electrolyte from leaking out of the Teflon® vessel, and
(2) it holds the copper sample in place during rotation. The Teflon® vessel was securely
fastened to the bottom stainless steel place with four screws. After the copper sample was
properly assembled, the electrical continuity between the copper sample and the copper
metal plate was tested by measuring resistance using a multimeter.
The top part of the EC-AC tool was then assembled by attaching a small section of a
pad of diameter 1.5 cm to the Teflon® pad holder. The Teflon® pad holder was then
attached to the top stepper motor shaft using a setscrew. A Rohm and Hass IC1000 pad
(with K-grooves) stacked on Suba IV was used in all the experiments. The complete
assembly of the EC- AC tool occurred when the bottom part was placed underneath the
top part. The bottom part of the tool fits on the slot screws of an adjustable table. The axis

107
Figure 3.3: Schematic showing the offset between the pad and the copper sample

108
of rotation of the pad and the sample was offset by adjusting the micrometer screw on the
bottom table. This is schematically shown in Figure 3.3. This ensured an efficient control
of the polished area on the sample. Once the pad and pad holder were in place, both the
counter electrode (CE) and the reference electrode (RE) were placed in the Teflon®
vessel close to the sample. The connection of the potentiostat with the reference and
counter electrodes was straightforward. The working electrode was connected by firmly
pressing a carbon brush on the conducting copper plate on top of the stainless steel table.
Care was taken to ensure that a constant electrical continuity was maintained, while the
carbon brush was sliding on the conducting copper plate during rotation. After the
assembly of the abrasion cell, a 100 ml of electrolyte/solution was poured into the
Teflon® vessel. The pad and the sample were rotated at 240 and 222 rpm, respectively,
without any contact. Polishing started once the pad was lowered to contact the sample
surface at a required pressure.
The amount of pressure applied to the copper film during polishing was measured by a
strain gauge meter connected to the load cells fastened to the pad/motor assembly. The
measurable pressure range was 0 to 20 pounds per square inch (psi). Standard calibrating
weights were used to calibrate the digital readout of the load cell. A calibration curve
relating the applied pressure (in psi) to the digital readout on the strain gauge meter was
used to apply the desired pressure to the copper film. All the polishing experiments,
unless otherwise specified, were carried out at a pressure of 2 psi.
109
3.2.3. Static (no abrasion) Experiment in EC-AC Tool
EC-AC tool was also used to perform static etching experiments without the sample
being abraded. The sample was attached to the base of the polisher as described in
Section 3.2.1. Necessary electrical contacts were made for electrochemical measurements.
The sample was rotated at 222 rpm and the pad at 240 rpm, without any contact with the
sample. The distance between the pad and the sample was on the order of a few
millimeters.

110
3.3. Electrochemical Measurements
All electrochemical measurements were performed using Princeton Applied Research
(PAR) potentiostat model 6310. A three-electrode setup was used for the electrochemical
measurements. The working electrode was the copper film. Electrodeposited copper films
of various thicknesses (800 nm, 1500 nm, and 8000 nm) on a film stack of tantalum
(~200 nm) and SiO2 on silicon wafers were used. ECMP was carried out on both blanket
and patterned copper films. The blanket copper films were obtained from Freescale
Semiconductor and EKC Technology, while the patterned copper films were obtained
from ASM-NuTool. The counter electrode was a platinum metal plate obtained from
Aldrich chemicals. The reference electrode was saturated calomel (SCE, Hg/Hg2Cl2). All
the chemicals including oxalic acid, citric acid, BTA and TSA were obtained from Alfa
Aesar chemical company. Potassium hydroxide (KOH) was used to change the pH of the
solution. Polishing experiments on copper films were carried out in oxalic acid solutions
in the presence of BTA and TSA under potentiostatic and galvanostatic conditions. The
electrochemical data, which included current vs. time and potential vs. time profiles, was
recorded using PAR Model 352/252 Corrosion Analysis Software Version 2.23.
3.3.1. Potentiodynamic Polarization
The potentiodynamic polarization technique is a simple and quick way to determine
the extent of corrosion on metals that may take place in different chemistries and abrasion
conditions. This technique involves perturbation of potential of the working electrode at a
certain rate and recording the current response. Depending on the magnitude, direction,

111
and scan rate of the potential, this technique can be further classified into sub techniques
such as anodic polarization, linear polarization, Tafel polarization, etc. The theories and
steps involved in calculations are described in the following paragraphs.
An electrochemical reaction representing corrosion of metal M is shown in equation
(3.1). This reaction is sometimes also referred to as a “charge transfer” reaction.
M+ + e- ↔ M (3.1)
The amount of current (i, Ampere) or current density (i, Ampere/cm2) produced from the
charge transfer reaction is given by the Bulter-Volmer equation shown in equations (3.2)
and (3.3) [3.11-3.14].
anodic current density cathodic current densitya ci i i= − = − (3.2)
n F (1 ) n F exp expR T R Toi i α η α η⎧ − ⎫⎡ ⎤ ⎡ ⎤= − −⎨ ⎬⎢ ⎥ ⎢ ⎥⎣ ⎦ ⎣ ⎦⎩ ⎭
(3.3)
where,
i = net or measured current density
i0 = exchange current density
α = anodic transfer coefficient
η = overpotential η = E (applied potential) – Eeq (equilibrium potential)
n = number of electrons
F = Faraday’s constant (96500 C mol-1)
R = gas constant (8.314 J mol-1 K-1)
T = absolute temperature (K)

112
When the absolute value of measured current density is plotted against overpotential
(η) on a semi-logarithmic scale, the resulting plot is known as a Tafel plot. A Tafel plot
obtained for i0 = 10-5 A/cm2, n = 1, α = 0.5 and T = 298 oK is shown in Figure 3.4. If the
overpotential (η) is larger than ± 50 mV, a linear relationship known as Tafel relationship
is established between η and log (i), which is shown in equations (3.4) and (3.5) [3.15,
3.16].
)5.3()1(
303.2,log:
)4.3(303.2,log:
0 FnTRwhere
iiCathodic
FnTRwhere
iiAnodic
ccc
ao
aa
αββη
αββη
−=⎥
⎦
⎤⎢⎣
⎡−=
=⎥⎦
⎤⎢⎣
⎡=
The terms βa and βc are the anodic and cathodic Tafel slopes while ηa and ηc are anodic
and cathodic overpotentials. In Figure 3.4, anodic and cathodic portions of the Tafel
curve are symmetric because of transfer coefficient (α) = 0.5. If α deviates from 0.5, the
slope of the anodic and cathodic curves will change depending on equations (3.4) and
(3.5). Larger values of α will decrease the anodic slope and increase the cathodic slope.
In a typical corrosion system, conditions are far from ideal and the Tafel plot rarely
resembles Figure 3.4. This is because the anodic and cathodic reactions may not be the
same. For example, Figure 3.5 shows the corrosion behavior of zinc immersed in an acid
solution. The anodic and cathodic reactions for this system are shown in equations (3.6)
and (3.7) respectively.
Anodic: Zn → Zn2+ + 2e- (3.6)
Cathodic: 2H+ + 2e- → H2 (3.7)

113
Figure 3.4: Tafel plot for simple system shown Tafel relationships and Tafel slopes [3.17].

114
Figure 3.5: Tafel plot of mixed electrode system of hydrogen and zinc electrodes [3.17].

115
The anodic reaction is the dissolution or corrosion of zinc metal and the cathodic reaction
is the evolution of hydrogen. The potential at which the H+/H2 cathodic curve intersects
the Zn2+/Zn anodic curve is known as the corrosion potential (Ecorr). At the corrosion
potential, both the anodic and cathodic current densities are equal. The corresponding
current density at this potential is known as the corrosion current density (icorr). Figure 3.5
is also referred to as a mixed potential plot. The value of Ecorr can be directly measured
from the experiments, but the value of icorr is calculated from the Tafel slopes.
The Tafel relationship of equation (3.4) can be used to calculate the anodic and
cathodic current densities (ia & ic) generated due to perturbation as shown in following
equations.
( ) ( )2+ 2+
corra a a
corrZn /Zn Zn /Zn
log log loga a
o o
i i ii i i
η β β β⎡ ⎤ ⎡ ⎤ ⎡ ⎤⎢ ⎥ ⎢ ⎥Δ = − = ⎢ ⎥⎢ ⎥ ⎢ ⎥ ⎣ ⎦⎣ ⎦ ⎣ ⎦
(3.8)
acorr10ai i
ηβ
Δ
= and ccorr10ci i
ηβ
Δ−= (3.9)
The net current iapplied is then,
a c a capplied corr corr corr10 10 10 10a ci i i i i i
η η η ηβ β β β
Δ Δ Δ Δ− −⎛ ⎞= − = − = −⎜ ⎟
⎝ ⎠ (3.10)
Using the Maclaurin series, the iapplied of equation (3.10) can be approximated by equation
(3.12).
applied corr corra c a c
2.303 2.303 1 11 1 2.303i i iη η ηβ β β β
⎛ ⎞⎛ ⎞ ⎛ ⎞ ⎛ ⎞×Δ ×Δ= + − − = ×Δ +⎜ ⎟⎜ ⎟ ⎜ ⎟ ⎜ ⎟⎜ ⎟⎝ ⎠ ⎝ ⎠ ⎝ ⎠⎝ ⎠
(3.11)

116
1applied applied a c
corra c a c
1 12.303 2.303
i ii β β
η β β η β β
−⎛ ⎞ ⎛ ⎞
= + =⎜ ⎟ ⎜ ⎟×Δ ×Δ +⎝ ⎠ ⎝ ⎠ (3.12)
Equation (3.12) is known as the Stern-Geary equation. Small perturbation from equilibrium (± 10 mV) can be approximated by assuming the
current-potential relationship as a linear function. The inverse of the slope of the linear fit
is known as the polarization resistance (Rp). Substituting the term iapplied/∆η in equation
(3.12) by 1/Rp, the Stern-Geary equation becomes
a ccorr
P a c
12.303 R
i β ββ β
⎛ ⎞= ⎜ ⎟× +⎝ ⎠
(3.13)
Once the values of Rp, βa and βc are obtained from the polarization plot, the corrosion
current density (icorr) can be calculated using equation (3.13). The amount of material
removal can than be estimated from the corrosion current density using Faraday’s Law
given by equation (3.14).
)14.3(cm10
nmmin60
)(minnm, 7−×××=
⎟⎟⎟
⎠
⎞
⎜⎜⎜
⎝
⎛ sdensity
WeightMolecularFn
irateremovalFilm
M
corr
ρ
3.3.2. Anodic Polarization
In an ECMP process, the copper film is anodically biased while polishing. Thus, the
behavior of copper under anodic potential conditions is of more interest than at cathodic
potential. Planarity in ECMP process is achieved by passivation of the copper film in the

117
recessed areas, while higher areas are being polished. Passivation is characterized by a
sudden decrease in current at a particular potential (also known as the passivation
potential), during anodic perturbation of potential of the working electrode. Formation of
an oxide layer or adsorption of species on the copper surface exposed to solution leads to
a decrease in current. Anodic polarization was used to study the passiviation behavior of
copper in various chemistries. The chemical constituents of the tested chemistries include
complexing agents (oxalic acid) and inhibitors (BTA and TSA). A three-electrode setup
was used. The working electrode (copper film) was polarized to anodic overpotentials up
to 1.2 V with respect to OCP or Ecorr. The potential was scanned at a rate of 0.1 mV/s or
0.5 mV/s.
3.3.3. Potentiostatic Experiments
A major part of the study reported here was done under potentiostatic conditions.
Potentiostatic experiments were carried out by holding the working electrode at different
anodic potentials and monitoring the current response with time. Abrasion experiments
were carried out by holding copper samples exposed to oxalic acid solution containing
inhibitors at different anodic overpotentials (300 mV, 500 mV and 750 mV) to simulate
ECMP conditions. The current response was used to estimate the electrochemical
removal rate using equation (3.14). Static etching (no abrasion) experiments were carried
out in a similar fashion.

118
3.3.4. Galvanostatic Experiments
In the galvanostatic mode, a fixed current is forced through the working electrode and
counter electrode and the potential difference between the working and reference
electrode is monitored with time. Constant currents (2 mA, 9 mA and 12 mA) were
applied to copper samples during polishing. The physical removal rate was then
compared to the electrochemical removal rate calculated from the applied current using
equation (3.14).

119
3.4. Cyclic Voltammetry
Voltammetry is a potential sweep technique that measures the current with applied
potential. This technique is similar to potentiodynamic techniques, except that the overall
kinetic processes involve charge transfer reactions as well as the mass transport of these
electroactive species [3.17].
In cyclic voltammtery, the potential of an electrode in solution is linearly cycled at a
fixed scan rate (v), from a starting potential (V1) to the final potential (V2) and back to the
starting potential (V1) as shown in Figure 3.6. In essence, as the potential of the working
electrode is made to move in the anodic direction, there arises a potential at which the
current starts to increase, passes through a maximum (the peak), and decreases. As the
potential is ramped back from the anodic side towards the cathodic, the sign of the
current tends to become reversed (i.e. negative) and the cathodic to anodic sweep is
replicated [3.18]. A typical cyclic voltammogram recorded for a reversible single electron
transfer reaction is shown in Figure 3.7. In the figure, aPE and c
PE are the anodic and
cathodic peak potentials and aPi and c
Pi are the anodic and cathodic peak currents
respectively.
The principal characteristic of the potential sweep is the peak. The processes
corresponding to each peak are specific to the reaction encountered. They can be
explained in terms of the effect of potential on the electron transfer (Faradaic) current, iF,
and of time on the value of limiting current iL. The total current (i) is given by,
LF
LF
iiii
i+
= (3.15)

120
Figure 3.6: Schematic of potential sweep during cyclic voltammtery.
Figure 3.7: Cyclic voltammogram for a reversible single electron transfer reaction.
121
The voltammogram recorded for a reversible electrochemical reaction has certain well-
defined characteristics.
i) The voltage separation between the current peaks is given by
)(59 mVn
EEE cP
aP =−=Δ (3.16)
where n is number of electrons involved in the reaction.
ii) The position of the peak potential does not alter as a function of scan rate.
iii) The ratio of peak currents is equal to one.
1=cp
aP
ii
(3.17)
iv) The peak currents are proportional to square root of the scan rate.
viandi cP
aP ∝ (3.18)
The influence of the potential scan rate on the current for a reversible electron transfer
can be seen in Figure 3.8. Each curve has the same form but it is apparent that the total
current increases with increasing scan rate. This can be rationalized by considering the
size of the diffusion layer and the time taken to record the scan. In a slow potential scan,
the diffusion layer will grow much further in comparison to a fast scan. Consequently, the
flux to the electrode surface is considerably smaller at slow scan rates than it is at faster
rates. As the current is proportional to the flux towards the electrode, the magnitude of
the current will be lower at slow scan rates and higher at high rates. It can be noted that
even though the current increases with scan rate, the peak occurs at the same potential.

122
The voltammogram for reaction where the electron transfer is not reversible shows
considerably different behavior. Such a voltammogram is displayed in Figure 3.9. The
first curve shows the case where both the oxidation and reduction rate constants are still
fast; however, as the rate constants are lowered the curves shift to more reductive
potentials. In these cases, the peak separation is no longer fixed as given by equation
(3.16), but varies as a function of the scan rate. Similarly, the peak current no longer
varies as a function of the square root of the scan rate.
Cyclic voltammtery experiments were carried out to characterize the oxidation
potential of thiosalicylic acid (TSA). A three-electrode setup was used. Platinum plates
were used as working and counter electrodes and a standard calomel (SCE, Hg/Hg2Cl2)
with a luggin capillary was used as reference electrode. Oxidation of oxalic acid and TSA
was studied by scanning the potential from OCP to 1.2 V with respect to OCP and then
reversing back to OCP. The scan rate varied from 5 mV/sec for TSA to 50 mV/sec for
oxalic acid. To prevent oxidation of TSA, the solution was initially purged with nitrogen
to remove dissolved oxygen and the experiment was carried out with a nitrogen blanket.
The sample and the solution were not disturbed (stirred or rotated) during the
experiments.

123
Figure 3.8: Influence of potential scan rate on voltammogram of a reversible reaction.
Figure 3.9: Cyclic voltammogram for an irreversible reaction.
Increasing scan rate

124
3.5. Quartz Crystal Microbalance (QCM)
A quartz crystal microbalance (QCM) was used to study kinetics of inhibitor
adsorption on the copper surface. It consists of a thin disk of AT-cut quartz crystal with
circular gold electrodes plated on both sides, as shown in Figure 3.10. Typically, one side
of the electrode is exposed to the chemistry of interest and the other side serves as
electrode contact. Any adsorption of species or removal of material on the sensing side of
the crystal causes a shift in the oscillation frequency. This change in crystal frequency
(∆f) can be related to mass change (∆m) on the piezoelectrically active area (A) using the
Sauerbrey equation given in equation (3.19) [3.19].
μρAnfmf
20 )(2Δ−
=Δ (3.19)
where, f0 is the fundamental frequency of the crystal, n is the order of harmonic, μ is the
shear modulus of quartz (2.947 x 10¹¹ g cm-1 s-2), ρ is the density of quartz.
All the QCM experiments were carried out using a MAXTEK Research QCM.
According to the manufacturer, the mass resolution for this RQCM is roughly 0.4 ng/cm2.
A 5 MHz quartz crystal with gold film was used. The exposed area of the front electrode
was 1.37 cm2. The QCM was interfaced with an EG&G PARC 273A potentiostat such
that electrochemical measurements could be made simultaneously. The experimental
setup is shown in Figure 3.11. Copper was electroplated on the gold surface of the quartz
crystal using a commercially available plating bath (Shipley ST2001) with special
additives. Plating was done under galvanostatic mode at a current density of 2 mA/cm2.
The electroplated copper on the crystal was made the working electrode, while platinum
125
plate was used as the counter electrode and standard calomel (SCE) was used as the
reference electrode. The freshly deposited copper film (~2 μm thickness) was rinsed
thoroughly in de-ionized water, dried using nitrogen and immediately used in
experiments. Copper was freshly deposited for each investigation, and all dissolution
experiments were performed in a beaker containing 150 ml of solution at room
temperature with constant stirring. After each dissolution experiment, the remaining
copper film was etched in a concentrated nitric acid (16M) solution. The crystal was then
reused for depositing a fresh copper film.
Adsorption of inhibitors on copper surface was studied by holding copper deposited
crystal at different anodic overpotentials and monitoring mass change with time. Cyclic
voltammetry of TSA on copper was carried out simultaneously while recording mass
change with QCM. For voltammetry experiments, the solution was not stirred and mass
change was recorded under nitrogen atmosphere. The other voltammetry parameters such
as scan rate, initial and final potentials were the same as discussed in Section 3.4.

126
Figure 3.10: Schematic of the front and rear side of the gold coated quartz crystals [3.19].

127
Figure 3.11: Schematic of the QCM interfaced with a potentiostat to study the mass change of the sample with simultaneous electrochemical measurements [3.19].

128
3.6. Chemical and Physical Analysis
3.6.1. Atomic Absorption Spectrophotometry (AAS)
The solutions used in ECMP experiments were collected for analysis of dissolved
copper. Atomic absorption spectrophotometry was used to measure the concentration of
copper in the solutions. The measurements were carried out using a Perkin-Elmer Model
2380 Atomic absorption spectrophotometer using a hollow cathode lamp with a
wavelength (λ) of 324.8 nm. Before analyzing the unknown samples, a linear calibration
curve was obtained by measuring the absorption of solutions with five known copper
concentrations (0.1, 0.5, 1.0, 3.0, and 5.0 ppm). These standards were prepared using a
1000 ppm AA copper standard solution purchased from Aldrich Chemicals. The linear
working range of copper was 0.1 to 5.0 ppm. All calibration curves established prior to
analysis had a coefficient of determination (R2) of 0.99.
The samples collected after ECMP experiments were acidified by adding 4 ml of 16
M concentrated nitric acid to adjust the solution pH to < 1. In case of samples that
contained abrasive particles, the particles were allowed to settle and then centrifuged at
5000 rpm for 2 hours. This led to complete removal of particles from the solutions.
Samples with copper concentration over 5.0 ppm limit were diluted with de-ionized water
and the absorption was then measured.

129
3.6.2. Surface Profile Measurements
After polishing, the removal rate of the copper film was measured using profilometry.
The surface profile was measured using Tencor Alpha Step 200 Long Scan Profiler. The
instrument used a tungsten carbide tip with a radius of 5.0 μm and a shank angle of 60o.
The minimum horizontal resolution of this profiler was 0.01 μm/point and vertical
resolution was 0.5 nm. A schematic diagram of a surface profiler is shown in Figure
3.12. In this technique, a sharp stylus is dragged across the surface features. Changes in
the surface feature cause the stylus to move in the vertical direction. A piezoelectric
material, attached to the stylus assembly, converts the vertical movement of the stylus to
electrical signals, which are then translated back into vertical distances as the output data.
In the case of blanket copper films, the abraded sample was initially coated with resist
leaving a small strip of copper film exposed as shown in Figure 3.13. The resist was
allowed to harden for a day. The exposed copper film was etched using dilute nitric acid
to expose the underlying silicon substrate. Resist film from other areas was removed
using acetone. The step height of the remaining copper film in the abraded area was
measured with respect to the silicon surface. The step height of un-abraded copper film
(blanket) was also measured in a similar fashion. The copper removal rate was calculated
by dividing the difference between these two step heights (SH) by the polishing time as
shown in equation (3.20).
TimePolishingSHSH
ARatemoval areaabradedfilmblanket −=min)/(Re (3.20)

130
In order to estimate the copper removal rate accurately, the step height was measured at
approximately ten points in the abraded area and approximately four points on the un-
abraded film.

131
Figure 3.12: Schematic diagram of a Alpha Step 200 surface profiler.

132
Figure 3.13: Preparation of abraded sample for step height measurement using profilometery.

133
3.6.3. Four Point Probe
The thickness of copper film after abrasion was also characterized using a four-point
probe technique. The four-point probe technique measures the sheet resistance of thin
films, which can be used to calculate film thickness. All measurements were carried out
using a Mitsubishi LORESTA AP Super-Intelligent Resistivity Meter model MCP T400,
with a probe spacing of 1.5 mm. The instrument can measure resistance in the range of
0.001 x 10⁻² Ω to 1.99 x 10⁷ Ω.
The four-point probe set up consists of four equally spaced tungsten metal tips having
a finite radius. As shown in Figure 3.14, these tips are brought in contact with the surface
of the sample to be measured. Each tip is supported by springs on the other end to
minimize sample damage during probing. A high impedance current source is used to
supply current through the outer two probes, while a voltmeter measures the voltage
across the inner two probes to determine the sample resistivity [3.20]. If probes with
uniform spacing s are placed on a film with thickness t, then the resistivity, ρ, is given by
)(2 stcmIVs >>−Ω= μπρ (3.21)
and
)(2ln
tscmIVt
>>−Ω⎟⎟⎠
⎞⎜⎜⎝
⎛= μπρ (3.22)
Equation (3.21) can be used to calculate the resistivity of a bulk material while equation
(3.22) can be applied to thin films. The sheet resistance of a thin film can be calculated
based on equation (3.23).
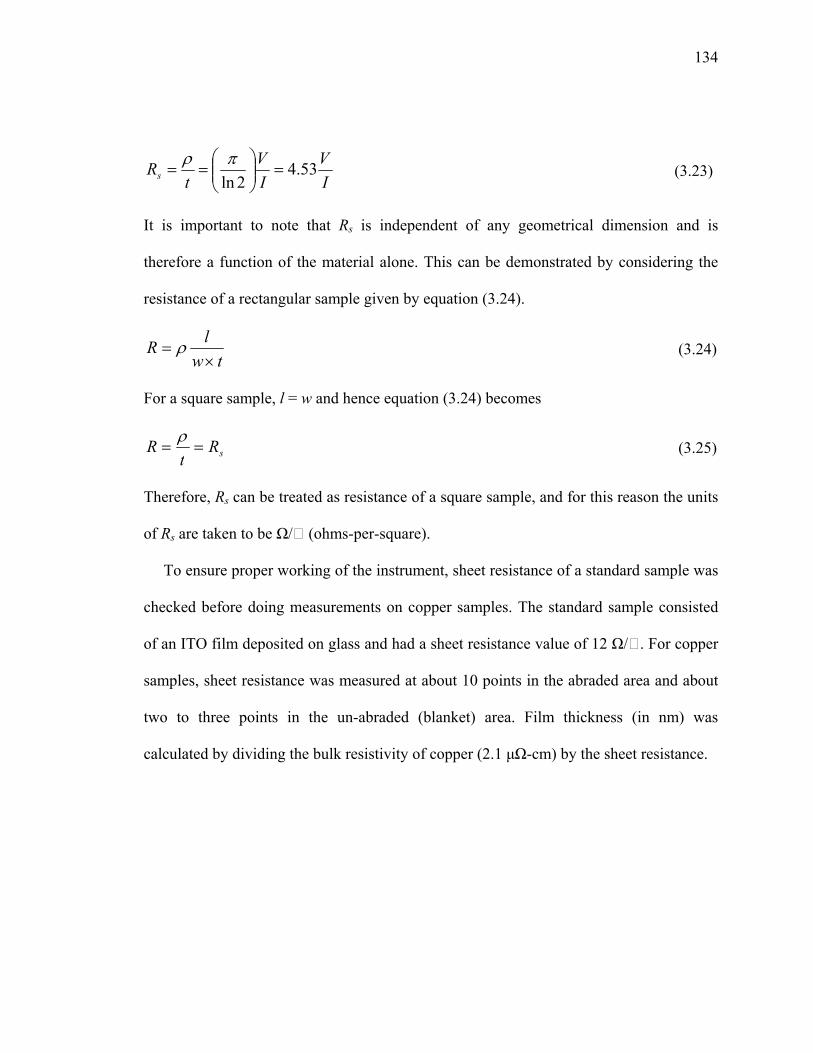
134
IV
IV
tRs 53.4
2ln=⎟⎟
⎠
⎞⎜⎜⎝
⎛==
πρ (3.23)
It is important to note that Rs is independent of any geometrical dimension and is
therefore a function of the material alone. This can be demonstrated by considering the
resistance of a rectangular sample given by equation (3.24).
twlR×
= ρ (3.24)
For a square sample, l = w and hence equation (3.24) becomes
sRt
R ==ρ
(3.25)
Therefore, Rs can be treated as resistance of a square sample, and for this reason the units
of Rs are taken to be Ω/ (ohms-per-square).
To ensure proper working of the instrument, sheet resistance of a standard sample was
checked before doing measurements on copper samples. The standard sample consisted
of an ITO film deposited on glass and had a sheet resistance value of 12 Ω/. For copper
samples, sheet resistance was measured at about 10 points in the abraded area and about
two to three points in the un-abraded (blanket) area. Film thickness (in nm) was
calculated by dividing the bulk resistivity of copper (2.1 μΩ-cm) by the sheet resistance.
135
Figure 3.14: Schematic representation of a four point probe technique.

136
3.6.4. X-ray Photoelectron Spectroscopy (XPS)
The interaction between the corrosion inhibitor and copper surface was characterized
using X-ray Photoelectron Spectroscopy (XPS). TSA films formed on the copper surface
were analyzed using KRATOS Axis 165 Ultra X-ray Photoelectron Spectrometer. XPS
analysis was carried out on two films: (1) film formed under OCP conditions, and (2)
film formed at the oxidation potential of TSA.
Initially, TSA was dissolved in ethanol solution and the solution was purged with
nitrogen for about 30 minutes to remove any dissolved oxygen. Copper films were then
immersed in the solution covered with nitrogen blanket. Samples were removed from the
solution just before XPS analysis, and were immediately transferred to a vacuum
chamber. This methodology prevented oxidation of TSA. To analyze oxidized TSA film,
the copper sample exposed to ethanol solution containing TSA was polarized at
overpotential of 800 mV for 5 minutes under a nitrogen atmosphere. After polarization,
the sample was immediately transferred to a nitrogen purged alcohol solution and was
removed just before the XPS analysis. The oxidation state of copper on the surface and
the presence of any organic were determined. The atomic ratio of the elements detected
was calculated from the analysis of XPS peak area.
3.6.5. pH Measurements
All pH measurements were obtained using the Orion Model 1230 meter. The electrode
was a glass sensing single junction combination pH probe with a built in Ag/AgCl

137
reference electrode. The meter and probe were purchased from Thermo Orion and were
calibrated using freshly prepared buffer solutions on a regular basis.

138
CHAPTER 4: RESULTS AND DISCUSSION
4.1. Potential-pH Diagrams
4.1.1. Copper–Oxalic Acid–Water System
The effect of oxalic acid on stability of copper was analyzed through construction of
Pourbaix diagram for Cu-Oxalic Acid-H2O system. Figure 4.1 shows the potential-pH
plot for an aqueous system with a dissolved copper concentration of 10-6 M. The plot was
constructed for two oxalic acid concentrations, viz. 0.1 M and 0.3 M. The presence of
oxalate ions reduces the stability region of the copper oxides. It may be seen that only
Cu2+ forms complexes with oxalic acid. For oxalic acid concentration of 0.1 M, the
doubly charged anionic complex [Cu(C2O4)22-] occupies the major portion of the stability
region (pH 1-11), while the neutral complex [Cu(C2O4)] is predominant at an acidic pH
values of less than 1. At alkaline pH values, the formation of cupric oxide and its
dissolution in the form of anionic hydroxide species is thermodynamically favorable.
Increasing oxalic acid concentration to 0.3 M results in increased stability of anionic
copper oxalate complex, and decreased stability of the neutral complex.
In ECMP, copper is anodically biased during polishing. It is therefore important to
understand the stability of copper at anodic overpotential conditions. The stars indicate
the overpotential (η) values for copper exposed to 0.1 M oxalic acid solution at pH 4. It
is interesting to note that the star corresponding to open circuit potential (30 mV vs. SHE,
η = 0) falls very close to the copper stability region. This indicates that dissolution of
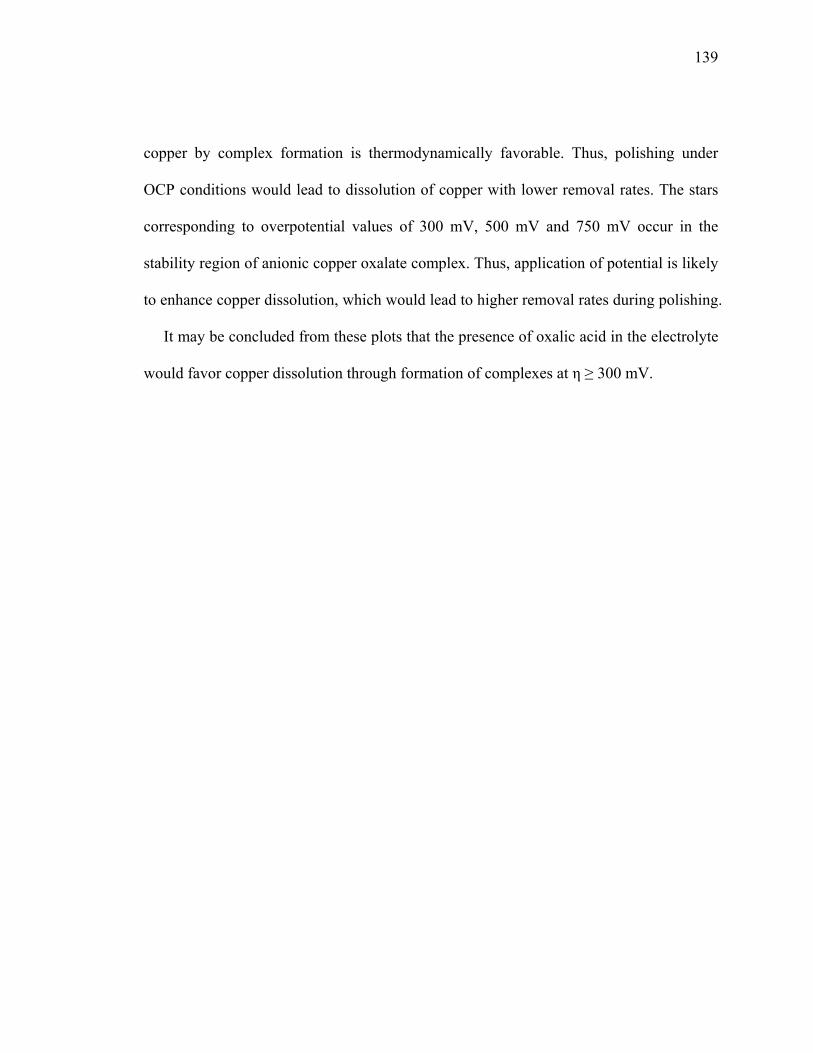
139
copper by complex formation is thermodynamically favorable. Thus, polishing under
OCP conditions would lead to dissolution of copper with lower removal rates. The stars
corresponding to overpotential values of 300 mV, 500 mV and 750 mV occur in the
stability region of anionic copper oxalate complex. Thus, application of potential is likely
to enhance copper dissolution, which would lead to higher removal rates during polishing.
It may be concluded from these plots that the presence of oxalic acid in the electrolyte
would favor copper dissolution through formation of complexes at η ≥ 300 mV.

140
Figure 4.1: Potential-pH diagram for copper-oxalic acid-water system for dissolved copper activity of 10-6 M. Note: indicate different overpotential values (0, 300 mV, 500 mV and 750 mV) for copper exposed to 0.1 M oxalic acid at pH 4.
0 2 4 6 8 10 12 14-2.0
-1.5
-1.0
-0.5
0.0
0.5
1.0
1.5
2.0
Cu(
OH
) 42-C
u(O
H) 3-
CuO
Cu2O
Cu(C2O4)22-
Cu(
C2O
4) (a)
Cu
E vs
. SH
E (V
)
pH
Cu = 10-6 M, Oxalic Acid = 0.3 M Cu = 10-6 M, Oxalic Acid = 0.1 M

141
4.1.2. Copper–Oxalic Acid–BTA–Water System
As discussed in the last section, under anodic overpotential conditions, copper
exposed to oxalic acid solution would dissolve rapidly by complex formation. However,
this would also lead to high static dissolution (etch) rate of copper in low-lying areas,
which is not acceptable. It may be recalled that planarity in ECMP can only be achieved
by reducing copper dissolution in low-lying areas. One way to reduce copper dissolution
is to add an inhibitor that forms a passive film on the copper surface. This passive film
would protect copper in the low-lying areas while the film formed on higher areas would
be removed by pad contact.
Corrosion inhibitors are often added for controlling the static etch rate. One of the
most common corrosion inhibitors for copper is benzotriazole (BTA). The effectiveness
of BTA in inhibiting copper dissolution in oxalic acid solution was analyzed by
construction of a Pourbaix diagram for copper-oxalic acid-BTA-H2O system. Figure
4.2(a) shows the potential-pH plot for two oxalic acid concentrations of 0.1 M and 0.3 M,
at a fixed dissolved copper concentration of 10-6 M and BTA concentration to 0.005 M. It
may be seen that the resulting plots for both the oxalic acid concentrations are very
similar to that in Figure 4.1. The stability regions of anionic and neutral oxalate complex
remain the same. There is no change in the width of these regions. However, a small
region corresponding to formation of solid copper-BTA complex [Cu(C6H4N3)] is seen
between pH 7 and 12. The solid complex can form a passive film on the copper surface
and inhibit dissolution. It is important to note that this complex is stable only in the
potential range of -240 mV to 25 mV vs. SHE. Thus, under oxidizing conditions (E > 25

142
mV), the copper-BTA complex is likely to dissolve to form anionic copper oxalate
complex. The effect of oxalic acid concentration on the stability region of various species
is very small.
The stability of copper-BTA complex at anodic overpotentials can be evaluated by
overlaying the overpotential values on the potential-pH plot. The open circuit potential of
copper exposed to 0.1 M oxalic acid solution containing 0.005 M BTA is 210 mV vs.
SHE. It is interesting to note that at pH 4, all the overpotential values fall in the stability
region of anionic oxalate complex. This indicates that dissolution of copper by complex
formation is likely to occur. It is also clear from the figure that at pH 4, under anodic
overpotential conditions, BTA is not likely to be effective in inhibiting copper dissolution.
The effect of increasing the BTA concentration to 0.01 M is displayed in Figure 4.2(b).
Again, the similarity between this plot and Figure 4.2(a) can be easily noticed as far as
copper-oxalic acid complexes are concerned. There is no change in the stability region of
aqueous oxalate complexes. However, an increase in stability of copper-BTA complex is
observed. The stability region of copper-BTA complex occurs in the pH range 6 to 12.5
for 0.01 M BTA, while for 0.005 M BTA, the complex is dominant in the pH range 7 to
12. It is also clear that under an anodic overpotential condition, an increase in BTA
concentration is not likely to be effective in inhibiting copper dissolution.
It can be concluded from these plots that even in presence of BTA, copper dissolution
in oxalic acid solution is likely to occur at all overpotentials.

143
(a)
(b) Figure 4.2: Potential-pH diagram for copper-oxalic acid-BTA-water system: (a) BTA concentration of 0.005 M, and (b) 0.01 M BTA. Note: indicate different overpotential values (0, 300 mV, 500 mV and 750 mV) for copper exposed to 0.1 M oxalic acid at pH 4.
0 2 4 6 8 10 12 14-2.0
-1.5
-1.0
-0.5
0.0
0.5
1.0
1.5
2.0
Cu2O
Cu(
OH
) 42-C
u(O
H) 3-
CuOCu(C2O4)2
2-
Cu(
C2O
4) (a)
Cu
E vs
. SH
E (V
)
pH
Cu = 10-6 M, BTA = 0.005 M, Oxalic Acid = 0.3 M Cu = 10-6 M, BTA = 0.005 M, Oxalic Acid = 0.1 M
Cu(C6H4N3) (s)
0 2 4 6 8 10 12 14-2.0
-1.5
-1.0
-0.5
0.0
0.5
1.0
1.5
2.0
Cu(C6H4N3) (s)Cu2O
Cu(
OH
) 42-C
u(O
H) 3-
CuO
Cu(
C2O
4) (a)
Cu(C2O4)22-
Cu
E vs
. SH
E (V
)
pH
Cu = 10-6 M, BTA = 0.01 M, Oxalic Acid = 0.3 M Cu = 10-6 M, BTA = 0.01 M, Oxalic Acid = 0.1 M

144
4.1.3. Copper–Oxalic Acid–TSA–Water System
The effectiveness of TSA in inhibiting copper dissolution was analyzed by
construction of a Pourbaix diagram for a copper-oxalic acid-TSA-H2O system. It must be
noted that if oxalic acid and TSA species are considered together in a single calculation,
the resulting diagram does not show the copper-TSA complex region. The stability region
of anionic copper oxalate complex shields the copper-TSA stability region. Thus, two
separate diagrams were constructed. The first diagram was of a copper-oxalic acid-H2O
system for which copper concentration was fixed at 10-6 M and that of oxalic acid at 0.1
M, and the second diagram constructed was of a copper-TSA-H2O system with copper
concentration fixed at 10-3 M and TSA at 0.01 M. Both the diagrams were overlaid and
the resulting diagram is displayed in Figure 4.3.
Since the potential-pH plot for copper-oxalic acid-H2O system is similar to that
shown in Figure 4.1(b), it is not discussed here. The plot for the copper-TSA-H2O system
shows some interesting features. It may be seen that copper forms a neutral complex with
TSA in the pH range of 3.6 to 6.5. The formation of the neutral complex, if solid in
nature, on the copper surface would inhibit copper dissolution. In addition, copper would
actively dissolve as Cu2+ ions below pH 3.6. Above pH of 6.5, formation of both cupric
and cuprous oxides is thermodynamically favorable in the absence of oxalic acid. It is
clear from Figure 4.3 that when both diagrams are overlapped, the stability region of the
copper-TSA overlaps the anionic oxalate complex region. Thus, when TSA is added to
oxalic acid solution with pH between 3.6 and 6.5, depending on reaction kinetics, the
formation of copper-TSA complex is most likely favorable. The resulting copper-TSA

145
passive film would inhibit formation of a copper oxalate complex, which in turn is likely
to reduce copper dissolution. It is also evident that the copper-TSA complex is stable
under highly oxidizing conditions. The open circuit potential of copper exposed to
solution containing 0.1 M oxalic acid and 0.01 M TSA is -12 mV vs. SHE. It may also be
noted that the overpotential values of 500 mV and 750 mV fall in the neutral complex
region. This indicates that polishing at high anodic overpotential conditions is feasible
with the passive TSA film protecting the recessed areas.
Therefore, it can be concluded from this plot that unlike BTA, oxalic acid along with
TSA as inhibitior is an effective chemistry for ECMP of copper.
146
Figure 4.3: Potential-pH diagram of copper-TSA-water system overlapped on copper-oxalic acid-water system. Note: indicate different overpotential values (0, 300 mV, 500 mV and 750 mV) for copper exposed to 0.1 M oxalic acid at pH 4.
0 2 4 6 8 10 12 14-2.0
-1.5
-1.0
-0.5
0.0
0.5
1.0
1.5
2.0
Cu(
OH
) 42-C
u(O
H) 3-Cu(C2O4)2
2-
Cu(
C2O
4) (a)
Cu
Cu2O
Cu2+
Cu(C7H4O2S) CuO
CuO
Cu2O
Cu
E
vs. S
HE
(V)
pH
Cu = 10-3 M, TSA = 0.01 M Cu = 10-6 M, Oxalic Acid = 0.1 M

147
4.2. Anodic Dissolution of Copper in Oxalic Acid Solutions
4.2.1. Etch Rate of Copper in Oxalic Acid Solution at Different Applied Potentials Preliminary investigations were carried out to characterize the static etch rate of
copper in oxalic acid solutions to evaluate suitability as an electrolyte for ECMP. Copper
samples were exposed to oxalic acid solutions at different anodic overpotentials and
current-time profiles were recorded. Experiments were carried out in EC-AC tool
(without abrasion) at three different overpotentials of 300 mV, 500 mV, and 750 mV and
in four different oxalic acid concentrations, namely 0.01 M, 0.1 M, 0.3 M, and 0.5 M.
All the solutions were maintained at pH 4. Static etch rates obtained by solution analysis
using atomic absorption spectrophotometry (AAS) are displayed in Figure 4.4. Estimated
rates obtained using current-time profiles are shown in Figure 4.5. The dissolution
(etching) time was varied depending on the measured current value.
It may be seen from Figure 4.4 that, except for 0.01 M oxalic acid, the static etch rate
increases significantly with both oxalic acid concentration and overpotential. In 0.01 M
oxalic acid solution, there is no significant effect of overpotential on the etch rate. For
example, the rate increases from 12 nm/min at overpotential of 300 mV to 19 nm/min for
overpotential of 750 mV. However, at overpotential of 750 mV, a ten-fold increase in
oxalic acid concentration (0.01 M to 0.1 M) increases the static rate by eight fold
(19 nm/min to 164 nm/min). In addition, the rate in 0.5 M oxalic acid solution seems to
be more than twice of that in 0.3 M oxalic acid solution. The highest static rate of 657
nm/min was observed in 0.5 M oxalic acid solution at overpotential of 750 mV.
148
The measured current density values are tabulated in Table 4.1. Using the current
density values, the electrochemical rates were estimated based on a two-electron transfer.
It may be seen that the electrochemical rates also show a similar behavior with oxalic
acid concentration and overpotential. However, except for concentrations ≥ 0.3 M, the
electrochemical rates are slightly lower (~10-20 nm/min) than the actual dissolution rates.
At concentrations ≥ 0.3 M, the electrochemical rates seem to be slightly higher than the
actual dissolution rates. This may be due to some side reactions occurring at higher oxalic
acid concentrations, which can contribute to an increase in measured current. A
comparison of actual and electrochemical rates is shown in Table 4.2. If the
electrochemical rates were estimated based on a one-electron transfer, the calculated
values were almost twice of the actual rates measured by AAS.
It can be concluded from these experiments that oxalic acid chemistry is a good
chemistry for ECMP applications.

149
Figure 4.4: Static etch rate of copper in oxalic acid solution as a function of concentration and overpotential. Table 4.1: Measured current densities as a function of oxalic acid concentration and overpotential.
Measured current density (mA/cm2) Concentration of
oxalic acid (M) η = 300 mV η = 500 mV η = 750 mV
0.01 0.36 0.62 1.06
0.1 1.67 4.0 5.6
0.3 3.46 6.8 15.5
0.5 5.52 12.5 24.0
0.01 0.1 0.3 0.50
100
200
300
400
500
600
700
800
Stat
ic E
tch
Rat
e (n
m/m
in)
Concentration of Oxalic Acid (M)
η = 300 mV η = 500 mV η = 750 mV

150
Figure 4.5: Estimated static rate of copper in oxalic acid solution as a function of concentration and overpotential (calculated from current density values).
Table 4.2: Comparison of actual and estimated dissolution rate of copper
Static etch rate of copper (nm/min)
η = 300 mV η = 500 mV η = 750 mV
Concentration
of oxalic acid
(M) Actual Estimated Actual Estimated Actual Estimated
0.01 12 8 18 13.5 19.5 23.6
0.1 47 37.2 110 88.4 164 124
0.3 68.3 77 186.6 195.4 290 345
0.5 114.2 122.5 236.5 277 657.6 530
0.01 0.1 0.3 0.50
100
200
300
400
500
600
Estim
ated
Sta
tic R
ate
(nm
/min
)
Concentration of Oxalic Acid (M)
η = 300 mV η = 500 mV η = 750 mV

151
4.2.2. Identification of Inhibitors The effectiveness of benzotriazole (BTA) and thiosalicylic acid (TSA) was initially
tested in 0.1 M oxalic acid solutions adjusted to a pH of 4. Figure 4.6 shows the Tafel
polarization curves for copper exposed to oxalic acid solutions containing BTA and TSA.
The polarization experiments were carried out in the absence of particles using the EC-
AC tool (without abrasion). For comparison purposes, the polarization curve of copper
exposed to 0.1 M oxalic acid solution in the absence of any additives is also shown. It
may be seen that in the absence of any additives, at potential of 500 mV with respect to
OCP, the measured current density is ~ 7800 μA/cm2. The measured open circuit
potential (OCP) is 30 mV vs. SHE. From the polarization curves, it is evident that for
potentials below 610 mV (η = 400 mV), the presence of BTA decreases the anodic
current density of copper. The presence of 0.001 M BTA in solution also increases the
OCP of copper to 210 mV vs. SHE. At 400 mV overpotential, a sharp increase in current
density from 60 μA/cm2 to 2000 μA/cm2 is observed. Above 400 mV overpotential, the
anodic curve becomes similar to that obtained without additives. A highest current
density value of 8000 μA/cm2 was recorded at 750 mV overpotential. Thus, it can be
concluded that effectiveness of BTA as a corrosion inhibitor for copper in 0.1 M oxalic
acid solution is limited to overpotential values below 400 mV.
It is clear from the polarization curve for thiosalicylic acid (TSA) that copper
passivates in presence of TSA. Initially, the current increases with potential, until a
potential of ~ 360 mV (η = 370 mV) is reached, after which the current starts to decrease.
An almost two-decades of decrease (as compared to oxalic acid without additives) in

152
anodic current density of copper occurs upon addition of TSA, at a potential of 360 mV
vs. SHE. There is a striking difference in the anodic polarization curves for copper in
solutions containing BTA and TSA. It may be noted that unlike in the case of BTA, the
current stays at a lower value with further increase in potential. Below 370 mV
overpotential, the polarization curve closely follows the curve obtained for 0.1 M oxalic
in absence of additives. In addition, the presence of TSA also decreases the OCP of
copper from 30 mV vs. SHE (without TSA) to -10 mV vs. SHE (with 0.01 M TSA). Thus,
it can be inferred from these results that TSA, by forming a passive film on the copper
surface, can reduce static copper dissolution at higher overpotential conditions.
Table 4.3 lists the open circuit potentials and Tafel slopes (anodic slope: βa and
cathodic slope: βc) of copper in 0.1 M oxalic acid solution at pH 4, in the presence and
absence of BTA and TSA.
Table 4.3: Open circuit potentials and Tafel parameters of copper in 0.1 M oxalic acid solution (pH 4) in the presence and absence of additives.
Chemistry OCP vs. SHE (V) βa (V) βc (V)
No additive 0.030 0.078 -0.201
0.001 M BTA 0.210 0.261 -0.230
0.01 M TSA -0.010 0.136 -0.198

153
Figure 4.6: Tafel polarization of copper in 0.1 M oxalic acid solution (pH 4) in presence and absence of BTA and TSA.
1E-9 1E-8 1E-7 1E-6 1E-5 1E-4 1E-3 0.01 0.1-0.9
-0.6
-0.3
0.0
0.3
0.6
0.9
1.2
0.1 M Oxalic + 0.01 M TSA
0.1 M Oxalic + 0.001 M BTA
E vs
. SH
E (V
)
log i (A/cm2)
0.1 M Oxalic
Passivation

154
4.3. ECMP of Copper in the Presence of Abrasive Particles
4.3.1. Removal Rates of Copper during Abrasion in Oxalic Acid Solution – Need for
Inhibitors
All the experiments in the presence of particles (SiO2, 1% by weight), unless
otherwise stated, were carried out in 0.1 M oxalic acid solution (pH 4). The size of silica
particles used in this study was 80 nm.
Removal rates of copper under abrasion condition were obtained using EC-AC tool.
Experiments were carried out in two oxalic acid solutions viz. 0.01 M and 0.1 M, by
holding copper at a potential of 500 mV with respect to OCP. Both the solutions were
maintained at pH 4, and the applied pressure was held constant at 2 psi. The removal
rates measured by profilometry are shown in Figure 4.7. In 0.01M oxalic acid solution
both the static etch rate and polishing rate were low (18 nm/min and 26 nm/min
respectively). In 0.1M oxalic acid solution, the removal rate during polishing increased to
117 nm/min, but the static removal rate was also very high, of the order of 110 nm/min.
Polishing of copper surfaces with topography, using 0.1 M oxalic acid solution, would
result in static etching of the recessed areas at a rate of 110 nm/min, while the high areas
are polished at 117 nm/min. Thus in oxalic acid chemistry, the low-lying areas may be
expected to be removed at the same rate as high areas. This clearly shows that inhibitors
are required to reduce the static etch rate.

155
Figure 4.7: Effect of oxalic acid concentration on removal rate of copper at potential of 500 mV with respect to OCP.
0.01 0.10
20
40
60
80
100
120
140
Rem
oval
Rat
e (n
m/m
in)
Concentration of Oxalic Acid (M)
Static Polishing
Load = 2 psi, pH = 4

156
4.3.2. Removal Rates of Copper during Abrasion in Oxalic Acid Solution
– Effect of BTA as Inhibitor
Experiments were carried out to investigate the effect of addition of BTA on the
removal rate of copper in oxalic acid solution. Typically, the concentration of BTA in
conventional CMP slurry is in the neighborhood of 100 ppm (0.001 M). Therefore,
0.001M BTA was used in abrasion experiments.
Copper samples exposed to 0.1 M oxalic solution containing 0.001 M BTA at pH 4
were polished at two overpotential values viz. 300 mV and 500 mV. The pressure was
held constant at 2 psi. The removal rates were characterized using profilometry. Figure
4.8 (a) shows the static and polishing removal rate of copper as a function of applied
overpotential values. At the lower overpotential of 300mV, the static removal rate is 2
nm/min and the removal rate during polishing is ~ 10 nm/min. With an increase in
overpotential to 500mV, the polishing rate increases to 110 nm/min, but the static
removal rate also increases to 12 nm/min. This increase in static etch rate implies that the
effectiveness of BTA decreases significantly at higher anodic potentials required for
higher removal rates.
Figure 4.8 (b) shows current vs. time profiles for copper subjected to alternate
abrasion and no-abrasion condition in oxalic acid solutions containing BTA at different
overpotentials. Under no abrasion condition, the current density is very low, of the order
of 1μA/cm2 for 300 and 500mV overpotential. It is important to note that a current
density of 1μA/cm2 is equivalent to copper removal rate of 0.2 Å/min (assuming two-
electron transfer). Under abrasion conditions, the current density at an overpotential of

157
300 mV increases to approximately 750 μA/cm2. For 500mV overpotential, the current
density is much higher, of the order of 1500 μA/cm2. A sharp increase in current density
is observed on pad contact, which can be attributed to removal of the protective film.
Once the load is removed, the current density drops rapidly to the initial level, which
indicates the formation of passive film on the copper surface.

158
(a) (b) Figure 4.8: (a) Removal rates (b) current vs. time profile of copper exposed to 0.1 M oxalic acid solution containing 0.001 M BTA and 1% SiO2 as a function of overpotential. [Note: 1μA/cm2 ≈ 0.2 Å/min of copper]
0 100 200 300 400 500 600 7000
500
1000
1500
2000
η = 300 mV
Abrasion No abrasionNo abrasion
I (μ
A/c
m2 )
Time (sec)
η = 500 mV
300 5000
20
40
60
80
100
120
Load = 2 psi, pH = 4
Rem
oval
Rat
e (n
m/m
in)
Overpotential (mV)
Static Polishing
159
4.3.3. Removal Rates of Copper during Abrasion in Oxalic Acid Solution
– Effect of TSA as Inhibitor
At this point, it is clear that the commonly used inhibitor BTA is not effective at
higher overpotentials greater than ~ 400 mV. However, higher overpotentials are required
in ECMP to achieve higher removal rates. An inhibitor, which can reduce static rate of
copper at higher overpotentials, is ideal for ECMP. Thus, investigations were carried out
to study the effectiveness of thiosalicylic acid (TSA) as corrosion inhibitor for copper in
0.1 M oxalic acid. Thiosalicylic acid is a derivate of salicylic acid and has been reported
to complex copper [4.1].
Polishing of copper samples exposed to 0.1 M oxalic solution containing 0.01 M TSA
at pH 4, was carried out as a function of overpotential. At 300 mV overpotential, the
removal rate of copper during polishing is ~ 17 nm/min while the static etch rate is ~ 2
nm/min. With an increase in overpotential to 750 mV, the polishing rate increased to 82
nm/min as shown in Figure 4.9 (a). Interestingly, unlike the case for BTA, no static
removal was seen in the presence of TSA at higher overpotentials. Polishing of copper
surfaces with topography would result in high areas being removed by polishing while
the low-lying areas are completely protected, but the removal rates are low. The
electrochemical rates seem to agree very well at overpotential of 300 mV, and are lower
than profilometric values at overpotential of 750 mV.
Figure 4.9 (b) shows current vs. time profiles for copper subjected to alternate
abrasion and no-abrasion condition in oxalic acid solution containing TSA at different
overpotentials. Under no abrasion condition, the current density is 100 μA/cm2 for

160
applied anodic overpotentials. This is one hundred times larger than the current measured
in the BTA system, yet profilometry did not reveal any copper removal. This is because a
substantial part of the measured current is due to the oxidation of TSA (refer to Section
4.6) and not due to dissolution of copper. Under abrasion conditions, the current density
at 300mV overpotential is approximately 670 μA/cm2. For higher overpotentials of 500
and 750mV, the current density is much higher, of the order of 1500 and 2500 μA/cm2.
This increase in current density with overpotential is attributed to higher copper removal
due to removal of passive TSA film during abrasion.
It can be concluded from the abrasion experiments that TSA is an effective corrosion
inhibitor for copper and ideal for ECMP applications.

161
(a)
(b) Figure 4.9: (a) Removal rate (b) Current vs. time profile of copper exposed to 0.1 M oxalic acid solution containing 0.01 M TSA and 1% SiO2 as a function of overpotential. [Note: 1μA/cm2 ≈ 0.2 Å/min of copper]
0 100 200 300 400 500 6000
500
1000
1500
2000
2500
3000
No abrasion
No abrasion
Abrasion
η = 750 mV
η = 500 mV
I (μA
/cm
2 )
Time (sec)
η = 300 mV
300 500 7500
10
20
30
40
50
60
70
80
90
100
Rem
oval
Rat
e (n
m/m
in)
Overpotential (mV)
Static Polishing Polishing (EC)
162
4.3.3.1. Removal Rates of Copper in Oxalic Acid Solution Containing TSA – Effect of
Particle Concentration
Experiments were also carried out to characterize the effect of particle concentration
on the removal rate of copper in oxalic acid solution. Abrasion experiments at pH 4 were
carried out by varying the concentration of silica particles from 0% (no particles) to 4%.
The concentration of oxalic acid (0.1 M) and TSA (0.01 M) and the overpotential
(750 mV) were held constant. The removal rates obtained by profilometry are shown in
Figure 4.10. In absence of silica particles, the copper removal rate is ~ 20 nm/min. The
addition of 0.5 % SiO2 increases the removal rate to 45 nm/min. The copper removal rate
increases to 82 nm/min with an increase in particle concentration to 1%. A further
increase in silica concentration (4%), does not significantly increase the removal rate.
These results show that there is a significant effect of particle concentration (up to
1%) on the copper removal rate in 0.1 M oxalic acid solution at pH 4, but the removal
rates are low. It should be noted that the relative velocities achieved in the laboratory EC-
AC tool is very low compared to the commercial tools, and hence a polish rate of 82
nm/min in an EC-AC tool could scale up to 300 nm/min in a commercial ECMP tool.

163
Figure 4.10: Effect of silica concentration on removal rate of copper at 750 mV overpotential.
0 0.5 1 40
10
20
30
40
50
60
70
80
90
100
R
emov
al R
ate
(nm
/min
)
Concentration of SiO2 particles (%)
Polishing

164
4.3.3.2. Removal Rates of Copper in Oxalic Acid Solution Containing TSA – Effect of
solution pH
All the experiments discussed so far were carried out at a solution pH of 4. It may be
recalled that at overpotential of 750 mV, the highest removal rate of copper achieved at
pH 4 was 82 nm/min. This removal rate value is quite low when compared to a typical
ECMP removal rate of 600 nm/min. Thus, experiments were carried out to characterize
the removal rate of copper in oxalic acid solution as a function of solution pH. The pH of
the solution was varied from 3 to 6, while the concentration of oxalic acid, TSA and SiO2
particles was fixed at 0.1 M, 0.01 M, and 1% respectively. All the experiments were
carried out at overpotential of 750 mV and a pressure of 2 psi.
Figure 4.11 shows the removal rate of copper as a function of solution pH. It may be
seen that at pH 3, the removal rate of copper during polishing is low at 55 nm/min along
with a small static rate of 1.4 nm/min. At pH 4, as already discussed, the polishing
removal rate is 82 nm/min with no static rate observed by profilometry. With an increase
in solution pH to 5, the removal rate during polishing increases to 103 nm/min. A further
increase in pH to 6 increases the removal rate to 126.5 nm/min, but the static etch rate
also increases to 20 nm/min. This indicates that TSA seem to become less effective in
inhibiting copper dissolution at this pH value.
Even though the highest polishing rate is recorded at pH 6, it is not optimal for ECMP,
due to the high static rate. The high static rate observed at pH 6 deserves an explanation.
A close observation of the Pourbaix diagram (Figure 4.3) reveals that pH 6 is close to the
line that separates the region of Cu-TSA complex from that of anionic copper-oxalate

165
complex. Thus, it is very likely that at this pH, the formation of copper-oxalate complex
may be taking place, which in turn would reduce the effectiveness of TSA. As this
doubly charged anionic complex is an aqueous complex, it would lead to the dissolution
of copper and an increase in static etch rate. The electrochemical rates based on two-
electron transfer are also shown in Figure 4.13. As seen earlier, the estimated removal
rates are lower than the actual removal rates. The discrepancy between the actual rates
and electrochemical rates suggests that the removal mechanism is not truly
electrochemical. Perhaps, some portion of the actual removal rate is due to applied load.
It can be concluded from these results that, as there is no static rate observed at pH 4,
pH 4 seems to be best for ECMP of copper in 0.1 M oxalic acid containing TSA.

166
Figure 4.11: Removal rate of copper in 0.1M oxalic acid containing 0.01 M TSA as a function of solution pH at overpotential of 750 mV.
3 4 5 60
20
40
60
80
100
120
140
160
Rem
oval
Rat
e (n
m/m
in)
pH
Static Polishing Polishing (EC)

167
4.3.3.3. Galvanostatic Study of Copper Removal in Oxalic Acid Solution Containing
TSA – Effect of Current Density
Most of the results discussed so far were obtained under constant potential
(potentiostatic) conditions. In potentiostatic mode, copper samples are held at constant
overpotential values and current vs. time profiles are recorded. Since the electrochemical
rates are calculated from measured current, it is interesting to characterize removal rate of
copper under constant current (Galvanostatic) conditions. In galvanostatic mode, a fixed
current is applied to copper and the potential difference between copper and the reference
electrode is monitored with time. This study also helps in determining the rate of film
formation.
In this study, the concentrations of oxalic acid, TSA, and SiO2 particles were fixed at
0.1 M, 0.01 M and 1% respectively. All the solutions were maintained at pH 4 and
polishing pressure at 2 psi. Abrasion experiments were carried out by applying two
constant currents, viz. 0.572 mA (I1) and 3.432 mA (I2) to the copper samples
corresponding to current densities of 0.11 mA/cm2 and 0.61 mA/cm2 respectively. These
current density values were chosen from the anodic polarization curve of copper exposed
to chemical formulation (see figure 4.6). The current I1 is the lowest measured current,
when the copper surface is completely passivated due to the formation of TSA film. The
current I2 is the maximum current measured at the passivation potential at which the
copper surface starts to passivate.

168
Figure 4.12 (a) shows the variation of measured potential at an applied current of
0.572 mA. The initial potential before the application of current is 175 mV vs. SHE. The
moment the current is applied, the potential quickly increases and reaches a steady state
value of 220 mV vs. SHE. When the sample is polished (abraded), the potential quickly
decreases by 30 mV indicating removal of a TSA film. Once the abrasion is stopped, the
potential increases to 205 mV vs. SHE. This indicates that the copper surface repassivates
rapidly.
The variation of potential at an applied current of 3.432 mA is shown in
Figure 4.12 (b). Under no abrasion conditions, even after 8 minutes of holding, the
potential keeps increasing from 250 mV vs. SHE to 2 V vs. SHE and no plateau is
observed (as seen for lower current condition). This indicates formation of a resistive
multilayer film on the copper surface. As soon as abrasion is started, there is a dramatic
drop in potential from 2 V vs. SHE to 500 mV vs. SHE. This indicates that the passive
TSA film is removed during abrasion. Once the abrasion is stopped, the potential again
increases and reaches a steady state value of 1.5 V vs. SHE due to repassivation of the
copper surface.
It is important to note that a six fold increase in current from 0.572 mA to 3.432 mA
increases the copper removal rate by six fold from 13.5 nm/min to 82 nm/min. Another
observation that can be made for both low and high current conditions is that the potential
after abrasion does not reach the value that was measured before the start of abrasion. It
may be argued that after abrasion, the copper surface might have changed, thus causing
this behavior.

169
(a)
(b) Figure 4.12: Variation of potential with time during abrasion of copper in 0.1 M oxalic containing 0.01 M TSA and 1% SiO2 for applied current densities of (a) 0.11 mA/cm2 and (b) 0.61 mA/cm2
0 100 200 300 400 500 6000.16
0.17
0.18
0.19
0.20
0.21
0.22
RR = 13.5 nm/minLoad = 2 psi, pH 4
No polishing No polishingPolishing
E vs
. SH
E (V
)
Time (sec)
I1 = 0.572 mA
0 200 400 600 800 1000 12000.0
0.5
1.0
1.5
2.0
2.5
RR = 82 nm/minLoad = 2 psi, pH 4
Polishing No polishing No polishing
E vs
. SH
E (V
)
Time (sec)
I2 = 3.432 mA

170
4.3.3.4. Galvanostatic Study of Copper Removal in Oxalic Acid Solution Containing
TSA – Effect of Particles
The next set of experiments was carried out to study the effect of particles on the
removal rate of copper under galvanostatic conditions. Polishing of copper samples
exposed to solution containing 0.1 M oxalic acid and 0.01 M TSA at pH 4 was carried
out at a constant current of 3.432 mA (current density of 0.61 mA/cm2), in the absence
and presence (1%) of SiO2 particles. In these experiments, polishing was started
immediately after the application of current.
Figure 4.13 (a) displays the effect of particle concentration on the measured potential
with and without abrasion. It may be seen that when the polishing is carried out in the
presence of particles, the potential stays at a constant value of 400 mV vs. SHE. Once the
polishing is stopped, the potential increases to 1 V vs. SHE and becomes constant. It is
interesting to note that, if polishing is carried out without particles, the recorded potential
value, 800 mV vs. SHE, is much higher than that with particles. This behavior can be
explained as being due to incomplete removal of the passive film. The potential increases
to 1 V vs. SHE once the abrasion is stopped.
The removal rate measured by profilometry is shown in Figure 4.13 (b). The removal
rate increases from ~15 nm/min (in the absence of particles) to 40 nm/min when particles
are present in the chemical system. However, these removal rates are lower than those
observed for same applied current (which was 82 nm/min) when a copper sample is held
for 8 minutes before abrasion. It may be argued that the holding time before abrasion is
responsible for the observed difference in removal rates.
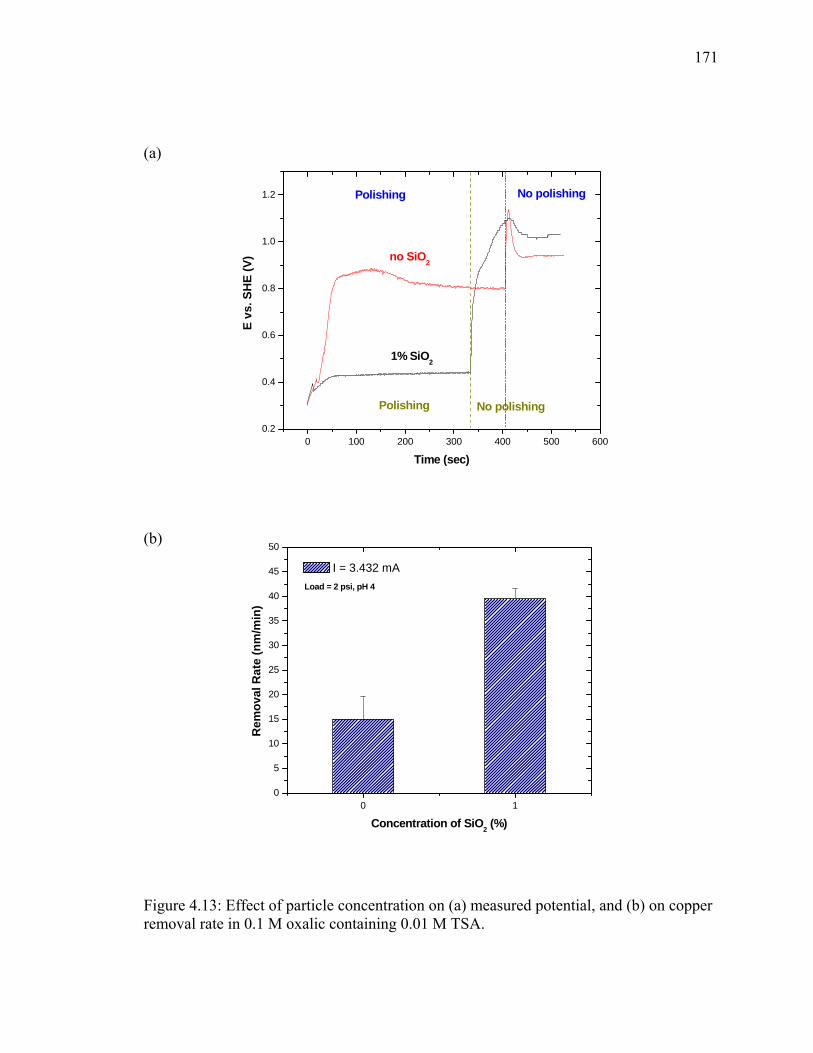
171
(a)
(b) Figure 4.13: Effect of particle concentration on (a) measured potential, and (b) on copper removal rate in 0.1 M oxalic containing 0.01 M TSA.
0 100 200 300 400 500 6000.2
0.4
0.6
0.8
1.0
1.2
1% SiO2
Polishing
Polishing
No polishing
No polishing
E vs
. SH
E (V
)
Time (sec)
no SiO2
0 10
5
10
15
20
25
30
35
40
45
50
Rem
oval
Rat
e (n
m/m
in)
Concentration of SiO2 (%)
I = 3.432 mALoad = 2 psi, pH 4
172
4.3.3.5. Galvanostatic Study of Copper Removal in Oxalic Acid Solution Containing
TSA – Effect of Time before Polishing
It may be recalled from the last section that a lower removal rate is observed when the
polishing is started immediately after the application of current. For the same chemistry
and applied current value, a higher removal rate was observed when the polishing was
started after 8 minutes. In order to explain these results, experiments were carried out by
holding the copper sample for different time intervals before the polishing was started.
Copper samples exposed to 0.1 M oxalic acid at pH 4 containing 0.01 M TSA and 1%
SiO2 were held at a constant current of 3.432 mA (current density of 0.61 mA/cm2).
Polishing was started immediately, after 4 minutes and after 8 minutes of application of
current. The removal rates measured by profilometry are displayed in Figure 4.14. In
each case, the polishing time was 5 minutes.
As shown in the figure, when polishing is started immediately after application of
current, the measured removal rate is only about 30 nm/min. If polishing is started after 4
minutes of current application, the removal rate increases to 48.5 nm/min. With a further
increase in holding time to 8 minutes, the removal rate increases to 85 nm/min. These
results point to the fact that it is easier to remove the passive film than the copper itself. If
polishing is started immediately after current is applied, the thin film formed is instantly
removed, which results in lower removal rate. This indicates that the TSA film is softer
than the electroplated copper film and is easier to remove. Thus, the copper removal rate
increases with the holding time before polishing.

173
Even though this is significant result in that it shows that the passive film is much
easier to remove than the copper, this strategy (intermediate holding and polishing) to
obtain high removal rates cannot be used during ECMP. Thus, a better way to increase
the removal rate of copper must be investigated. The results discussing higher removal
rates of copper during ECMP are discussed in Section 4.4.

174
Figure 4.14 : Effect of time before polishing on removal rate of copper exposed to 0.1 M oxalic acid containing 0.01 M TSA and 1% SiO2 at a constant current density of 0.61 mA/cm2.
0 4 80
10
20
30
40
50
60
70
80
90
100
Rem
oval
Rat
e (n
m/m
in)
Time before polishing (min)
Polishing

175
4.4. ECMP of Copper in the Absence of Abrasive Particles
The highest removal rate of copper that was achieved with particles was 850 Å/min at
an overpotential of 750 mV. This removal rate was recorded in a solution containing 0.1
M oxalic acid and 0.01 M TSA at pH 4. In addition, this rate of 85 nm/min was achieved
in the presence of 1% SiO2 particles. Results discussed in Sections 4.3.3.1 and 4.3.3.4
show that particles are required to increase the removal rate of copper. In the absence of
particles, the removal rate is very low (~ 15 nm/min). However, a typical ECMP
electrolyte does not contain particles. Thus, more investigations were carried out to
achieve high removal rates in oxalic acid solutions.
Since particles must be eliminated from the electrolyte, the work that will be discussed
from now on was carried out in the absence of particles. In addition, to increase the
removal rate of copper, the oxalic acid concentration was also increased.

176
4.4.1. Removal Rates of Copper during Abrasion in Oxalic Acid Solution – Effect of
Concentration
Preliminary investigations were carried out as a function of oxalic acid concentration.
Copper samples were exposed to three oxalic acid solutions with concentrations of 0.01
M, 0.1 M and 0.3 M at an overpotential of 750 mV. Polishing was carried out at a
pressure of 2 psi in the absence of particles. The polishing time was varied for each
experiment, depending on the recorded current value. Polishing was carried out for
shorter times, if a higher current (e.g. > 50 mA) was recorded. The samples were
characterized for static and polishing removal rates with the four-point probe technique.
The static and polishing removal rates of copper as a function of oxalic acid
concentration at 750 mV overpotential are shown in Figure 4.15. It may be seen that both
static etch rate and removal rate due to abrasion increases, with oxalic acid concentration.
In 0.01 M oxalic acid solution, the static etch rate of copper is 19.5 nm/min and the
polishing rate is 30 nm/min. With an increase in oxalic acid concentration to 0.1 M, both
static and polishing rates increase to 164 nm/min and 178 nm/min respectively. With a
further increase in oxalic acid level to 0.3 M, a very high static and polishing rate of 290
nm/min and 320 nm/min respectively was observed. The removal rate of copper (not
shown in the figure) in 0.3 M oxalic acid solution at pH 4 under OCP conditions was 0.6
nm/min.
These results show that 0.3 M oxalic acid in the absence of particles is a potential
chemistry for ECMP applications. However, an inhibitor must be added to control the
static rate.

177
Figure 4.15 : Removal rate of copper in the absence of particles as a function of oxalic acid concentration at overpotential of 750 mV.
0.01 0.1 0.30
50
100
150
200
250
300
350
400
η = 750 mV
Rem
oval
Rat
e (n
m/m
in)
Concentration of Oxalic Acid (M)
Static Polishing
178
4.4.2. Galvanostatic Study of Copper Removal in Oxalic Acid Solution Containing TSA
– Effect of Current Density
Abrasion experiments were carried out under galvanostatic conditions to characterize
the effect of current density on removal rates. The electrolyte consisted of 0.3 M oxalic
acid and thiosalicylic acid (TSA) as an inhibitor. Since the earlier investigations showed
that 0.01 M TSA was able to reduce the static rate to almost zero, same level of TSA was
used in the current investigation. Copper samples exposed to this electrolyte at pH 4 were
held at three current densities, viz. 0.35, 1.7, and 2.1 mA/cm2. The three current density
values were determined from the polarization curve.
The removal rates as a function of applied current density are shown in Figure 4.16 (a).
The removal rate increases with an increase in current density. A low removal rate of 240
Å/min was obtained for current density of 0.35 mA/cm2. An increase in current density to
1.7 mA/cm2 significantly increases the removal rate to 89.5 nm/min. A further increase in
current density to 2.1 mA/cm2 results in a removal rate of 150 nm/min. A careful
observation of the removal rates and current density values reveals that a six-fold
increase in current density from 0.35 to 2.1 mA/cm2 increases the copper removal rate by
six fold (24 nm/min to 150 nm/min). However, the electrochemical rates calculated from
applied charge based on two electron transfer show that the estimated rate is much lower
than the actual removal rate. The reason behind the difference between the actual and
electrochemical rates has been discussed earlier. Another important point that must be
noted is that for all the three current density values, no static dissolution of copper was

179
observed. This indicates that TSA is effective in protecting copper by inhibiting static
copper dissolution in 0.3 M oxalic acid.
The measured potential values for the three applied currents are shown in Figure 4.16
(b). In case of applied currents of 9.5 and 12.15 mA, potential increases very rapidly in
the first few seconds from about 330 mV vs. SHE and reaches a value of ~800 mV vs.
SHE. The initial increase in potential is due to rapid formation of passive TSA film on
the copper surface. As soon as abrasion is started, the potential decreases slightly, to
about 590 mV and 700 mV vs. SHE respectively, and remains at a constant value. This is
due to removal of the passive film. Once the load is removed, there is an instant increase
in potential to about 1 V vs. SHE, due to repassivation of the copper surface. It may be
seen that for applied current of 2 mA, a potential of only 270 mV vs. SHE is recorded.
Additionally, a small increase in potential (compared to that for higher applied currents)
is seen once the abrasion is stopped. This shows that the passivation of copper surface
follows a different mechanism at lower currents than it follows at higher current values.
A more detailed discussion of this difference in mechanism is discussed in Section 4.8.
The measured potential values correspond to overpotential values of 300 mV, 650 mV
and 750 mV respectively.
It may be concluded from this study that even in higher concentration of oxalic acid
(0.3 M), TSA is effective in inhibiting copper dissolution. In addition, a high removal rate
of 150 nm/min, in the absence of particles can be achieved in this chemistry.

180
(a)
(b)
Figure 4.16: (a) Removal rates and (b) potential vs. time profiles for copper abraded in presence of 0.3 M oxalic acid containing 0.01 M TSA at pH 4.
0 50 100 150 200 250 300 350 4000.20
0.25
0.4
0.6
0.8
1.0
1.2
1.4
No AbrasionAbrasion
No Abrasion
I = 12.15 mA
I = 9.5 mA
E vs
. SH
E (V
)
Time (sec)
I = 2 mA
Abrasion
0.35 1.7 2.10
25
50
75
100
125
150
175
200
Rem
oval
Rat
e (n
m/m
in)
Current Density (mA/cm2)
Polishing Electrochemical

181
4.4.2. Galvanostatic Study of Copper Removal in Oxalic Acid Solution Containing
TSA – Effect of TSA Concentration
All the results reported so far were obtained for TSA concentration of 0.01 M. In order
to determine the minimum TSA concentration required for inhibiting copper dissolution,
experiments were carried out as a function of TSA concentration. The concentration of
TSA was reduced to 0.005 M and 0.001 M, while that of oxalic acid was fixed at 0.3 M.
All the solutions were maintained at pH 4. Abrasion of copper samples was carried out
under galvanostatic conditions at an applied current density of 2.1 mA/cm2. The removal
rates characterized by a four point probe are shown in Figure 4.17(a). For comparison
purposes, the removal rate obtained in solution containing 0.01 M TSA is also displayed
in the same figure.
It can be seen that the removal rate of copper increases with a decrease in TSA
concentration For example, the removal rate of copper decreases from ~ 240 nm/min to
150 nm/min when TSA concentration increases from 0.005 M to 0.01 M. Further
decreasing the TSA concentration to 0.001 M increased the removal rate to 295 nm/min.
However, a high static etch rate of 58 nm/min was also observed in the same solution. It
can be inferred from these results that since addition of 0.005 M TSA to 0.3 M oxalic
acid solution can inhibit static copper dissolution, a concentration of 0.01 M TSA is not
required.
Figure 4.17(b) shows potential vs. time profiles obtained for the three TSA
concentrations. The potential profile recorded in a solution containing 0.005 M TSA is
very similar to that seen in 0.01 M TSA and can be explained similarly as in Section 4.4.1.
182
However, in the case of 0.001 M TSA, a lower potential value of 350 mV vs. SHE is
recorded. Once the abrasion is stopped, the potential increases to about 800 mV vs. SHE.
This indicates that a complete passivation of the copper surface does not take place in a
solution containing 0.001 M TSA, because of which there is static dissolution of copper
in 0.3 M oxalic acid solution.
These results show that as far as static etch rate is concerned, a TSA concentration of
0.01 M is not required, since a similar result can be achieved at a lower concentration. In
addition, a higher removal rate of copper is achieved in a solution containing 0.005 M
TSA and 0.3 M oxalic acid. It should be noted that the relative velocities achieved in the
laboratory EC-AC tool are very low compared to the commercial tools, and hence a
polish rate of 240 nm/min in an EC-AC tool could scale up to 1,000 nm/min in a
commercial ECMP tool.

183
(a)
(b)
Figure 4.17 : (a) Removal rates and (b) potential vs. time profiles for copper abraded in solution containing 0.3 M oxalic acid and various concentrations of TSA at pH 4.
0 50 100 150 200 250 300 3500.2
0.4
0.6
0.8
1.0
1.2
1.4
1.6
No AbrasionAbrasion
0.005 M TSA
0.01 M TSA
E vs
. SH
E (V
)
0.001 M TSA
Time (sec)
0.01 0.005 0.0010
50
100
150
200
250
300
350
400
I = 12.15 mA
Rem
oval
Rat
e (n
m/m
in)
Concentration of TSA (M)
Static Polishing

184
4.4.3. Galvanostatic Study of Copper Removal in Oxalic Acid Solution – Comparison of
BTA and TSA as Inhibitor
It is clear that a high copper removal rate of 240 nm/min and a zero static dissolution
rate can be obtained in solution containing 0.3 M oxalic acid and 0.005 M TSA at pH 4.
At this juncture, results of experiments carried out to compare thiosalicylic acid (TSA)
with the conventionally used inhibitor benzotriazole (BTA) will be discussed. Abrasion
experiments were carried out under galvanostatic mode, by exposing copper samples to
0.3 M oxalic acid solution containing different levels of TSA and BTA at pH 4. The
applied current density was 2.1 mA/cm2 and the load was held constant at 2 psi. Two
concentrations of TSA and BTA were investigated, viz. 0.005 M and 0.001 M. The
removal rates characterized by a four point probe are displayed in Figure 4.18.
A high static dissolution rate of copper is seen in the case of BTA. In solution
containing 0.005 M BTA, the static etch rate of copper is 64 nm/min and the removal rate
is 234 nm/min. Similarly, the static etch rate and removal rate of copper in solution
containing 0.001 M BTA are 67 nm/min and 275 nm/min respectively. However, no
static etching of copper is seen in a solution containing 0.005 M TSA, while a rate of 58
nm/min is seen in those containing 0.001 M TSA.
It is clear that a solution concentration of 0.005 M BTA is not sufficient to inhibit
copper dissolution in 0.3 M oxalic acid solution at an applied current density of 2.1
mA/cm2. However, a similar amount (0.005 M) of TSA can inhibit copper dissolution. At
the lower concentration of 0.001 M, neither BTA nor TSA is effective.

185
It can be concluded from these results that thiosalicyclic acid is a better inhibitor than
benzotriazole for ECMP of copper in oxalic acid solutions.
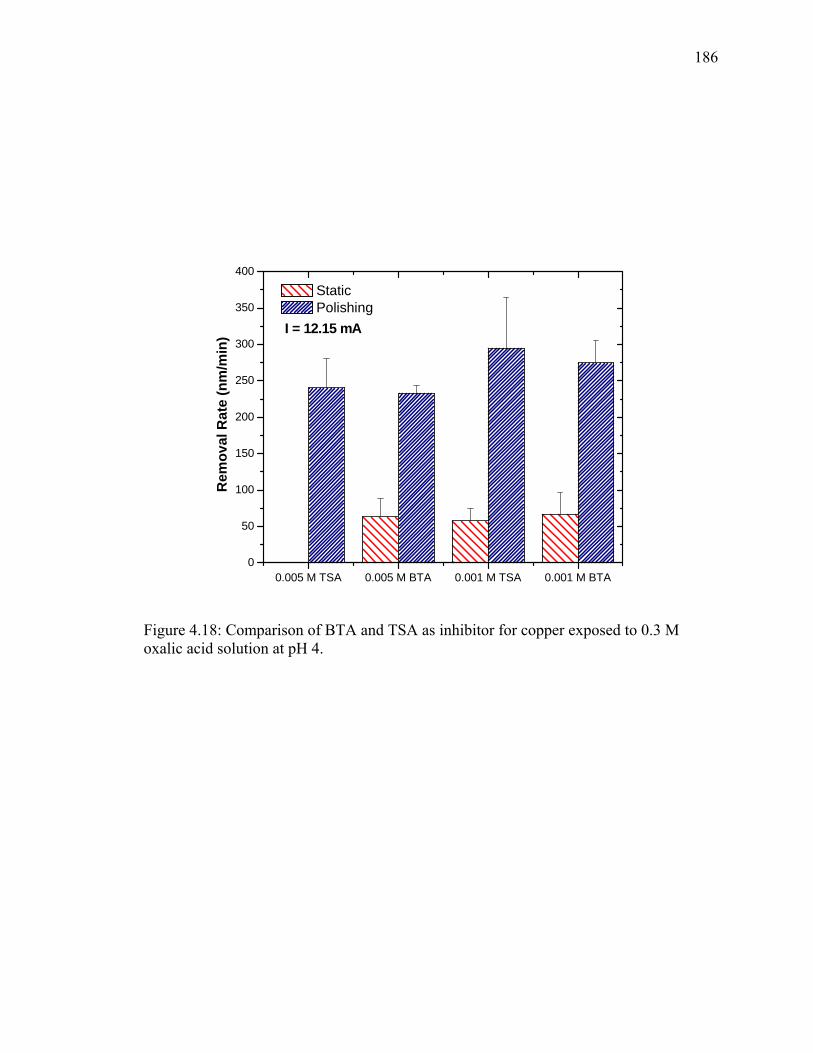
186
Figure 4.18: Comparison of BTA and TSA as inhibitor for copper exposed to 0.3 M oxalic acid solution at pH 4.
0.005 M TSA 0.005 M BTA 0.001 M TSA 0.001 M BTA0
50
100
150
200
250
300
350
400
I = 12.15 mA
Rem
oval
Rat
e (n
m/m
in)
Static Polishing

187
4.5. Passivation Kinetics of Copper in Oxalic Acid Solution Containing TSA
Experiments were carried out to characterize the kinetics of formation of passive film
under anodic overpotential conditions, using an electrochemical quartz crystal
microbalance (EQCM) technique. For these experiments, copper films were
electrodeposited on a QCM crystal and were exposed to oxalic acid chemistries
containing inhibitors. The electrodeposited copper film on QCM crystal was held at
different anodic overpotentials and the mass of copper film was monitored with time. The
mass change in presence and absence of inhibitors is discussed in the following sections.
4.5.1. Dissolution of Copper in Oxalic Acid
Electrodeposited copper film on QCM crystal was exposed to oxalic acid solutions of
three different concentrations viz. 0.1 M, 0.3 M, and 0.5 M at pH 4. The mass change of
copper film was recorded at overpotentials of 300 mV, 500 mV and 750 mV for each of
the oxalic acid concentrations. The mass decreased linearly with time at all oxalic acid
concentrations and overpotential conditions. It may be noted that a mass decrease
indicates dissolution, while a mass increase indicates surface layer formation or inhibition.
In addition, a mass decrease of 1 μg/cm2 in one minute is equivalent to a rate of 1.1
nm/min.
Figure 4.19 shows a change in the mass of copper film with time at an overpotential of
750 mV. It is clear that mass decreases more rapidly with an increase in oxalic acid
concentration. For example, for 0.1 M oxalic acid solution, approximately 170 μg/cm2 of
copper is dissolved in one minute. This corresponds to a dissolution rate of 189 nm/min.

188
Similarly, for 0.3 M and 0.5 M oxalic acid, approximately 510 μg/cm2 and 750 μg/cm2 of
copper is dissolved, which is equivalent to dissolution rates of 561 nm/min and 826
nm/min respectively. The dissolution rates at lower overpotential values are tabulated in
Table 4.4. It may be noted that at open circuit potential (OCP) conditions, the dissolution
rate of copper is very low in all the oxalic acid concentrations. The dissolution rate
increases only with the application of potential.
A comparison of copper dissolution rates obtained from QCM experiments with those
in Section 4.2.1 shows that except for 0.1 M oxalic acid, the rates obtained using QCM
are somewhat higher than those obtained using the EC-AC tool (without abrasion). It may
be noted that the electroplated copper films used in the EC-AC tool experiments were
annealed, while those used in QCM were freshly electroplated (not annealed). Perhaps
this difference between the copper films is responsible for the observed variation in
dissolution rates.
4.5.2. Copper Dissolution in Oxalic Acid Containing TSA
The mass change of copper coated QCM crystal when exposed to oxalic acid
solution containing 0.01 M TSA at pH 4 is shown in Figure 4.20. The data was recorded
in oxalic acid solutions of 0.1 M, 0.3 M, and 0.5 M and four overpotentials of 0, 300 mV,
500 mV, and 750 mV. As shown in the top figure, the mass increases as soon as copper is
immersed in a solution of 0.1 M oxalic acid containing 0.01 M TSA. The mass increase is
most likely due to adsorption of TSA molecules on the copper surface to

189
Figure 4.19: Effect of oxalic acid concentration on mass change of copper coated QCM crystal at overpotential of 750 mV. Table 4.4: Dissolution rate of copper as a function of oxalic acid concentration and overpotential.
Static Dissolution Rate (nm/min) Concentration of
oxalic acid (M) OCP η = 300 mV η = 500 mV η = 750 mV
0.1 0.1 60 128 190
0.3 0.2 124 291 562
0.5 0.2 170 410 826
0 1 2 3-1100
-1000
-900
-800
-700
-600
-500
-400
-300
-200
-100
0
100
0.5 M
0.3 M
M
ass
Cha
nge
(μg/
cm2 )
Time (min)
η = 750 mV
0.1 M

190
Figure 4.20: Mass change of copper exposed to 0.1 M (top) and 0.5 M (bottom) oxalic acid containing 0.01 M TSA at different overpotential conditions.
0 1 2 30
10
20
30
40
50
60
η = 750 mV
η = 500 mV
Mas
s C
hang
e (μ
g/cm
2 )
Time (min)
OCP
η = 300 mV
0 1 2 3
-50
-40
-30
-20
-10
0
10
20
30
40
0.5 M Oxalic + 0.01 M TSA, pH 4
η = 750 mV
η = 500 mV
η = 300 mV
OCP
Mas
s C
hang
e (μ
g/cm
2 )
Time (min)
0.1 M Oxalic + 0.01 M TSA, pH 4

191
form a passive film. It can be seen that the mass increases to higher values, with an
increase in overpotential. For example, after one minute, the mass increases to 7.6 μg/cm2
at OCP and 16 μg/cm2 at 300 mV overpotential. A further increase in overpotential to
500 mV and 750 mV increases the mass to 19 and 32 μg/cm2 respectively. It is also
observed that the mass increases rapidly for the first minute, after which it tends to
saturate. In a 0.5 M oxalic acid solution containing 0.01 M TSA, an increase in mass with
time is observed only for overpotentials of 300 mV and 500 mV. At the higher
overpotential of 750 mV, a decrease in mass was recorded. In the first 15 seconds, about
20 μg/cm2 of copper is dissolved, after which the mass decreases slowly. Based on the
data collected for 3 minutes, the dissolution rate of copper was calculated to be 53
nm/min. This indicates that at higher overpotentials (≥ 750 mV), TSA is not effective in
inhibiting copper dissolution in 0.5 M oxalic acid solution.
It may be concluded from these data that for oxalic acid concentrations of ≤ 0.3 M,
TSA is effective in inhibiting copper dissolution at all anodic overpotential values.
However, in 0.5 M oxalic acid solution, TSA inhibits dissolution up to an overpotential
of 500 mV.
4.5.3. Effect of TSA Concentration on Copper Dissolution in Oxalic Acid
Since it was clear that TSA is not effective in inhibiting copper dissolution at a higher
ovepotential (≥ 750 mV) in 0.5 M oxalic acid solutions, subsequent experiments were
carried out in 0.3 M oxalic acid solution. The effect of TSA concentration was

192
characterized by exposing copper coated QCM crystal to 0.3 M oxalic acid solution
containing varying amounts of TSA at pH 4.
Figure 4.21 shows the recorded mass change for three TSA concentrations of 0.01 M,
0.005 M and 0.001 M at an overpotential of 750 mV. It is clear that the mass increases in
solutions containing 0.01 M and 0.005 M TSA and decreases in solution containing
0.001 M TSA. In the case of 0.005 M, the mass increases rapidly to 12 μg/cm2 in the first
30 seconds, and tends to saturate after one minute. At the end of three minutes, the
recorded mass increases is 23 μg/cm2. This indicates that even 0.005 M of TSA is
sufficient to form a passive film on the copper surface, which can stop copper dissolution.
However, when 0.001 M TSA is added to 0.3 M oxalic acid, the mass decreases linearly
with time. Approximately, 373 μg/cm2 of copper is dissolved in a minute, which
corresponds to a rate of 410 nm/min. Thus, 0.001 M TSA is not effective in inhibiting
copper dissolution in 0.3 M oxalic acid solution.
4.5.4. Comparison of TSA and BTA as Inhibitors for Copper in Oxalic Acid Chemistry
It is now clear that even 0.005 M TSA is sufficient to inhibit copper dissolution in 0.3
M oxalic acid at pH 4. Since BTA is the most commonly used inhibitor for copper,
experiments were carried out to compare the effectiveness of TSA and BTA in inhibiting
copper dissolution in 0.3 M oxalic acid solutions.
These tests were conducted in two solutions at pH 4, one containing 0.005 M TSA and
the other containing 0.005 M BTA. Mass change data recorded in both solutions shown
in Figure 4.22(a) and Figure 4.22(b) clearly indicate that the mass increases in the

193
presence of 0.005 M TSA for all overpotential values. The higher the overpotential, the
higher is the increase in mass.
In the case of BTA, under OCP conditions, the mass initially increases to 0.174
μg/cm2 in the first 15 seconds, after which it decreases with time. Approximately 0.19
μg/cm2 of copper is dissolved in a minute, which corresponds to a rate of 0.2 nm/min.
This indicates that initially BTA tends to adsorb on the copper surface, but with time
oxalic acid molecules, because of their higher concentration in solution, begin to displace
BTA from the copper surface and lead to dissolution. A similar variation of mass with
time is seen at 300 mV overpotential. Copper is dissolved at a rate of 1 nm/min in the
first minute and the rate decreases to 0.5 nm/min after 2 minutes. At an overpotential of
500 mV, copper is dissolved at a rate of 1.1 nm/min during the first minute and decreases
to 0.3 nm/min after 3 minutes. However, at 750 mV overpotential, the rate of mass
change is very fast and mass decreases linearly with time. For example, in about 10
seconds, 3 μg/cm2 of copper is dissolved, indicating a rate of 33 nm/min.
This shows that unlike TSA, BTA is not effective in inhibiting copper dissolution at
higher anodic overpotentials.

194
Figure 4.21: Effect of TSA concentration on mass change of copper exposed to 0.3 M oxalic acid at overpotential of 750 mV.
0.0 0.5 1.0 1.5 2.0-500
-450
-400
-350
-300
-250
-200
-150
-100
-50
0
50
0.01 M TSA0.005 M TSA
Mas
s C
hang
e (μ
g/cm
2 )
Time (min)
η = 750 mV
0.001 M TSA

195
(a) (b) Figure 4.22: Mass change for copper exposed to 0.3 M oxalic acid at pH 4 containing (a) 0.005 M TSA and (b) 0.005 M BTA as a function of overpotential.
0 1 2 30
5
10
15
20
25
OCP
η = 300 mV
η = 500 mV
η = 750 mV
Mas
s C
hang
e (μ
g/cm
2 )
Time (min)
0.3 M Oxalic Acid + 0.005 M TSA, pH 4
0.0 0.5 1.0 1.5 2.0 2.5 3.0-5
-4
-3
-2
-1
0
1
η = 750 mV
η = 500 mV
η = 300 mV
OCP
Mas
s C
hang
e (μ
g/cm
2 )
Time (min)
0.3 M Oxalic Acid + 0.005 M BTA

196
4.5.5. Inhibition Efficiency
The inhibition efficiency of TSA and BTA was calculated from the corrosion rate of
copper in the absence (CRabs) and presence (CRpre) of an inhibitor using the following
equation.
100][
(%) ×−
=abs
preabs
CRCRCR
EfficiencyInhibition
The corrosion (dissolution) rate was calculated from the mass change vs. time profiles
recorded from QCM experiments, at different anodic overpotentials, using the conversion
where 1 μg/cm2.min is equivalent to a rate of 1 nm/min.
Figure 4.23 compares the inhibition efficiency of BTA and TSA for copper exposed to
0.3 M oxalic acid at pH 4. It may be seen that TSA shows 100% inhibition efficiency for
all overpotential values. In the case of BTA, the inhibiting efficiency under OCP
conditions is about 52%. Under OCP conditions, CRabs is only 0.2 nm/min, while CRpre is
~ 0.1 nm/min. Since the difference between the dissolution rates in the absence and
presence of BTA is very small, it results in lower inhibition efficiency. BTA is quite
effective at overpotentials of 300 mV and 500 mV with inhibition efficiency of 99%. It
may be noted that the CRabs increases significantly with overpotential. However,
inhibition efficiency drops to 88% for an overpotential of 750 mV. This clearly shows
that BTA is not an effective inhibitor for copper at higher overpotentials of ≥ 750 mV.
It can be concluded from these results that TSA completely inhibits copper dissolution
in oxalic acid solution at all overpotential values. Additionally, TSA appears to be better
197
than the conventionally used BTA in oxalic acid solution at high overpotentials (≥ 750
mV).

198
Figure 4.23: Comparison of inhibition efficiency of BTA and TSA in 0.3 M oxalic acid as a function of overpotential.
0 300 500 7500
20
40
60
80
100
120
Inhi
bitio
n Ef
ficie
ncy
(%)
Overpotential (mV)
TSA BTA

199
4.6. Cyclic Voltammetry (CV)
From the abrasion experiments, the best condition for removal of copper in oxalic acid
solution can be summarized as follows:
Chemistry: 0.3 M oxalic acid containing 0.005 M TSA at pH 4
Current Density: 2.1 mA/cm2 (overpotential = 750 mV)
It may be recalled that the removal rate of copper in this chemistry is 240 nm/min with no
static dissolution.
The reason behind the stability of TSA under high anodic overpotential conditions
was then investigated. It has been reported [4.2] that TSA can be oxidized in the
presence of copper to form disulfide, using vibrational studies. However, the oxidation
potential of TSA has not been reported. Hence, cyclic voltammetry experiments were
carried out to characterize oxidation potential of TSA. Since the chemistry consists of
oxalic acid in addition to TSA, initial experiments were carried out on oxalic acid
solutions.
4.6.1. Oxidation of Oxalic Acid
To determine the potential at which oxalic acid gets oxidized, experiments were
carried out using a platinum plate as working and counter electrodes and saturated
calomel (Hg/Hg2Cl2/KCl) with luggin capillary as a reference electrode. Since
characterizing oxidation potential was the major objective, the scan was initiated from the
open circuit potential (OCP) to 1.2 V vs. OCP and then was reversed back to OCP. The
potential was scanned at a rate of 50 mV/s.

200
Figure 4.24 shows the cyclic voltammogram for 0.01 M oxalic acid at pH 4. When the
potential is increased from OCP (~ 430 mV vs. SCE) to 1.2 V vs. OCP, a peak
corresponding to oxidation potential of oxalic acid is observed at 1 V vs. SCE. This
oxidation potential value is very close to that reported by Chollier and coworkers [4.3,
4.4]. They found that the oxidation of oxalic acid begins at 700 mV vs. SHE, attains a
maximum at 1.3 V vs. SHE and decreases thereafter. The voltammogram showed a broad
peak similar to the one obtained in this experiment. No distinguishable peak was
observed during the reversal of scan back to OCP. This indicates that the oxidation
reaction is not reversible.
4.6.2. Oxidation of Thiosalicylic Acid (TSA)
Cyclic voltammetry experiments were carried out to determine the oxidation potential
of thiosalicylic acid. A platinum plate was used as working and counter electrodes, while
saturated calomel with luggin capillary was used as a reference electrode. Before the
experiment was carried out, the TSA solution was purged with nitrogen for about 30
minutes. The solution, covered with nitrogen blanket, was not stirred during the
experiments. As in the case of oxalic acid, the potential was swept only in the anodic
direction. The potential was scanned from OCP to 1.2 V vs. OCP and was reversed back
to OCP, with a scan rate of 10 mV/s.
The cyclic voltammogram obtained for 0.01 M TSA at pH 4 is shown in Figure 4.25.
It may be seen that during the forward scan, only a single peak at 800 mV vs. SCE is

201
observed. This peak most likely corresponds to oxidation of TSA to disulfide, as shown
by the following reaction.
For comparison purposes, the oxidation potential values of some organic compounds
with the mercapto group (-SH) are tabulated in Table 4.5. The oxidation potentials of all
the listed compounds were determined using a cyclic voltammetry technique. It is clear
that the oxidation potential of thiosalicylic acid compares well with other compounds.
Table 4.5: Oxidation potentials of some organic compounds.
Compound Oxidation Potential (Eox) Reference
Thioglycolic Acid 750 mV vs. Ag/AgCl 4.5
Thiophenol 945 mV vs. SHE 4.6
2-naphthiol 845 mV vs. SHE 4.6
Thiourea 600 mV vs. SCE 4.7, 4.8

202
Figure 4.24 : Cyclic voltammogram for 0.01 M oxalic acid at pH 4, on platinum working electrode at a scan rate of 50 mV/s. Figure 4.25: Cyclic voltammogram for 0.01 M TSA at pH 4, on platinum working electrode at a scan rate of 10 mV/s.
0.2 0.4 0.6 0.8 1.0 1.2 1.4 1.60
200
400
600
800
1000
1200
I (μA
/cm
2 )
E vs. SCE (V)
0.01 M Oxalic, pH 4
-0.2 0.0 0.2 0.4 0.6 0.8 1.0 1.2 1.40
50
100
150
200
250
I (μA
/cm
2 )
E vs. SCE (V)
0.01 M TSA, pH 4
203
4.6.3. Cyclic Voltammetry (CV) and Quartz Crystal Microbalance (QCM) Studies in
Cu/TSA System
Since it is clear that TSA oxidizes to disulfide, experiments were carried out to
characterize the kinetics of passivation during oxidation of TSA. This was done by
recording mass change using QCM while changing the applied potential at a rate of 10
mV/sec. Initially, copper was electrodeposited on the QCM crystal and the TSA solution
was purged with nitrogen. During the experiments, the solution was not stirred and was
covered with a nitrogen blanket.
Figure 4.26 shows the cyclic voltammetry scan and simultaneous measurement of
mass change using QCM for the copper electrode in 0.01M TSA at pH 4. The potential
was swept from OCP to 1.2 V vs. OCP and reversed back to OCP at a scan rate of 5 mV/s,
and the mass change as a function of time was recorded simultaneously using QCM. The
CV curve shows the presence of two peaks at 300 mV and 800 mV vs. SCE. The peak at
800mV vs. SCE is due to oxidation of TSA to disulfide. However, the reaction
responsible for the peak at 300 mV is not clear. It may be due to the oxidation of copper
to form a cupric TSA complex. No reduction peaks are observed in the reverse scan
which shows that the reactions causing the peaks are irreversible. It may be seen that the
mass slowly starts to increase as the potential increases from OCP. Recorded mass shows
an increase in mass from 10 μg/cm2 to 40 μg/cm2 during the first peak formation. When
TSA is being oxidized at 800mV, the mass increases very rapidly from 40 μg/cm2 to 120
μg/cm2. However, the mass remained unchanged when the potential was reversed back
to OCP.

204
The recorded mass increase of 54 μg/cm2 at an overpotential of 750 mV, during this
experiment, is very close to the mass increase of 50 μg/cm2 recorded at the same
overpotential in earlier experiments (refer to Section 4.5.2).
It is clear from these experiments that TSA oxidizes to disulfide at a potential of 800
mV. SCE. It may be recalled that during abrasion experiments (Section 4.4.2); the
applied current density of 2.1 mA/cm2 corresponds to an overpotential of 750 mV, which
is very close to the oxidation potential of TSA. Thus, oxidation of TSA results in the
formation of a disulfide film, which is responsible for almost zero (static) dissolution
rates of copper observed earlier in polishing experiments.

205
Figure 4.26: Mass change recorded during cyclic voltammetry experiment of copper exposed to 0.01 M TSA solution at pH 4 (no oxalic acid)
0 1 2 3 40
20
40
60
80
100
120
Mas
s C
hang
e (μ
g/cm
2 )
Time (min)
0.0 0.2 0.4 0.6 0.8 1.00
100200300400500600700
I (μA
/cm
2 )
E vs. SCE (V)

206
4.7. XPS Characterization of Passive Film
X-ray photoelectron spectroscopy was used to characterize the interaction of TSA
with the copper surface. Electroplated copper films were exposed to 0.01 M TSA
dissolved in ethanol, under OCP conditions. The solution was initially purged with
nitrogen for 30 minutes. Copper films were directly transferred from the alcohol solution
to the vacuum chamber for XPS measurements. In order to find relative amounts of
carbon, oxygen, and sulfur in the TSA molecule, XPS measurements were also carried
out on the as-received TSA solid.
The XPS spectra of the as-received TSA solid and the copper surface exposed to TSA
containing solution are shown in Figure 4.27(a) and 4.27(b) respectively. In the case of
TSA, the spectrum shows the presence of carbon (C 1s peak at 285.3 eV), oxygen (O 1s
peak at 532.5 eV), and sulfur (S 2p peak at 163.6 eV). For copper samples, in addition to
carbon, oxygen and sulfur, the spectrum shown the presence of copper (Cu 2p peaks at
933.6 eV and 952.2 eV) on the sample surface. From the area of the individual peaks, the
atomic concentrations of the elements were determined and these are tabulated in Table
4.6. In the case of copper samples, the atomic concentrations are Copper = 10.59%,
Carbon = 63.60%, Oxygen = 19.04% and Sulfur = 6.76%. The ratio of carbon to sulfur
calculated from XPS data is 9.4, which is close to the actual ratio (9.7) of carbon and
sulfur in a TSA molecule. This confirms the presence of TSA on the sample surface. The
copper-TSA complex (Cu-C7H4O2S) would have an elemental ratio of Cu: C: O: S of
1: 7: 2: 1. The atomic concentration obtained from the XPS spectrum gives a ratio of Cu:
C: O: S = 1: 6: 1.8: 0.6.

207
(a)
(b)
Figure 4.27: XPS spectra of (a) as received TSA solid and (b) copper exposed to solution containing 0.01 M TSA.

208
Table 4.6: Atomic concentrations of elements detected in TSA standard and on copper sample exposed to 0.01 M TSA solution.
Atomic Concentration (%) Element Binding
Energy (eV) TSA standard Copper exposed to TSA
Cu 952.2 0 10.59
C 285.3 74.68 63.60
O 532.5 17.68 19.04
S 163.6 7.64 6.76
Figure 4.28: XPS spectra of Cu 2p1/2 and 2p3/2 peaks showing presence of cupric states on the surface.
209
The XPS data is in reasonable agreement with the elemental ratios calculated from the
molecular formula. This proves the presence of 1:1, Cu-TSA compound on the sample
surface. The higher amount of copper is most likely due to the penetration of X-rays into
the bare copper below the Cu-TSA surface.
Figure 4.28 presents the expanded view of Cu 2p peaks showing the presence of
distinct copper 2p3/2 and 2p1/2 peaks. The peak corresponding to Cu+ (cuprous) state at
binding energy of 931.6 eV is absent. The 2p3/2 peak occurring at binding energy of 933.6
eV indicates the presence of Cu2+ (cupric) states on the surface. This shows that the
majority of copper detected is in the cupric state, due to cupric-TSA complex. The 2p1/2
peak occurring at 952.2 eV corresponds to copper present in the ground state (Cu0). The
detected ground state copper is most likely due to the penetration of X-rays below the
cupric-TSA layer on the surface, as surmised earlier. These data support the literature
reports, which indicate formation of cupric-TSA complex [4.1].
The exact nature of bonding between the copper surface and TSA can be determined
by an evaluation of XPS spectra for carbon 1s, oxygen 1s, and sulfur 2p peaks. The
spectra were collected on two different surfaces; the first spectrum was collected from the
surface directly transferred from the ethanol solution to the vacuum chamber. In the
second case, the sample surface was washed with ethanol, before recording the spectrum.
The spectra for carbon (C 1s), oxygen (O 1s), and sulfur (S 2p) peaks are shown in Figure
4.29 (a), (b), and (c) respectively. For comparison purposes, the spectrum of carbon 1s
and sulfur 2p peaks recorded for as received TSA is also shown. It can be seen that the
carbon 1s spectrum shows two peaks. The peak occurring at binding energy of 285.6 eV

210
corresponds to the carbon in the aromatic ring, while that occurring at 290 eV
corresponds to the carbon in the carboxyl group (-COOH).
It is clear that the spectrum collected from the unwashed surface is exactly similar to
that recorded for as-received TSA. However, the spectrum collected from the washed
surface (Figure 4.29(a)) shows that the peak due to carbon in the carboxyl group shifts to
a lower binding energy from 290 eV to 288.6 eV. This shift in binding energy is
attributed to the bonding of the carboxyl group to the copper surface. There is no shift
observed for the aromatic carbon. In the case of oxygen, the spectra for the unwashed
surface and the TSA are almost identical. When the surface is washed, the peak split
disappears and the peak shifts to lower binding energy of 531.7 eV. This indicates
bonding between the copper and the oxygen in the carboxyl group. Similarly, for sulfur,
the spectrum for the unwashed surface with a characteristic sulfur 2p3/2 and 2p1/2 split is
identical to that for TSA. In the case of an washed surface, the sulfur 2p split disappears
and a broad peak at lower binding energy of 162.8 eV appears. This indicates that in
addition to the carboxyl group, copper is also bonded to the sulfur in sulfhydryl group (-
SH). The attachment of the TSA molecule to the copper surface is schematically shown
in Figure 4.30.
Since the cyclic voltammetry experiments indicated that TSA oxidizes at a potential of
800 mV vs. SCE, XPS measurements were carried out on the oxidized TSA film to
confirm the disulfide bonding. The film was prepared by polarizing copper film exposed
to 0.01 M TSA at pH 4 under nitrogen atmosphere, at a potential of 800 mV vs. SCE for
5 minutes. The film was transferred from an alcohol solution to the vacuum chamber, just

211
(a)
(b)
Figure 4.29: XPS spectrum of (a) carbon (C 1s) peaks and (b) oxygen (O 1s) peaks for copper surface (washed with ethanol) exposed to 0.01 M TSA and. For comparison, as received TSA standard spectrum is also shown.

212
(c)
Figure 4.29 (c): XPS spectrum of sulfur 2p peaks for copper surface (washed with ethanol) exposed to 0.01 M TSA and. For comparison, as received TSA standard spectrum is also shown.
Figure 4.30: Attachment of TSA molecule to the copper surface.
213
before recording the spectra. Since the interest was to characterize disulfide bonding,
special attention was given to the spectrum of sulfur 2p peaks.
It has been reported [4.9] that if a disulfide bonding exists, the sulfur 2p peak would
shift to higher binding energy. In addition, a typical disulfide peak is very rough in shape.
Figure 4.31 shows the spectrum with sulfur 2p peaks, obtained from the oxidized TSA
film on copper. The spectrum was recorded before and after sputtering of TSA film with
argon ions. It may be seen that before sputtering the sulfur 2p peak occurs at binding
energy of 163.6 eV. This peak is due to an un-oxidized TSA molecule adsorbing on the
oxidized film. It is important to note that there is a time lag (of about 2 to 3 minutes)
during disassembling of the sample/set-up from the electrochemical cell and transferring
to the alcohol solution. During this duration, the oxidized film remains exposed to the
TSA solution, which is perhaps responsible for adsorption of TSA molecules on the
oxidized film. Once the top layer is sputtered away, the spectrum arising from the lower
layer shows the sulfur peak shifting to a higher binding energy of 164.7 eV. This shows
evidence of disulfide bonding. Thus, it is clear that oxidation of TSA results in disulfide
formation.
It can be concluded from these results that when copper film is exposed to TSA
solution, copper complexes with TSA to form a cupric-TSA film on the surface. In the
film, copper forms a bond with the oxygen (in carboxyl group) and sulfur (in sulfhydryl
group). This cupric-TSA film forms the first layer, which is followed by adsorption of
TSA molecules. When copper is polarized at or above 800 mV, the TSA molecules are
214
oxidized to form a disulfide film. The complete structure of TSA film on the copper
surface is shown in Figure 4.32.

215
Figure 4.31: XPS spectrum of sulfur 2p peaks obtained from oxidized TSA film shown disulfide formation.
Figure 4.32: Complete structure of TSA film on the copper surface.
216
4.8. Mechanism of Passivation
Based on the results obtained from cyclic voltammetry and XPS measurements, the
mechanism of passivation of copper by thiosalicylic acid (TSA) can now be proposed. In
addition, the mechanism of passivation by benzotriazole (BTA) will be compared with
that by TSA.
Figure 4.38 shows a schematic representation of the proposed mechanism. It may be
seen that in the absence of any inhibitor, copper actively dissolves in oxalic acid solution.
The dissolution rate (as shown earlier by abrasion experiments) increases with
overpotential. At lower overpotentials (≤ 500 mV), passivation of copper by TSA occurs
in two steps. When a copper surface is exposed to oxalic acid solution containing TSA,
rapid adsorption of TSA occurs on the copper surface as shown in Figure 4.33. QCM and
XPS experiments reported earlier have shown that the adsorption of TSA is accompanied
by the simultaneous chemical bonding between copper and TSA to form a cupric-TSA
passive layer. This is followed by the physisorption of TSA on the cupric-TSA layer. The
resulting film inhibits copper dissolution in oxalic acid solution. At higher overpotentials
(> 500 mV), the adsorbed TSA molecules are oxidized to form a disulfide. This occurs by
‘fusion’ of TSA molecules, which results in the formation of a insoluble disulfide film.
Electrochemical experiments reported earlier have shown that the disulfide film remains
stable at high anodic overpotentials and inhibits copper dissolution.
In the case of BTA, at lower overpotentials (≤ 500mV), the mechanism of passivation
is similar to that by TSA. When a copper surface is exposed to solution containing BTA,
rapid adsorption of BTA molecules occurs on the copper surface to form a passive film. It

217
has been reported [4.10] that the passive film is actually a cuprous BTA film. This is
followed by physisorption of BTA on the cuprous-BTA monolayer. However, unlike
TSA, at higher overpotentials (> 500mV), no oxidation of BTA occurs and the passive
film tends to break, thereby exposing the underlying copper, resulting in dissolution. This
has also been shown in Figure 4.33.

218
Figure 4.33: Schematic representation of proposed mechanism.
219
CHAPTER 5: CONCLUSIONS AND FUTURE WORK
5.1. Conclusions
The following conclusions can be drawn from this study:
Anodic dissolution of copper in oxalic acid solutions:
1. The static etch rate of copper in oxalic acid solution increases with concentration
and the applied overpotential (η) value. Under OCP conditions, the rate is very
low of the order of 0.1 nm/min. Rates in excess of 300 nm/min were obtained in
0.3 M oxalic acid at η = 750 mV. This shows that oxalic acid is a promising
chemistry for ECMP applications.
ECMP of copper in the presence of abrasive particles:
1. Polishing of electroplated copper film in 0.1 M oxalic acid solution at pH 4 in the
presence of 1% SiO2 particles at η = 500 mV, results in a static rate of 110
nm/min and removal rate of 120 nm/min. This indicates inhibitors are required to
protect low-lying areas from dissolving rapidly.
2. In a solution containing 0.001 M BTA at pH 4, a static rate of 12 nm/min and a
polishing rate of 110 nm/min is achieved at η = 500 mV. Thus, BTA is not
effective in inhibiting static copper dissolution.

220
3. In the presence of 0.01 M thiosalicylic acid (TSA) at η = 750 mV, the static rate is
reduced to almost zero. However, the polishing rate is also reduced to 85 nm/min.
This indicates that TSA is a better inhibitor than BTA.
4. A significant effect of particle concentration (up to 1%) is observed on copper
removal rate in 0.1 M oxalic acid solution containing 0.01 M TSA at pH 4 and at
overpotential of 750 mV. The removal rate increases from 20 nm/min in the
absence of particles to 82 nm/min in the presence of 1% SiO2. A further increase
in particle concentration does not significantly influence the removal rate.
5. The copper removal rate increases with pH, for a solution containing 0.01 M TSA
and 0.1 M oxalic acid. The highest removal rate of 126 nm/min is measured at pH
6. However, a static rate of 20 nm/min is also observed. Even at pH 5, a small
static rate of 2 nm/min is recorded.
6. Polishing under galvanostatic conditions has revealed that TSA forms a resistive
film on the copper surface. Under no abrasion, the measured potential keeps
increasing to 2 V vs. SHE and does not reach a plateau. Abrasion dramatically
drops the potential to 400 mV vs. SHE, which indicate removal of passive film.
As soon as load is removed, the potential increases instantly to 1.6 V vs. SHE due
to repassivation of copper surface.
7. A higher potential of 800 mV vs. SHE is recorded during polishing, in the
absence of particles. This indicates incomplete removal of passive film. As a
result, a lower removal rate of 20 nm/min was obtained.

221
8. The best conditions for ECMP of copper in the presence of particles can be
summarized as follows:
0.1 M oxalic acid + 0.01 M TSA + 1% SiO2, pH 4, η = 750 mV and 2 psi
[Removal rate = 85 nm/min with zero static dissolution rate].
ECMP in the absence of abrasive particles:
1. Polishing of copper as a function of TSA concentration at a constant current
density of 2.1 mA/cm2, has revealed that 0.005 M TSA is enough to reduce
static etch rate to almost zero. The removal rate recorded was 240 nm/min.
The measured potential value corresponds to overpotential of 750 mV.
2. In the absence of TSA, polishing of copper in 0.3 M oxalic acid solution at pH
4 and at overpotential of 750 mV resulted in a removal rate of 320 nm/min
and a static dissolution rate of 290 nm/min.
3. In a solution containing 0.005 M BTA, the static etch rate of copper is 64
nm/min and the removal rate is 234 nm/min. This again indicates BTA does
not inhibit copper dissolution in 0.3 M oxalic acid solution.
4. The best conditions for ECMP of copper in the absence of particles can be
summarized as follows:
0.3 M oxalic acid + 0.005 M TSA, pH 4, I = 2.1 mA/cm2, and 2 psi
[Removal rate = 240 nm/min with zero static dissolution rate].
222
Conclusions from QCM Studies:
1. Quartz crystal microbalance experiments reveal that copper passivates rapidly
when exposed to oxalic acid solution containing TSA.
2. TSA is effective in inhibiting copper dissolution at high anodic overpotentials,
for oxalic acid concentrations of ≤ 0.3 M. In 0.5 M oxalic acid solution, TSA
inhibits dissolution up to overpotential of 500 mV.
3. In case of solutions containing 0.3 M oxalic acid and 0.005 M BTA at pH 4, a
decrease in mass is recorded for all overpotential values. The dissolution rate
of copper increased from ~ 0.5 nm/min at overpotentials ≤ 500 mV to 33
nm/min at 750 mV.
4. The inhibition efficiency for TSA is 100% at all overpotentials. In case BTA,
inhibition efficiency is 99% for overpotentials of 300 and 500 mV, and drops
to 88% at 750 mV. This shows that BTA is not effective in inhibiting copper
dissolution at high anodic overpotentials (≥ 750 mV).
Conclusions from cyclic voltammetry studies:
1. The oxidation potential of oxalic acid on a platinum working electrode is 1 V
vs. SCE. This value matches very well with that reported in the literature.
2. The oxidation potential of thiosalicylic acid on a platinum working electrode
is 800 mV vs. SCE. During oxidation, two TSA molecules bond together
through sulfhydryl group (-SH) to form a disulfide.

223
3. Simultaneous measurement of mass change of copper along with cyclic
voltammetry shows a sharp increase in mass from 40 μg/cm2 to 120 μg/cm2
during oxidation of TSA. This indicates that the almost zero static etch rate of
copper recorded at high overpotentials is due to oxidation of TSA to form a
disulfide.
Conclusions from XPS studies:
1. Exposure of copper surface to TSA results in the formation of cupric TSA
film with physisorbed TSA on top it. The atomic concentrations obtained from
XPS spectrum are in good correlation with the elemental ratios in copper-TSA
complex [Cu(C7H4O2S)].
2. Both sulfhydryl and carboxyl groups in TSA form bonds with copper.
3. XPS spectrum collected from the oxidized TSA surface shows a distinct peak
corresponding to presence of disulfide.
In summary, the redox inhibitor TSA performs well under ECMP conditions. At low
overpotentials, TSA molecules adsorb on the copper surface and form a cupric-TSA
passive film. At higher overpotentials, TSA oxidizes to from a disulfide film. This
inhibitor appears to be promising in replacing the more conventional triazole type
inhibitors, which break down at high overpotential values.

224
5.2. Future Work
• Study effectiveness of TSA as inhibitor in other potential ECMP chemistries such
as citric acid, glycine, etc.
• Characterize the removal rates while polishing copper in commercial ECMP tool
using the best conditions derived from this study.
• A more detail characterization must be done on the polishing of patterned copper
films under ECMP conditions using TSA as inhibitor.
• Perform removal rate measurements using the EC-AC tool with planar cathode.
• Evaluate other redox inhibitors such as thiourea for ECMP applications.

225
REFERENCES
1.1. T. McMannus, “Environmental Technology in Semiconductor Manufacturing- Challenges & Opportunities,” NSF-SRC center for Environmentally Benign Semiconductor Manufacturing Review meeting, Aug. (2004).
1.2. G. Moore, “Cramming More Components Onto Integrated Circuits,”
Electronics, 38(8), (1965).
1.3. R. Rosenberg, MRS Symposium Proceedings., 337, 33 (1994).
1.4. P. B. Zantye, A. Kumar and A. K. Sikhder, “Chemical mechanical planarization for microelectronics application,” Materials Science and Engineering R, 45, 89-220, (2004).
1.5. International Technology Roadmap for Semiconductors (Interconnects),
(2005).
1.6. P. H. Singer, Semiconductor International, p. 44, march (1992).
1.7. Personal communications with ESH department, Speedfam Corp. (Currently, Novellus).
1.8. K. Mosig, T. Jacobs, K. Brennan, M. Rasco, J. Wolf, and R. Augur,
“Integration challenges of porous ultra low-k spin-on dielectrics,” Microelectron. Eng., 64, 11-24, (2002).
1.9. F. Lanckmans et al. “A quantitative adhesion study between contacting
materials in Cu damascene structures,” Appl. Surf. Sci., 201, 20-34, (2002).
1.10. M. Fayolle, G. Pessemard, O. Louveau, F. Fulalba, and J. Cluzel. “Challenges for back end of the line for sub 65 nm generation,” Microelectron. Eng., 70, 255-266, (2002).
2.1. J. E. J. Schmitz, Chemical Vapor Deposition of Tungsten and Tungsten
Silicides for VLSI\ULSI Applications, Noyes Publications, Park Ridge (1992). 2.2. M .Bushan, R. Rouse and J. E. Lukens, J. Electrochem. Soc., 142, 3845
(1995).
2.3. M. A. Fury, Solid State Technol., p.81, May (1997).
226
2.4. W. Zhengfeng, Y. Ling, N. S. Huan, and T. P. Luan, “Chemical mechanical planarization,” SIMTech Technical Report submitted at Singapore institute of manufacturing technology (2001).
2.5. S. Sivaram, H. Bath, R. Leggett, A. Maury, K. Monnig and R. Tolles,
"Planarizing Interlevel Dielectrics by Chemical-Mechanical Polishing," Solid State Technology, 35(5), p. 87-91 (1992).
2.6. S. Sivaram, K. Monnig, R. Tolles, A. Maury and R. Leggett, "Overview of
Planarization by Mechanical Polishing of Interlevel Dielectrics," in Proceedings of the Third International Symposium on ULSI Science and Technology, Editors: J. M. Andrews and G. K. Celler, The Electrochemical Society, p. 606-613, (1991).
2.7. 472 CMP Tool, Novellus (formerly SpeedFam-IPEC), (2003).
2.8. 676 CMP Tool, Novellus (formerly SpeedFam-IPEC), (2003).
2.9. Teres CMP System, Lam Research Corp., (2003).
2.10. Suba™ Products, Rodel Corporation, 451 Bellevue Rd, Newark, DE 19713,
(2001).
2.11. IC1000 CMP Pad, Rodel Corporation, 451 Bellevue Rd, Newark, DE 19713, (2001).
2.12. P. B. Zantye, A. Kumar and A. K. Sikhder, “Chemical mechanical
planarization for microelectronics application,” Materials Science and Engineering R, 45, 89-220, (2004).
2.13. M.R. Oliver, ed., Chemical Mechanical Planarization of Semiconductor
Materials, Springer, New York, (2004).
2.14. 3M SlurryFree™ CMP, Rodel Corporation, 451 Bellevue Rd, Newark, DE 19713, (2001).
2.15. C. Raghunath, Ph.D. Dissertation, University of Arizona (1998).
2.16. M. Moinpur and A. Philipossian, MRS Symposium Proceedings, 427, 243
(1996).
2.17. Bonner, B. et. al; Proceedings of the CMP-MIC Conference. p. 572, (2001).
2.18. Maria A. Lester, Semiconductor International, May (2002).

227
2.19. Leduc, P. et. al; “CMP: Aiming for Perfect Planarization,” Proceedings of the
CMP-MIC Conference. p. 239, (2002).
2.20. Climax Engineered Materials, (Subsidiary of Phelps Doge) Arizona.
2.21. Y. Hayashi, K. Kikita and T. Kikkawa, IEEE International Electron Devives Meeting, p. 976 (1992).
2.22. K. T. Lee, Ph.D Dissertation, University of Arizona (1998).
2.23. R. J. Conotolini, A. F. Bernhardt and S. T. Mayer, J. Electrochem. Soc., 141,
2503, (1994).
2.24. Fundamentals of Chemical Mechanical Planarization, PTI Seminars, Inc.: Semiconductor & Electronic Training, 1749 Gilsinn Lane, Suite 250, Fenton, MO 63026, (2001).
2.25. J. H. Westbrook, “Hardness Temperature Characteristics of Some Simple
Glasses,” Phys. Chem. Glasses, 2, 32, (1960).
2.26. T. Izumitani, and S. Harada, “Polishing Mechanism of Optical Glasses,” Glass Technol., 12, 131, (1971).
2.27. M. Tomozawa, “Oxide CMP Mechanisms,” Solid State Technology, 40(7),
169, July (1997).
2.28. K. M. Davis, and M. Tomozawa, “An Infrared Spectroscopic Study of Water-Related Species in Silica Glass,” J. Non-Cryst. Solids, 201, 177, (1995).
2.29. M. Tomozawa, K. Yang, H. Li, and S. Murarka, “Basic Science in Silica
Glass Polishing,” in Advanced Metallization for Devices and Circuits-Science, Technology and Manufacturability, MRS Symposium Proceedings, 337, 89, (1994).
2.30. K. Rajan, Journal of Electronic Materials, 25, 1581 (1996).
2.31. F. B. Kaufman, D. B. Thompson, R. E. Broadie, M. A. Jaso, W. L. Guthrie, D.
J. Pearson and M. B. Small, "Chemical-Mechanical Polishing for Fabricating Patterned Tungsten Metal Features as Chip Interconnects," Journal of the Electrochemical Society, 138(11), p. 3460-5 (1991).

228
2.32. E. A. Kneer, Electrochemical Aspects of Chemical Mechanical Polishing of Tungsten and Aluminum, Ph.D., The University of Arizona, Tucson, AZ, (1998).
2.33. W. L. Guthrie, W. J. Patrick, E. Levine, H. C. Jones, E. A. Mehter, T. F.
Houghton, G. T. Chiu and M. A. Fury, "A Four-Level VLSI Bipolar Metallization Design With Chemical-Mechanical Planarization," IBM Journal of Research and Development, 36(5), p. 845-857 (1992).
2.34. M. B. Small and D. J. Pearson, "On-Chip Wiring for VLSI: Status and
Directions," IBM Journal of Research and Development, 34(6), p. 858 (1990).
2.35. J. M. Steigerwald, A fundamental Study of Chemical Mechanical Polishing of Copper Thin Films, PhD Thesis, Rensseler Polytechnic Institute, Troy, NY (1995).
2.36. R. Carpio, J. Farkas and R. Jairath, "Initial study on copper CMP slurry
chemistries," Thin Solid Films, 266(2), p. 238-44 (1995).
2.37. P. Delahay, M. Pourbaix and P. Van Rysselberghe, "Potential-pH diagrams," J. Chem. Education, 27, p. 683-8 (1950).
2.38. J. M. Steirgelwald, S. P. Murarka, R. J. Gutmann and D. J. Duquette,
Materials Chemistry and Physics, 41, 217, (1995).
2.39. G. B. Shinn, V. Korthuis, A. M. Wilson, G. Grover and S. Fang, "Chemical-Mechanical Polish," in Handbook of Semiconductor Manufacturing Technology, Editors: Y. Nishi, R. Doering and T. Wooldrige, Marcel Dekker, Inc., (2000).
2.40. Q. Luo, D. R. Campbell and S. V. Babu, "Chemical-Mechanical Polishing of
Copper in Alkaline Media," Thin Solid Films, 311, p. 177-182 (1997).
2.41. Q. Luo, M. A. Fury, and S. V. Babu, Proceedings 1997 CMP-MIC Conference, 83, IMIC, Tampa, (1997).
2.42. A. J. Bard, R. Parsons and J. Jordan, Standard Potentials in Aqueous Solution,
Marcel Dekker, Inc., new York, (1985).
2.43. T. Du, D. Tamboli, V. Desai and S. Seal, Journal of The Electrochemical Society, 151, (4) G230-G235, (2004).

229
2.44. H. Hirabayashi, M. Higuchi, M. Kinoshita, H. Kaneko, N. Hayasaka, K. Mase, and J. Oshima, Proceedings 1996 CMP-MIC Conference, 119, IMIC, Tampa, (1996).
2.45. R. J. Small, L. McGhee, D. J. Maloney and M. L. Peterson, "Redox slurries
for chemical-mechanical polishing of semiconductor wafers and related circuit boards," Wo Patent 9804646, EKC Technology, Inc., 47 pp., (1998).
2.46. R. J. Small, L. McGhee, D. J. Maloney and M. L. Peterson, "Chemical
Mechanical Polishing Composition and Process," US Patent 6313039, EKC Technology, Inc, (2001).
2.47. R. J. Small, L. McGhee, D. J. Maloney and M. L. Peterson, "Chemical
Mechanical Polishing Composition and Process," US Patent 6117783, EKC Technology, Inc, (2000).
2.48. M. L. Peterson, R. J. Small, G. A. S. III, Z. J. Chen and T. Truong,
"Investigating CMP and post-CMP cleaning issues for dual-damascene copper technology," MICRO, 17(1), p. 27-34, (1999).
2.49. M. L. Peterson, R. J. Small, T. Truong and J.-Y. Lee, "Challenges of
Electroplated Copper Film and Device Characteristics for Copper Slurry Design," Semiconductor Fabtech, 11, p. 283-287, (2000).
2.50. M. van der Puy and J. H. Dimmit, Hydroxylamine: Redox Properties of
Hydroxylamines, Part 1, Inorganic Reactions, AlliedSignal Inc., (1985).
2.51. S. Tamilmani, Ph. D. Dissertation, University of Arizona, (2005).
2.52. M. K. Carter and R. J. Small, Journal of The Electrochemical Society, 150, (2), G107-G111, (2003).
2.53. W. H. Huang, Ph.D Dissertation, University of Arizona, (2004).
2.54. K. Osseo-Asare, A. T. Al-Hinai, Chemical Mechanical Planarization IV, 191-
200, The Electrochemical Society Proceedings Series, Pennington, NJ., (2001).
2.55. Q. Luo, “Copper dissolution behavior in acidic iodate solutions,” Langmuir 16, 5154 (2000).
2.56. S. M. Lee, U. Mahajan, Z. Chen, and R. K. Singh, “Fundamental Studies of
Iodate and Iodine Based Slurries for Copper CMP,” Mat. Res. Soc. Symp. Proc., 613, E7.8.1-E7.8.6, (2000).

230
2.57. T. Du, and V. Desai, “The pH Effect on Chemical Mechanical Planarization of Copper,” Mat. Res. Soc. Symp. Proc., 767, F6.6.1-F6.6.6, (2003).
2.58. S. Hegde, U. B. Patri, and S. V. Babu, “Chemical Mechanical Polishing of
Copper Using Molybdenum Dioxide Slurry,” J. Mater. Res., 20(9), 2553-2561, (2005).
2.59. M. R. Oliver, “Chemical Mechanical Planarization of Semiconductor
Materials,” Springer Materials Science Series, New York, (2004).
2.60. P. Josh Wolf, “Overview of Dual-Damascene Cu/Low-k Interconnect,” Presentation at ERC Retreat, Stanford, (2003).
2.61. International Technology Roadmap for Semiconductors (Interconnects),
(2005).
2.62. W. S. Stavropoulos, M. McClear, G. S. Bauer, and L. A. Robinson, Future Fab International, 16, (2003).
2.63. K. Hijioka, F. Ito, M. Tagami, H. Ohtake, Y. Harada, T. Takeuchi, S. Saito,
and Y. Hayashi,” Japanese J. of Appl. Phys., 43(4B), 1807-1812, (2004).
2.64. M. Kodera, S. Uekusa, H. Nagano, K. Tokushige, S. Shima, A. Fukunaga, Y. Mochizuki, A. Fukuda, H. Hiyama, M. Tsujimura, H. Nagai, and K. Maekawa, “Stress Corrosion Cracking of Copper Interconnects during CMP with a Cu/Porous Low-k Structure,” J. Electrochem. Soc., 152(6), G506-G510, (2005).
2.65. V. McGahay, “Challenges in Cu/Low k Integration for Multilevel BEOL
Wiring,” Presented at NCCAVS Joint CMP/TF/PE User Group Meeting, Sunnyvale, CA, (2004).
2.66. N. Kobayashi, “65nm Low-k/Cu Interconnect – Porous Low-k for
Manufacturing,” Presented at Selete Symposium, (2004).
2.67. M. Armacost, and J. T. C. Lee, “Copper/Low-k Advanced Process Technology Interconnect Integration Challenges,” Solid State Technology, 28-32, (2005).
2.68. C. L. Borst, S. M. Smith, and M. Eissa, “Challenges and Rewards of Low-
Abrasive Copper CMP: Evaluation and Integration for Single-Damascene Cu/Low-k Interconnects for the 90nm Node,” Mat. Res. Soc. Symp. Proc., 816, K1.1.1-K1.1.12, (2004).

231
2.69. T. Mourier, K. Haxaire, M. Cordeau, P. Chausse, S. DaSilva, and J. Torres, “Electrochemical Mechanical Deposition and Reverse Linear Planarization of Copper for 45nm Node ULK Integration,” Proceedings of Advanced Metallization Conference, San Diego, CA, 597-602, (2005).
2.70. L. Economikos, NSF-SRC center for Environmentally Benign Semiconductor
Manufacturing Review meeting, Aug. (2004).
2.71. L. Chen, “Breakthrough Technology for CMP”, Semiconductor fabtech, 24th edition, 137- 141, (2004).
2.72. I. I. Suni, and B. Du, “Cu Planarization for ULSI Processing by
Electrochemical Methods: A Review,” IEEE Transactions on Semiconductor Manufacturing, 18(3), 341-349, (2005).
2.73. L. Economikos et al., “Integrated Electro-Chemical Mechanical Planarization
(ECMP) for Future Generation Device Technology,” Proceedings of IITC, 233- 235, June (2004).
2.74. F. Q. Liu, L. Chen, A. Duboust, S. Tsai, A. Manens, Y. Wang, and W. Y. Hsu,
“High Planarization Efficiency and Wide Process Window Using Electro-chemical Mechanical Planarization (ECMP),” Mat. Res. Soc. Symp. Proc., 867, W9.1.1-W9.1.10, (2005).
2.75. T. Nogami, A. Yoshio, and K. Sato, “Methods for Producing Semiconductor
Device Polishing Apparatus, and Polishing Method,” U.S. Patent 6 693 036, Feb. 17, (2004).
2.76. M. Bojinov, “Modelling the Formation and Growth of Anodic Passive Films
on Metals in Concentrated Acid Solutions,” J. Solid-Sate Electrochem., 1, 161-171, (1997).
2.77. F. Q. Liu, L. Chen, A. Duboust, S. Tsai, A. Manens, Y. Wang, and W. Y. Hsu,
“Smoothly Does It,” European Semicondutor, (2005).
2.78. Y. Wada, I. Noji, I. Kobata, T. Kohama, A. Fukunaga, and M. Tsujimura, “The Enabling Solution of Cu/Low-k Planarization Technology, Proceedings of IITC, June (2005).
2.79. S. Kondo, S. Tominaga, A. Namiki, K. Yamada, D. Abe, K. Fukaya, M.
Shimada, and N. Kobayashi, “Novel Electro-Chemical Mechanical Planarization Using Carbon Polishing Pad to Achieve Robust Ultra low-k/Cu Integration,” Proceedings of IITC, June (2005).

232
2.80. J. Huo, R. Solanki, and J. McAndrew, “Electrochemical Planarization of Patterned Copper Films for Microelectronic Applications,” J. Mater. Eng. Perform., 13(4), 413-420, (2004).
2.81. J. Huo, R. Solanki, and J. McAndrew, “Study of Anodic Layers and Their
Effects on Electropolishing of Bulk and Electroplated Films of Copper,” J. Appl. Electrochem., 34, 305-314, (2004).
2.82. S. C. Chang, J. M. Shieh, C. C. Huang, B. T. Dai, Y. H. Li, and M. S. Feng,
“Microleveling Mechanisms and Applications of Electropolishing on Planarization of Copper Metallization,” J. Vac. Sci. Technol. B, 20(5), 2149-2153, (2002).
2.83. S. C. Chang et al., “Superpolishing for Planarizing Copper Damascence
Interconnects,“ Electrochemical and Solid State Letters, 6(5), G72-G74, (2003).
2.84. P. C. Goonetilleke, and D. Roy, “Electrochemical-Mechanical Planarization
of Copper: Effects of Chemical Additives on Voltage Controlled Removal of Surface Layers in Electrolytes,” Materials Chemistry and Physics, 94, 388-400, (2005).
2.85. P. C. Goonetilleke, S. V. Babu, and D. Roy, “Voltage-Induced Material
Removal for Electrochemical Mechanical Planarization of Copper in Electrolytes Containing NO3
-, Glycine, and H2O2,” Electrochemical and Solid State Letters, 8(8), G190-G193, (2005).
2.86. Q. Luo, D. R. Campbell and S. V. Babu, "Chemical-Mechanical Polishing of
Copper in Alkaline Media," Thin Solid Films, 311, p. 177-182 (1997).
2.87. R. Carpio, J. Farkas and R. Jairath, " Initial study on copper CMP slurry chemistries," Thin Solid Films, vol. 266, pp. 238-244, (1995).
2.88. D. R. Evans, " Electrochemical Interaction between Copper and Barrier
Materials Using Chemical Mechanical Polishing," Chemical Mechanical Planarization I, S. Raghavan and I. Ali, Eds., The Electrochemical Society Proceedings Series, Pennington, NJ., PV. 96-22, pp. 70-78, (1996).
2.89. T. Du, D. Tamboli, V. Desai and S. Seal, Journal of The Electrochemical
Society, 151, (4) G230-G235, (2004).
2.90. S. Tamilmani, “Dissolution, Corrosion and Environmental Issues in Chemical Mechanical Planarization of Copper,” Ph. D. Dissertation, University of Arizona, (2005).

233
2.91. J. M. Steirgelwald, S. P. Murarka, R. J. Gutmann, Chemical Mechanical
Planarization of Microelectronic Materials, John Wiley & Sons, NY (1997).
2.92. J. M. Steirgelwald, S. P. Murarka, R. J. Gutmann and D. J. Duquette, Materials Chemistry and Physics, 41, 217, (1995).
2.93. D. Chopra, WO Patent 00/28586, (2000).
2.94. D. Mahulikar, WO Patent 00/24842, (2000).
2.95. G. W. Poling, Corros. Sci., 10, p.359, (1970).
2.96. V. Brusic, M. A. Frisch, B. N. Eldridge, F. P. Novak, F. V. Kaufman, B. M.
Rush and G. S. Frankel, J. Electrochem. Soc., 138, p.2253, (1991).
2.97. H. Y. H. Chan, and M. J. Weaver, “A Vibrational Structural Analysis of Benzotriazole Adsorption and Phase Film Formation on Copper Using Surface-Enhanced Raman Spectroscopy,” Langmuir, 15, 3348-3355, (1999).
2.98. J. M. Bastidas, P. Pinilla, J. L. Polo, and E. Cano, “Adsorption of
Benzotriazole on Copper Electrode Surfaces in Citric Acid Media,” Corrosion, 58(11), 922-931, (2002).
2.99. D. A. Johnson, and F. Y. Lu, “New Insights Into the Application and
Mechanism of Yellow Metal Corrosion Inhibitors,” Proceedings of the 8th European Symposium on Corrosion Inhibitors (8 SCIE) Ann. Univ. Ferrara, N.S., Sez. V, Suppl, N. 10, (1995).
2.100. M. R. Vogt, F. A. Mller, C. M. Schilz, O. M. Magnussen, and R. J. Behm,
Surf. Sci., 367, L33, (1996).
2.101. M. R. Vogt, A. Lachenwitzer, O. M. Magnussen, and R. J. Behm, Surf. Sci., 399, 49, (1996).
2.102. S. Tamilmani, Ph. D. Dissertation, University of Arizona, (2005).
2.103. R. M. Paine, and B. Srinivasan, “Metals Handbook,” 9th Edition, Vol. 5, 611,
American Society for Metals, Ohio, (1982).
2.104. J. M. Bastidas, and E. Otero, “A comparative Study of Benzotriazole and 2-amino-5-mercapto-1,3,4-thiadiazole as Copper Corrosion Inhibitors in Acid Media,” Materials and Corrosion, 47, 333-337, (1996).

234
2.105. E. Otero, and J. M. Bastidas, “Cleaning of Two Hundred Year Old Copper Works of Art Using Citric Acid With and Without Benzotriazole and 2-amino-5-mercapto-1,3,4-thiadiazole,” Materials and Corrosion, 47, 133-138, (1996).
2.106. H. Otmačić, and E. Stupnišek-Lisac, “Copper Corrosion Inhibitors in Near
Neutral Media,” Electrochimica Acta, 48, 985-991, (2003).
2.107. Y. Hong, D. Roy, and S. V. Babu, “Ammonium Dodecyl Sulfate as a Potential Corrosion Inhibitor Surfactant for Electrochemical Mechanical Planarization of Copper,” Electrochemical and Solid State Letters, 8(11), G297-G300, (2005).
2.108. M. S. Abu-Bakr, “Complexation Equilibria Between Copper(II) and
Thiosalicylic Acid. Spectrophotometric Determination of Copper in Non-Ferrous Alloys,” Monatshefte fűr Chemie, 128, 563-570, (1997).
2.109. J. C. Kotz, and K. F. Purcell, Chemistry and Chemical Reactivity, 1038,
Sounders College Publishing, Philadelphia, PA, (1991).
2.110. D. Panias, M. Taxiarchou, I. Paspaliaris, and A. Kontopoulos, Hydrometallurgy, 42, 257, (1996).
2.111. H. Strasser, W. Burgstaller, and F. Schinner, FEMS Microbiol. Lett., 119, 365,
(1994).
2.112. M. Humar, F. Pohleven, and M. Sentjurc, Wood Sci. Technol., 37, 463, (2004).
2.113. R. N. Sahoo, P. K. Naik, and S. C. Das, Hydrometallurgy, 62, 157, (2001).
2.114. S. Aksu, “Electrochemistry of Copper in Aqueous Oxalic Acid Solutions,” J.
Electrochem. Soc., 152(12), G938-G943, (2005).
2.115. V. R. K. Gorantla, A. Babei, S. Pandija, and S. V. Babu, “Oxalic Acid as a Complexing Agent in CMP Slurries for Copper,” Electrochemical and Solid State Letters, 8(5), G131-G134, (2005).
3.1. H.-H. Huang, STABCAL, Metallurgical Engineering, Montana Tech, Butte,
MT 59701, ver. 2000, PC Windows, (2000). 3.2. M. L. Mavrovouniotis, Biotechnology and Bioengineering., 36, pp. 1070,
(1990).
235
3.3. M. L. Mavrovouniotis, The Journal of Biological Chemistry., Vol. 266, No 22, Issue of August 5, pp. 14440, (1991).
3.4. A. E. Martell and R. M. Smith, Critical stability constants, Plenum, New York
(1974).
3.5. H. D. Brown, Biochemical microcalorimetry, p. 310, Academic press, New York (1969).
3.6. R. Carpio, J. Farkas and R. Jairath, "Initial study on copper CMP slurry
chemistries," Thin Solid Films, 266(2), p. 238-44, (1995).
3.7. M. Hariharaputhiran, S. Ramarajan, Y. Li and S. V. Babu, "Mechanism of Cu removal during CMP in H2O2-glycine based slurries," in Chemical-Mechanical Polishing--Fundamentals and Challenges, Materials Research Society Symposium Proceedings, p. 129-134, (2000).
3.8. S.-M. Lee, U. Mahajan, Z. Chen and R. K. Singh, "Study of Slurry Chemistry
in Chemical Mechanical Polishing (CMP) of Copper," in Chemical Mechanical Planarization in IC Device Manufacturing III, Editors: R. L. Opila, I. Ali, Y. A. Arimoto, Y. Homma, C. Reidsema-Simpson and K. B. Sundaram, Proc. - Electrochem. Soc., p. 187-192, (2000).
3.9. Y. Li, M. Hariharaputhiran and S. V. Babu, "Chemical-mechanical polishing
of copper and tantalum with silica abrasives," Journal of Materials Research, 16(4), p. 1066-1073, (2001).
3.10. V. Brusic, "Cu Corrosion Mechanisms and Control," in Advanced
Metallization Conference 2000, Proceedings of the Conference, San Diego, CA, United States, Oct. 2-5 and University of Tokyo, Tokyo, Japan, Oct. 19-20, 2000, p. 127-135, (2000).
3.11. J. A. V. Butler, "Studies in heterogeneous equilibria. II. The kinetic
interpretation of the Nernst theory of electromotive force," Trans. Faraday Soc. (advance proof), (1924).
3.12. J. A. V. Butler, "Studies in heterogeneous equilibria. III. A kinetic theory of
reversible oxidation potential at inert electrodes," Trans. Faraday Soc. (advance proof), (1924).
3.13. T. Erdey-Gruz and M. Volmer, "The theory of hydrogen overvoltage," Z.
physik. Chem., 150(Abt. A), p. 203-13, (1930).

236
3.14. C. M. A. Brett and A. M. O. Brett, Electrochemistry: principles, methods, and applications, Oxford science publications., Oxford University Press, Oxford ; New York, xxviii, 427, (1993).
3.15. J. Tafel, Z. Phys. Chem. (Leipzig), 50, p. 641, (1904).
3.16. M. G. Fontana, Corrosion Engineering, 3rd ed, McGraw-Hill, New York,
(1986).
3.17. W. H. Huang, “Fundamental Studies on the Removal of Copper in Hydroxylamine Based Chemistries of Interest to Chemical Mechanical Planarization”, Ph.D dissertation, University of Arizona, (2003).
3.18. J. O’M. Bockris, A. K. N. Reddy, and M. Gamboa-Aldeco, “Modern
Electrochemistry,” 2nd Edition, Kluwer Academic Publisher, New York, (2003).
3.19. Operation manual, Research Quartz Crystal Microbalance, MAXTEK Inc.,
CA., (2004).
3.20. Operation Manual, LORESTA AP Super-Intelligent Resistivity Meter, Mitsubishi, Japan, (2003).
4.1. M. S. Abu-Bakr, “Complexation Equilibria Between Copper(II) and
Thiosalicylic Acid. Spectrophotometric Determination of Copper in Non-Ferrous Alloys,” Monatshefte fűr Chemie, 128, 563-570, (1997).
4.2. E. G. Ferrer, P. A. M. Williams, E. E. Castellano, and O. E. Piro, “On a Novel
Synthesis of 2-Sulfonatobenzoic Acid by Oxidation of Thiosalicylic Acid Catalyzed by Copper(II): A Structural Study,” Z. Anorg. Allg. Chem., 628, 1979-1984, (2002).
4.3. T. A. Ivandini, Y. Naono, A. Nakajima, and Y. Einaga, “Gold-nanoparticle-
dispered Boron-doped Diamond Electrodes for Electrochemical Oxidation of Oxalic Acid,” Chemistry Letters, 34(8), 1086-1087, (2005).
4.4. M. J. Chollier, F. Epron, E. Lamy-Pitara, and J. Barbier, “Catalytic Oxidation
of Maleic and Oxalic Acids Under Potential Control of Platinum Catalysts,” Catalysis Today, 48, 291-300, (1999).
4.5. S. Shahrokhian, and J. Yazdani, “Electrocatalytic Oxidation of Thioglycolic
Acid at Carbon Paste Electrode Modified with Cobalt Phthalocyanine: Application as a Potentiometric Sensor,” Electrochimica Acta, 48, 4143-4148, (2003).

237
4.6. F. G. Bordwell, X. M. Zhang, A. V. Satish, and J. P. Cheng, “Assessment of
the Importance of Changes in Ground-State Energies on the Bond Dissociation Enthalpies of the O-H Bonds in Phenols and the S-H Bonds in Thiophenols,” J. Am. Chem. Soc., 116, 6605-6610, (1994).
4.7. J. Kirchnerova, and W. C. Purdy, “The Mechanism of the Electrochemical
Oxidation of Thiourea,” Analytica Chimica Acta, 123, 83-95, (1981).
4.8. A. E. Bolzan, R. C. V. Piatti, R. C. Salvarezza, and A. J. Arvia, “Electrochemical Study of Thiourea and Substituted Thiourea Adsorbates on Polycrystalline Platinum Electrodes in Aqueous Sulfuric Acid,” J. Appl. Electrochem., 32, 611-620, (2002).
4.9. J. F. Moulder, W. F. Stickle, P. E. Sobol, and K. D. Bomben, “Handbook of
X-ray Photoelectron Spectroscopy: A Reference Book for Standard Spectra for Identification and Interpretation of XPS Data,” Physical Electronics; Reissue Edition (1995).
4.10. S. Tamilmani, Ph. D. Dissertation, University of Arizona, (2005).