an electromagnetic–thermal coupling numerical study of the
TRANSCRIPT

applied sciences
Communication
An Electromagnetic–Thermal Coupling NumericalStudy of the Synchronous Generator withSecond-Generation High-TemperatureSuperconducting Armatures
Xiangyu Huang 1, Zhen Huang 1,*, Xiaoyong Xu 1, Wan Li 2 and Zhijian Jin 1
1 School of Electronic Information and Electrical Engineering, Shanghai Jiao Tong University,Shanghai 200240, China; [email protected] (X.H.); [email protected] (X.X.);[email protected] (Z.J.)
2 Shanghai Marine Equipment Research Institute, Shanghai 200031, China; [email protected]* Correspondence: [email protected]
Received: 2 July 2020; Accepted: 27 July 2020; Published: 29 July 2020�����������������
Abstract: Generators with high-temperature superconducting armatures have an advantage in the factthat they can carry high currents. However, the AC loss of high-temperature superconducting (HTS)armatures is difficult to calculate precisely because HTS coils exist in a complex and time-varyingelectromagnetic environment. In addition, when the HTS coil is carrying a short circuit faultovercurrent, an electromagnetic–thermal simulation study of this process is required to ensure thatthe HTS coil is not damaged. In this paper, first, a fully coupled T-A formulation model is usedto calculate the AC loss of HTS armatures. Then, the current and temperature distributions aresimulated, considering the intrinsic characteristic of superconducting coated conductors, when thegenerator suffers the worst short circuit fault accidently. It is found that the turn with the lowestcritical current quenches after 0.01 s, but the temperature rise cannot damage the coil if the circuitbreaker can clear the fault quickly. The effects of the copper stabilizer thickness on the thermalstability of the HTS coil during the worst short circuit fault are also investigated. A thicker copperstabilizer improves the thermal stability of the HTS coil in the event of a short circuit fault, but the useof a simulation model is needed to make trade-offs between the engineering current density and thethermal stability of the HTS tapes. The work in this paper is necessary and can provide an importantreference for manufacturing superconducting generators.
Keywords: AC loss; short circuit faults; T-A formulation; HTS generator
1. Introduction
Second-generation (2G) high-temperature superconducting (HTS) generators are promising becausethey can achieve a higher power density compared to conventional generators [1]. For synchronousgenerator applications, HTS coils placed in the stator have an advantage in terms of static cooling,but HTS coils will suffer AC loss because they are under alternating magnetic fields and currents.
The AC loss of an isolated HTS coil has been studied by many groups [2–6]. To calculate the ACloss of HTS coils in the actual generator environment, a two-stage segregated model consisting of amachine model and an AC loss model has been proposed [7] and used [8,9]. The rotating machine isfirst simulated by the A-formulation, and then the HTS coil is simulated by the H-formulation [10],with the boundary condition calculated from the A-formulation model.
The T-A formulation model [11,12] can fully couple the A-formulation model of the generatorand the HTS coil model. The efficiency of the T-A formulation model is higher than the H-formulation
Appl. Sci. 2020, 10, 5228; doi:10.3390/app10155228 www.mdpi.com/journal/applsci

Appl. Sci. 2020, 10, 5228 2 of 15
model due to the decrease in the degrees of freedom [11]. Moreover, the T-A formulation model candirectly achieve the fully coupled simulation of the HTS coils under the generator’s electromagneticenvironment because rotating generators are usually simulated by the A-formulation [13].
When a short circuit fault happens, the magnetic field on the surface of the HTS coils and thecurrent flowing in the coils will change drastically and cause a greater AC loss. The ohmic loss alsooccurs when the current exceeds the critical current of the coils. If the cooling capacity of the cryocooleris not enough to remove the heat immediately, the HTS coils may be permanently damaged [14].To understand whether the short circuit fault will cause permanent damage to HTS coils, conductingan electromagnetic thermal coupling simulation is of great importance. It should be considered thatthese factors will have an effect on HTS materials, including the magnetic field, the current andthe temperature.
To date, some numerical simulations of the short circuit faults of HTS generators have beendone [15–19]. However, none of these simulations achieves fully coupled simulations, considering thedependence of the critical current density on the temperature and the magnetic field.
The main novelty of this paper is to conduct an electromagnetic–thermal coupling numericalstudy of a synchronous generator with 2G HTS armatures. In Section 2, the field–circuit thermalcoupled model is introduced. In Section 3, the parameters of the HTS generator and the HTS coilsare introduced. In Section 4, the model is first used to calculate the AC loss of the stator HTS coilsunder the rated condition of the generator. Then, the transient electromagnetic–thermal behavior ofthe HTS coils under a sudden three-phase short circuit fault at the no-load operation will be studied.This situation causes a maximum peak short circuit current, which is the worst case for the HTS coil.Moreover, the effects of the copper stabilizer thickness on the thermal stability of the HTS coil at theworst short circuit fault will also be investigated. Finally, our conclusions are drawn in Section 5.
2. Formulation and Model
To consider the complex anisotropy of YBCO tapes in our numerical model, the dependence of thecritical current density on the magnetic flux density B and the temperature T is expressed as [4,20–22]:
Jc(B, T) = Jc0 JcB(Bpar, Bper)JcT(T) (1)
JcB(Bpar, Bper) =1
(1 +√(kBpar)
2 + Bper2/Bc)b
(2)
JcT(T) = Jc(T) =
(Tc−T)(Tc−T0)
T < Tc
0 T ≥ Tc(3)
where Bpar and Bper represent the magnetic field component parallel and perpendicular to the tapesurface, respectively. Jc0 is the self-field critical current density at the operating temperature. b, kand Bc are the curve-fitting parameters. Tc = 92 K is the critical temperature. T0 = 77 K is theoperating temperature.
It is important to note that Equations (2) and (3) are only an approximate expression of thedependence of the critical current density on the magnetic flux density and the temperature. The actualproperties of the HTS tapes will not follow these expressions completely.
The superconducting layer resistivity is calculated by the E–J power law relation [23]:
ρ(J) =E0
Jc(B, T)
∣∣∣∣∣∣ JJc(B, T)
∣∣∣∣∣∣(n−1)
(4)
where E0 is the critical electrical field, which is usually set as 10−4 V/m. n is the critical exponent.

Appl. Sci. 2020, 10, 5228 3 of 15
2.1. The Field Model
The current density vector potential T is defined in the superconducting layer to solve the currentdensity distribution in HTS-coated conductors:
J = ∇× T (5)
As can be seen in Figure 1, set the current density vector potential of the endpoint on one side ofeach HTS tape as zero, and the boundary condition for the 2-D T-formulation is:
Isu =
∫l
Jzdl==
∫l
−∂T∂y
dx = −(T1 − T2) = −T1 (6)
where Isu is the superconducting layer current of the HTS coil.
Appl. Sci. 2020, 10, x FOR PEER REVIEW 3 of 15
2.1. The Field Model
The current density vector potential T is defined in the superconducting layer to solve the
current density distribution in HTS-coated conductors:
=J T (5)
As can be seen in Figure 1, set the current density vector potential of the endpoint on one side
of each HTS tape as zero, and the boundary condition for the 2-D T-formulation is:
1 2 1== = - ( ) su z
l l
TI J dl dx T T T
y
(6)
where Isu is the superconducting layer current of the HTS coil.
Figure 1. Schematic diagram for the 2-D T-A formulation, the topology of the generator and the
numbering sequence of each turn of the studied coil.
In all domains of the generator, the magnetic vector potential A is defined and the A-formulation
is used:
= all domainsB A (7)
superconucting layers1( )
copper layerscu
TA
J (8)
= ( ) superconucting layersJt
AT (9)
where Jcu is the copper layer current density of the HTS coil, calculated by coupling with the circuit
part (introduced in Section 2.2). μ is the permeability of the material. The relative permeability for all
the materials in the model is one.
The boundary condition for the A-formulation is set as:
Figure 1. Schematic diagram for the 2-D T-A formulation, the topology of the generator and thenumbering sequence of each turn of the studied coil.
In all domains of the generator, the magnetic vector potential A is defined and the A-formulationis used:
B = ∇×A all domains (7)
1µ∇× (∇×A) =
∇× T superconucting layers
Jcu copper layers(8)
−∂A∂t
= ρ(J)∇× T superconucting layers (9)
where Jcu is the copper layer current density of the HTS coil, calculated by coupling with the circuitpart (introduced in Section 2.2). µ is the permeability of the material. The relative permeability for allthe materials in the model is one.

Appl. Sci. 2020, 10, 5228 4 of 15
The boundary condition for the A-formulation is set as:
A = 0 (10)
2.2. The Circuit Model
The equivalent circuit model of the whole superconducting synchronous generator is shown inFigure 2. For the stator windings, since the three-phase stator windings are symmetrical, only thevariables related to the phase-A winding are explained.
Appl. Sci. 2020, 10, x FOR PEER REVIEW 4 of 15
A 0 (10)
2.2. The Circuit Model
The equivalent circuit model of the whole superconducting synchronous generator is shown in
Figure 2. For the stator windings, since the three-phase stator windings are symmetrical, only the
variables related to the phase-A winding are explained.
Figure 2. Schematic diagram for the equivalent circuit model of the high-temperature
superconducting (HTS) generator.
The circuit equation of the phase-A is:
AA LA A LA
diU R i L
dt (11)
where UA, LLA, RLA, iA are the output voltage, the load inductance, the load resistance and the current
of the phase-A winding, respectively.
For the HTS winding, it can be seen as a series of turns (right part of the Figure 2), and the circuit
equations are [24]:
1
,
, 0
, ,
,
,
,
,
, ,
1 , ,
, ,
, , ,
( , )
( )
( )
n
su k
su k kn
c su k su k
cu cu k k
cu k
cu
Nsu k cu k
A k k
k su k cu k
z
k
k
k
k su k cu k
k
cu ksu k su k cu k
i
R RU e i
R R
E dS
e LS
i i i
R i
R E lI B
TR
S
R i
T
l
(12)
where the subscript k represents the k-th turn of the HTS coil. N is the total number of turns of the
coil. ek is the generated electromotive force. Ez is the electric field strength in the coil domain. Sk is the
cross-sectional area of the conductor. L is the core length. ik is the total current. i, R and T represent
the current, the resistance and the temperature, respectively. The subscript su and cu represent the
superconducting layer and copper layer, respectively. Bsu,k is the magnetic flux density in the
superconducting layer. lk is the tape length. ρcu is the copper layer resistivity which is from [25]. Scu,k
is the cross-section area of the copper layer.
2.3. The Thermal Model
The governing equation of the heat transfer model in the HTS coil is [25,26]:
Figure 2. Schematic diagram for the equivalent circuit model of the high-temperature superconducting(HTS) generator.
The circuit equation of the phase-A is:
UA = RLAiA + LLAdiAdt
(11)
where UA, LLA, RLA, iA are the output voltage, the load inductance, the load resistance and the currentof the phase-A winding, respectively.
For the HTS winding, it can be seen as a series of turns (right part of the Figure 2), and the circuitequations are [24]:
UA =N∑
k=1(ek − ik
Rsu,kRcu,kRsu,k+Rcu,k
)
ek =
∫k
EzdS
SkL
ik = isu,k + icu,k
Rsu,k = E0isu,k
n−1
Ic(Bsu,k,Tsu,k)n lk
Rcu,k =ρcu(Tcu,k)lk
Scu,k
Rsu,kisu,k = Rcu,kicu,k
(12)
where the subscript k represents the k-th turn of the HTS coil. N is the total number of turns ofthe coil. ek is the generated electromotive force. Ez is the electric field strength in the coil domain.Sk is the cross-sectional area of the conductor. L is the core length. ik is the total current. i, R andT represent the current, the resistance and the temperature, respectively. The subscript su and curepresent the superconducting layer and copper layer, respectively. Bsu,k is the magnetic flux density inthe superconducting layer. lk is the tape length. ρcu is the copper layer resistivity which is from [25].Scu,k is the cross-section area of the copper layer.
2.3. The Thermal Model
The governing equation of the heat transfer model in the HTS coil is [25,26]:

Appl. Sci. 2020, 10, 5228 5 of 15
dC∂T∂t
+∇ · (−k∇T) = Qsu + Qcu (13)
where d, C and k are the mass density, the heat capacity and the thermal conductivity of the materialsof each layer of the HTS coil, respectively. The material properties of the Kapton layer are from [26]and other layers are from [25].
The magnetization loss density Qsu is generated in the superconducting layers. The ohmic lossdensity Qcu is generated in the copper layer, and it is caused by the shunting of the copper layer, whichwill occur after the total current exceeds the critical current of the HTS tapes.
The distribution of the same kind of loss in each turn is non-uniform because, in the currentdistribution, the magnetic field distribution and the temperature distribution of each turn are different.The values of these heat sources for each turn need to be calculated by coupling with the field modeland the circuit model introduced previously:
Qsu = E(J)J · J
Qcu,k =i2cu,kRcu,k
Scu,klk
(14)
During the operation of the HTS machine, the cryocooler will take away a certain amount ofheat in coils. However, in order to estimate the most serious consequences of short circuit faultsconservatively, the adiabatic boundary condition is set on the surface of the coils.
The coupling relationship among the field, circuit and thermal model of the HTS coils issummarized in Figure 3:
Appl. Sci. 2020, 10, x FOR PEER REVIEW 5 of 15
(- ) su cu
TdC k T Q Q
t
(13)
where d, C and k are the mass density, the heat capacity and the thermal conductivity of the materials
of each layer of the HTS coil, respectively. The material properties of the Kapton layer are from [26]
and other layers are from [25].
The magnetization loss density Qsu is generated in the superconducting layers. The ohmic loss
density Qcu is generated in the copper layer, and it is caused by the shunting of the copper layer,
which will occur after the total current exceeds the critical current of the HTS tapes.
The distribution of the same kind of loss in each turn is non-uniform because, in the current
distribution, the magnetic field distribution and the temperature distribution of each turn are
different. The values of these heat sources for each turn need to be calculated by coupling with the
field model and the circuit model introduced previously:
2
,
,
,
,
( )su
cu k cu k
c
cu
u
k
k
k
Q E J
i R
S lQ
J J
(14)
During the operation of the HTS machine, the cryocooler will take away a certain amount of heat
in coils. However, in order to estimate the most serious consequences of short circuit faults
conservatively, the adiabatic boundary condition is set on the surface of the coils.
The coupling relationship among the field, circuit and thermal model of the HTS coils is
summarized in Figure 3:
Figure 3. Schematic diagram for the coupling relationship among the field, circuit and thermal model.
The field model uses the temperature distribution calculated from the thermal model, and the
current values of the superconducting layers and copper layers calculated from the circuit model, to
calculate the magnetization loss of the superconducting layers, the magnetic field distribution, and
the generated electromotive force of the HTS coils. The circuit model uses the temperature
distribution calculated from the thermal model, and the magnetic field distribution calculated from
the field model, to calculate the current values of the superconducting layers and copper layers and
the copper layer loss.
All these models are implemented in the COMSOL Multiphysics software.
3. Parameters
The topology of the studied HTS generator is shown in Figure 1, each phase is composed of two
coils in parallel. For example, the phase A winding consists of two coils: A1 and A2. A1+ and A1− are
the positive current domain and the negative current domain of the A1 coil, respectively.
The studied generator has four poles and six slots. Each slot has one double racetrack coil with
84 turns. The rated current of these HTS field coils is about 37 A and the rated output power is 30
Kw. The generator is designed to operate at 1500 rpm, corresponding to a stator armature frequency
of 50 Hz. Other design parameters for the generator can be found in a previous paper [27]. The
parameters of the HTS coils are summarized in Table 1. b, k and Bc are calculated by fitting the
Figure 3. Schematic diagram for the coupling relationship among the field, circuit and thermal model.
The field model uses the temperature distribution calculated from the thermal model, and thecurrent values of the superconducting layers and copper layers calculated from the circuit model,to calculate the magnetization loss of the superconducting layers, the magnetic field distribution,and the generated electromotive force of the HTS coils. The circuit model uses the temperaturedistribution calculated from the thermal model, and the magnetic field distribution calculated from thefield model, to calculate the current values of the superconducting layers and copper layers and thecopper layer loss.
All these models are implemented in the COMSOL Multiphysics software.
3. Parameters
The topology of the studied HTS generator is shown in Figure 1, each phase is composed of twocoils in parallel. For example, the phase A winding consists of two coils: A1 and A2. A1+ and A1− arethe positive current domain and the negative current domain of the A1 coil, respectively.
The studied generator has four poles and six slots. Each slot has one double racetrack coil with84 turns. The rated current of these HTS field coils is about 37 A and the rated output power is 30 kW.The generator is designed to operate at 1500 rpm, corresponding to a stator armature frequency of 50 Hz.

Appl. Sci. 2020, 10, 5228 6 of 15
Other design parameters for the generator can be found in a previous paper [27]. The parameters ofthe HTS coils are summarized in Table 1. b, k and Bc are calculated by fitting the experimental data of asample HTS tape. The surface plot of the normalized critical current density for the HTS tape under aparallel and perpendicular magnetic field is shown in Figure 4.
Table 1. Coil parameters.
Parameter Value
Manufacturer Shanghai Superconductor TechnologySuperconducting layer material ReBCO
Tape width 4 mmSubstrate layer material Hastelloy
Copper stabilizer thickness 10 µmn 28
Critical current of the tape (77 K, self-field) 135 Ab 1.058k 0.0605
Bc 0.1942 TTurns 84
Straight length of the coil 244 mmInner radius of the coil 37 mm
Appl. Sci. 2020, 10, x FOR PEER REVIEW 6 of 15
experimental data of a sample HTS tape. The surface plot of the normalized critical current density
for the HTS tape under a parallel and perpendicular magnetic field is shown in Figure 4.
Table 1. Coil parameters.
Parameter Value
Manufacturer Shanghai Superconductor Technology
Superconducting layer material ReBCO
Tape width 4 mm
Substrate layer material Hastelloy
Copper stabilizer thickness 10 μm
n 28
Critical current of the tape (77 K, self-field) 135 A
b 1.058
k 0.0605
Bc 0.1942 T
Turns 84
Straight length of the coil 244 mm
Inner radius of the coil 37 mm
Figure 4. The surface plot of the normalized critical current density for the HTS tape under parallel
and perpendicular magnetic field.
Since the six coils are symmetrical, only the results of the A1 coil are shown in this paper. The
numbering sequence of each turn of the studied coil is shown in Figure 1, and this arrangement will
be used throughout Section 4. Although this paper is only a numerical simulation study, it is worth
mentioning that our group has now manufactured the stator of the generator, which is shown in
Figure 5.
Figure 4. The surface plot of the normalized critical current density for the HTS tape under paralleland perpendicular magnetic field.
Since the six coils are symmetrical, only the results of the A1 coil are shown in this paper.The numbering sequence of each turn of the studied coil is shown in Figure 1, and this arrangementwill be used throughout Section 4. Although this paper is only a numerical simulation study, it isworth mentioning that our group has now manufactured the stator of the generator, which is shown inFigure 5.

Appl. Sci. 2020, 10, 5228 7 of 15
Appl. Sci. 2020, 10, x FOR PEER REVIEW 7 of 15
Figure 5. The manufactured generator stator.
4. Results and Discussions
4.1. AC Loss of HTS Coils under the Rated Operation
The induced AC loss on HTS armatures will directly affect the efficiency of the generator and
thereby increase the cost of cooling. Hence, accurately and quickly estimating the AC loss of the HTS
generator is urgent and beneficial. The T-A formulation model has offered a convenient tool to solve
this problem. In this section, the AC loss of HTS coils in the generator during the rated operation will
be calculated and discussed.
The calculated AC loss values of several representative turns, which are placed at different
locations in the HTS coil, are summarized in Table 2. It can be seen that different turns of the coil
have significantly different AC loss values. The calculated current waveform of the A1 coil in one
cycle at the rated condition is shown in Figure 6, and four typical time moments, A, B, C and D, are
chosen to show the calculation results.
Table 2. AC loss values of several representative turns.
Turn Number AC Loss (W)
1 0.31
21 0.60
42 1.94
43 0.11
63 0.14
84 0.55
Figure 6. Current waveform of the studied A1 coil in one cycle.
Figure 5. The manufactured generator stator.
4. Results and Discussion
4.1. AC Loss of HTS Coils under the Rated Operation
The induced AC loss on HTS armatures will directly affect the efficiency of the generator andthereby increase the cost of cooling. Hence, accurately and quickly estimating the AC loss of the HTSgenerator is urgent and beneficial. The T-A formulation model has offered a convenient tool to solvethis problem. In this section, the AC loss of HTS coils in the generator during the rated operation willbe calculated and discussed.
The calculated AC loss values of several representative turns, which are placed at differentlocations in the HTS coil, are summarized in Table 2. It can be seen that different turns of the coil havesignificantly different AC loss values. The calculated current waveform of the A1 coil in one cycle atthe rated condition is shown in Figure 6, and four typical time moments, A, B, C and D, are chosen toshow the calculation results.
Table 2. AC loss values of several representative turns.
Turn Number AC Loss (W)
1 0.3121 0.6042 1.9443 0.1163 0.1484 0.55
Appl. Sci. 2020, 10, x FOR PEER REVIEW 7 of 15
Figure 5. The manufactured generator stator.
4. Results and Discussions
4.1. AC Loss of HTS Coils under the Rated Operation
The induced AC loss on HTS armatures will directly affect the efficiency of the generator and
thereby increase the cost of cooling. Hence, accurately and quickly estimating the AC loss of the HTS
generator is urgent and beneficial. The T-A formulation model has offered a convenient tool to solve
this problem. In this section, the AC loss of HTS coils in the generator during the rated operation will
be calculated and discussed.
The calculated AC loss values of several representative turns, which are placed at different
locations in the HTS coil, are summarized in Table 2. It can be seen that different turns of the coil
have significantly different AC loss values. The calculated current waveform of the A1 coil in one
cycle at the rated condition is shown in Figure 6, and four typical time moments, A, B, C and D, are
chosen to show the calculation results.
Table 2. AC loss values of several representative turns.
Turn Number AC Loss (W)
1 0.31
21 0.60
42 1.94
43 0.11
63 0.14
84 0.55
Figure 6. Current waveform of the studied A1 coil in one cycle. Figure 6. Current waveform of the studied A1 coil in one cycle.
Appl. Sci. 2020, 10, 5228 8 of 15
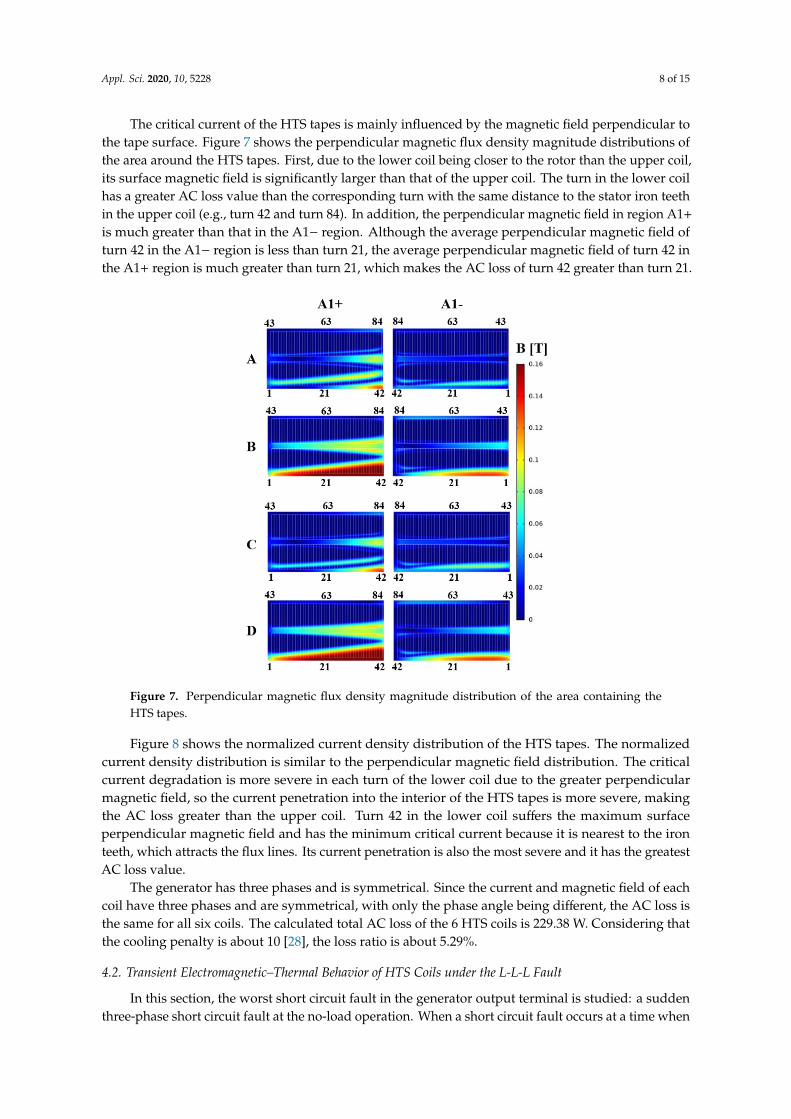
The critical current of the HTS tapes is mainly influenced by the magnetic field perpendicular tothe tape surface. Figure 7 shows the perpendicular magnetic flux density magnitude distributions ofthe area around the HTS tapes. First, due to the lower coil being closer to the rotor than the upper coil,its surface magnetic field is significantly larger than that of the upper coil. The turn in the lower coilhas a greater AC loss value than the corresponding turn with the same distance to the stator iron teethin the upper coil (e.g., turn 42 and turn 84). In addition, the perpendicular magnetic field in region A1+
is much greater than that in the A1− region. Although the average perpendicular magnetic field ofturn 42 in the A1− region is less than turn 21, the average perpendicular magnetic field of turn 42 inthe A1+ region is much greater than turn 21, which makes the AC loss of turn 42 greater than turn 21.
Appl. Sci. 2020, 10, x FOR PEER REVIEW 8 of 15
The critical current of the HTS tapes is mainly influenced by the magnetic field perpendicular to
the tape surface. Figure 7 shows the perpendicular magnetic flux density magnitude distributions of
the area around the HTS tapes. First, due to the lower coil being closer to the rotor than the upper
coil, its surface magnetic field is significantly larger than that of the upper coil. The turn in the lower
coil has a greater AC loss value than the corresponding turn with the same distance to the stator iron
teeth in the upper coil (e.g., turn 42 and turn 84). In addition, the perpendicular magnetic field in
region A1+ is much greater than that in the A1− region. Although the average perpendicular magnetic
field of turn 42 in the A1− region is less than turn 21, the average perpendicular magnetic field of turn
42 in the A1+ region is much greater than turn 21, which makes the AC loss of turn 42 greater than
turn 21.
Figure 7. Perpendicular magnetic flux density magnitude distribution of the area containing the HTS tapes.
Figure 8 shows the normalized current density distribution of the HTS tapes. The normalized
current density distribution is similar to the perpendicular magnetic field distribution. The critical
current degradation is more severe in each turn of the lower coil due to the greater perpendicular
magnetic field, so the current penetration into the interior of the HTS tapes is more severe, making
the AC loss greater than the upper coil. Turn 42 in the lower coil suffers the maximum surface
perpendicular magnetic field and has the minimum critical current because it is nearest to the iron
teeth, which attracts the flux lines. Its current penetration is also the most severe and it has the greatest
AC loss value.
Figure 7. Perpendicular magnetic flux density magnitude distribution of the area containing theHTS tapes.
Figure 8 shows the normalized current density distribution of the HTS tapes. The normalizedcurrent density distribution is similar to the perpendicular magnetic field distribution. The criticalcurrent degradation is more severe in each turn of the lower coil due to the greater perpendicularmagnetic field, so the current penetration into the interior of the HTS tapes is more severe, makingthe AC loss greater than the upper coil. Turn 42 in the lower coil suffers the maximum surfaceperpendicular magnetic field and has the minimum critical current because it is nearest to the ironteeth, which attracts the flux lines. Its current penetration is also the most severe and it has the greatestAC loss value.
The generator has three phases and is symmetrical. Since the current and magnetic field of eachcoil have three phases and are symmetrical, with only the phase angle being different, the AC loss isthe same for all six coils. The calculated total AC loss of the 6 HTS coils is 229.38 W. Considering thatthe cooling penalty is about 10 [28], the loss ratio is about 5.29%.
4.2. Transient Electromagnetic–Thermal Behavior of HTS Coils under the L-L-L Fault
In this section, the worst short circuit fault in the generator output terminal is studied: a suddenthree-phase short circuit fault at the no-load operation. When a short circuit fault occurs at a time when

Appl. Sci. 2020, 10, 5228 9 of 15
the electromotive force of the phase-A is passing through zero, the maximum fault current occurs inphase A [16], which is the worst scenario for the A1 HTS coil studied in this paper.Appl. Sci. 2020, 10, x FOR PEER REVIEW 9 of 15
Figure 8. Normalized current density distribution of the HTS tapes.
The generator has three phases and is symmetrical. Since the current and magnetic field of each
coil have three phases and are symmetrical, with only the phase angle being different, the AC loss is
the same for all six coils. The calculated total AC loss of the 6 HTS coils is 229.38 W. Considering that
the cooling penalty is about 10 [28], the loss ratio is about 5.29%.
4.2. Transient Electromagnetic–Thermal Behavior of HTS Coils under the L-L-L Fault
In this section, the worst short circuit fault in the generator output terminal is studied: a sudden
three-phase short circuit fault at the no-load operation. When a short circuit fault occurs at a time when
the electromotive force of the phase-A is passing through zero, the maximum fault current occurs in
phase A [16], which is the worst scenario for the A1 HTS coil studied in this paper.
When the fault happens, the generator short circuit fault protection system will act to cut off the
fault current to remove the fault. Therefore, it is only necessary to pay attention to whether the short
circuit fault will cause permanent harm to the superconducting coil within a short period of time after
the fault occurs.
The short circuit fault occurs at t = 0.04 s of the simulation and the circuit breaker can clear the
fault in 0.08 s [17], which means that longer simulation is unnecessary. Figure 9 depicts the variations
in the total current, the critical current (CC), the superconducting layer current (SLC) and the copper
layer current (CLC) of turn 42 and turn 43 of the A1 coil before and after the occurrence of the worst
short circuit fault. The scale of the x-axis has been changed to make it easier for the reader to observe
the waveform at 0.04–0.06 s. Figure 10 depicts the variations in the ohmic loss values and temperature
values of turn 42 and turn 43 after the occurrence of the worst short circuit fault.
Figure 8. Normalized current density distribution of the HTS tapes.
When the fault happens, the generator short circuit fault protection system will act to cut off thefault current to remove the fault. Therefore, it is only necessary to pay attention to whether the shortcircuit fault will cause permanent harm to the superconducting coil within a short period of time afterthe fault occurs.
The short circuit fault occurs at t = 0.04 s of the simulation and the circuit breaker can clear thefault in 0.08 s [17], which means that longer simulation is unnecessary. Figure 9 depicts the variationsin the total current, the critical current (CC), the superconducting layer current (SLC) and the copperlayer current (CLC) of turn 42 and turn 43 of the A1 coil before and after the occurrence of the worstshort circuit fault. The scale of the x-axis has been changed to make it easier for the reader to observethe waveform at 0.04–0.06 s. Figure 10 depicts the variations in the ohmic loss values and temperaturevalues of turn 42 and turn 43 after the occurrence of the worst short circuit fault.
Turn 42 and turn 43 are chosen because the former has the lowest critical current and the mostobvious temperature rise in each turn of the coil, while the latter has the highest critical current. As willbe shown below, although the total current is the same for both them, during a short circuit fault, due totheir different magnetic field environments, their critical current values are different. This difference inthe critical current values at the beginning results in their different subsequent copper layer shuntingand temperature rise phenomena in each HTS tape.
It can be clearly found that the total current increases rapidly after the occurrence of the shortcircuit fault. The critical current of turn 42 is much lower than that of turn 43 because of the differentmagnetic field environments on their surfaces. When the total current first exceeds the CC of turn 42(0.0428 s), the excess current flows through the copper layer, producing the ohmic loss and raisingthe temperature. However, turn 43 is still in the superconducting state. As the short circuit currentincreases further, the total current exceeds the CC of turn 43 (0.0436 s); due to its high critical current,the copper layer current of turn 43 is less than turn 42′s, resulting in less ohmic loss and a lowertemperature rise.

Appl. Sci. 2020, 10, 5228 10 of 15
Appl. Sci. 2020, 10, x FOR PEER REVIEW 10 of 15
Figure 9. Waveforms of the total current, the critical current (CC), the superconducting layer current
(SLC) and the copper layer current (CLC) of turn 42 and turn 43 before and after the occurrence of the
worst short circuit fault.
Figure 10. Waveforms of the ohmic loss values and the temperature values of turn 42 and turn 43
after the occurrence of the worst short circuit fault.
Figure 9. Waveforms of the total current, the critical current (CC), the superconducting layer current(SLC) and the copper layer current (CLC) of turn 42 and turn 43 before and after the occurrence of theworst short circuit fault.
Appl. Sci. 2020, 10, x FOR PEER REVIEW 10 of 15
Figure 9. Waveforms of the total current, the critical current (CC), the superconducting layer current
(SLC) and the copper layer current (CLC) of turn 42 and turn 43 before and after the occurrence of the
worst short circuit fault.
Figure 10. Waveforms of the ohmic loss values and the temperature values of turn 42 and turn 43
after the occurrence of the worst short circuit fault.
Figure 10. Waveforms of the ohmic loss values and the temperature values of turn 42 and turn 43 afterthe occurrence of the worst short circuit fault.

Appl. Sci. 2020, 10, 5228 11 of 15
For turn 43, due to the non-periodic current component in the short circuit transient process,a peak value (0.0471 s) appears in the first half-cycle after the short circuit fault happens. With thiscomponent gradually decaying to zero, the waveform will eventually stabilize into a steady state.Since there is not much of a temperature rise for turn 43 after the first and also the highest peak current(0.0471 s), the subsequent smaller current peaks (for example, the 0.0671 s moment) also cannot inducemuch of a temperature rise in turn 43.
As for turn 42, after the 0.0471 s moment, although the total current is decreasing, the CC is stilldecreasing as well and the CLC can still increase for a short time. This phenomenon is caused bythe temperature rise due to the ohmic loss. The higher temperature means lower CC, making thecopper layer shunt phenomenon more severe and accelerating the temperature rise. After the 0.0495 smoment, the temperature of turn 42 rises to the critical temperature. Turn 42 loses its superconductingcharacteristic, and all the short circuit currents go through the copper layer.
A large amount of ohmic loss in a short time may cause damage to the HTS coil and thisphenomenon is worthy of vigilance. One solution is to design a HTS coil with a greater margin to getthrough the short time overcurrent process. However, this method is not economical. Another methodis to allow the current to exceed the critical current value in a short time as long as the temperature riseis limited and the HTS coil can return to the superconducting state after the fault disappears [29].
For the whole HTS coil, although the temperature rise in the turn with the lowest critical currentis obvious, the highest temperature at t = 0.12 s is not high enough to exceed the melting points of thematerials of the HTS coil. As long as the machine short circuit protection device can remove the fault,the HTS coil will not be damaged.
4.3. Effects of the Copper Stabilizer Thickness on the Thermal Stability of the HTS Coil
Copper stabilizer can improve the thermal stability of the 2G HTS tapes [30]. In this section,the effects of the copper stabilizer thickness on the thermal stability of the HTS coil during the worstshort circuit fault are numerically studied.
Figure 11 depicts the variations in the total current, the critical current and the copper layer currentof turn 42 after the occurrence of the worst short circuit fault, with copper stabilizer thicknesses of10 µm and 20 µm. Figure 12 depicts the ohmic loss values and the temperature values of turn 42 afterthe occurrence of the worst short circuit fault with copper stabilizer thicknesses of 10 µm and 20 µm.
It is found that, as the copper stabilizer thickens, the temperature rise phenomenon becomesweaker. The temperature rise in the copper layer in a short period can be approximately consideredto be proportional to the ohmic loss volume density (ignore the heat transfer from the copper layerto other layers to simplify the explanation). The ohmic loss volume density is proportional to thesquare of the current density of the copper layer, so the temperature rise in the copper layer can beapproximately regarded as inversely proportional to the square of the thickness of the copper stabilizer.Thus, although the time when the total current exceeds the critical current is almost the same for thetwo cases, the final temperature will be lower for the thicker copper stabilizer.
However, though the thicker copper stabilizer improves the thermal stability of the HTS coil inthe event of a short circuit fault, the engineering current density also decreases. For the HTS generatordesigner, this requires the use of an electromagnetic–thermal coupling numerical simulation model tomake trade-offs between the engineering current density and the thermal stability of the HTS tapes.

Appl. Sci. 2020, 10, 5228 12 of 15
Appl. Sci. 2020, 10, x FOR PEER REVIEW 12 of 15
Figure 11. Waveforms of the total current, the critical current (CC), the superconducting layer current
(SLC) and the copper layer current (CLC) of turn 42 after the occurrence of the worst short circuit
fault with copper stabilizer thicknesses of 10 μm and 20 μm.
Figure 12. Waveforms of the ohmic loss values and the temperature values of turn 42 after the
occurrence of the worst short circuit fault with copper stabilizer thicknesses of 10 μm and 20 μm.
Figure 11. Waveforms of the total current, the critical current (CC), the superconducting layer current(SLC) and the copper layer current (CLC) of turn 42 after the occurrence of the worst short circuit faultwith copper stabilizer thicknesses of 10 µm and 20 µm.
Appl. Sci. 2020, 10, x FOR PEER REVIEW 12 of 15
Figure 11. Waveforms of the total current, the critical current (CC), the superconducting layer current
(SLC) and the copper layer current (CLC) of turn 42 after the occurrence of the worst short circuit
fault with copper stabilizer thicknesses of 10 μm and 20 μm.
Figure 12. Waveforms of the ohmic loss values and the temperature values of turn 42 after the
occurrence of the worst short circuit fault with copper stabilizer thicknesses of 10 μm and 20 μm. Figure 12. Waveforms of the ohmic loss values and the temperature values of turn 42 after theoccurrence of the worst short circuit fault with copper stabilizer thicknesses of 10 µm and 20 µm.

Appl. Sci. 2020, 10, 5228 13 of 15
One noteworthy phenomenon is that the total current eventually becomes inconsistent after ashort circuit fault occurs in both cases. The total current in both cases is the same at the beginning ofthe short circuit fault because the coil is initially in the superconducting state and the coil resistance isalmost zero. The short circuit impedance is mainly the inductive resistance of the coil, which is thesame for the two cases. Then, as the temperature rises, the coil resistance is gradually dominated bythe copper layer resistance and the short circuit impedance becomes greater. For the thicker copperstabilizer case, the copper layer resistance is smaller, so the short circuit impedance is smaller, causinga greater short circuit current. Moreover, since the copper layer loss is proportional to the square of thecurrent, finally, at t = 0.12 s, the 20-µm copper stabilizer case’s ohmic loss even exceeds that of the10-µm copper stabilizer case by a little.
5. Conclusions
In this paper, an electromagnetic–thermal coupling numerical study of a synchronous generatorwith 2G HTS armatures is conducted. The main results in this paper are summarized as follows:
First, by coupling the field part model with the circuit part model, the AC loss of HTS coils duringrated operation is calculated. Second, the transient electromagnetic–thermal behavior of the HTS coilunder the worst short circuit fault is studied. The results show that although the total current is thesame for each turn of the HTS coil during the short circuit fault, the critical current value of each turnis different due to their diverse surrounding magnetic fields. This difference in the critical currentvalue at the beginning leads to their subsequently different copper layer shunting and temperaturerise phenomena. The turn with the lowest critical current will eventually quench completely, and thetemperature rise is obvious, but it is not high enough to exceed the melting points of the materials ofthe HTS coil. It is concluded from this work that, if the generator short circuit protection device canremove the fault as soon as possible, the HTS coil in this high-speed HTS synchronous generator willnot suffer unrecoverable quench and be damaged. Last but not least, the simulation results show that athicker copper stabilizer improves the thermal stability of the HTS coil in the event of a short circuitfault, but for the HTS generator designer, this requires the use of a simulation model to make trade-offsbetween the engineering current density and the thermal stability of the HTS tapes.
Author Contributions: Conceptualization, X.H.; methodology, X.H.; investigation, W.L.; writing—original draftpreparation, X.X.; writing—review and editing, Z.H.; supervision, Z.J. All authors have read and agreed to thepublished version of the manuscript.
Funding: This research was funded by the National Natural Science Foundation of China (Project No. 51707120),the Shanghai Rising-Star Program (20QC1401400) and the Shanghai Marine Equipment Research Institute (ProjectNo. 18H100000488).
Conflicts of Interest: The authors declare no conflict of interest.
References
1. Barnes, P.N.; Sumption, M.D.; Rhoads, G.L. Review of High Power Density Superconducting Generators:Present State and Prospects for Incorporating YBCO Windings. Cryogenics 2005, 45, 670–686. [CrossRef]
2. Chen, Y.; Zhang, M.; Chudy, M.; Matsuda, K.; Coombs, T. Complex Study of Transport AC Loss in Various2G HTS Racetrack Coils. Phys. C Supercond. 2013, 487, 31–36. [CrossRef]
3. Zermeno, V.M.R.; Abrahamsen, A.B.; Mijatovic, N.; Jensen, B.B.; Sørensen, M.P. Calculation of AlternatingCurrent Losses in Stacks and Coils Made of Second Generation High Temperature Superconducting Tapesfor Large Scale Applications. J. Appl. Phys. 2013, 114, 173901. [CrossRef]
4. Wang, Y.; Zhang, M.; Grilli, F.; Zhu, Z.; Yuan, W. Study of the Magnetization Loss of CORC ® Cables Using a3D T-A Formulation. Supercond. Sci. Technol. 2019, 32, 025003. [CrossRef]
5. Zhang, M.; Yuan, W.; Kvitkovic, J.; Pamidi, S. Total AC Loss Study of 2G HTS Coils for Fully HTS MachineApplications. Supercond. Sci. Technol. 2015, 28, 115011. [CrossRef]
6. Liu, G.; Zhang, G.; Jing, L.; Ai, L.; Yu, H.; Li, W.; Liu, Q. Study on the AC Loss Reduction of REBCO DoublePancake Coil. IEEE Trans. Appl. Supercond. 2018, 28, 1–6. [CrossRef]

Appl. Sci. 2020, 10, 5228 14 of 15
7. Zermeno, V.M.R.; Abrahamsen, A.B.; Mijatovic, N.; Sorensen, M.P.; Jensen, B.B.; Pedersen, N.F. Simulation ofan HTS Synchronous Superconducting Generator. Phys. Procedia 2012, 36, 786–790. [CrossRef]
8. Song, X.; Mijatovic, N.; Zou, S.; Jensen, B.B.; Holboll, J. AC Losses and Their Thermal Effect inHigh-Temperature Superconducting Machines. IEEE Trans. Appl. Supercond. 2016, 26, 1–5. [CrossRef]
9. Li, Y.; Feng, F.; Li, Y.; Song, P.; Zou, S.; Wu, M.; Gu, C.; Zeng, P.; Qu, T. Numerical Study on ACLoss Characteristics of REBCO Armature Windings in a 15-KW Class Fully HTS Generator. IEEE Trans.Appl. Supercond. 2017, 27, 1–6. [CrossRef]
10. Hong, Z.; Campbell, A.M.; Coombs, T.A. Numerical Solution of Critical State in Superconductivity by FiniteElement Software. Supercond. Sci. Technol. 2006, 19, 1246–1252. [CrossRef]
11. Zhang, H.; Zhang, M.; Yuan, W. An Efficient 3D Finite Element Method Model Based on the T–A Formulationfor Superconducting Coated Conductors. Supercond. Sci. Technol. 2017, 30, 024005. [CrossRef]
12. Liang, F.; Venuturumilli, S.; Zhang, H.; Zhang, M.; Kvitkovic, J.; Pamidi, S.; Wang, Y.; Yuan, W. A FiniteElement Model for Simulating Second Generation High Temperature Superconducting Coils/Stacks withLarge Number of Turns. J. Appl. Phys. 2017, 122, 043903. [CrossRef]
13. Ainslie, M.; Grilli, F.; Queval, L.; Pardo, E.; Perez-Mendez, F.; Mataira, R.; Morandi, A.;Ghabeli, A.; Bumby, C.; Brambilla, R. A New Benchmark for Electromagnetic Modelling ofSuperconductors: The High-Tc Superconducting Dynamo. arXiv 2020, arXiv:physics/219966041. Availableonline: https://www.semanticscholar.org/paper/A-new-benchmark-for-electromagnetic-modelling-of-Ainslie-Grilli/4660781a5fc2c1706fe40bd437e632b46ed52c6d (accessed on 2 July 2020).
14. Song, X.; Liu, D.; Polinder, H.; Mijatovic, N.; Holboll, J.; Jensen, B.B. Short Circuits of a 10-MWHigh-Temperature Superconducting Wind Turbine Generator. IEEE Trans. Appl. Supercond. 2017, 27,1–5. [CrossRef]
15. Liu, Y.; Qu, R.; Wang, J.; Fang, H.; Zhang, X.; Chen, H. Influences of Generator Parameters on Fault Currentand Torque in a Large-Scale Superconducting Wind Generator. IEEE Trans. Appl. Supercond. 2015, 25, 1–9.[CrossRef]
16. Huang, Z.; Zhao, A.; Huang, X.; Zhu, B.; Jiang, Y.; Jin, Z. Short-Circuit Fault Simulations in an HTS WindGenerator with Different Mechanical Conditions. IEEE Trans. Appl. Supercond. 2018, 28, 1–6. [CrossRef]
17. Vedreno-Santos, F.; Guan, Y.; Azar, Z.; Thomas, A.S.; Li, G.J.; Odavic, M.; Zhu, Z.Q. Comparison of PeakArmature and Field Winding Currents for Different Topologies of 10-MW Superconducting GeneratorsUnder Short-Circuit Conditions. IEEE Trans. Appl. Supercond. 2016, 26, 1–7. [CrossRef]
18. Guan, Y.; Vedreño-Santos, F.; Azar, Z.; Thomas, A.S.; Li, G.-J.; Odavic, M.; Zhu, Z.-Q. Performance ofSuperconducting Generators with Different Topologies under Fault Conditions. J. Eng. 2019, 2019, 4090–4095.[CrossRef]
19. Liu, D.; Polinder, H.; Abrahamsen, A.B.; Ferreira, J.A. Effects of an Electromagnetic Shield and ArmatureTeeth on the Short-Circuit Performance of a Direct Drive Superconducting Generator for 10 MW WindTurbines. In Proceedings of the 2015 IEEE International Electric Machines & Drives Conference (IEMDC),IEEE, Coeur d’Alene, ID, USA, 10–13 May 2015; pp. 709–714. [CrossRef]
20. Grilli, F.; Sirois, F.; Zermeno, V.M.R.; Vojenciak, M. Self-Consistent Modeling of the $I_{c}$ of HTS Devices:How Accurate Do Models Really Need to Be? IEEE Trans. Appl. Supercond. 2014, 24, 1–8. [CrossRef]
21. Song, M.; Li, L.; Wang, M.; Zhong, L.; Duan, X.; Li, Z.; Dong, F.; Yao, L.; Hong, Z.; Jin, Z. Numerical Study onLightning Current Performance of Striated YBCO-Coated Conductor. IEEE Trans. Appl. Supercond. 2019, 29,1–5. [CrossRef]
22. Zhang, J.W.; Hu, D.; Zhang, L.; Song, M.; Luo, Y.S.; Li, L.; Feng, G.; Li, Z.Y.; Hong, Z.; Jin, Z. Numerical Studyof the Thermal Stability of YBa2Cu3O7- δ Tapes Suffering Lightning Current. IEEE Trans. Appl. Supercond.2018, 28, 1–7. [CrossRef]
23. Rhyner, J. Magnetic Properties and AC-Losses of Superconductors with Power Law Current—VoltageCharacteristics. Phys. C Supercond. 1993, 212, 292–300. [CrossRef]
24. Liu, D.; Yong, H.; Zhou, Y. Analysis of Charging and Sudden-Discharging Characteristics of No-InsulationREBCO Coil Using an Electromagnetic Coupling Model. AIP Adv. 2017, 7, 115104. [CrossRef]
25. Casali, M.; Breschi, M.; Ribani, P.L. Two-Dimensional Anisotropic Model of YBCO Coated Conductors.IEEE Trans. Appl. Supercond. 2015, 25, 1–12. [CrossRef]
Appl. Sci. 2020, 10, 5228 15 of 15
26. Zhang, M.; Matsuda, K.; Coombs, T.A. New Application of Temperature-Dependent Modelling of HighTemperature Superconductors: Quench Propagation and Pulse Magnetization. J. Appl. Phys. 2012, 112,043912. [CrossRef]
27. Xu, X.; Huang, Z.; Li, W.; Dong, F.; Hao, L.; Shen, B.; Jin, Z. Study on Reducing the Maximum PerpendicularMagnetic Field of HTS Coils Used on Synchronous Generator Armatures. IEEE Trans. Appl. Supercond. 2019,29, 1–5. [CrossRef]
28. Iwasa, Y. Case Studies in Superconducting Magnets: Design and Operational Issues, 2nd ed.; Springer: New York,NY, USA, 2009; p. 227.
29. Sivasubramaniam, K.; Huang, X.; Laskaris, E.T.; Zhang, T.; Bray, J.W.; Forgarty, J.M.; Nold, R.A. Performanceof an HTS Generator Field Coil Under System Fault Conditions. IEEE Trans. Appl. Supercond. 2006, 16,1971–1975. [CrossRef]
30. Kim, H.M.; Jankowski, J.; Lee, H.; Bascunan, J.; Fleshler, S.; Iwasa, Y. Stability of Bare and Copper-LaminatedYBCO Samples: Experimental & Simulation Results. IEEE Trans. Appl. Supercond. 2004, 14, 1290–1293.[CrossRef]
© 2020 by the authors. Licensee MDPI, Basel, Switzerland. This article is an open accessarticle distributed under the terms and conditions of the Creative Commons Attribution(CC BY) license (http://creativecommons.org/licenses/by/4.0/).