an empirical analysis of pool hopping behavior in the
TRANSCRIPT

HAL Id: hal-03163006https://hal.archives-ouvertes.fr/hal-03163006v3
Submitted on 2 Apr 2021
HAL is a multi-disciplinary open accessarchive for the deposit and dissemination of sci-entific research documents, whether they are pub-lished or not. The documents may come fromteaching and research institutions in France orabroad, or from public or private research centers.
L’archive ouverte pluridisciplinaire HAL, estdestinée au dépôt et à la diffusion de documentsscientifiques de niveau recherche, publiés ou non,émanant des établissements d’enseignement et derecherche français ou étrangers, des laboratoirespublics ou privés.
An Empirical Analysis of Pool Hopping Behavior in theBitcoin Blockchain
Natkamon Tovanich, Nicolas Soulié, Nicolas Heulot, Petra Isenberg
To cite this version:Natkamon Tovanich, Nicolas Soulié, Nicolas Heulot, Petra Isenberg. An Empirical Analysis of PoolHopping Behavior in the Bitcoin Blockchain. 2021 IEEE International Conference on Blockchainand Cryptocurrency (ICBC), IEEE Communications Society (ComSoc), May 2021, Sydney / Virtual,Australia. �10.1109/ICBC51069.2021.9461118�. �hal-03163006v3�

An Empirical Analysis of Pool Hopping Behaviorin the Bitcoin Blockchain
Natkamon TovanichIRT SystemX and
Universite Paris-Saclay, LISNPalaiseau, France
Nicolas SoulieUniversite Paris-Saclay,
Univ Evry, IMT-BS, LITEMEvry-Courcouronnes, France
Nicolas HeulotIRT SystemX
Palaiseau, [email protected]
Petra IsenbergUniversite Paris-Saclay,
CNRS, Inria, LISNGif-sur-Yvette, [email protected]
Abstract—We provide an empirical analysis of pool hoppingbehavior among 15 mining pools throughout Bitcoin’s history.Mining pools have emerged as major players to ensure that theBitcoin system stays secure, valid, and stable. Individual minersjoin mining pools to benefit from a more predictable income.Many questions remain open regarding how mining pools haveevolved throughout Bitcoin’s history and when and why minersjoin or leave mining pools. We propose a heuristic algorithm toextract the payout flow from mining pools and detect the pools’migration of miners. Our results showed that payout schemesand pool fees influence miners’ decisions to join, change, orexit from a mining pool, thus affecting the dynamics of miningpool market shares. Our analysis provides evidence that miningactivity becomes an industry as miners’ decisions follow classicaleconomic rationale.
Index Terms—Bitcoin, Bitcoin mining, mining pools, poolhopping, visual analytics
I. INTRODUCTION
Bitcoin mining as a term refers to Bitcoin’s proof-of-work protocol. Nakamoto proposed the protocol to solvethe double-spending problem in digital currencies and toprevent individuals from tampering with the blockchain [1].Bitcoin miners compete to solve a computation-intensive taskto propose a new block in the network. They receive financialrewards for each block they successfully mine. These rewardsconsist of the block reward fixed by the protocol and transactionfees from transactions in the mined block. Practically, individualminers receive a reward only occasionally, relative to theircomputational power. As more miners join the network [2]and with faster mining hardware available [3], the totalcomputational power of miners (called the hash rate) has beengrowing rapidly [4]. The mining difficulty is set by the protocolrelative to the hash rate [5] so the probability of mining anew block with the same hardware becomes lower as hashrate increases. Therefore, the expected reward of an individualminer diminishes with more competition. In order to overcomethis problem, mining pools have emerged in which minerscombine computational resources to gain a more stable andpredictable income.
This research work has been carried out under the leadership of the Institutefor Technological Research SystemX, and therefore granted with public fundswithin the scope of the French Program Investissements d’Avenir.
This is the author’s version of the article that will appear in 2021 IEEEInternational Conference on Blockchain and Cryptocurrency (ICBC).
Miners
Blockchain
Mining Pool
join
join
join
rewardshare
blocks mined bythe pool
integrationREWARDSreward
share
rewardshare
Fig. 1. The overview of Bitcoin mining activity. The diagram shows theinteractions between individual miners, mining pools, and the Bitcoin protocol.
Nowadays, mining pools dominate the Bitcoin miningactivity as known mining pools contribute ≈99% of the totalhash rate [6]. Bitcoin mining is an economic activity withthree main agents: mining pools, individual miners, and theBitcoin network as shown in Fig. 1. First, mining pools are incompetition with one another to attract more miners in order togain a higher market share and have a better chance to obtain amining reward. Mining pools distribute the rewards they collectto their individual miners and keep some amounts of rewardsfor their profits (pool fee). Second, individual miners investin computational resources to receive a mining reward. Theydecide to enter a pool (new miners), move to another pool(pool hoppers), exit from mining activities (dropout miners),or even participate in multiple pools (cross-pooling miners).The migration of miners directly affects mining pools’ marketshares. Third, the Bitcoin network regulates the mining activityby automatically adjusting the mining difficulty every 2,016blocks (≈2 weeks) according to the total hash rate in order tomaintain the block discovery rate at 10 minutes. The networkalso pays the reward to the successful miners and sets theblock reward. The block reward started with 50 BTC per blockfrom the genesis block (block 0) and is reduced by half every210,000 blocks (≈4 years).
Documenting the evolution of mining pools is of majorinterest for evaluating the future of Bitcoin, and more generally,of blockchain-based technology. A better understanding of theimpacts on pools’ growth or decline of both external (e. g.,market price, regulation) and internal (e. g., payout scheme,pool fee, share of transaction fee) factors is critical to assess

the viability of this industry, and thus the sustainability ofproof-of-work cryptocurrencies such as Bitcoin.
Mining pools are major players in Bitcoin mining thatinfluence how stable, secure, and trustworthy the currency is.Joining or leaving a pool is a decision miners make not only toincrease their short-term mining rewards but also to counteractthe possible domination of pools in the network. In return,migration flows affect how mining pools set their policies (e. g.,payout schemes and pool fees) to compete in the market. Thecombination of these activities and behaviors related to miningare not yet well understood and few methods exist that allow tostudy mining pools. We contribute to a new approach to detectminers’ migration (called pool hopping) among mining pools.First, we developed an algorithm to extract reward payoutflows based on the concept of transaction purity. Then, weobtained a list of miners for each payout flow and detectedthe miners that migrated between pools. Next, we derivedquantitative measurements to evaluate miners’ migration flows(e. g., pool hopping and cross-pooling). Finally, we visualizeminers’ migration among 15 mining pools throughout Bitcoin’shistory. We highlight the existence of regular patterns of miners’entry, hopping and cross-pooling behaviors in comparison todifferent payout schemes and pool fees.
II. RELATED WORK
Some previous theoretical work related to pool hoppinganalysis has applied game theory to explain the motivationbehind pool selection and miners’ migration [7].
Lewenberg et al. [8] showed that miners are motivated toswitch between pools to increase their expected rewards due tonon-linear reward payout incentives and communication delaysbetween mining pools. Schrijvers et al. [9] compared the payoutschemes between proportional and Pay-Per-Last-N-Shares(PPLNS) in an optimized incentive compatibility condition.They showed that only PPLNS is incentive compatible. Liuet al. [10] considered the hash rate and the block propagationdelay as metrics in their analysis. They found that miners’strategies will converge at the market equilibrium when thereis a dominating strategy and no miner can switch pools. Arecent work by Altman et al. [11] studied non-cooperative gamecompetition over mining resources with constrained resourceallocation. Their model suggests that only two major miningpools would dominate the network, unless the market is notstabilized or miners are not fully rational.
In contrast, our work relates more closely to other empiricalwork that has attempted to detect miners in mining pools and toanalyze miners’ migration patterns among pools in the Bitcoinnetwork.
Belotti et al. [12] investigated pool hopping betweenKanoPool and SlushPool between April 6–20, 2016. Theauthors found that a few miners tried to exploit the timedifference of reward payout between two pools with diversestrategies to gain a small profit gain. Romoti et al. [13]presented reward payout flow patterns of three pools: BTC.com,AntPool, and ViaBTC, between block 510,000 and 514,032(≈4 weeks) and detected overlapped miners in those pairs.
They detected high cross-pooling between BTC.com andAntPool probably because both pools are owned by the samecompany, Bitmain. Xia et al. [14] developed a visualizationtool showing the internal address networks of mining poolsand the estimated number of pool hoppers. This past workis closely related to ours but we deviate in several areas. Wepropose a miners’ migration flow model and measurements todetect different types of pool hoppers over long time intervals.Our extraction method is also less computationally expensiveapproach although it shares a similar underlying concept todetect miners.
Overall, compared to the majority of past work, we lookempirically at a higher number of mining pools across Bitcoin’smining history. Moreover, we compare our result with externalinformation (e. g., market shares, payout schemes, and poolfees) to help explain pool hopping behavior.
III. POOL HOPPING DETECTION
Our research approach involved extracting members ofmining pools and measuring pool hopping behavior. Ourprocess includes three steps: (A) we obtain the mining rewardfor each block and attribute it to a known mining pool; (B–C)for each coinbase transaction, we extract the reward payoutflow and detected pool members (miners) of the mining pool;and (D) we identify miners who participated in 15 mining poolsover time and migrated between pools. We provide the dataabout mining pool attribution and miner’s migration at [15].
A. Mining pool attribution, market shares, and characteristics
Mining pool attribution. First, we identified the miningpool that mined each block in the Bitcoin blockchain. When amining pool mines a block, it receives the mining reward fromthe coinbase transaction of the block. A coinbase transactioncombines the block reward from the Bitcoin network andtransaction fees from every transaction in the mined block. Italso includes a coinbase string inserted by the miner. Foreach coinbase transaction, we attributed the mining poolbased on the address matching or coinbase string pattern. Weinitially used the dataset from Romiti et al. [13] that compiledknown mining pool tagging until block 556,400 (2018-12-31).After this block, we continued their procedure and taggedpools until block 650,731 (2020-09-30) with the datasets fromBlockchain.info [16] and BTC.com [17]. We labeled the blocksthat did not match any known mining pool as “unknown.” Westored this data as an “attribution table.” Table I shows thetotal number of blocks we found for each mining pool.
Mining pool market shares: We define the market shareof a mining pool as the percentage of the blocks it minedcompared to the total blocks mined in a month. We used ourattribution table to calculate each pool’s monthly market share.
Mining pool characteristics: We obtained informationabout pool characteristics, in particular payout schemes andpool fees, from the Bitcoin Wiki page [18] on the topic. Wedownloaded the page’s edit history and manually cleaned thedata for each month by comparing it with the information from

TABLE ILIST OF MINING POOLS THAT RECEIVED MORE THAN 1,000 BLOCK
REWARDS. ROWS HIGHLIGHTED IN GREEN COLOR ARE THE 15 MININGPOOLS WE STUDIED IN THIS WORK.
Mining Pool Blocks Total Rewards First Block Last BlockF2Pool 58,174 1,101,804 2013-05-05 still activeAntPool 51,211 883,692 2013-12-07 still activeSlushPool 33,640 755,910 2012-01-26 still activeBTC Guild 32,936 1,010,779 2011-11-10 2015-06-30BTC.com 31,814 403,201 2016-09-05 still activeDeepBit 31,107 1,508,254 2011-02-25 2013-11-28GHash.IO 23,083 579,128 2013-08-04 2016-10-24BitFury 20,901 420,027 2013-11-14 2020-03-25ViaBTC 18,640 239,882 2016-06-05 still activeBTCC Pool 18,036 363,493 2014-10-21 2018-09-25BTC.TOP 15,896 211,808 2016-12-11 still activePoolin 15,142 175,971 2018-07-02 still activeBW.COM 12,733 250,044 2015-01-29 2018-11-09Eligius 11,430 338,236 2011-06-14 2017-11-2250BTC 7,859 198,651 2012-12-18 2014-06-02KnCMiner 7,477 185,427 2014-02-25 2016-09-12BitMinter 6,464 205,382 2011-11-07 2019-08-12EclipseMC 6,024 212,395 2012-02-10 2016-03-02Huobi 5,904 65,243 2015-06-01 still activeBixin 5,753 80,640 2016-06-12 2019-09-01BitClub Network 5,672 88,892 2015-04-02 2019-11-06OzCoin 4,845 187,123 2011-12-30 2014-09-24ASICMiner 3,146 79,279 2013-05-20 2014-04-091THash&58COIN 3,067 30,635 2019-08-25 still activeokpool.top 2,750 27,820 2018-12-27 still activeBitcoin.com 2,465 32,944 2016-09-21 still activeKanoPool 2,432 46,359 2014-10-14 2020-07-26GBMiners 2,093 28,980 2016-08-30 2018-04-15DPOOL 1,918 24,398 2018-03-31 2019-05-111Hash 1,895 29,268 2016-03-04 2017-12-07Telco 214 1,830 40,109 2014-12-19 2017-08-23CloudHashing 1,824 45,745 2013-10-04 2015-02-1421 Inc. 1,508 37,996 2015-04-09 2016-03-01WAYI.CN 1,306 16,364 2018-02-14 still activePolmine 1,290 32,365 2013-04-12 2015-06-07
the Bitcoin Forum [19]. As a result, we constructed panel datathat includes all changes in pool characteristics over time.
Finally, we merged the mining pool market share data withthe Wiki data. For many mining pools in the attribution table,the Bitcoin Wiki did not contain additional data. Therefore,we selected the top 15 mining pools that we found in boththe Wiki data and the attribution table for our study on poolhopping behavior (highlight in green color in Table I).
B. Transaction flow and transaction purity
We introduce transaction flow graphs and the transactionpurity definitions before applying them to our payout flowmodel and heuristic algorithm.
Definition 1. A transaction flow is a directed graph of Bitcointransactions from a seeding transaction. Each node representsa transaction tx in the transaction flow. A transaction has atimestamp attribute time. Each directed edge corresponds to avalue transfer from a transaction to another. Therefore, whetherit is the input or the output of a transaction depends on thedirection of the edge. An edge contains the information aboutthe amount of transferred value, and the public-key addressof the owner. Each edge contains references to the receivingtransaction node receive and spending transaction node spend.
We adopted a transaction purity measure to determine howmuch Bitcoin value in the transaction is received from theseeding transaction. This measure is commonly used for taintanalysis in Bitcoin (e. g., [20], [21]).
Definition 2. Let tx.in and tx.out be sets of receiving (inputs)and spending (outputs) edges of a transaction tx respectively.The transaction purity is recursively defined as being theaverage purity of the input transactions weighted by theirrespective values. The purity of a transaction tx can beexpressed as follows:
purity(tx) =
∑e∈tx.in purity(e.receive) · e.value∑
e∈tx.in e.value(1)
The purity of a transaction without inputs is 1 because it isthe root transaction in the transaction flow.
C. Mining pool payout flows
After a mining pool receives the mining reward from acoinbase transaction, the pool has to distribute the rewardto pool members. Even though mining pools distribute thereward to individual miners in different patterns [13], [22],we introduce the payout flow model as a transaction graphconsisting of four transaction types: coinbase ( txcoinbase),payout ( txpayout), intermediate ( txinter), and miner( txminer). Examples of reward payout flows are shownin Fig. 2.
1) A mining pool receives mining rewards from coinbasetransactions txcoinbase and collects them in a payouttransaction txpayout before distributing it to miners.
2) A mining pool distributes the reward from txpayout
to intermediate transactions txinter before splittingrewards to pool member (miner) addresses.
3) Pool members receive the reward from txinter andspend it in a transaction we call miner transaction
txminer. We assumed that pool members receive thereward from this flow and then combine it with otherBitcoin values outside the flow to spend in txminer.Therefore, the purity of txminer is < 1.
Based on this model, the reward payout flow is the Bitcointransaction flow from a payout transaction txpayout topool members txminer . We considered txpayout as theseeding transaction because it collects every mining rewardand distributes it to pool members.
Extracting reward payout flows. We devised Algorithm 1to automatically extract payout flows from the coinbasetransactions in the Bitcoin blockchain. We used the BlockSciAPI [23] to access the transaction data. We initiated the list of
txpayout from all outputs of txcoinbase as inputs to thealgorithm. For each txpayout, we traversed the transactiongraph from txpayout which has purity = 1 until thetransaction has puritytx < 1 (i. e. txminer). The algorithmreturns a directed edge list that represents the payout flow.
We added two additional termination criteria valid(tx) thatstop following the current transaction tx flow: (1) when the

₿51
1 txs1 txs
₿51
₿47
31 txs31 txs
₿47
₿41 txs1 txs
₿4
₿51
1 txs1 txs
₿51₿51
2 txs2 txs
₿51
(c) F2Pool (2014-10-31)
(e) AntPool (2016-04-23)
(b) SlushPool (2013-01-01)
(f) BTC.com (2018-04-06)
(a) DeepBit (2011-08-03)
₿2,314
1 txs1 txs
₿2,314
₿1,302
1 txs1 txs
₿1,302
₿1,011
1 txs1 txs
₿1,011
₿591 txs1 txs
₿59
₿8552435 txs2435 txs
₿855
₿10037 txs37 txs
₿100
₿1118 txs18 txs
₿11
₿8424 txs24 txs
₿84
1 txs1 txs₿2,314
1 txs1 txs
₿2,314
₿1,053
42 txs42 txs
₿1,053
₿1,260
1 txs1 txs
₿1,260 ...
Coinbase Payout Intermediate MinerTransaction Type
₿1,329
1 txs1 txs
₿1,329
₿851
1 txs1 txs
₿851
₿4781 txs1 txs
₿478
₿28526 txs26 txs
₿285
₿214967 txs967 txs
₿214
₿2782 txs2 txs
₿278
₿1096 txs96 txs
₿10
₿13925 txs25 txs
₿139
₿121962 txs962 txs
₿121₿1,329
1 txs1 txs
₿1,329
₿45636 txs36 txs
₿456
₿873
1 txs1 txs
₿873
...
₿1,100
1 txs1 txs
₿1,100
₿1,100
1 txs1 txs
₿1,100
1 txs1 txs
₿1,100
4 txs4 txs
₿1,100
₿992 txs92 txs
₿9
₿1,099
4 txs4 txs
₿1,099
94 txs94 txs
₿1,099
1 txs1 txs
₿1,099
6 txs6 txs
₿1,100
1 txs1 txs
₿1,100
₿1,088
43 txs43 txs
₿1,088
₿125 txs5 txs
₿12
...
₿50
1 txs1 txs
₿50 ₿50
1 txs1 txs
₿50
₿49
1 txs1 txs
₿49
1 txs1 txs
₿49
1 txs1 txs
₿49
1 txs1 txs
₿49
1 txs1 txs
₿49
1 txs1 txs
₿50
1 txs1 txs
₿50₿50
1 txs1 txs
₿50
...
(d) BTCC Pool (2016-02-18)
₿1,008
1 txs1 txs
₿1,008
₿1,000
1 txs1 txs
₿1,000
₿81 txs1 txs
₿8
₿872
7 txs7 txs
₿872
₿16580 txs80 txs
₿165
₿745
16 txs16 txs
₿745
₿9665 txs65 txs
₿96
₿735
11 txs11 txs
₿735
₿715 txs15 txs
₿7
₿1,008
1 txs1 txs
₿1,008₿1,008
40 txs40 txs
₿1,008
...
...
Fig. 2. Representative examples of reward payout flow patterns from the mining pools in our study. The flows were extracted using our algorithm and arerepresented as node-link diagrams. Here, we sampled the payout flow in the month where the mining pool had the highest market share. Each node representsa transaction type with branches of similar patterns grouped together. The color of the node indicates the transaction type. The total value of transactions ineach node is encoded by circle size in proportion to the txpayout value. The number of transactions and their combined value are the top and the right labelsfor each node respectively. We omitted labels for combined values below 1 BTC.
Algorithm 1: Reward payout flow extractionInput : txpayout is a payout transaction as a seeding
node of the payout flow.Output : edges is the edge list of the the payout flow.queue← PriorityQueue([txpayout]);edges← List();while queue is not empty do
tx← queue.pop();if purity(tx) = 1 and valid(tx) = True then
for edge in tx.out doedges.append(edge);queue.append(edge.spend);
endend
end
time difference between txpayout and tx is more than oneday and (2) when the tx.value is < 0.001 BTC—as mostmining pools have a minimum payout value [12], [14].
Identifying individual miners. For each edge list obtainedfrom Algorithm 1, we constructed a payout flow graph usingthe NetworkX library [24]. Representative payout flow patternsthat we obtained from the algorithm are shown in Fig. 2. Next,we extracted the txminer and derived the list of minersfrom each payout flow graph.
Definition 3. Miner transaction txminer is a transactionin the payout flow graph that does not have any output inthe payout flow graph |txminer.out| = 0. We tagged all inputedge(s) of txminer as owner edges. The list of miners whoreceived the reward from txpayout is defined as Mtxpayout
.
Some txminer transactions may be connected to the poolwallet to keep the represented value as profits for the pool or
as deposits for the next payout, as illustrated in Fig. 2 (c) and(f). We detected txminer input edges that have the sameowner addresses as the mining pool and assigned them as
txpayout to extract further reward payout flows.Payout flow patterns: We visualized payout flow patterns
for all mining pools in our study and show representativeflows patterns in Fig. 2. Early mining pools, operated from2011 until mid-2015, distributed the reward directly after everyblock it mined. We found two payout patterns in this period:(1) the long chain of payout flows distributing the reward to asingle miner at each step, e. g., DeepBit (a), BTC Guild, andGHash.IO; and (2) the direct payout to miners after receivingthe mining reward, e. g. SlushPool (b) and Eligius.
After mid-2015, most mining pools tended to collect themining rewards in their wallet and to distribute the rewardto miners regularly (i. e. daily). We also observed two payoutpatterns (1) the chain of payout flow distributing the reward tomultiple miners at each step, e. g. AntPool (e), BTC.com (f),BTCC Pool, and Poolin; and (2) the indirect payout to minerson an txinter, e. g. F2Pool (c). We also noticed that F2Pool(c) and BTC.com (f) usually send half of their payout back totheir addresses as a reserve to pay miners in the next payout.
D. Miners’ migration between mining pools
To analyze miner migration between pools, we comparedthe list of miners who received rewards from each mining poolin a set time interval and calculated the intersection of minersbetween pools. We set the time interval to months to be ableto analyze detailed patterns for the entire mining pool history.
Definition 4. Let t be a time interval where t ∈ T = {t0, ..., t−1, t, t+ 1, ..., tn}. The set of miners in the mining pool M t
pool
is the summation of the miner list Mtxpayoutfor all payout
transactions of a mining pool pool at time t.
New Dropout
Same after
Hopping outHopping in
Cross pooling
Same before
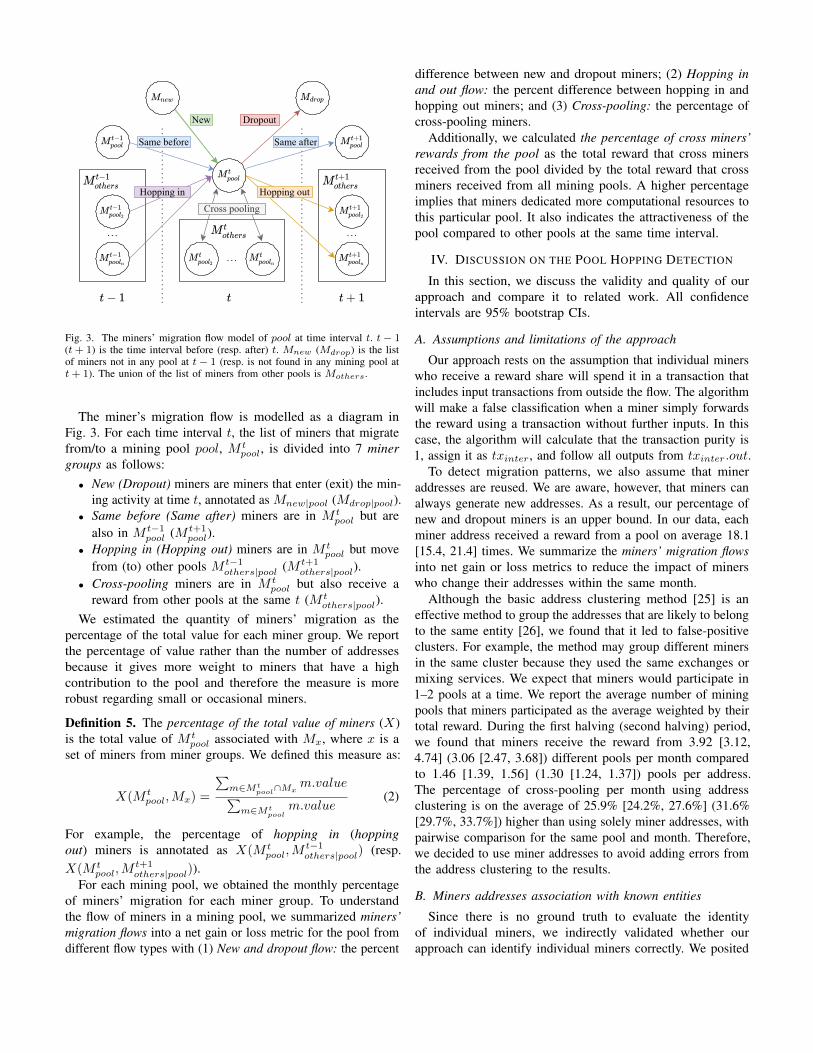
Fig. 3. The miners’ migration flow model of pool at time interval t. t− 1(t+ 1) is the time interval before (resp. after) t. Mnew (Mdrop) is the listof miners not in any pool at t− 1 (resp. is not found in any mining pool att+ 1). The union of the list of miners from other pools is Mothers.
The miner’s migration flow is modelled as a diagram inFig. 3. For each time interval t, the list of miners that migratefrom/to a mining pool pool, M t
pool, is divided into 7 minergroups as follows:• New (Dropout) miners are miners that enter (exit) the min-
ing activity at time t, annotated as Mnew|pool (Mdrop|pool).• Same before (Same after) miners are in M t
pool but arealso in M t−1
pool (M t+1pool).
• Hopping in (Hopping out) miners are in M tpool but move
from (to) other pools M t−1others|pool (M t+1
others|pool).• Cross-pooling miners are in M t
pool but also receive areward from other pools at the same t (M t
others|pool).We estimated the quantity of miners’ migration as the
percentage of the total value for each miner group. We reportthe percentage of value rather than the number of addressesbecause it gives more weight to miners that have a highcontribution to the pool and therefore the measure is morerobust regarding small or occasional miners.
Definition 5. The percentage of the total value of miners (X)is the total value of M t
pool associated with Mx, where x is aset of miners from miner groups. We defined this measure as:
X(M tpool,Mx) =
∑m∈Mt
pool∩Mxm.value∑
m∈Mtpool
m.value(2)
For example, the percentage of hopping in (hoppingout) miners is annotated as X(M t
pool,Mt−1others|pool) (resp.
X(M tpool,M
t+1others|pool)).
For each mining pool, we obtained the monthly percentageof miners’ migration for each miner group. To understandthe flow of miners in a mining pool, we summarized miners’migration flows into a net gain or loss metric for the pool fromdifferent flow types with (1) New and dropout flow: the percent
difference between new and dropout miners; (2) Hopping inand out flow: the percent difference between hopping in andhopping out miners; and (3) Cross-pooling: the percentage ofcross-pooling miners.
Additionally, we calculated the percentage of cross miners’rewards from the pool as the total reward that cross minersreceived from the pool divided by the total reward that crossminers received from all mining pools. A higher percentageimplies that miners dedicated more computational resources tothis particular pool. It also indicates the attractiveness of thepool compared to other pools at the same time interval.
IV. DISCUSSION ON THE POOL HOPPING DETECTION
In this section, we discuss the validity and quality of ourapproach and compare it to related work. All confidenceintervals are 95% bootstrap CIs.
A. Assumptions and limitations of the approach
Our approach rests on the assumption that individual minerswho receive a reward share will spend it in a transaction thatincludes input transactions from outside the flow. The algorithmwill make a false classification when a miner simply forwardsthe reward using a transaction without further inputs. In thiscase, the algorithm will calculate that the transaction purity is1, assign it as txinter, and follow all outputs from txinter.out.
To detect migration patterns, we also assume that mineraddresses are reused. We are aware, however, that miners canalways generate new addresses. As a result, our percentage ofnew and dropout miners is an upper bound. In our data, eachminer address received a reward from a pool on average 18.1[15.4, 21.4] times. We summarize the miners’ migration flowsinto net gain or loss metrics to reduce the impact of minerswho change their addresses within the same month.
Although the basic address clustering method [25] is aneffective method to group the addresses that are likely to belongto the same entity [26], we found that it led to false-positiveclusters. For example, the method may group different minersin the same cluster because they used the same exchanges ormixing services. We expect that miners would participate in1–2 pools at a time. We report the average number of miningpools that miners participated as the average weighted by theirtotal reward. During the first halving (second halving) period,we found that miners receive the reward from 3.92 [3.12,4.74] (3.06 [2.47, 3.68]) different pools per month comparedto 1.46 [1.39, 1.56] (1.30 [1.24, 1.37]) pools per address.The percentage of cross-pooling per month using addressclustering is on the average of 25.9% [24.2%, 27.6%] (31.6%[29.7%, 33.7%]) higher than using solely miner addresses, withpairwise comparison for the same pool and month. Therefore,we decided to use miner addresses to avoid adding errors fromthe address clustering to the results.
B. Miners addresses association with known entities
Since there is no ground truth to evaluate the identityof individual miners, we indirectly validated whether ourapproach can identify individual miners correctly. We posited

TABLE IITHE PERCENTAGE OF ADDRESSES AND TOTAL BITCOIN VALUES
ASSOCIATED WITH KNOWN ENTITIES FROM 2013-01-01 TO 2016-12-31
Type Addresses Total ValueInput Miner Output Input Miner Output
Unknown 96.1 84.8 91.5 44.0 84.8 68.6Mining pool 1.38 0.555 7.43e-2 45.9 6.02 0.371Exchange 1.42 8.36 4.80 0.35 6.52 18.0Wallet 0.428 4.38 2.67 7.62 2.48 12.6Marketplace 0.665 1.19 0.567 2.14 0.162 0.398Gambling 3.46e-2 0.609 0.347 1.86e-4 3.25e-2 5.07e-2Mixer 1.15e-3 5.51e-2 3.69e-2 1.16e-5 6.57e-3 3.57e-2Lending 5.03e-3 4.54e-2 2.86e-2 3.68e-5 1.50e-3 1.51e-3
the assumption that miners should receive a mining reward(input address) from the mining pool and keep it in their wallet(miner address) before spending it (output address) on services(e. g. exchange, mixer, or marketplace). We used a known entitydataset from WalletExplorer.com with entity type classificationfrom Zola et al. [27]. We report the percentage of addressesand Bitcoin values for each entity type in Table II. We studiedthe payout flows that spent between 2013-01-01 and 2016-12-32 because the website stopped updating more known entitiesfrom 2016 [28]. In summary, we found:
1) Miners detected from our algorithm mostly cannot beassociated with any known address (“unknown” type inTable II) (84.8%) as well as input and output address(96.1% and 91.5% resp.). However, when we measuredthe total value for each entity type, we found that84.8% of miner rewards are from unknown addresses,compared to 44.0% for input and 68.6% for outputaddresses. Therefore, we show that our algorithm candetect individual miners because they are largely notassociated with any known Bitcoin entities.
2) Miners tend to receive a reward from known mining pooladdresses (45.9% of the total value) followed by unknownaddresses (44%). This result aligns with our assumptionthat miners should receive the money from txinter ofthe mining pool. For unknown addresses, mining poolsmay use external addresses that are undetected in theknown entity dataset to pay miners.
3) Miners spent 68.6% of their total value using unknownoutput addresses. We also detected that some miners spenttheir reward on exchanges (18% of the total value) andwallet services (12.6%). This result provides evidence thatregular miners convert mining rewards to fiat currenciesor deposit them to their Bitcoin wallets.
Our approach differs from Xia et al.’s work [14] as we donot filter out known entities after we extract the payout flow. Wehave three reasons for this choice: (1) Xia et al. focus on onlya 1-month time frame. The WalletExplorer dataset, however,includes 30,167,518 labeled addresses. It is computationallyexpensive to linearly scan for addresses in every transaction;(2) WalletExplorer does not update new entity labels after2016 [28]. Hence, it cannot be applied to recent reward payoutflows; and (3) Our measurements based on the percentage ofvalue are tolerant to possible misclassification of miners.
V. ECONOMIC ANALYSIS OF POOL HOPPING BEHAVIOR
We calculated miners’ migration statistics for 15 pools thatadopted three main payout schemes: Proportional, Pay-Per-Share (PPS), and Pay-Per-Last-N-Shares (PPLNS). We explainminers’ behavior in the Bitcoin network based on rationalbehavior in economic theory and provide visual evidencethat some characteristics of mining pools (e. g. market shares,payout schemes, pool fees) affect miners’ mobility.
Bitcoin mining has become an industry where miners gatherinto pools to maximize their investment in mining devices [29].Choosing a pool becomes a strategic economic decision forminers as a pool’s characteristics greatly affect a miner’sincome. First, we focus on the competition between poolsbased on payout schemes and transaction fees. Then, weinvestigate market entry and the expected revenue of newminers. Finally, we analyze miners’ cross-pooling behaviorthat helps to diversify income and risks.
A. Pools’ competition, fees and pool hopping
In the competition to attract miners, payout schemes and poolfees are major pool characteristics that directly impact miners’income. We illustrate that fee and payout schemes exhibit theusual economic evolution observed in the competition context inFig. 4 (a). Our previous work [30] showed that the Proportionalpayout scheme was used at the beginning of Bitcoin. Over time,mining pools switched progressively to PPS and PPLNS payoutschemes. As PPS and PPLNS are more robust to pool hoppingthan the proportional reward [31], these payout schemes aremore attractive for pool managers. Our empirical result is inline with prior work as Proportional payout scheme disappearedin 2013. After that, PPS and PPLNS became the dominantpayout schemes among the large pools.
A second explanation for the growing use of PPS and PPLNSrelies on their different but complementary risk/return ratios.PPS pools pay miners in proportion to their contribution to thepool and thus provides risk-free, low income. All the risk issupported by the pool, which needs then to create a reserveof money to be able to pay the miners during ‘bad luck’periods. In comparison, PPLNS pools pay only those minerswho contributed to the last N shares in a given time window.Miners who contribute but leave the pool before a block hasbeen mined might not get any reward. Therefore, PPLNS leftsall the risk to the miners, and the expected reward varianceis higher compared to PPS [31]1. These two payout schemescan be viewed then as two different financial assets. For thispurpose, it is noticeable that the fees applied to these twofinancial assets follow the classical two-parameter financialasset pricing model [32]. In financial markets, risky assets
1Following Rosenfeld’s article [31], the expected rewards of PPS and PPLNSare both equal to (1− f)pB, where B is the block reward, f is pool fee, andp is the probability of a share to be a valid one. However, as we showed in thispaper, the PPLNS fee is lower than the PPS fee. PPLNS tend then to generate,in the long run, higher income than PPS. Moreover, PPLNS reward variancecan be approximated following [31] by pB2
N, using previous notations and N
is the total number of share in a round, while each share sends to the pool inthe PPS scheme is rewarded by a fixed amount, leading to no or insignificantreward variance.

2012 2013 2014 2015 2016 2017 2018 2019 2020
DeepBit ▲
OzCoin ▲
SlushPool ▲
SlushPool ◼
Proportional & Score (only SlushPool)
2012 2013 2014 2015 2016 2017 2018 2019 2020
DeepBit ▲
Eligius ▲
Eligius ◼
BTC Guild ▲
BTC Guild ◼
OzCoin ▲
OzCoin ◼
EclipseMC ▲
50BTC ▲
Polmine ◼
F2Pool ▲
F2Pool ◼
AntPool ▲
AntPool ◼
BTCC Pool ▲
BTC.com ▲
BTC.com ◼
Poolin ◼
PPS
2012 2013 2014 2015 2016 2017 2018 2019 2020
BTC Guild ▲
BTC Guild ◼
BitMinter ◼
50BTC ▲
GHash.IO ◼
AntPool ▲
AntPool ◼
PPLNS
10 20 30 40
Market share (%)0 1 2 3 4 5 6 10
Pool fee (%)
(a) Market share, payout scheme and pool fee
2012 2013 2014 2015 2016 2017 2018 2019 2020
DeepBit ▲
OzCoin ▲
SlushPool ▲
SlushPool ◼
Proportional & Score (only SlushPool)
2012 2013 2014 2015 2016 2017 2018 2019 2020
DeepBit ▲
Eligius ▲
Eligius ◼
BTC Guild ▲
BTC Guild ◼
OzCoin ▲
OzCoin ◼
EclipseMC ▲
50BTC ▲
Polmine ◼
F2Pool ▲
F2Pool ◼
AntPool ▲
AntPool ◼
BTCC Pool ▲
BTC.com ▲
BTC.com ◼
Poolin ◼
PPS
2012 2013 2014 2015 2016 2017 2018 2019 2020
BTC Guild ▲
BTC Guild ◼
BitMinter ◼
50BTC ▲
GHash.IO ◼
AntPool ▲
AntPool ◼
PPLNS
20 40 60 80 100
Difference (%)NEW > DROPOUT DROPOUT > IN
Miner gain vs. loss
(b) New and dropout flow
2012 2013 2014 2015 2016 2017 2018 2019 2020
DeepBit ▲
OzCoin ▲
SlushPool ▲
SlushPool ◼
Proportional & Score (only SlushPool)
2012 2013 2014 2015 2016 2017 2018 2019 2020
DeepBit ▲
Eligius ▲
Eligius ◼
BTC Guild ▲
BTC Guild ◼
OzCoin ▲
OzCoin ◼
EclipseMC ▲
50BTC ▲
Polmine ◼
F2Pool ▲
F2Pool ◼
AntPool ▲
AntPool ◼
BTCC Pool ▲
BTC.com ▲
BTC.com ◼
Poolin ◼
PPS
2012 2013 2014 2015 2016 2017 2018 2019 2020
BTC Guild ▲
BTC Guild ◼
BitMinter ◼
50BTC ▲
GHash.IO ◼
AntPool ▲
AntPool ◼
PPLNS
10 20 30 40 50 60
Difference (%)IN > OUT OUT > IN
Miner hop in in vs. hop out
(c) Hopping in and out flow
Fig. 4. Mining pool characteristics and miners’ migration statistics over time. We divided into three main payout schemes: Proportional (and Score only forSlush Pool), Pay-Per-Share (PPS), and Pay-Per-Last-N-Shares (PPLNS). Each row in a graph represents the mining pool and the shape encodes whether thepool kept transaction fees for itself (squared �) or shared with its miners (triangle N). We separated the same mining pool in different rows and facets butprovided the shadow colors (blue in a, grey in b and c) to highlight the continuity of the pool with different payout schemes and transaction fee policies. (a)Market shares and payout schemes. The market share of the mining pool is represented as the size of the circle for each month. Pool fees are encoded as thecolor scale. (b) New and dropout flow. The size of the circle represents the absolute difference between new and dropout miners. The positive (or negative)flow of new miners are encoded as green (or red) color. (c) Hopping in and out flow. The size of the circle represents the absolute difference between hoppingin and hopping out miners. The color indicates whether hopping in miners are more than hopping out miners (green) or vice versa (red). Three grey verticallines in each chart indicate halving days on 2012-11-28, 2016-07-09, and 2020-05-11.
must have a higher expected return to be attractive. In the caseof Bitcoin mining, Fig. 4 (a) is consistent with this schemeas the more risky asset (PPLNS) is likely to have a lower fee(≈0%) compared to the risk-free one (PPS, ≈2-3%).
Pool fees are used as a competitive advantage for miningpools. Within each payout scheme type, new pools tend to applya lower fee than the incumbents. For instance, DeepBit applieda relatively high fee for PPS (10%) as the first dominant miningpool between 2011–2012. In 2012, mining pools, such as BTCGuild or OzCoin, applied lower PPS fees (5%) to attract newminers (Fig. 4 (b)) and hopping-in miners (Fig. 4 (c)), probablyfrom DeepBit which had more hopping-out miners in the sameperiod. We see the same pattern in 2013 when F2Pool (4%,named Discus Fish at the time) or 50BTC appeared (3%), thenin 2014 with AntPool (2.5%) or BTCC (2%), and in 2016with BTC.com (1.5%). This competition led to a decrease inthe average PPS fees implemented by pools which stabilizedaround 2% from 2016. The same dynamics occurred for PPLNSpools. While BTC Guild has applied a 3% fee since 2011,50BTC created in 2012 applied a lower fee (2.5%). This trendgot stronger with GHash.io (0%) in 2013 or AntPool (0%) in2014. When these pools appeared with lower fees, new minerswere attracted by those pools (Fig. 4 (b)) and hopped out from
older pools (Fig. 4 (c)).Summary: The market share of mining pools is a confounding
factor with miner flows. Mining pools that gain market sharetend to attract new and hopping-in miners. Miners drop out andhop-out from pools that lose market share. This feedback loopprobably explains the domination of a few mining pools at atime. The main driver of pool-hoping we observe in this articleis the gap between pools fee for a given reward scheme. Newsuccessful pools adopted lower fees to attract miners while theolder ones declined or stopped operating if they did not followthis trend. After 2015, pool fees tended to converge for eachreward scheme, and pool-hoping decreased.
B. Bitcoin value and mining market entry
Another evidence for the economic rationale of miningactivities comes from the incoming flow of miners duringbitcoin’s high valuation periods. Fig. 4 (b) provides infor-mation about the new miners joining Bitcoin mining pools.Bitcoin experienced 8 local high valuation periods before2020: 06/2011 ($19), 04/2013 ($130), 12/2013–03/2014 ($800),06/2014 ($600), 12/2015 ($420), 06/2016 ($630), 05–12/2017($15,000) and 06–12/2019 ($10,500) [33]. These periods arecharacterized by many new miners entering pools and even
2012 2013 2014 2015 2016 2017 2018 2019 2020
DeepBit
Eligius
BTC Guild
BitMinter
OzCoin
SlushPool
EclipseMC
50BTC
Polmine
F2Pool
GHash.IO
AntPool
BTCC Pool
BTC.com
Poolin
0 20 40 60 80 100
Avg % miner reward from the pool
a b c
20 40 60 80
% cross-pooling miners
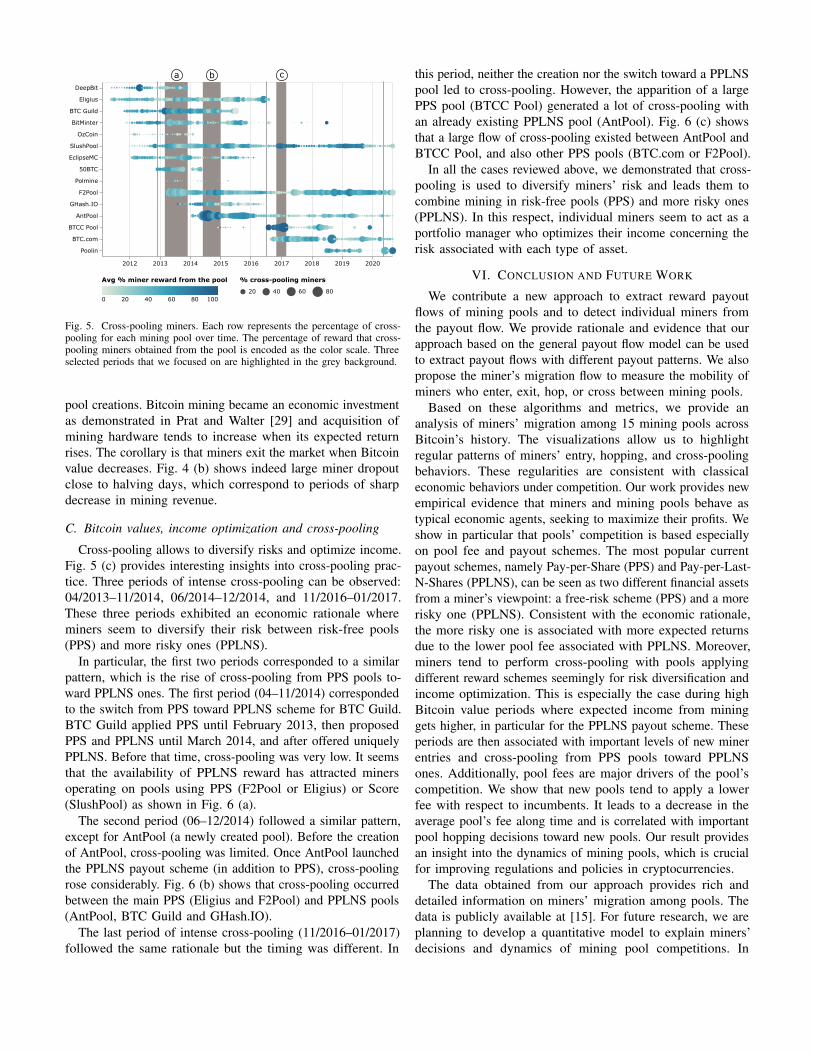
Fig. 5. Cross-pooling miners. Each row represents the percentage of cross-pooling for each mining pool over time. The percentage of reward that cross-pooling miners obtained from the pool is encoded as the color scale. Threeselected periods that we focused on are highlighted in the grey background.
pool creations. Bitcoin mining became an economic investmentas demonstrated in Prat and Walter [29] and acquisition ofmining hardware tends to increase when its expected returnrises. The corollary is that miners exit the market when Bitcoinvalue decreases. Fig. 4 (b) shows indeed large miner dropoutclose to halving days, which correspond to periods of sharpdecrease in mining revenue.
C. Bitcoin values, income optimization and cross-pooling
Cross-pooling allows to diversify risks and optimize income.Fig. 5 (c) provides interesting insights into cross-pooling prac-tice. Three periods of intense cross-pooling can be observed:04/2013–11/2014, 06/2014–12/2014, and 11/2016–01/2017.These three periods exhibited an economic rationale whereminers seem to diversify their risk between risk-free pools(PPS) and more risky ones (PPLNS).
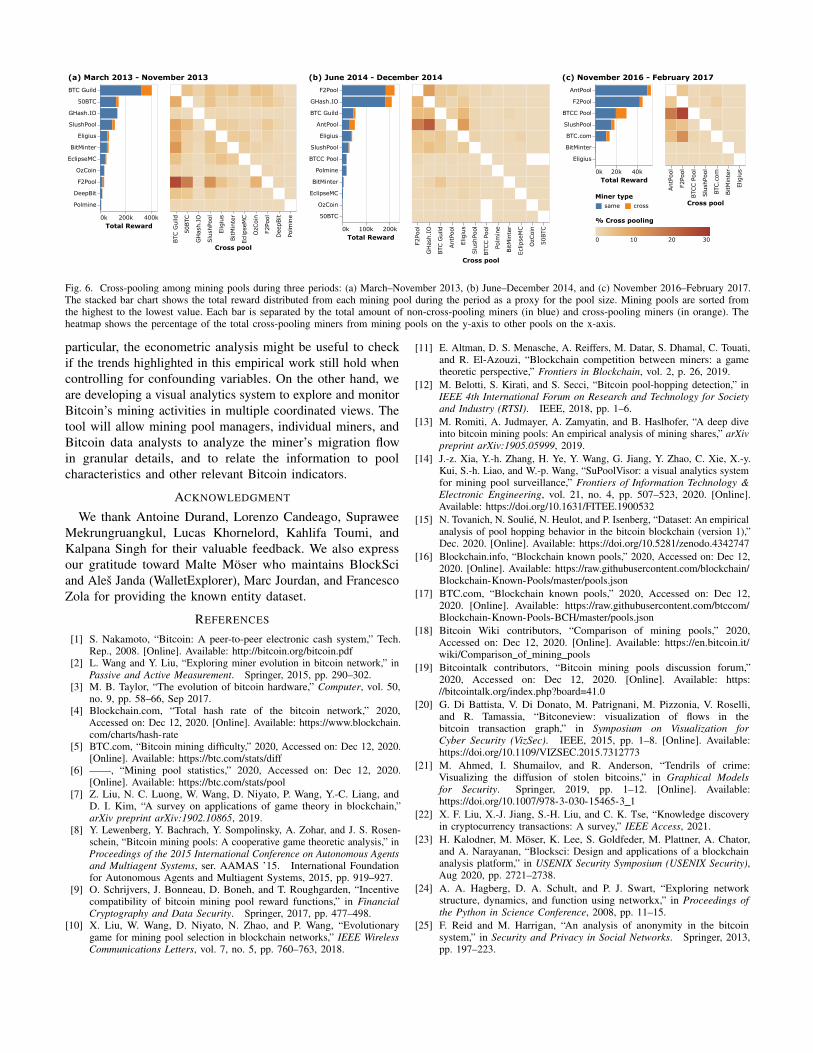
In particular, the first two periods corresponded to a similarpattern, which is the rise of cross-pooling from PPS pools to-ward PPLNS ones. The first period (04–11/2014) correspondedto the switch from PPS toward PPLNS scheme for BTC Guild.BTC Guild applied PPS until February 2013, then proposedPPS and PPLNS until March 2014, and after offered uniquelyPPLNS. Before that time, cross-pooling was very low. It seemsthat the availability of PPLNS reward has attracted minersoperating on pools using PPS (F2Pool or Eligius) or Score(SlushPool) as shown in Fig. 6 (a).
The second period (06–12/2014) followed a similar pattern,except for AntPool (a newly created pool). Before the creationof AntPool, cross-pooling was limited. Once AntPool launchedthe PPLNS payout scheme (in addition to PPS), cross-poolingrose considerably. Fig. 6 (b) shows that cross-pooling occurredbetween the main PPS (Eligius and F2Pool) and PPLNS pools(AntPool, BTC Guild and GHash.IO).
The last period of intense cross-pooling (11/2016–01/2017)followed the same rationale but the timing was different. In
this period, neither the creation nor the switch toward a PPLNSpool led to cross-pooling. However, the apparition of a largePPS pool (BTCC Pool) generated a lot of cross-pooling withan already existing PPLNS pool (AntPool). Fig. 6 (c) showsthat a large flow of cross-pooling existed between AntPool andBTCC Pool, and also other PPS pools (BTC.com or F2Pool).
In all the cases reviewed above, we demonstrated that cross-pooling is used to diversify miners’ risk and leads them tocombine mining in risk-free pools (PPS) and more risky ones(PPLNS). In this respect, individual miners seem to act as aportfolio manager who optimizes their income concerning therisk associated with each type of asset.
VI. CONCLUSION AND FUTURE WORK
We contribute a new approach to extract reward payoutflows of mining pools and to detect individual miners fromthe payout flow. We provide rationale and evidence that ourapproach based on the general payout flow model can be usedto extract payout flows with different payout patterns. We alsopropose the miner’s migration flow to measure the mobility ofminers who enter, exit, hop, or cross between mining pools.
Based on these algorithms and metrics, we provide ananalysis of miners’ migration among 15 mining pools acrossBitcoin’s history. The visualizations allow us to highlightregular patterns of miners’ entry, hopping, and cross-poolingbehaviors. These regularities are consistent with classicaleconomic behaviors under competition. Our work provides newempirical evidence that miners and mining pools behave astypical economic agents, seeking to maximize their profits. Weshow in particular that pools’ competition is based especiallyon pool fee and payout schemes. The most popular currentpayout schemes, namely Pay-per-Share (PPS) and Pay-per-Last-N-Shares (PPLNS), can be seen as two different financial assetsfrom a miner’s viewpoint: a free-risk scheme (PPS) and a morerisky one (PPLNS). Consistent with the economic rationale,the more risky one is associated with more expected returnsdue to the lower pool fee associated with PPLNS. Moreover,miners tend to perform cross-pooling with pools applyingdifferent reward schemes seemingly for risk diversification andincome optimization. This is especially the case during highBitcoin value periods where expected income from mininggets higher, in particular for the PPLNS payout scheme. Theseperiods are then associated with important levels of new minerentries and cross-pooling from PPS pools toward PPLNSones. Additionally, pool fees are major drivers of the pool’scompetition. We show that new pools tend to apply a lowerfee with respect to incumbents. It leads to a decrease in theaverage pool’s fee along time and is correlated with importantpool hopping decisions toward new pools. Our result providesan insight into the dynamics of mining pools, which is crucialfor improving regulations and policies in cryptocurrencies.
The data obtained from our approach provides rich anddetailed information on miners’ migration among pools. Thedata is publicly available at [15]. For future research, we areplanning to develop a quantitative model to explain miners’decisions and dynamics of mining pool competitions. In
0k 200k 400kTotal Reward
BTC Guild
50BTC
GHash.IO
SlushPool
Eligius
BitMinter
EclipseMC
OzCoin
F2Pool
DeepBit
Polmine
BTC
Guild
50BTC
GH
ash.I
O
Slu
shPo
ol
Elig
ius
BitM
inte
r
Ecl
ipse
MC
OzC
oin
F2Po
ol
Dee
pBit
Polm
ine
Cross pool
0k 100k 200kTotal Reward
F2Pool
GHash.IO
BTC Guild
AntPool
Eligius
SlushPool
BTCC Pool
Polmine
BitMinter
EclipseMC
OzCoin
50BTC
0 10 20 30
% Cross pooling
F2Po
ol
GH
ash.I
O
BTC
Guild
AntP
ool
Elig
ius
Slu
shPo
ol
BTC
C P
ool
Polm
ine
BitM
inte
r
Ecl
ipse
MC
OzC
oin
50BTC
Cross pool
(b) June 2014 - December 2014
0k 20k 40kTotal Reward
AntPool
F2Pool
BTCC Pool
SlushPool
BTC.com
BitMinter
Eligius
same cross
Miner type
AntP
ool
F2Po
ol
BTC
CPo
ol
Slu
shPo
ol
BTC
.com
BitM
inte
r
Elig
ius
Cross pool
(c) November 2016 - February 2017(a) March 2013 - November 2013
Fig. 6. Cross-pooling among mining pools during three periods: (a) March–November 2013, (b) June–December 2014, and (c) November 2016–February 2017.The stacked bar chart shows the total reward distributed from each mining pool during the period as a proxy for the pool size. Mining pools are sorted fromthe highest to the lowest value. Each bar is separated by the total amount of non-cross-pooling miners (in blue) and cross-pooling miners (in orange). Theheatmap shows the percentage of the total cross-pooling miners from mining pools on the y-axis to other pools on the x-axis.
particular, the econometric analysis might be useful to checkif the trends highlighted in this empirical work still hold whencontrolling for confounding variables. On the other hand, weare developing a visual analytics system to explore and monitorBitcoin’s mining activities in multiple coordinated views. Thetool will allow mining pool managers, individual miners, andBitcoin data analysts to analyze the miner’s migration flowin granular details, and to relate the information to poolcharacteristics and other relevant Bitcoin indicators.
ACKNOWLEDGMENT
We thank Antoine Durand, Lorenzo Candeago, SupraweeMekrungruangkul, Lucas Khornelord, Kahlifa Toumi, andKalpana Singh for their valuable feedback. We also expressour gratitude toward Malte Moser who maintains BlockSciand Ales Janda (WalletExplorer), Marc Jourdan, and FrancescoZola for providing the known entity dataset.
REFERENCES
[1] S. Nakamoto, “Bitcoin: A peer-to-peer electronic cash system,” Tech.Rep., 2008. [Online]. Available: http://bitcoin.org/bitcoin.pdf
[2] L. Wang and Y. Liu, “Exploring miner evolution in bitcoin network,” inPassive and Active Measurement. Springer, 2015, pp. 290–302.
[3] M. B. Taylor, “The evolution of bitcoin hardware,” Computer, vol. 50,no. 9, pp. 58–66, Sep 2017.
[4] Blockchain.com, “Total hash rate of the bitcoin network,” 2020,Accessed on: Dec 12, 2020. [Online]. Available: https://www.blockchain.com/charts/hash-rate
[5] BTC.com, “Bitcoin mining difficulty,” 2020, Accessed on: Dec 12, 2020.[Online]. Available: https://btc.com/stats/diff
[6] ——, “Mining pool statistics,” 2020, Accessed on: Dec 12, 2020.[Online]. Available: https://btc.com/stats/pool
[7] Z. Liu, N. C. Luong, W. Wang, D. Niyato, P. Wang, Y.-C. Liang, andD. I. Kim, “A survey on applications of game theory in blockchain,”arXiv preprint arXiv:1902.10865, 2019.
[8] Y. Lewenberg, Y. Bachrach, Y. Sompolinsky, A. Zohar, and J. S. Rosen-schein, “Bitcoin mining pools: A cooperative game theoretic analysis,” inProceedings of the 2015 International Conference on Autonomous Agentsand Multiagent Systems, ser. AAMAS ’15. International Foundationfor Autonomous Agents and Multiagent Systems, 2015, pp. 919–927.
[9] O. Schrijvers, J. Bonneau, D. Boneh, and T. Roughgarden, “Incentivecompatibility of bitcoin mining pool reward functions,” in FinancialCryptography and Data Security. Springer, 2017, pp. 477–498.
[10] X. Liu, W. Wang, D. Niyato, N. Zhao, and P. Wang, “Evolutionarygame for mining pool selection in blockchain networks,” IEEE WirelessCommunications Letters, vol. 7, no. 5, pp. 760–763, 2018.
[11] E. Altman, D. S. Menasche, A. Reiffers, M. Datar, S. Dhamal, C. Touati,and R. El-Azouzi, “Blockchain competition between miners: a gametheoretic perspective,” Frontiers in Blockchain, vol. 2, p. 26, 2019.
[12] M. Belotti, S. Kirati, and S. Secci, “Bitcoin pool-hopping detection,” inIEEE 4th International Forum on Research and Technology for Societyand Industry (RTSI). IEEE, 2018, pp. 1–6.
[13] M. Romiti, A. Judmayer, A. Zamyatin, and B. Haslhofer, “A deep diveinto bitcoin mining pools: An empirical analysis of mining shares,” arXivpreprint arXiv:1905.05999, 2019.
[14] J.-z. Xia, Y.-h. Zhang, H. Ye, Y. Wang, G. Jiang, Y. Zhao, C. Xie, X.-y.Kui, S.-h. Liao, and W.-p. Wang, “SuPoolVisor: a visual analytics systemfor mining pool surveillance,” Frontiers of Information Technology &Electronic Engineering, vol. 21, no. 4, pp. 507–523, 2020. [Online].Available: https://doi.org/10.1631/FITEE.1900532
[15] N. Tovanich, N. Soulie, N. Heulot, and P. Isenberg, “Dataset: An empiricalanalysis of pool hopping behavior in the bitcoin blockchain (version 1),”Dec. 2020. [Online]. Available: https://doi.org/10.5281/zenodo.4342747
[16] Blockchain.info, “Blockchain known pools,” 2020, Accessed on: Dec 12,2020. [Online]. Available: https://raw.githubusercontent.com/blockchain/Blockchain-Known-Pools/master/pools.json
[17] BTC.com, “Blockchain known pools,” 2020, Accessed on: Dec 12,2020. [Online]. Available: https://raw.githubusercontent.com/btccom/Blockchain-Known-Pools-BCH/master/pools.json
[18] Bitcoin Wiki contributors, “Comparison of mining pools,” 2020,Accessed on: Dec 12, 2020. [Online]. Available: https://en.bitcoin.it/wiki/Comparison of mining pools
[19] Bitcointalk contributors, “Bitcoin mining pools discussion forum,”2020, Accessed on: Dec 12, 2020. [Online]. Available: https://bitcointalk.org/index.php?board=41.0
[20] G. Di Battista, V. Di Donato, M. Patrignani, M. Pizzonia, V. Roselli,and R. Tamassia, “Bitconeview: visualization of flows in thebitcoin transaction graph,” in Symposium on Visualization forCyber Security (VizSec). IEEE, 2015, pp. 1–8. [Online]. Available:https://doi.org/10.1109/VIZSEC.2015.7312773
[21] M. Ahmed, I. Shumailov, and R. Anderson, “Tendrils of crime:Visualizing the diffusion of stolen bitcoins,” in Graphical Modelsfor Security. Springer, 2019, pp. 1–12. [Online]. Available:https://doi.org/10.1007/978-3-030-15465-3 1
[22] X. F. Liu, X.-J. Jiang, S.-H. Liu, and C. K. Tse, “Knowledge discoveryin cryptocurrency transactions: A survey,” IEEE Access, 2021.
[23] H. Kalodner, M. Moser, K. Lee, S. Goldfeder, M. Plattner, A. Chator,and A. Narayanan, “Blocksci: Design and applications of a blockchainanalysis platform,” in USENIX Security Symposium (USENIX Security),Aug 2020, pp. 2721–2738.
[24] A. A. Hagberg, D. A. Schult, and P. J. Swart, “Exploring networkstructure, dynamics, and function using networkx,” in Proceedings ofthe Python in Science Conference, 2008, pp. 11–15.
[25] F. Reid and M. Harrigan, “An analysis of anonymity in the bitcoinsystem,” in Security and Privacy in Social Networks. Springer, 2013,pp. 197–223.

[26] M. Harrigan and C. Fretter, “The unreasonable effectiveness of addressclustering,” in Proceedings of the Conference on Ubiquitous IntelligenceComputing, Advanced and Trusted Computing, Scalable Computing andCommunications, Cloud and Big Data Computing, Internet of People, andSmart World Congress (UIC/ATC/ScalCom/CBDCom/IoP/SmartWorld).IEEE, 2016, pp. 368–373.
[27] F. Zola, J. L. Bruse, M. Eguimendia, M. Galar, and R. Orduna Urrutia,“Bitcoin and cybersecurity: Temporal dissection of blockchain data tounveil changes in entity behavioral patterns,” Applied Sciences, vol. 9,no. 23, p. 5003, Nov 2019.
[28] A. Janda, “Information about walletexplorer.com,” 2020, Accessed on:Dec 12, 2020. [Online]. Available: https://www.walletexplorer.com/info
[29] J. Prat and B. Walter, “An equilibrium model of the marketfor bitcoin mining,” CESifo, Tech. Rep. 6865, 2018. [Online].Available: https://www.cesifo.org/en/publikationen/2018/working-paper/equilibrium-model-market-bitcoin-mining
[30] N. Tovanich, N. Soulie, and P. Isenberg, “Visual analytics of bitcoinmining pool evolution: on the road toward stability?” in InternationalWorkshop on Blockchains and Smart Contracts (BSC), Apr 2021.[Online]. Available: https://hal.archives-ouvertes.fr/hal-02902465v2
[31] M. Rosenfeld, “Analysis of bitcoin pooled mining reward systems,” arXivpreprint arXiv:1112.4980, 2011.
[32] W. F. Sharpe, “The sharpe ratio,” The Journal of Portfolio Management,vol. 21, no. 1, pp. 49–58, 1994.
[33] CoinMarketCap, “Bitcoin market price,” 2020, Accessed on: Dec 12,2020. [Online]. Available: https://coinmarketcap.com/currencies/bitcoin/