an empirical approach to marginalization in education...
TRANSCRIPT
2010/ED/EFA/MRT/PI/13
Background paper prepared for the Education for All Global Monitoring Report 2010
Reaching the marginalized
An empirical approach to marginalization in education based on the TIMSS 2007 study
Nadir Altinok2009
This paper was commissioned by the Education for All Global Monitoring Report as background information to assist in drafting the 2010 report. It has not been edited by the team. The views and opinions expressed in this paper are those of the author(s) and should not be attributed to the EFA Global Monitoring Report or to UNESCO. The papers can be cited with the following reference: “Paper commissioned for the EFA Global Monitoring Report 2010, Reaching the marginalized” For further information, please contact [email protected]
AN EMPIRICAL APPROACH TO MARGINALIZATION IN EDUCATION BASED ON THE TIMSS 2007 STUDY
Nadir Altinok
University of Metz, ID2 CNRS (French National Centre for Scientific Research)
BETA (Bureau of Theoretical and Applied Economics, University of Strasbourg) IREDU (Institute for Research in Education, University of Bourgogne)
Email: [email protected]
Acknowledgements:
The author is grateful to the IEA team for their assistance with this project, Ebru Erberber and Pierre Foy, in particular. The author would also like to thank the Global Monitoring Report team, especially those team members who attended the seminar held at UNESCO on 12 March 2009, at which an earlier draft of this paper was presented.
Abstract
The aim of the present article is to analyse possible cases of marginalization of pupils by drawing on performance differences in mathematics and science tests. To achieve this aim, we have used the outcomes of the TIMSS 2007 Study, which assessed pupils’ level of achievement in mathematics and science at grades 4 and 8 in some 60 countries. The results of our analyses reveal substantial cases of marginalization in some countries; in particular, some significant differences according to the school’s location and the nationality of the pupil. However, it was also apparent that in a number of countries marginalization is non-existent, particularly in the case of the majority of Arab countries tested.
1
Summary of the Study
The analysis of marginalization in education is an important issue, especially within the framework of the “Education for All” objective. The present study seeks to identify possible cases of marginalization by assessing potential differences in the attainment levels of pupils in mathematics and science at grades 4 and 8.
To test these possible differences, our analysis draws on the results of the Trends in International Mathematics and Science Study of 2007 (TIMSS 2007 Study), undertaken by the International Association for the Evaluation of Educational Achievement (IEA). The principal aim of this study was to assess the attainment level of pupils in some 60 countries in mathematics and science at two different grades: grade 4 and grade 8.
Our own study thus seeks to determine whether groups of pupils sharing specific characteristics obtained significantly lower scores than the other students. More precisely, marginalization is perceived in our study as reaching a level of performance that falls short of the minimum standard set by the IEA, known as the Low International Benchmark (LIB). If a group of pupils, to whom a specific set of factors applies, is more likely to perform below the LIB than the other pupils, then we consider that group of pupils to be marginalized.
To conduct such an analysis, we proceeded in several stages. Our first task was to analyse the overall performances of countries involved in the TIMSS tests between 1995 and 2007. We found in particular that the Asian countries were in general the top performers among the countries tested. The pattern of pupils’ performances over time was also analysed. This could be done because it was possible to compare the performances of countries that had participated in several cycles of TIMSS studies (for the years 1995, 1999, 2003 and 2007). Thus in the case of some countries we were able to map the pattern of their performances in mathematics and science over a 12-year period (i.e. between 1995 and 2007). An analysis of this pattern highlights substantial differences between countries. For example, in the Islamic Republic of Iran, performance tended to improve between 1995 and 2007 at grade 4 level while falling at grade 8 level. The performance of the Republic of Korea stood out, showing an improvement at grade 8, even though its performance was already very strong in 1995.
By analysing the proportions of pupils below the different benchmarks defined by the IEA, we were able to form an overall picture of marginalization internationally. In fact, since our definition of marginalization applied to pupils with a score below the LIB, it was possible to determine the extent to which this marginalization varies over time. Unfortunately, the majority of the countries for which comparative data are available are developed countries. We find, for example, that the number of pupils below the LIB in Armenia tended to decrease significantly between 2003 and 2007, falling from 25% to 13% in the case of fourth-grade mathematics. In the Czech Republic, on the other hand, the number of “marginalized” pupils at fourth-grade mathematics level tended to increase sharply between 1995 and 2007, rising from 5% to more than 12%.
Once this analysis was completed, the next step was to analyse variability and marginalization internationally. The evidence of graphs comparing mean score and standard deviation for a given country shows that, on average, as the mean performance level of a country increases, so performance differences within that country decrease. In fact, the bigger the rise is in the mean score, the smaller the standard deviation becomes. Although this observation is clearly confirmed for grade 4, there is no clear correlation at grade 8. Quite the opposite, in fact: the relationship seems slightly positive (even when countries are differentiated according to their level of development).
Our analysis next focused on those factors within a country that might be of relevance to the marginalization of pupils. The information made available by TIMSS 2007 enabled us to
2
identify five such factors at grade 4 and six at grade 8. They were: the number of books in the home, the educational background of the parents (for grade 8 only), the pupil’s gender, the language spoken at home, the location of the school and the pupil’s country of birth. We compared the number of pupils in each of the subgroups composing each of these 5/6 variables, looking at each variable in turn. In other words, a univariate analysis was used in an attempt to identify possible differences in the probability of being marginalized, if one falls into a particular category. Thus, it was found, for example, that having a large number of books at home reduces the chances of being marginalized in fourth-grade science in the Islamic Republic of Iran by 20%, compared to a situation where a pupil has few books. If all these marginalization effects are added together, it then becomes possible to build up a complete picture of the effects and to identify those countries where marginalization is most prevalent. According to our calculations, and using only the univariate analysis, we find that marginalization is rare, non-existent even, in certain countries such as Kazakhstan, Algeria, Hong Kong SAR and Armenia. On the other hand, it appears to be very common in El Salvador, the Islamic Republic of Iran and in Mongolia, if we consider grade 4. As for grade 8, marginalization seems to be rare in Algeria, Singapore, Armenia and in the Republic of Korea, while it appears most prevalent in Romania, Colombia, Ukraine and a number of other countries.
A graphic analysis of marginalization was then undertaken just for the developing countries. It allows us to see quite clearly the differences in the proportions of pupils below the LIB and thus to target the marginalized populations. For example, wide variations can be observed in the number of pupils below the LIB at grade 8 in Turkey, depending on how frequently they use the test language at home. In the case of mathematics, it was found that only 40% of those pupils who speak Turkish at home frequently or all the time are “marginalized”, whereas the proportion rises to 62% in the case of pupils who speak Turkish at home only occasionally, and for those pupils who never speak Turkish at home, it is in excess of 80%.
The next stage involved comparing the make-up of the “marginalized” population (i.e. the population of pupils with a score below the LIB) with that of the total population. Assuming that the make-up of the two populations does differ, it is possible to infer more or less significant characteristics of marginalization. Our calculations show that the characteristics of marginalization differ from country to country, and that countries are always affected differently by the phenomenon of marginalization as we have defined it. The countries where the differences between the two population groups are most pronounced are Taiwan of China, Russian Federation, Latvia, Germany and the Netherlands. We find that the incidence of marginalization evaluated in this perspective is evident on a distinctly larger scale for developed countries and countries in transition. In contrast, the incidence of marginalization is characteristically low in the Yemen, Qatar, Morocco, Kuwait and Algeria, in other words, in Arab countries.
As the final stage of our investigation, we carried out a multivariate analysis. Given that we wished to identify those populations that were most at risk of being marginalized, we decided to analyse the factors that were likely to lead to a pupil scoring below the LIB. To perform this type of analysis, we used a logistic regression and predictions of the likelihood of obtaining a score below the Low International Benchmark. Using as our control the factors not included in the permutation of subgroups enabled us to predict the likelihood of being marginalized when several factors are combined simultaneously. Our analysis allowed us to determine in particular the probability of pupils scoring below the Low International Benchmark when they were born abroad and had access to few books at home. Such an analysis can prove useful for undertaking further analyses based on scenarios of educational policy targeting marginalized populations. It produced some very interesting outcomes with regard to a number of countries. Thus, we crossed, for instance, the parents’ education and the pupil’s country of birth. This yielded some very fruitful results that revealed a high level of marginalization in some countries, such as Egypt, Indonesia and Lebanon. In the case of
3
Indonesia, for example, it was found that pupils born abroad to parents whose level of education is below secondary level have a 79% chance of being marginalized, whereas pupils born in Indonesia itself and in families where at least one parent received a university education, have only a 34% chance of being marginalized. If, for Ukraine, we make comparisons concerning the category of pupils from families where one or both parents had been educated to university level, children born abroad are again seriously marginalized, even if they have reached the same educational level as those born in Ukraine. In fact, whereas pupils who are native to the country have a 13% chance of being marginalized, for pupils born abroad the figure rises to 41%.
1. INTRODUCTION
The analysis of marginalized populations is proving to be a key element in the fight against educational inequality. More than 50 years ago, the nations of the world affirmed, in the Universal Declaration of Human Rights, that “everyone has the right to education”. In 1990, the estimated number of children having no access to primary education was more than 100 million. From 5 to 9 March 1990, the Jomtien Conference was held in Thailand. It brought together several Heads of State and government and ministerial delegations from more than 150 countries worldwide. Acknowledging both the fundamental right of all men and women everywhere to a sound education and the need to offer present and future generations an expanded vision of basic education, the participants proclaimed the World Declaration on Education for All: “Meeting Basic Learning Needs”. Article III of this commitment expressly emphasizes the development of quality in education (UNESCO, 1990). It was agreed that the goal of education for all should be achieved by 2000. One of the major objectives of Jomtien was that a basic education should be available to all and that all should be able to complete it, without any compromise to its quality.
The number of children attending school is estimated to have risen from 599 million in 1990 to 681 million in 1998. This means that an extra 10 million children started school in each of these years; nearly double the average recorded for the period 1980-1990. Today, the regions of East Asia and the Pacific, as well as those of Latin America and the Caribbean, have virtually achieved primary education for all. China and India have made impressive progress towards achieving universal primary education, especially in relation to girls. Those same countries, together with Bangladesh, have recorded an unparalleled reduction in the population growth rate, a development that is conducive to progress (UNESCO 2000a). To illustrate, Bangladesh, though falling well short of realizing the Dakar goal of gender equality in accessing education, succeeded nonetheless in meeting the Dakar goals in this area earlier than expected (UNESCO, 2008).
It appeared urgent, nevertheless, both to redefine a framework for action on opening up education to all and to stress the quality aspect of education. This led to the World Education Forum, held at Dakar from 26 to 28 April 2000. The Forum was the culmination of the Education for All (EFA) decade, which had started with Jomtien (Thailand) in 1990, and, more specifically, of the EFA 2000 Assessment, the most comprehensive evaluation of education ever undertaken (UNESCO 2000a). The conference specifically asserted that the goal of EFA should be achieved by 2015 at the latest (see Box 1). Goal 2 of the EFA project clearly stipulates that all categories of a population must have access to basic education. Particular reference is made to girls, children in difficult circumstances and ethnic minorities. This determination to open up primary education to the whole of the population brings us back to the question of how to define marginalized populations both across countries and within a single country. However, our efforts must not be confined to analysing populations that are unable to access education, for the main purpose of schooling is inseparable from the quality of the education received. Even if, in a given country, most marginalized groups receive a basic education, this does not necessarily mean that all groups benefit equally. For
4
example, it is quite possible to find rates of enrolment that are close to 100% for both girls and boys, but can it be said with confidence that they receive exactly the same education? Is it not possible to be marginalized within the educational process itself?
This possibility of marginalization will be tested in the course of our investigation. We shall assume that population groups exist, sharing one or several, complementary or independent characteristics, which show a significantly different level of academic achievement from the other groups. Nevertheless, one of the major difficulties in attempting to identify marginalized populations remains the temptation to generalize from a specific case, a country or even a region, to all the other countries. Now it seems obvious that it would be inappropriate, even dangerous, to attempt to identify homogeneous marginalized groups across all countries. It is evidently necessary to analyse the possible existence of such groups within each country so as to discover the profiles of individuals likely to perform less well than the other groups. Such an attempt to target marginalized populations is crucial for any policy aimed at reducing disparities between the population groups. At the same time, this must not lead to a policy of stigmatization of these groups, reflecting preconceptions about their “behaviour patterns” or their “nature”.
The aim of this study will therefore be to identify, wherever possible, marginalized populations within a group of countries. We have chosen the TIMSS study as our yardstick of pupil achievement. As soon as a group of pupils performs significantly less well than another group, it can be inferred that the known characteristics of that group are tending to marginalize it. We will begin by introducing the TIMSS 2007 Study, followed by the different dimensions available for analysing marginalization. Our task will then be to measure the extent to which particular countries or regions are marginalized. We will conclude our analysis by focusing on marginalization within the different countries analysed.
Box 1: The Dakar Goals
1. Expanding and improving comprehensive early childhood care and education, especially for the most vulnerable and disadvantaged children.
2. Ensuring that by 2015 all children, particularly girls, children in difficult circumstances and those belonging to ethnic minorities, have access to and complete free and compulsory primary education of good quality
3. Ensuring that the learning needs of all young people and adults are met through equitable access to appropriate learning and life skills programmes
4. Achieving a 50% improvement in levels of adult literacy by 2015, especially for women, and equitable access to basic and continuing education for all adults
5. Eliminating gender disparities in primary and secondary education by 2005, and achieving gender equality in education by 2015, with a focus on ensuring girls’ full and equal access to and achievement in basic education of good quality
6. Improving every aspect of the quality of education, and ensuring their excellence so that recognized and measurable learning outcomes are achieved by all, especially in literacy, numeracy and essential life skills.
Source: UNESCO (2000b)
2. THE TIMSS STUDY
2.1 Presentation
5

The first attempt to measure individual levels of achievement and one that allowed comparisons to be made internationally was initiated in the early sixties by the International Association for the Evaluation of Children’s Progress (IEA). The IEA carried out several long-term studies, in a wide range of areas: in mathematics, science and reading, but also on pre-primary schools (14 countries, 1988-1995) and information technology in schools (20 countries, 1988-1992).
The study we shall be using in the present investigation belongs to the IEA group of studies. In fact, the IEA has grouped together the famous TIMSS studies in mathematics and science and the Progress in International Reading Literacy Study (PIRLS), which now belong to this range of studies. In the present report, we will be focusing on the TIMSS Study.
The first study to assess mathematics, the First International Mathematics Study (FIMS), took place between 1963 and 1967, and covered 12 developed countries (Australia, Belgium, England, Finland, France, Federal Republic of Germany, Israel, Japan, the Netherlands, Scotland, Sweden and United States). The pupils assessed were 13 years of age or else in their final year at secondary school. The study that evaluated science, the First International Science Study (FISS), was conducted over a longer period (1968-1972) and focused on biology, chemistry and physics. The population assessed were aged thirteen or fourteen, or else were in their final year at secondary school. A total of 19 education systems were evaluated (Australia, Flemish-speaking Belgium, Francophone Belgium, Chile, England, Federal Republic of Germany, Finland, France, Hungary, India, Iran, Italy, Japan, Netherlands, New Zealand, Scotland, Sweden, Thailand and United States).
The Second International Mathematics Study (SIMS), was carried out between 1977 and 1981 and involved both 13-year-olds and pupils who were in their final year at secondary school (Burnstein, 1992). Again, 19 education systems were evaluated, including two African countries (Nigeria and Swaziland). In the early 1980s, a second science study was undertaken, the Second International Science Study (SISS). This time, 23 education systems were involved, which included three African countries (Ghana, Nigeria and Zimbabwe) and five other developing countries (China, Papua-New Guinea, the Philippines, Poland and Thailand).
However, it was the cycle of TIMSS studies in particular that would prove the most promising in terms of the evaluation of mathematics and science. The main aim of the TIMSS studies was to evaluate the attainment level of pupils in mathematics and science and to describe the learning environment of those pupils. Through the latter, those who had set up TIMSS were adopting an approach that was resolutely policy-oriented, since pupils’ results were related to the different factors present in the teaching context. It is on these studies that our own study of marginalized populations is based. For a fuller description of these international investigations, see in particular Altinok (2009).
Four TIMSS studies have been undertaken to date: the first, in 1994–1995, involved 45 education systems for three school populations1 (grades 3 and 4; grades 7 and 8, and the final year of secondary school); the second cycle of tests in 1999, involved 38 education systems and covered grade 8 only; the third series was conducted in 2003 with respect to 50 education systems and covered grades 4 and 8. The last cycle to be finalized and for which micro-data are available was the TIMSS 2007 Study. This study involved grades 4 and 8 and more than 66 education systems. The content of the questionnaires is quite varied and particular weightings are given to each content area (one might mention, in particular, number, algebra and geometry in the case of mathematics; life science, natural science and the history of science in the case of science). 1 On occasion, certain Canadian provinces and federal states in the United States of America took part in
the IEA projects. To avoid unnecessary complications, we have not included these regions in our count of the number of countries that participated in the projects.
6
A major purpose of the TIMSS 2007 Study was to measure pupils’ progress in mathematics and science since 1995. For this reason, the IEA team thought it vital to analyse any variation in the composition of the populations tested to make it possible to study changes in performance. It is important to note that for the same country and the same study, discrepancies in average scores sometimes arose between the official study report and the TIMSS 2007 report, which is the only one that allows an accurate assessment of how pupils’ performances have developed. Because such discrepancies exist, our study will use only the data presented in the 2007 report.2
2.2 A General Description
2.2.1 The Nature of the Tests
The assessment of pupils is essentially based on a common frame of reference across countries in terms of what pupils can be expected to know. Several hundred items were evaluated, before being included in the questionnaires, to determine whether they were taught in the majority of schools in the participating countries. Every effort was made to ensure a maximum number of standard items for every country, though this does not rule out the possibility that in some education systems, a number of these items might not actually appear on the syllabus. The questionnaires are not confined to pupils’ achievement levels in mathematics and science. Apart from the evaluation questionnaire, other types of questionnaire were distributed to the different stakeholders in the system:
• a questionnaire relating to individual and family characteristics, bringing together information about the pupil, such as motivation and the frequency of visits to the library, as well as about the family generally (parents’ occupation, size of home-town, etc.);
• a questionnaire for teachers, which records general information about the classes they teach (class-size, library and computer facilities, etc.), as well as about their approach to teaching (time spent on marking, interaction with pupils, etc.), their initial education and any in-service training (qualifications obtained, training specific to the teaching profession, work experience, etc.);
• a questionnaire for heads of schools, which gathers together general information about the school, as well as about the pupils being assessed in the study (size of the school, how the pupils are assigned to different classes, potential shortages of certain resources, etc.);
• a questionnaire for ministry of education staff, in order to obtain information on curricula, on how closely these are followed by staff, on the types of assessment used, etc.
2.2.2 Comparability between the different cycles
The TIMSS 2007 Study also includes a study called the TIMSS 2007 Bridging Study, in which a total of 28,098 fourth-grade pupils and 44,350 eighth-grade pupils took part. In 2003, TIMSS introduced a new procedure, consisting of a sequence of similar groups of exercises (booklets), each group of exercises containing six blocks of items. After the data from the 2003 TIMSS Study were examined, it became apparent that the students had been given too little time to complete all the items in a booklet. This led to a “position effect”, so called because the items placed at the end of a booklet appear more difficult than if they are placed
2 The author wishes to thank Pierre Foy for kindly providing the detailed information on these adjustments
and the adjusted data for the 1995 study.
7

earlier on. The position effect was discernible owing to the heterogeneous structure of the 2003 study, in which the items were randomly distributed within blocks, and the blocks themselves randomly distributed within the booklets.3
A new procedure for the booklets was introduced in 2007, which, in particular, allowed students more time for answering the questions. Unlike the TIMSS 2003 booklets, each of which contained six blocks of items, the TIMSS 2007 booklets contained only four such blocks, to be completed within the same amount of time (i.e. 72 minutes for grade 4 and 90 minutes for grade 8). To determine whether the extra time allowed would make the 2007 tests any easier, in comparison to the 2003 tests, the IEA team introduced what they called a “Bridging Study”. The study consisted in re-using some of the booklets that had already been included at grades 4 and 8 in the TIMSS 2003 tests, so as to create a bridge between the 2003 and 2007 tests. It could then be determined from the data generated by the Bridging Study whether the change in the content of the different booklets between 2003 and 2007 had any effect on the degree of difficulty of the tests.
A number of booklets from the 2003 study were included in the 2007 TIMSS tests for those countries taking part in the two linked studies. Using these same booklet items for the bridging study alongside the new booklets for the general study, it could be determined whether the 2003 exercises had had any adverse effects, owing to their particular nature, and, if so, to correct it. A comparison of the success rates of pupils in the tests based on the groups of exercises relating to the bridging study and in the tests of the general study confirmed that the items used in 2007 were, on average, easier in the general TIMSS 2007 Study, particularly at grade 8 level. For grade 4, the percentage of correct answers to the mathematics items in the TIMSS general study was 0.3% higher than for the items in the bridging study. The difference in fourth grade science was 0.9%. The difference was bigger at grade 8: on average, pupils’ answers tended to be 1.2% better for the general items than for those items in the mathematics bridging study (in science the gap was 0.9%).
Thus, because of changes to the structure of the test, the results for 2003 and 2007 were not directly comparable. Consequently, a linear adjustment was made to enable such comparability. As a result, it became possible to compare the pattern of pupil performance over time for a certain number of countries. The countries in question are listed in Table 1 below.
3. An Analysis of Performances in TIMSS 2007
3.1 Performance in Mathematics
Annex A contains the tables allowing an analysis to be made of pupils’ performances. More specifically, Table A.1. shows the distribution of pupils’ performances in fourth-grade mathematics for those countries that took part in the TIMSS 2007 Study. We have, then, the distribution of scores for all 36 countries that took part in the study. These scores are shown alphabetically to allow a cursory analysis of a country’s performance across several different levels and subject-areas.
The TIMSS scores were standardized to give an international mean of 500 and a standard deviation of 100. The scores should therefore be interpreted as relative rather than absolute values. In addition, scores have been scaled in a way that allows comparisons with earlier years. We can thus assess any variations in a country’s performance over time.
From Tables A.1-A.4, it will be seen that the top performing countries are the Asian countries. These countries were the top performers in mathematics and science, as well as 3 In 2003, a booklet consisted of six blocks of exercises, each block in turn containing several items
(questions). In the TIMSS 2007 Study, however, each booklet consisted of only four blocks of items.
8
at both of the school grades assessed (grades 4 and 8). At grade 4, Hong Kong SAR and Singapore have the highest scores. The scores achieved by these two countries were fairly similar but were far higher than the scores of all the other participating countries. Next come Taiwan of Chinese and Japan. Kazakhstan, Russian Federation, England, Latvia and the Netherlands also rank among the highest performing countries. Little separates the performance levels of these five countries, even though they come well behind the Asian countries referred to above.
The top performing countries at grade 4, Hong Kong SAR and Singapore, have scores that are 100 points above the international mean (607 and 599, respectively), whereas the other countries described earlier (Taiwan of China, Japan, Kazakhstan, Russian Federation, England, Latvia and the Netherlands) also demonstrate a level of attainment well in excess of the international mean. These countries apart, eight other countries also score well above the international mean, including Lithuania, the United States and Austria, in particular.
Table A.2. shows that, at grade 8, five Asian countries have the highest scores in mathematics. It will be observed in particular that Taiwan of China, Republic of Korea and Singapore have the highest scores, generally outperforming all the other countries. These three countries are followed by Hong Kong SAR and Japan, whose performance levels either match or surpass those of all the remaining countries.
A big discrepancy is evident in performances in mathematics between the five Asian countries and the group of four countries immediately below them (Hungary, England, Russian Federation and United States). There is, for instance, a difference of 53 points between Japan (570) and Hungary (517).
If, at grade 4, we focus on the low-scoring countries, we find that they are, in the main, developing countries, among them Colombia (355), Morocco (341), El Salvador (330), Tunisia (327), Kuwait (316), Qatar (296) and lastly Yemen (224), with the weakest performance of all the participating countries. At grade 8 (Table A.2.), we find relatively similar countries , starting with Palestine (367), Botswana (364), followed by Kuwait (354), El Salvador (340) and Saudi Arabia (367). Lastly, the weakest performers at grade 8 in mathematics are Ghana (309) and Qatar (307).
A large number of countries took part in the TIMSS 2007 Study at both grades, which meant that big differences between countries were only to be expected, and are seen to be borne out in practice, when, in particular, we compare Hong Kong SAR’s performance (607) with Yemen’s (224) at grade 4 or Taiwan of China’s performance with Qatar’s (307) at grade 8. If even more developing countries had participated in the study, the differences would no doubt have been starker still.
In Tables A.1.-A.4. we have also given the proportion of pupils in the different countries attaining the performance levels set by the IEA team. These performance levels are known as “benchmarks”. The different levels defined by the IEA represent absolute levels, allowing the proportion of pupils reaching each performance threshold to be calculated. The Advanced International Benchmark (AIB) was set at 625 points, and the High International Benchmark (HIB) at 550 points and the intermediate international benchmark (IIB) at 475 points. Lastly, the Low International Benchmark (LIB) was set at 400 points. This level is located at one standard deviation below the international mean (500 – 100 = 400 points). In our analysis of marginalization, we shall be making frequent use of this indicator. Thus, the figures in the last two columns represent the proportion of pupils attaining the high and advanced levels at the different grades and for the different subject-areas assessed. For each of the benchmarks, our preference was to record the proportion of pupils falling below the threshold rather than the reverse, given that the aim of our study is to identify the
9
proportion of pupils who are marginalized. For the purposes of the present study, a population is marginalized if its score is below the LIB, i.e. 400 points.
At every level, significant differences are in evidence, not just across countries but also in the proportion of pupils reaching the prescribed thresholds. For example, in mathematics at grade 4, pupils achieving the advanced level were able to apply logical reasoning and mathematical understanding to relatively complex problems and also to explain how they arrived at the solutions. In contrast, pupils achieving only the low level (LIB) demonstrated basic mathematical skills, were able to work with whole numbers, recognize geometrical shapes and read simple graphs and tables. At grade 8, pupils could organize information and draw conclusions from it, they were also able to make generalizations and solve non-trivial problems involving numerical, algebraic and geometric concepts. In comparison, those pupils who had not progressed beyond the low level showed evidence of some learning in their manipulation of whole numbers and decimals, and in straightforward mathematical operations and graphs.
By and large, those countries participating in the TIMSS 2007 Study that achieved the highest scores were also the ones that achieved the highest success rates in mathematics at both the advanced and high levels (AIB and HIB, respectively). Likewise, those countries that performed least well were also the ones with the lowest success rate at these same levels. Thus the Asian countries are the countries with a high proportion of pupils achieving the advanced level. It will be recalled that the advanced level in mathematics represents a pupil’s ability to cope successfully with the most demanding questions in the tests. Accordingly, at grade 4, 41% and 40% of the pupils from Singapore and Hong Kong SAR, respectively, achieved advanced level or better. At grade 8, the Taiwan of China), the Republic of Korea and Singapore saw between 40% and 45% of their pupils achieve the advanced level in mathematics.
In order to work out performance differences at the different levels, the IEA calculated the median for each level (not shown here). By definition, half of the countries will have a percentage above the median, half a percentage below it. The median proportion of pupils achieving the advanced level in mathematics was 5% at grade 4 and just 2% at grade 8. Thus nearly a quarter of the pupils from Asian countries (Singapore, Hong Kong SAR, Taiwan of China and Japan) achieved the advanced level in mathematics at grade 4. Other countries saw more than 10% of their pupils reach this level (this was the picture for Kazakhstan, England and the Russian Federation, in particular). At grade 8, Taiwan of China and the Republic of Korea saw more than 40% of their pupils reach the advanced level. They were followed by two other Asian countries, Singapore (31%) and Japan (26%). The next country, Hungary, forms a stark contrast, with only one-tenth of its pupils reaching the advanced level.
At grade 4, the median average for the low level is 90%, which means that at least half of the countries among the total population of pupils at grade 4 had reached a basic level in mathematics. A number of countries saw 95% or more of their pupils at grade 4 attain this low level. These countries include Singapore, Hong Kong SAR, Taiwan of China and Japan, also Kazakhstan and the United States.
When the proportion of pupils reaching the advanced level is considered (from 2% to 6%), several countries are seen to have a large proportion of their pupils attaining the low level. Among these countries are the Czech Republic (92%), Slovenia (92%) and Sweden (90%). The case of Norway is not without interest, since, in mathematics, very few of its pupils achieved the high level, while 85% attained the low level.
3.2 Performance in science
10

Performance levels in science closely resemble those in mathematics. For this reason, analysis of the results will be briefer. Thirty-six countries took part in the study at grade 4 and 49 countries at grade 8. It will be recalled that the scores were standardised to give an international mean of 500 and a standard deviation of 100. In addition, a particular methodology was used to allow a comparison of the results for different countries to be made over time.
Just as in the previous studies, it is the Asian countries that come out on top, at both grade 4 and grade 8. Singapore is the strongest performer at grade 4, with a score of some 87 points above the international mean. Then come Taiwan of China, Hong Kong SAR and Japan. The performance of certain other countries such as the Russian Federation and especially Kazakhstan is also worthy of note. At grade 8, we see that Singapore and Taiwan of China obtain the highest scores. These two countries have similar scores, which are some 60 points above the international mean.
At the level of countries that performed least well at grade 4, we find Colombia (400) and El Salvador (390), with similar scores, scores that were nonetheless higher than those of Algeria (354) and Kuwait (348). These countries, with broadly similar scores, in turn outperformed Tunisia (318). The countries with the lowest scores were Arab countries, namely Morocco (297), Qatar (294) and Yemen (197). It emerges fairly clearly that the Arab countries performed the least well among the 36 countries participating in the TIMSS 2007 Study at grade 4.
At grade 8 level, certain countries, such as Egypt, Algeria, Palestine, Saudi Arabia and Morocco, all achieved rather similar scores, performing more strongly than El Salvador (387). El Salvador, in turn, achieved better results than Botswana (355), which itself outperformed Qatar (319) and Ghana (303), with the latter two countries receiving the lowest scores of all at grade 8.
Given the methodology used in order to obtain standardized scores that could be compared over time, it would be interesting to determine the performance pattern of countries in science since 1995. The tables in Annex B show this pattern for grades 4 and 8. For practical reasons, the countries have been ordered alphabetically. At grade 4, 23 countries have enough data available for 1995 and 2003 to be compared, and also for either of these two years to be compared with 2007. Since grade 4 was not assessed in 1999, only three years’ data at best are available (1995, 2003 and 2007). Accordingly, countries that participated at grade 4 have between two and three sets of results spread over time. At grade 8, data allowing comparisons to be made is available for 35 countries. For these countries, there is at least one further year for which scores are available, over and above their participation in TIMSS 2007. For 25 of them, at least three different scores subsequent to 1995 are available for comparison. It should be noted, in this respect, that four years are available for assessment at grade 8 (1995, 1999, 2003 and 207).
It would be interesting to compare the performance pattern of different countries in the light of the reforms recently introduced by these countries, as was done for mathematics. The Russian Federation and Slovenia might be cited as examples: in recent years, both these countries have introduced wide-ranging education reforms that could well account for their improved performance.
If we consider the general performance patterns in science, we find that performance has tended to improve in most countries. However, this trend is less in evidence at grade 8. At grade 4, 11 countries achieved higher scores in 2007 than when they first participated in the TIMSS studies, 5 others achieved lower scores, while a further 7 saw no significant change. At grade 8, again 11 countries scored higher in 2007 than when they first took part, 8 countries scored lower, while for 16 countries performance was static. Comparatively
11
speaking, then, more countries at grade 8 than at grade 4 saw no change in their performance.
If comparisons are limited to the 12 most recent years (1995-2007), data are available for 16 countries at grade 4. Of these, 7 saw their scores improve, 4 witnessed no significant change, while 5 experienced a decline in performance. At grade 8, of the 19 countries for which data are available over the same period, 5 countries witnessed an increase in their level of performance in 2007, 11 countries saw no significant change and the remaining 12 experienced a significant decline in their performance.
It is interesting to look more closely at the 12 countries for which the available data enable comparisons to be made between 1995 and 2007 at both grades. At grade 4, 6 of these 12 countries performed better in 2007 than in 1995, whereas at grade 8, only 2 countries showed an improvement in performance level (Hong Kong SAR and Slovenia). Eight of the 12 countries show no change in performance between 1995 and 2007 at grade 8, compared with only 2 countries at grade 4 (United States and Australia). Four of the 12 recorded a significant decline in their performance at grade 4 between 1995 and 2007, but only 2 of them at grade 8 (Czech Republic and Norway). Consequently, just as in mathematics, we see that the general trend at grade 4 is one of improvement rather than decline, whereas at grade 8 the pattern of change is less straightforward.
For the period 2003-2007, there is a more consistent pattern of change, though there seems to be a bigger decline in performance at grade 8. If we look at the pattern of performance over this period, the average level at grade 4 has, in most cases, either risen (10 countries) or remained constant (10 countries), with only one country (New Zealand) showing a decline. At grade 8, however, fewer than a third of countries witness a significant improvement in their performance (9 countries), more than a third show no change (11 countries), while the rest (more than a third) see a significant decline in their performance in science (12 countries). For the 17 countries that took part in the assessments at both grade levels, the pattern is fairly similar. At grade 4, 9 countries showed an improvement, with no country seeing its performance level fall, while at grade 8, 4 countries saw an improvement in their scores and 5 a significant decline. Eight countries are listed for which the level remained static at both grades between 2003 and 2007. Five of these countries (Japan, England, United States, Hungary and Lithuania) experienced no change at all in their performance at either grade.
3.3 Performance patterns
Tables A.3-A.4. show how scores evolved from 1995 to 1999. As was recalled in Section 2, after a few adjustments were made by the IEA, scores could be compared for a group of countries over a 12-year period.
Table A.3. shows the pattern of pupils’ performance for those countries for which data are available at grade 4. As for the previous tables, countries are listed alphabetically. At grade 4, 23 countries participated in several cycles of tests, either between 1995 and 2007 or between 1995 and 2007 or else between 2003 and 2007. It should be noted that there was no assessment of pupils at grade 4 in 1999. Consequently, countries have scores for two different years or three. Table A.4 shows the progression of student performance at grade 8. Data are available for 26 countries allowing comparisons between 1995, 1999, 2003 and 2007.
It is important to take into account the changes affecting the different education systems and to look at them in relation to changes in a country’s performance. The IEA has produced a specific report in two volumes, detailing for each country its education system and all changes introduced since 1995. For example, many countries have embarked on structural reforms of their education systems, of their syllabuses and of their teaching methods. More
12

specifically, according to the IEA report, the improvement in performance of the Russian Federation and of Slovenia could have been predicted. Both countries have made radical structural changes to their education systems, extending primary education by an extra year, and have also introduced reforms in the curriculum and teaching methods.
If we consider the general pattern of how countries have performed since 1995, the majority show a marked improvement in pupil performance in mathematics. At grade 4, 10 countries gained higher scores in 2007 than when they first took part, 5 scored less well and 8 saw no significant change in their performance in mathematics. At grade 8, 10 countries performed better in 2007 in relation to their previous scores. Nevertheless, 15 countries had lower scores and 11 registered no significant change.
If we compare only those countries for which data are available since 1995, data mapping their progression are available for 16 countries at grade 4. Of these, 8 countries saw their performance improve between 1995 and 2007, 4 saw no change, while another 4 countries witnessed a decline in their performance (Austria, Czech Republic, Hungary and Tunisia). At grade 8, of the 20 countries for which data are available for the years 1995 to 2007, 5 saw an improvement in their performance in mathematics in 2007, a further 5 recorded no significant change, while 10 countries witnessed a deterioration in their performance.
If we analyse the case of the 12 countries for which comparative data are available for both grades between 1995 and 2007, the scores show a bigger increase at grade 4 level than at grade 8 level. The performances of the Czech Republic and Hungary are unusual in that they show a decline at both grade 4 and grade 8. Six countries achieved better scores at grade 4 in 2007 compared to their 1995 performance, with England and the United States also performing more strongly at grade 8. Two countries show no significant change at grade 8 (Hong Kong SAR and Slovenia), and two others saw their performance deteriorate (Australia and the Islamic Republic of Iran). The four remaining countries of the 12 in question saw no significant change in their performance between 1995 and 2007 at grade 4, whereas one country maintained its level of performance (Scotland) at grade 8 as well, while the other three witnessed a significant decline at grade 8 (Japan, Norway and Singapore). The pattern for Japan gives cause for concern, insofar as its relatively strong performance showed a steady decline over time. Thus, the general picture is one of stagnation or improvement at grade 4, while at grade 8 the level of pupil achievement tends to stagnate or to decline.
An examination of changes in performance between 2003 and 2007 reveals a closer match between grades 4 and 8. In general, the average level of achievement at grade 4 improved for 9 countries and remained unchanged for 10 countries. For just 2 countries, we see a drop in their pupils’ performance at grade 4. At grade 8, over the same four years, a third of the countries (11) see their performance improve, a further third sustain their performance level (12) and a final third witness a decline in their pupils’ performance. For the 17 countries that participated at both grade 4 and grade 8, we see the same pattern of change at each level. For 10 of them, the changes between 2003 and 2007 and at both grades are always in the same direction: 5 see their performance improve, 4 observe no significant change and only one sees its performance decline.
At grade 4, 8 countries evidenced an improved score in mathematics in 2007, in relation to 1995. Three of these countries – Hong Kong SAR, England and Slovenia – have seen a significant increase since 1995, an increase that was confirmed in 1999 and 2003. These increases are testimony to a constant improvement in the performance of the education systems of these countries. In the case of the United States, Australia and the Islamic Republic of Iran, the performance increase between 1995 and 2007 clearly reflects the gains made between 2003 and 2007. For other countries, however, performance rose between 1995 and 2003 in particular, and then levelled off or even fell between 2003 and 2007 (for example, Latvia and New Zealand).
13
At grade 4, 4 countries scored lower in 2007 than in 1995. Among these countries we find Austria and the Czech Republic. Tunisia, which took part in 2003 and 2007, saw its level of performance fall significantly over this period. On the other hand, the performance level of pupils in Japan, Scotland and Singapore has remained constant since 1995.
At grade 8, 5 countries saw their performance improve between 1995 and 2007. The Republic of Korea, England, the United States and Lithuania took part in all four cycles of studies without witnessing any significant drop in performance, generally showing a clear increase in their pupils’ scores. The average performance level of students in Colombia shows a distinct improvement since 1995. Furthermore, in Armenia, the Lebanon and Ghana, performance levels in mathematics increased between 2003 and 2007, the only two years in which these countries have participated in the studies.
The performance in mathematics at grade 8 has remained fairly constant in Italy, Jordan, Indonesia, Bahrain and Botswana. At the same time, for a number of other countries, performance has fluctuated across the different series of tests, rises alternating with falls. To illustrate, Cyprus registered a stronger performance in 2007 than in 2003, but this rise came after an actual fall in relation to 1995. Cyprus’s performance level has therefore remained fairly stable over the period 1995-2007 as a whole.
Still at grade 8, 10 countries performed less well in mathematics in 2007 than they did in 1995. The Czech Republic, Australia, Sweden and Bulgaria saw their performance level fall significantly over successive studies. In the Islamic Republic of Iran, the decline started in 1999, whereas in Singapore, Hungary and Romania the fall is more recent, having started in 2003. Not all countries saw their performance worsen between 1995 and 2007. In Japan, for instance, there was no significant change between 2003 and 2007. Malaysia’s scores fell from 1999 onwards, while the trend in Tunisia has been more mixed (a drop between 1999 and 2003, followed by a rise until 2007). For Palestine and Egypt, the general level fell between 2003 and 2007.
3.4 An analysis of the benchmarks set by the IEA
The tables in Annex C show the changes in the proportions of pupils failing to reach the various IEA benchmarks.
It should be noted here that, in contrast to the presentation of data in the IEA reports, our preference has been to present changes in the proportion of pupils who failed to attain each benchmark, as opposed to the proportion of pupils attaining each benchmark. Given that our intention is to analyse the potential marginalization of sub-groups of populations, this approach seems more appropriate.4
Table C.1. shows the changes for the different benchmarks in mathematics at grade 4.
Comparative data are available for 23 countries, of which only 3 are developing countries (the Islamic Republic of Iran, Morocco and Tunisia). The proportion of pupils failing to attain the High and the Advanced Benchmarks seems to be stable in these three countries and involves only a handful of pupils. Of these three countries, only the Islamic Republic of Iran appears to have raised pupils’ level of achievement at the Intermediate and Low Benchmarks. For example, 56% of pupils were recorded as failing to reach the LIB in 1995, whereas this proportion dropped to 47% in 2007, a fall, then, of 9 percentage points. For Morocco and Tunisia, on the other hand, there appears to be no significant change between 2003 and 2007. We might also single out the exemplary case of Armenia, which saw its
4 The author is especially grateful to P. Montjourides (EFA-GMR, UNESCO ) for his numerous suggestions during the writing of this article.
14
pupils’ performances improve for all the benchmarks. While almost a quarter of Armenian pupils failed to attain the LIB in 2003, the number had fallen to 13% by 2007. If we now turn to fourth-grade science, the pattern is substantially the same (Table C.2.). However, the proportion of Tunisian pupils failing to reach the LIB has tended to fall, indicating a better performance and consequently less marginalization (73% in 2003 as opposed to 69% in 2007).
At grade 8 level, comparative data are available for 36 countries, 13 of these being developing countries (see Tables C.3.a.-C.4.b.). In the case of mathematics, in most of the developing countries, the majority of pupils fall below the AIB. Although they are fewer in number, the proportion of pupils falling below the HIB is generally in excess of 95% for most of the developing countries. Among the top performers, it is worth mentioning the Republic of Korea, which, between 1995 and 2007, managed to reduce the proportion of its pupils falling below the HIB (it fell from 69% in 1995 to 60% in 2007). As far as our analysis of marginalization is concerned, the most interesting data are to be found in Table C.3.b. The table shows a change in the proportion of pupils falling below the IIB and LIB. The case of Colombia deserves a special mention: the proportion of pupils below the LIB shows a strong downward trend between 1995 and 2007: between these two dates, it fell from 80% to 61%, albeit still very high. For other countries, the picture is very much more mixed. This is particularly so in the case of Tunisia, which experienced a discernible increase in the proportion of its pupils falling below the LIB between 1995 and 2007 (up from 22% to 39%), having experienced a more difficult situation in 2003 (when close to 45% of pupils scored below the LIB). Malaysia, too, saw a potential increase in the incidence of marginalization: whereas only 7% of pupils fell below the LIB in 1999, the figure was more than twice that much eight years later (18% in 2007). Lastly, among the 13 developing countries in the table, only Colombia and Ghana saw a decrease in the proportion of pupils falling below the LIB, 5 countries saw no significant change (Bahrain, Botswana, Indonesia, Jordan and Lebanon), while 6 countries registered a clear increase in the proportion of pupils below the LIB (Egypt, the Islamic Republic of Iran, Malaysia, Palestine, Thailand and Tunisia).
The pattern in science is shown in Tables C.4.a. and C.4.b. By and large, we find the same trend as far as the AIB and HIB are concerned (Table C.4.a). However, if we compare science and mathematics with regard to the LIB, the patterns are noticeably different. Among the 13 developing countries for which data are available, for six of them the proportion of pupils below the LIB has declined over time (Bahrain, Colombia, Ghana, Jordan, Lebanon and Tunisia), while this was the case for only 2 countries in mathematics. For 5 countries, the proportion of pupils below the LIB tended to rise (Egypt, the Islamic Republic of Iran, Malaysia, Palestine and Thailand). For the remaining 2 countries, the trend was more or less static (Botswana and Indonesia).
4. A global analysis of marginalization in terms of pupils’ learning
4.1 An analysis of variability and marginalization internationally
Before conducting an analysis of marginalization within countries, it will perhaps be of some relevance to analyse such marginalization across countries. This was in part the approach we adopted in presenting performance differences between countries. Annex D gives a more detailed analysis, by taking into account variations in the scores both within and across the countries that participated in the TIMSS Study.
Thus in Figures D.1-D3, will be found the relationship, for mathematics at grade 4, between mean score and standard deviation. It is fairly clear that as countries’ scores increase, variability decreases. This is confirmed, though less categorically, when countries are differentiated according to their economic level (Tables D.2 and D.3.). It is particularly noticeable that the level of standard deviation for countries like Kazakhstan and Mongolia
15

(roughly 85), is much lower than for Yemen or Tunisia (roughly 110). Thus we can infer that marginalization diminishes in absolute terms, as a country’s level of performance improves.
When we turn our attention to grade 8, the trend is less clear-cut (see Graphs D.4.-D6). This may be due to the fact that more countries are involved. We even tend to see a positive relationship between the mean level of performance and the level of variability in the scores. This is confirmed for the developed countries in particular (Graph D.5). For the group of developing countries, even if the relationship appears to be positive, it is nonetheless more nuanced (Graph D.6).
4.2 A univariate analysis
The number of variables we used to identify possible cases of marginalization was six. Unfortunately, some dimensions – such as ethnic group or skin colour – are not available for the countries that participated in the TIMSS 2007 Study. It should be noted nonetheless that some countries, such as the United States, were able to distinguish the group of origin by asking each pupil to state their identity. Unfortunately, these data were not published with the TIMSS 2007 database.
It may be of particular interest to analyse at the outset the effect of socio-economic variables on pupils’ performance and on their chances of attaining, or not attaining, the low benchmark. Thus, the variable we took first was the one relating to the estimated number of books in the home. In responding, pupils had to choose between five possibilities (no books at all, between 1 and 25 books, between 26 and 100 books, between 101 and 200 books, more than 200 books). To simplify the analysis, the first two categories were combined, as were the next two. We thus ended up with three categories (fewer than 26 books, between 26 and 200 books and more than 200 books). The parents’ education was another variable measuring the socio-economic level of the pupil’s family and may be a key factor in marginalization. The variable used here is derived from a variable converted into a number by the IEA and grouping the education of the father and the mother together. If at least one parent had reached the level in question, the variable was given a value of “1” for this category. The different categories are: 1 = “university level”; 2 = “post-secondary but not tertiary, International Classification of Education (ISCED) 4 or 5B”; 3 = “upper secondary completed, ISCED 2B”; 4 = “lower secondary completed, ISCED 2A; 5 = “secondary started but not completed, or below secondary”; 6 = “Don’t know”.
To detect any possible marginalization, we also used the pupils’ gender as a variable. Pupils were asked at the beginning of the questionnaire to state whether they are male or female. Since pupils were differentiated according to gender at the sampling stage, there were no missing values for this variable.
The language spoken at home was also taken into account. This variable was originally divided into four categories: “always”, “nearly always”, “sometimes” and “never”. To make the tables easier to read, the first two categories were combined, as were the last two.
All school heads were asked to fill in a questionnaire. They were asked in particular to state the size of the town in which the school was located. There were six different categories to choose from: “more than 500,000 inhabitants”, “between 100,001 and 500,000 inhabitants”, “between 50,001 and 100,000 inhabitants”, “between 15,001 and 50,000 inhabitants”, “between 3,001 and 15,000 inhabitants” and lastly “fewer than 3,000 inhabitants”. Some of these categories were combined to ensure a minimum number of observations in each. Four categories were eventually retained: “fewer than 3,000 inhabitants”, “between 3,001 and 15,000 inhabitants”, “between 15,001 and 100,000 inhabitants” and “more than 100,001 inhabitants”.
16
The final variable in the TIMSS Study that might be a contributing factor to marginalization was the pupil’s country of birth. In the questionnaire given to pupils, they were asked under Question 21.A whether they were born in the country being tested.
The tables appearing in this section are all organized along the same lines and should allow quick identification of those countries where marginalized populations are to a greater or lesser degree present. Countries are not arranged alphabetically but according to their absolute level of marginalization. First of all, each of the categories of the variable in question is presented. For each category have been entered the portion of the population affected , the mean score obtained by this sub-population and the proportion of pupils with a score below the low benchmark (i.e. a score of less than 400 points). In addition, the last four columns allow us to evaluate the performance differences between the two extreme categories. These possible differences were measured by calculating the difference in the mean score and testing whether it was significant at a margin of error of 10%. In addition, we established the difference in the proportion of pupils gaining a mark of less than 400 points and tested whether this difference was significant or not, again at a margin of error of 10%. Countries were then ordered according to the difference in the proportion of pupils scoring less than 400 points, starting with those for which it was smallest. Thus the countries placed at the top of the table are those for which the degree of marginalization is lowest in relation to the variable in question. Conversely, the countries at the bottom of the table are those for which marginalization appears to be highest. Marginalization is here evaluated in relation to the proportion of pupils awarded a mark below the minimum threshold set by the IAE (i.e. 400 points).
4.2.1 Factor No. 1: the number of books in the home
The first variable tested was the number of books in the home (Tables E.1.a-E.1.d.). As already indicated, this variable was reformulated in order to ensure a minimum number of observations per group. There are three categories: “More than 200 books”, “Between 26 and 200 books” and “Fewer than 26 books”. The proportions of pupils, their mean scores and the proportions of them gaining a mark of less than 400 points were entered in each sub-column, for each category. Thus, we observe, for example, that only 3% of pupils in eighth-grade mathematics from El Salvador said they had more than 200 books at home, compared to 22% from Australia. Conversely, close on 76% of pupils from Morocco replied that they had fewer than 26 books at home, while the figure was less than 1% for Japan. We can say straight away therefore that there is marginalization across countries in terms of the number of books found in the home.
However, the most interesting analysis comes from comparing differences in scores between the different categories of this variable. For some countries, having books or not having books seems to have no significant effect on performance or even on the probability of obtaining a low score. This is true not only for certain developing countries, like Qatar or Algeria, but also for some developed countries, like the Netherlands. For other countries, however, these differences seem to be substantial. In the Islamic Republic of Iran, for example, the difference between pupils who have only a small number books and those who have a large number is as much as 26%: this means that, on average, having books in the home reduces the probability of gaining a low score by around 26%. In other countries, the effect is less dramatic, but remains at a relatively high level: for example, in Hungary, New Zealand and Morocco. Still with grade 4, we find that the effect of having books or not having books at home is fairly similar for science (Table E.1.b.). The ranking of countries here closely matches that shown in Table E.1.a.
When we turn to grade 8 level, the fact that more countries participated allows us to compare possible degrees of marginalization between countries (Tables E.1.c. and E.1.d.). To illustrate, we find that only 1% of pupils in Indonesia have more than 200 books at home,
17

whereas for the Republic of Korea this figure rises to more than a quarter (26%). At the other end of the spectrum, more than 7 children out of 10 from Ghana said they had at most 25 books at home, whereas only about 2 out of 10 pupils from the Republic of Korea said the same (20%). If we examine differences in scores, we can, at the international level, contrast the pupils from Qatar, with fewer than 26 books at home (and a score of 287 points), with the pupils from Taiwan of China, with more than 200 books at home (and a score of 649). The former have a 90% chance of scoring less than 400 points, whereas for the latter the chances are close to 1%. The score of the first group is less than half the score of the second group. This degree of marginalization cannot, therefore, be dismissed. If we look at countries on an individual basis, the consequences of having books at home appear to be equally significant for a certain number of them. Such is the case for Colombia, where there is a 32% difference: having a large number of books at home reduces the chances of a low score by 32%, in comparison to pupils who have few books at home. However, for other countries, such as Algeria, Ghana, the Syrian Arab Republic and Palestine, the effect appears to be negligible. Thus, we cannot really talk of marginalization, when considering this variable. The effects are rather similar for science (Table E.1.d.).
4.2.2 Factor No. 2: parents’ education
Parents’ education is a factor that can be used to measure the importance of socio-economic effects on children’s performance. Tables E.2.a. and E.2.b. show the results for grade 8 only. The fourth-grade pupils were not, in fact, questioned in this area.
In terms of international comparisons, the effects of the parents’ education are striking. For example, in the case of El Salvador, pupils from families where neither parent completed their lower secondary schooling had an 85% chance of scoring less than 400 points, whereas in the case of Japan, for those pupils from families where one or both parents went to university, the figure is less than 1%. The average score for El Salvador was 323 points, compared to 594 points for Japan.
Just as in the tables showing different success rates in relation to the number of books in the home, we find, for Algeria, Kuwait and Japan, that marginalization is non-existent. In other countries, however, the differences seem to be highly significant. This is true for Turkey in particular, where pupils whose parents failed to complete their lower secondary schooling are 66% more likely to score less than 400 points than pupils from families where at least one parent went to university. An interesting point to emerge is that the average attainment level for pupils from Turkey who come from families where one of the parents went to university is slightly higher than for pupils from the United States who are in a similar position (538 points for Turkey compared to 527 for the United States). Certain levels of populations are therefore “protected” in some countries, while others, in contrast, appear to be more marginalized. Obviously, the bigger the differential is, the greater the scale of the marginalization. Even so, less than 1% of pupils from Turkey are from families where both parents failed to complete their lower secondary schooling. The proportion of marginalized pupils is higher in other countries such as the Islamic Republic of Iran (3%), Indonesia (9%) and Thailand (18%). In this respect, the case of Palestine evidences serious inequalities between pupils, since those whose parents are well educated are 30% less likely to fall below the 400 points divide, compared to pupils whose parents have had very little education. Although the results for science seem broadly comparable, certain differences emerge nevertheless (Table E.2.b.). Algeria, in particular, is a case in point, where a significant difference exists between the two groups of pupils (a difference of 12 percentage points). In this area, little, if anything, separates the Asian countries included in the analysis, the differences in performance between the groups being either negligible or small (Japan, Republic of Korea, Hong Kong SAR, Singapore and Taiwan of China).
4.2.3 Factor No. 3: pupils’ gender
18
Differences in the education of boys and girls should be eliminated by 2015, if the Dakar goals are to be met. The fact is that differences in performance according to a pupil’s gender can sometimes turn out to be more substantial than those relating to schooling itself.
Tables E.3.a.-E.3.d. show possible marginalization effects according to a pupil’s gender. In fourth-grade mathematics, we observe differences in performance for some countries, such as the Islamic Republic of Iran or Kuwait. However, any differences that do occur are in the girls’ favour and are on a rather small scale, compared to those encountered earlier. For example, boys from the Islamic Republic of Iran are about 8% more likely to score less than 400, compared to girls. On the other hand, there are countries where the differences appear to be negligible. This applies as much to developed countries, like the United States, as to developing countries, like Mongolia. As for fourth-grade science, the effects were found to be similar to those for mathematics (Table E.3.b.). The case of Kuwait, however, should be noted, where the effect was three times higher: while in mathematics the difference in probability was 7% in favour of girls, in science it was 19%.
The effects of gender on performance and on the possibility of marginalization seemed stronger at grade 8 (Tables E.3.c. and E.3.d.). This was especially the case for several Arab countries. In the Syrian Arab Republic, Palestine, Tunisia, Bahrain, and Oman, gender has a significant effect on the probability of obtaining a low score in both science and mathematics. In the case of mathematics, while it is the girls who came out on top in the case of the Syrian Arab Republic and Tunisia, (a differential of 16 and 21 points, respectively), in Palestine, Bahrain and Oman, the boys performed best (a differential of 36, 32 and 55 points, respectively). For other developing countries the effect was not significant. This was particularly true for Turkey and Indonesia.
4.2.4 Factor No. 4: the language spoken at home
The pupil’s geographical and cultural origins may be another powerful factor in marginalization. The language spoken at home can serve as a variable that allows an assessment of the pupil’s origin (Tables E.4.a.-E.4.d.). When pupils speak the language of the test at home either frequently or always, they can be considered as having been born in the country being tested and their family, as a general rule, as originating from the same country. Or again, the family may have fully integrated into the country, thus providing their offspring with the tools necessary for academic success. On the other hand, some pupils who do not speak the language of the test frequently at home might come from another country or else live in an area where the national language is not spoken as the main language. It goes without saying that this type of population can be marginalized on a more or less large scale.
Tables E.4.a-E.4.d. show possible performance differences between these different groups of pupils. In some countries, given that the proportion of pupils speaking the language of the test only rarely or not at all was very small, caution must be exercised when interpreting these differences (Japan or Hungary are examples).
At fourth-grade level, the proportion of “foreign” pupils varied widely from country to country. While it was very small in some countries (such as Lithuania and Italy), in others it was very much higher (as in the countries of North Africa, namely Morocco, Algeria and Tunisia). For 11 countries, the differences do not appear to be significant, if the picture is restricted to the chances of scoring less than 400 points. Among these countries feature some of the developing countries (such as Algeria and Yemen). On the other hand, for a further 12 countries, the effects are indeed significant, on a scale of difference that is in excess of 10 percentage points. Among these countries, developed countries (New Zealand, Denmark, Norway and Australia) are no less in evidence than developing countries (the Islamic Republic of Iran, Mongolia, El Salvador). For example, pupils who speak the language of the
19
test rarely or never are 25% more likely to score below 400 than pupils who speak the language of the test regularly or always at home. From Table E.4.b., it is clear that the differences in science follow a similar pattern. They do, however, seem to be slightly more common, since the scale of the differences for around 20 countries is in excess of 10 percentage points.
Given that more countries participated in the evaluation of pupils at grade 8, the effects at this level are sometimes greater for certain countries (Tables E.4.c. and E.4.d.). In mathematics, the effects arising from the particular language spoken at home ought, perhaps, to give cause for concern with respect to Bulgaria (a 25% difference), the Islamic Republic of Iran (26%), Serbia (28%), Turkey (29%) and lastly Romania (29%). In total, the scale of difference is again more than 10% for 21 countries, with no significant difference for a further 16 countries and only a slight difference for the remaining 12 countries. The effects are similar in the case of science, except for El Salvador, where they are more marked in science than in mathematics (24% as against 13%, respectively).
4.2.5 Factor No. 5: location of school
The school’s location can be an important factor affecting marginalization, depending, in particular, on whether it is situated in a small town or village, or in a city. Tables E.5.a-E.5.d. show the results for this variable.
For some countries or territories, such as Singapore, it was impossible to make such a distinction, given that few, if any, sparsely populated areas exist. The proportion of rural areas (a population of fewer than 3,000 inhabitants) varied widely between countries. Whereas in some countries it was nil or very low (Taiwan of China, Italy, the Netherlands), in some of the developing countries it was very high (Yemen, El Salvador, Tunisia).
For fourth-grade mathematics, countries can be divided into three groups on the basis of the effect of this particular factor. With respect to the first group, the location of the school appears to have had no significant effect on pupil performance (17 countries). Algeria, Georgia and Colombia belong to this group. The second group is one on which location has had some effect but one which is limited in scale (less than 10%, for 11 countries). Morocco, Kazakhstan and Austria fall into this category. Lastly, in relation to the third group, the effect is significant and equates to more than 10 percentage points (6 countries). The six countries in question are Hungary (+14%), Ukraine (+20%), Tunisia (+22%), the Islamic Republic of Iran (+26%), Mongolia (+26%) and El Salvador (+38%). This last country is quite a significant case, to the extent that for children enrolled in a village school, their chances of obtaining a low score (less than 400 points) are an extra 38% more than for pupils attending a school in a large town (population of more than 100,001 inhabitants). The results for science are broadly similar (Table E.5.b.).
Tables E.5.c. and E.5.d. show the possible effects of a school’s location on the performance of eighth-grade pupils. The effects were non-existent for 10 countries in mathematics. Among these, we find a number of Arab countries such as Tunisia, Syrian Arab Republic and Palestine. For another 24 countries, the effects were significant and on a scale in excess of 10 percentage points. However, the most seriously affected countries were Botswana (+28%), the Islamic Republic of Iran (+29%), Colombia (+30%) and lastly Malaysia (+35%). Whereas the proportion of the population living in villages in Colombia and Malaysia is relatively small (6% and 5% respectively), it accounts for more than a fifth of the school population in Botswana (25%), the Islamic Republic of Iran (22%) and Colombia (21%). In the case of science, the effects were less marked, since they were non-significant at a margin of error of 10% for 19 countries (Table E.5.d.). However, in the case of El Salvador, the effects were even more serious in relation to science, since the difference, in favour of the pupils in large towns, was +38%, whereas it was 27% for mathematics.
20
4.2.6 Factor No. 6: Pupil’s country of birth
The pupil’s country of birth is a variable closely related to the “language spoken at home” variable. However, it allows us in the present context to distinguish between nationals and foreign residents, whereas in the case of the language spoken at home, there might also have been included individuals from particular ethnic groups who simply speak a different language from that of the country being tested.
Tables E.6.a-E.6.d. show the results of the difference tests relating to the country of birth of the pupil. For grade 4, we find that the proportion of pupils born abroad is sometimes nil for certain countries. This was the case for Japan and for the Islamic Republic of Iran. On the other hand, in some of the other countries, the immigrant population is very large. It accounts for four children in ten in Yemen (44%) and in Kuwait (41%), and in Qatar for actually more than half of children in school (58%). The difference in success rates for mathematics was not significant in the case of eight countries, which included Yemen, the Islamic Republic of Iran and Algeria. In contrast, significant effects in excess of 10 percentage points were found in the case of Slovakia (+35%), Hungary (+30%), Georgia (+29%) and Mongolia (+23%). The results in science were broadly similar to those in mathematics (Table E.6.b.).
At grade 8, differences between the different groups were significant and on a scale in excess of 10% for 34 countries in mathematics (Table E.6.c.) and for 37 countries in science (Table E.6.d.). In certain Arab countries, such as Morocco and Egypt, the differences between those children born in the country tested and the others were substantial: the former were 30% less likely to score below the low threshold set by the IEA. For Romania and Ukraine, the effects are found to be equally substantial (35% and 34%, respectively). With regard to science, the effects turn out to be even more marked, since seven countries can be listed, where children who were born in the country tested are more than 30% less likely to be marginalized than those born elsewhere (Indonesia, Thailand, Oman, Ukraine, Malaysia, Colombia and Egypt).
4.3 A summary of the differences in the univariate analysis
The purpose of this section is to summarize the main outcomes of the previous section. Given that several variables were tested to identify marginalization, it may be of interest to see in a single table a summary of the scale of these effects for each country. This has been done for each grade and each area tested. Tables F.1-F.4. in Annex F thus show for each country the found result concerning the difference in performance for the two extreme categories and for each variable tested.
The number of variables tested was six for grade 8 and five for grade 4: the number of books in the home, the parents’ education (for grade 8 only), the gender of the pupil, the language spoken at home, the size of the town, etc. where the school is located and lastly the country of birth of the pupil. As the entire thrust of our study is to measure degrees of marginalization, differences relating to the proportion of pupils falling below the 400-point threshold seemed of primary importance. This was the yardstick chosen, therefore, to summarize the information. The precise significance of the tests is explained in more detail below:
• For the “books at home” effect, we used the test from Tables E.1.a-E.1.d. concerning the difference in proportion between pupils with fewer than 26 books at home and those with more than 200. The found coefficient is generally positive and tells us the probability differences between the two groups. Thus, to take an example, pupils from the Islamic Republic of Iran who have at most 25 books at home are 26% more likely to gain a low score (i.e. below 400 points) than pupils from the same country with
21
more than 200 books at home. The presence of the symbol ▼ in the column relating to this variable means that this difference is significant.
• The “parents’ education” effect was only available for grade 8, and therefore only appears in Tables E.2.a. and E.2.b. The found coefficient represents the difference in proportions between the two extreme categories of this variable. To be precise, these were pupils from families where neither parent had completed their lower secondary schooling and pupils from families where at least one parent went to university. For example, in the case of science, it will be observed that the effect of the parents’ education is a highly relevant factor in Thailand, where its impact is quite dramatic: pupils whose parents had not completed their lower secondary education (ISCED 2A) were more than 59% more likely to end up with a low score (below 400 points) than pupils from families where at least one parent went to university (Table E.2.b.).
• For the “gender of the pupil” effect, the difference between girls and boys was tested. A positive number highlights the fact that, on average, there were fewer boys than girls among those pupils with low scores. Conversely, a negative number indicates that the impact of marginalization was to the disadvantage of the boys. For example, in fourth-grade mathematics, it will be seen that in the case of Tunisia, there are relatively fewer girls than boys in the low-scoring group of pupils (with a score of below 400 points), the difference being 5 percentage points and significant at a margin of error of 10%.
• Data for the language spoken at home are available for both grades. In the present context, the distinction is between pupils who speak the language of the test at home rarely or never and those speak it often or always. For example, in fourth-grade science, it will be seen that pupils from Colombia who speak the language of the test rarely or never at home were 20% more likely to end up with a low score than those pupils who speak it frequently or always (Table E.4.a.). This effect is significant at a margin of error of 10%.
• The size of the locality in which the school is situated is shown in the columns that come next. Here, a distinction was made between localities with 3,000 inhabitants or less and those with a population in excess of 100,001. Whether the effect was big or small depends on the country. In the case of eighth-grade mathematics (Table E.5.c.), we see that pupils from Malaysia who go to school in a village (fewer than 3,000 inhabitants) were 35% more likely to obtain a low score (below 400 points) than pupils attending school in a large town (more than 100,001 inhabitants).
• Finally, the pupil’s country of birth can be an important guide to the degree of marginalization in each country. It is clear, for example, that in fourth-grade mathematics, pupils from Lithuania born elsewhere were 21% more likely to obtain a low score than pupils born in Lithuania itself (Table E.6.a.).
The last column of each table gives us an overview of the possible marginalization of pupils. The found value was calculated by adding up the absolute values of the different values of the preceding columns. In this way, a global index of marginalization could be found. The bigger this index is, the greater the differences between the groups of pupils, within the set of dimensions taken into account. It should be noted here that the effects are exclusively univariate, and so they cannot constitute a direct aggregate effect. Thus it is not possible to say in cases where the pupils are marginalized, that, for example, their chances were 85% higher than for other pupils from Hungary in fourth-grade mathematics (Table F.1). This value is only indicative and cannot be compared with the other found indices for other countries.
22
An overview of the effects for fourth-grade mathematics is shown in Table F.1. For the sake of simplicity, countries are ranked in terms of possible marginalization. Only Algeria and Hong Kong SAR evidence no significant difference for the five possible dimensions of marginalization. We can therefore infer that, on the basis of the information used in the present study, no specific marginalization of populations is discernible for Algeria and Hong Kong SAR in fourth-grade mathematics. We shall see later whether this observation is confirmed or not. For certain other countries, the degree of marginalization also seems to be low whenever it is present (Armenia, Japan, Kazakhstan). In fact, the found index of marginalization is generally below 20 in these countries. Overall, the degree of marginalization is relatively low for about ten countries (i.e. lower than 20), whereas it appears very high for countries like Hungary (an index of 85), the Islamic Republic of Iran (84) and El Salvador (69).
A summary of the results for fourth-grade science is given in Table F.2. The ranking order of countries is virtually the same as for mathematics. However, in the case of Hungary, the degree of marginalization is lower, the index falling from 85 to 47. Certain other countries, such as Kazakhstan, Algeria and Hong Kong SAR, evidence very little marginalization, if we confine our observations to the dimensions evaluated.
In the case of eighth-grade mathematics, the availability of a greater number of countries revealed numerous cases of marginalization (Table F.3). However, rather significantly, we found very little marginalization in Algeria (an index of 4), Singapore (10) and Armenia (12). In contrast, the incidence of marginalization was very high (“high” meaning here in excess of 100) in 11 countries (Hungary, Serbia, Norway, Turkey, Islamic Republic of Iran, Bulgaria, Thailand, Ukraine, Colombia and Romania). More particularly, the found index of marginalization for Romania was 178, which is extremely high, compared to the index of other countries. It is important to stress that among the countries where there appears to be a high level of marginalization (Norway is an example), we find a number of developed countries. Consequently, it would seem crucial not to focus exclusively on the developing countries.
In the case of eighth-grade science, the degree of marginalization seems less marked (Table F.4). In fact, the maximum found index of marginalization was 166, compared to 178 in mathematics. But there were other differences as well. A notable case was El Salvador, where the level of marginalization was actually higher in science (an index of 129) than in mathematics (index of 76). In general, however, the trends are fairly similar.
4.4 A graphic analysis of marginalization
As we stressed in section 3, when analysing possible cases of marginalization in relation to the different variables included in the analysis, it was necessary to carry out as many tests for difference between the categories as there were possible combinations for each of them. Thus, if for one variable there were four categories, a total of eight different comparisons had to be made. In order to keep matters simple and to identify extreme positions, we decided to concentrate on the difference in performance between the two extreme categories. Thus, in the case of the number of books in the home, our analysis consisted in comparing the performance of pupils with fewer than 26 books at home with those who had more than 200. We discounted, then, those pupils with between 26 and 200 books at home.
In the present section, we tried to take into account all of the possible combinations. But since to test for differences in performance with respect to each category would have made excessive demands both in terms of calculations and of space, we have shown, for each sub-group, only the differences in the proportion of pupils falling below the LIB.
4.4.1 Factor No. 1: the number of books in the home
23

In Figures G.1.a. and G.1.b., we have set out the proportions of pupils below the LIB according to the number of books in the home. Figure G.1.a. shows the possible differences for grade 4. While the top half of the graph uses the subject- area of mathematics, the bottom half relates to science. We have focused our study on 12 countries (Algeria, Armenia, Colombia, El Salvador, the Islamic Republic of Iran, Georgia, Kazakhstan, Mongolia, Morocco, Qatar, Ukraine and Yemen). In the case of mathematics in the Islamic Republic of Iran, wide variations are apparent between the different categories. Thus, while more than 55% of those pupils who stated they had fewer than 26 books at home scored less than the LIB, among those who stated they had more than 200 books at home the figure was barely more than 20%. For certain other countries, however, the differences appear less marked (Armenia, Kazakhstan and Yemen). While for Kazakhstan, the lack of a substantial difference can be ascribed to the fact that the average attainment level was very high, for the Yemen the opposite was true. Differences relating to the number of books in the home are equally marked in Ukraine, where more than 35% of those pupils who had fewer than 26 books at home scored below the LIB, whereas the proportion was less than 10% for pupils with between 101 and 200 books at home. Similar variations were discernible in science.
At grade 8 level, we chose 24 countries, either developing or in transition. The differences between groups were very pronounced in some countries, such as Thailand and Turkey. Thus, while more than 60% of pupils who stated they had fewer than 26 books at home scored less than the LIB, slightly more than 20% with this score said they had more than 200 books at home. In the case of Thailand, the figures were about 40% and under 10%, respectively. In other countries such as Algeria and Ghana, the differences were distinctly less pronounced, thereby confirming our earlier results. In science, the results were fairly similar.
4.4.2 Factor No. 2: parents’ education
Parents’ education was only available for grade 8 (see Figure G.2.). For some countries, such as Oman and the Islamic Republic of Iran, the effects were in similar proportions to those relating to the number of books in the home. For Algeria and Bahrain, the effects were virtually non-existent. It is to be noted that, once more, the differences were very marked in the case of Turkey: 70% for pupils who stated that they did not know the educational level of their parents, compared to less than 10% for those from families where one or both parents had been to university.
4.4.3 Factor No. 3: pupils’ gender
Differentiating on the basis of gender adds nothing new to our earlier analyses, given that only two categories are possible (G.3.a. and G.3.b.). In general, girls outperformed boys, except for a small number of countries such as Algeria and the Islamic Republic of Iran. However, for the majority of countries, this factor did not appear to be decisive in terms of marginalization.
At grade 8, however, some quite significant differences emerged for some countries (for example, Bahrain, Colombia, Palestine and the Syrian Arab Republic).
4.4.4 Factor No. 4: the language spoken at home
Differentiation on the basis of the language spoken at home is illustrated in Figures G.4.a. and G.4.b. Very marked differences are apparent in certain countries, in particular countries like Colombia and the Islamic Republic of Iran. Thus, in the case of the latter, fewer than 20% of pupils who stated they spoke the language of the test frequently or always at home fell below the LIB, whereas for pupils who stated that they never spoke the language of the test at home, the number rose to more than half.
24
At grade 8 level, differences were sometimes in the favour of individuals who did not speak the language of the test at home (examples are El Salvador and Botswana). On the other hand, for the majority of countries, the differences at secondary level were slight.
4.4.5 Factor No. 5: school location
The school’s location can be a key factor in the potential marginalization of pupils. Figures G.5.a. and G.5.b. show the differences in the proportion of pupils below the LIB according to the different categories of the “school location” variable. Just as for the earlier results, the differences were slight with regard to Algeria, Yemen and Armenia. The differences in the case of the Islamic Republic of Iran and El Salvador, on the other hand, were substantial. In general, it was the schools in villages (fewer than 3,000 inhabitants) that experienced the highest proportions of pupils below the LIB.
At grade 8 level, the differences appeared more pronounced in the case of Thailand, where the proportion of pupils below the LIB increased in proportion as the size of the school’s locality decreased. This observation can also be shown to apply to other countries such as Colombia and Malaysia. When the results for science are analysed, the differences turn out to be fairly similar.
4.4.6 Factor No. 6: pupil’s country of birth
There can be a significant difference between pupils born in the country tested and those born abroad. As we saw earlier, at grade 4 the differences were especially marked in Colombia and in Mongolia (Figure G.6.a.). In contrast, very few differences existed in certain other countries, such as Yemen or Morocco.
At grade 8 level, differences persisted for those countries that have data for both grades, especially Colombia and Morocco. Equally worthy of note are the very marked differences in Indonesia and in Syrian Arab Republic. In contrast, the differences in the case of Qatar and of Saudi Arabia are very slight. This can most certainly be ascribed to the fact that the proportion of pupils from these countries who were born abroad is relatively small, compared to other countries.
5. A comparison between the “marginalized” population and the global population
In this section, our intention is to compare the structure of a marginalized population, namely one with a score below the LIB (400 points), with that of the global population. If the structures appear different, then we can be confident that certain characteristics are more important than others for the detection of marginalization.
The exercise was structured as for earlier sections, namely that we would distinguish one by one the six factors that seemed to us to be the most significant for measuring cases of marginalization, in accordance with the data at our disposal.
Tables H.1.a. and H.1.b. present general information about the median scores and the proportions of pupils below the LIB. It will be recalled that a sharp difference exists between the developed countries and the developing countries. While the proportion of the population below the LIB is very small in most developed countries, it can extend to virtually the whole population in the developing countries. In this respect, we might compare the United States with Yemen: in the former, only 4% of pupils in fourth-grade mathematics scored below the LIB, whereas in Yemen the figure was 96%. Just this one country, then, evidences marginalization on a massive scale in relation to most other countries. At this point we should stress the advantage of including developing countries in international studies, since this puts into perspective the differences that exist between the developed countries. For information,
25
we also calculated the international averages when the entire range of countries is included. It should be noted that weightings were not introduced at this stage, otherwise small countries would have been given too little weighting by virtue of their relatively small size.
The tables have all been organized along the same lines. The first two columns show, respectively, the proportion of pupils below the LIB and the number of pupils taken into account in the study. This number is generally lower than the total number of pupils, on account of the missing values. Thus, on the strength of this number and the proportions in the next columns, it is an easy matter to calculate the exact number of pupils potentially affected by marginalization. The next columns contain two sub-columns. The first of these represents the proportion of pupils obtaining a score below the LIB, while the second shows the size of this sub-population in relation to the total population. Thus, if we find, for example, that the number in the first column is higher than the one in the second column, then it means that this sub-population is over-represented in the “marginalized” group. If the opposite is the case, then it will be under-represented.
This kind of analysis may seem laborious, and for this reason we decided to calculate two synthetic indices, which makes it easier to interpret degrees of marginalization. The first index is the absolute degree of marginalization. This is calculated simply by adding together the absolute differences between the proportions of pupils with a score below the LIB and their proportion in relation to the total population. Thus, for example, in the case of the number of books in the home for Armenia (see Table H.2.a.), the index is calculated as follows: (“Abs” here means “Absolute Value”):
Abs(27-22) + Abs(24-21) + Abs(24-25) + Abs(9-13) + Abs(16-19) = 16
A major disadvantage of this absolute measure is that it does not measure the relative difference between that portion of the group in question with a score below the LIB and the portion it represents in the total population. To measure relative differences, therefore, we calculated the index of relative marginalization, which is done using the relative variations in the differences in proportion between the two dimensions being measured. Still with Armenia and for fourth-grade mathematics, the following operation was performed (again, “Abs” stands for “Absolute Value”):
[[Abs(27-22)/22)+Abs((24-21)/21)+Abs((24-25/25)+Abs((9-13)/13)+Abs((16-19)/19)]*10]/nb = 8.76
To make this index easier to read, it was multiplied by 10, then divided by the number of categories present in the variable (in this case, nb = 5) and finally rounded to the nearest whole number. Countries were then ranked in ascending order of their relative degree of marginalization. This enables us to see at a glance whether or not marginalization is present in relation to the dimension under consideration and especially to compare the scale of marginalization among the different variables in question.
5.1 Factor No. 1: the number of books in the home
The results of the comparison made on the basis of the number of books in the home are shown in Tables H.2.a.-H.2.d. Table H.2.a. gives the comparison for fourth-grade mathematics. It indicates, accordingly, that on average, i.e. if we analyse the total population, the group of pupils who replied that they had fewer than 26 books at home is substantially over-represented in the “marginalized” population. In fact, while they represent less than 20% of the total population, they constitute more than 40% of the “marginalized” group. The relative index of marginalization is thus 5. If we now look at countries individually, we also find sharp differences for a certain number of them. To take the Netherlands as an example, we see that the “marginalized” group represents only 8% of the total population, whereas
26
they form close on a third of the “marginalized population”. The relative index of marginalization in this case is 9, in other words almost double that of the level worldwide. In some countries, such as Germany or Taiwan of China, this form of marginalization seems very high. However, we should also note that the proportion of pupils below the LIB is correspondingly low. Hungary offers a particularly striking example of a substantial difference between the different groups: the relative index of marginalization is 10; in other words, double the international mean. For certain other countries, the degree of marginalization is, in contrast, negligible or even non-existent. This is the case for Yemen and Morocco, in particular. The results in science are fairly similar (Table H.2.b.).
If we turn our attention to eighth-grade mathematics (Table H.2.c.), the relative index of marginalization worldwide is 4, slightly lower, then, than the found index for grade 4 (5). For a large number of countries, however, marginalization is seen to be very prevalent. Its level is very high in certain Asian countries, such as the Republic of Korea, Japan and Taiwan of China. Hungary, too, constitutes a very striking case: although pupils who had stated having fewer than 26 books at home represent only 7% of the global population, they make up close on a third of pupils scoring below the LIB (32%). It is clear, therefore, that they are substantially over-represented, in contrast to pupils who had stated they had more than 200 books at home (9%). The pattern is very similar for science (Table H.2.d.).
5.2 Factor No. 2: parents’ education
It will be recalled that the variable relating to the parents’ education applies only to grade 8 (Tables H.3.a. and H.3.b). The relative degree of marginalization worldwide in mathematics has an index of 3, which is lower than was found to be the case for the variable relating to the number of books in the home. Algeria and Ghana are exemplary cases of countries where marginalization is non-existent. In contrast to this, certain other countries such as Hungary and Japan exhibited a high degree of relative marginalization. This observation was confirmed by the analysis for science. Whereas the international mean of relative marginalization in science is 3, for Hungary it was actually in excess of 38. It emerged very clearly that children from homes where at least one of the parents went to university are under-represented in the pupil population scoring below the LIB.
5.3 Factor No. 3: pupils’ gender
As expected, marginalization in relation to a pupil’s gender turned out to be relatively slight in most countries (Tables H.4.a.-H.4.d.). The degree of marginalization worldwide is 0, which underlines the absence of marginalization, if all pupils in the sample are included. Contrary to popular belief, girls are not systematically marginalized in relation to boys. It proved to be very much the opposite, in fact, with girls being under-represented in the marginalized group. As an illustration, although girls made up half of the population assessed in the Russian Federation, the proportion of girls in that population scoring below the LIB was only 33%. In science (Table H.4.b.), the results were very similar. The Asian countries, in general the top performers, emerged in this instance as countries where marginalization was highest (e.g. Hong Kong SAR, Taiwan of China, Singapore and Japan).
At grade 8, the results worldwide are similar to what was found at grade 4. The relative degree of marginalization is nil worldwide. The three countries/ regions where levels were highest are in Asia (Hong Kong SAR, Taiwan of China and Singapore). Nevertheless, it will be observed that, in most countries, marginalization in terms of gender is non-existent, whether one takes mathematics (Table H.4.c.) or science (Table H.4.d.). It should be noted, however, that in Bahrain and in Jordan, marginalization seems more prevalent in science.
5.4 Factor No. 4: the language spoken at home
27
Tests making structural comparisons between the population scoring less than the LIB and the total population in terms of how frequently the language of the test was used at home are presented in Tables H.5.a.-H.5.d.
For fourth-grade mathematics (Table H.5.a.), the relative degree of marginalization was fairly high, in comparison to what was found for the other variables. In fact, worldwide, it is 7. For certain countries, such as Taiwan of China and the Russian Federation, the relative degree of marginalization was very high. Sweden and Austria are also cases that need to be highlighted, their degree of marginalization being, again, relatively high (16 and 15, respectively, compared to 7 internationally). In most of the Arab countries, on the other hand, the degree of marginalization was either small or nil (Yemen, Kuwait, Algeria, Qatar, Morocco and Tunisia). The results for science were quite similar (Table H.5.b.).
At grade 8, the relative degree of marginalization was considerably lower worldwide, both in mathematics (3) and in science (4). Nevertheless, in certain Asian countries, such as Japan, marginalization was very prevalent (26 as against the international mean of 3). Special mention should be made of the United States, since the relative degree of marginalization was four times higher than it was worldwide (12 as against 3). For science a slightly higher level of marginalization was recorded (Table H.5.d.).
5.5 Factor No. 5: location of school
A comparative analysis in terms of school location is presented in Tables H.6.a.-H.6.d. The relative degree of marginalization worldwide was fairly slight, whether we take mathematics (3) or science (3). However, the effects were quite significant in Taiwan of China (11) and in the Russian Federation (7), to take only fourth-grade mathematics. Once again, in the majority of Arab countries, marginalization turned out to be negligible or non-existent. The results in science were much the same (Table H.6.b.).
Marginalization was even slighter at grade 8, since the relative degree of marginalization worldwide is 2 in both mathematics and science. It should be noted, however, that marked differences were apparent for countries like Bulgaria (5), Japan (5) and Malaysia (5).
5.6 Factor No. 6: pupil’s country of birth
The last factor to be tested was a pupil’s country of birth (Tables H.7.a.-H.7.d.). Marginalization effects were relatively high for this factor at grade 4. The degree of marginalization worldwide at grade 4 is, in fact, 6 in mathematics and 7 in science (Tables H.7.a. and H.7.b.). Marginalization seems to be very high in certain East European countries, such as Latvia and Lithuania. Thus, in Latvia, while pupils born abroad accounted for only 7% of the total population, the group of pupils scoring below the LIB made up more than four tenths (44%). The difference is, then, very pronounced. The effect was even more substantial in science, since here the group made up more than 65% of the “marginalized” population. As can be seen for science in Table H.7.b., Slovakia was also affected by a high level of marginalization (relative degree of 18, compared to an international mean of 7).
If we now turn our attention to grade 8, the marginalization effects are seen to be less pronounced in comparison with grade 4 (4 instead of 6 in mathematics). Even so, it is in the Asian and East European countries that marginalization is most prevalent. For example, while pupils born in another country accounted for 6% of the population of pupils from Taiwan of China, the same pupils made up close on a third of “marginalized” pupils (i.e. those scoring below the LIB). The effects are even stronger in science, where these pupils accounted for more than 38% of “marginalized” pupils (Table H.7.d.).
5.7 An overview of the results
28

An overview of the results is presented in Tables H.8.a.-H.8.d. For reasons of space, we have only recorded the relative index of marginalization for each of the variables considered. Finally, in the last column of each table we have calculated the sum of the indices for each variable. The higher this number is, the greater should be our expectation of a high level of marginalization.
With reference to fourth-grade mathematics (Table H.8.a.), it will be seen that, worldwide, it is the variables of the language spoken at home and the pupil’s country of birth that have attracted a high level of marginalization. Besides, these variables tend to be linked, since they often point to the geographical origins of a pupil. If the effects of all the variables are added together, we get a relative level of marginalization of 21. For five countries, we find that the level of marginalization is in excess of or is equal to 40: Slovakia (40), Germany (41), Latvia (53), the Russian Federation (69) and Taiwan of China (87). It is important to note that countries where marginalization is prevalent are often developed countries or countries in transition. The developing country for which total marginalization was highest turned out to be Mongolia, with a relative degree of 14, which was far below that of the Russian Federation or Taiwan of China. Predictably, it is in the Arab countries that marginalization was lowest. The results were broadly similar for science (Table H.8.b.).
If we now turn to grade 8, we find that the degree of marginalization worldwide is distinctly less prevalent than was found to be the case at grade 4. In fact, in the case of mathematics, it is 16 as against 21 for grades 4 and 8, respectively. For a number of Asian countries like Japan, marginalization seems very high (98). Some East European countries also evidence a substantial degree of marginalization. Such is the case for Slovenia (59) and for Lithuania (35). The level of marginalization is slightly higher in science (Table H.8.b.). In fact, the relative degree of marginalization worldwide is 20, compared to 16 for mathematics. More particularly, two countries in Central and Eastern Europe emerged as the countries where marginalization is highest (Hungary and Slovenia). These countries were followed by two Asian countries (Japan and Taiwan of China).
6. A multivariate analysis of marginalization in education
In the previous sections, we conducted analyses of marginalization by considering only one variable at a time. However, a combination of variables may well generate additional elements of marginalization. It may be of interest, for example, to consider pupils who fall into several categories at once, in order to determine whether this has had an accumulative effect and prevented pupils from achieving a high level of performance in the TIMSS Study.
A multivariate analysis allows several characteristics to be taken into account simultaneously for the same individual. When the variable to be explained is one that takes either the value 1 or the value 0 (which is known as an “indicator variable”), as in this instance, the multivariate method is called the logistic method. This is the method used in the present section.
It is important to emphasise that there are as many regressions as there are countries, also for each level assessed and for each skills area. For reasons of space, we have concentrated exclusively on the subject-area of mathematics.
We used in total four types of regression, which we applied to grade 4 and grade 8. Note that for grade 4, only three types of regression are available. The tables in Annex 1 show the prediction of the likelihood of obtaining a score below the LIB, in other words of being “marginalized”, according to our definition of the term. In order to determine the size of the population for each combination, we also calculated the portion of this sub-category in relation to the population as a whole. In this way it would be possible to determine whether the marginalized populations were large or concentrated on a small number of pupils.
29
In all of the regressions, we used the six variables considered most likely to be factors in marginalization (books in the home, parents’ education, pupils’ gender, language spoken at home, school location, and pupils’ country of birth). It has to be remembered that at grade 4, we had only five variables, since pupils were not questioned about their parents’ education. Whenever we present in the tables in Annex 1 specific variables such as the school’s location or the pupil’s country of birth, as we did for Tables 1.A.a.-1.A.d., it means that the variables not presented (namely, books in the home, parents’ education, pupil’s gender, language spoken at home) were set at their mean level. In statistics terminology, this approach is known as the “all else being equal” approach.
6.1 Logistic regression No. 1: crossing school location and pupil’s country of birth
The first series of logistic regressions involve crossing the school’s location and the pupil’s country of birth. Our concern here is to determine whether, all else being equal, pupils born in a foreign country and living in areas of a specific population size, have a greater chance than other pupils of scoring below the LIB. The results are presented in Tables I.1.a.-I.1.b. and I.2.a.-I.2.c.
In Tables I.1.a. and I.1.b., we have shown the results for fourth-grade mathematics. For reasons of space, the table is divided into two parts. To illustrate, we are able to say that pupils from Armenia who were born in another country and who live in a small village (fewer than 3,000 inhabitants) make up 6.8% of the population tested and have a 16% chance of being “marginalized”. Conversely, pupils from this same country who were born there and who live in a large town or city (upwards of 100,000 inhabitants) have only an 8% chance of being marginalized, in other words exactly half. Being born in another country and living in a rural area therefore double the chances of being marginalized for a pupil from Armenia, assuming an average level for the other dimensions (such as the pupil’s gender or the language spoken at home). Some countries exhibit significant differences. Mongolia can be cited as a case in point. In this country, pupils who were born abroad and live in a rural area have a 66% chance of being “marginalized”, whereas the figure drops to 12% for pupils who were born in Mongolia itself and live in a large town. This type of analysis yields some very revealing results, therefore, and provides a clearer picture of the scale of marginalization. Care must be taken, however, to ensure that the population groups contain a sufficient number of pupils to be considered “representative”.
The results for grade 8 are set out in Tables I.2.a.-I.2.c. Owing to the bigger number of countries tested at this level, the table is divided into three parts. In the case of some countries, such as the Czech Republic, we find only very slight differences between the different combinations used. For certain other countries, however, we find substantial variations. We might, for example, compare pupils from Egypt who were born elsewhere and who live in rural areas (a probability of 78%) with those pupils who were born in Egypt itself and who live in large towns (a probability of 32%). It should be noted, however, that the proportions of pupils born abroad and living in rural areas are generally very small.
6.2 Logistic regression No. 2: crossing parents’ education and pupil’s country of birth
The second regression we undertook consisted this time in crossing the parents’ education and the pupil’s country of birth. Since the education variable was only available for grade 8, only this level was included in the analysis. The results are shown in Tables I.3.a.-I.3.c. As in the previous tables, the results are distributed over three tables.
We find some very interesting results that reveal a high level of marginalization in some countries, such as Egypt, Indonesia and Lebanon. In the case of Indonesia, for example, we see that pupils born abroad whose parents’ education is below secondary level, have a 79% chance of being marginalized, while for those pupils born in Indonesia itself in families where
30

one or both parents had been to university the chances are only 34%. In Ukraine, children who were born in another country are also seriously marginalized, even if they have the same level of education as children born in Ukraine itself, if we compare the group of pupils from families where at least one parent went to university. In fact, while the chances of being marginalized are 13% for pupils born in the country, the figure is 41% for pupils born elsewhere. However, given the relatively small numbers, for most countries, of pupils born abroad among the pupils tested in the TIMSS 2007 Study, it is important to bear in mind that the samples used for analysing differences should be sufficiently large.
6.3 Logistic regression No. 3: crossing school location and the number of books in the home
The third regression carried out was to cross the location of the school and the number of books in the home. Out of concern to ensure a minimum number of observations in each category, we restructured the “books at home” variable to generate just three groups: “Fewer than 26 books at home”, “Between 26 and 200 books” and “More than 200 books”. As for the school location variable, it consists of four categories: “More than 100,000 inhabitants”, “Between 15,001 and 100,000 inhabitants”, “Between 3,001 and 15,000 inhabitants” and “Fewer than 3,000 inhabitants”. The results are shown in Tables I.4.a-I.4.b. for grade 4 and tables I.5.a.-I.5.c. for grade 8.
Taking first grade 4, we find that in some countries, developed countries in particular, the differences in the probability of being marginalized are fairly small between one category and the next. This is most certainly due to the fact that the majority of pupils in these countries were successful in exceeding the LIB. Such is the case of Denmark, where the biggest difference between categories is between 1% and 6%. We cannot really talk of “marginalization” in this case, but rather of inequalities between predefined groups. On the other hand, in some developing countries, the differences are quite pronounced. The Islamic Republic of Iran is a fairly typical case in this respect: while about 18% of pupils who have more than 200 books at home and who live in a large town stand a good chance of being marginalized, this figure rises to more than 60% for pupils who have fewer than 26 books at home and who live in a small village. It is clear therefore that this analysis is very useful in identifying marginalized population groups. The above pupils from the Islamic Republic of Iran who have few books and live in villages, make up close to 18% of the population tested, which is considerable. Tunisia is another case that deserves our attention concerning the different chances of being marginalized: the chances are 30% for the first population and 83% for the second, clear evidence that populations who live in the countryside and are economically disadvantaged are also marginalized.
As for grade 8, the results were equally interesting with regard to certain countries (Tables I.5.a.-I.5.c.). Significant differences emerged, especially in the case of Indonesia (29% and 69%, respectively, for the two populations in question), Hungary (1% and 19%, respectively), Colombia (31% and 83%) and Malaysia (2% and 40%). For a majority of countries, substantial differences were evident between the different categories. It has to be remembered that we were operating on an “all else being equal” basis, i.e. that we had set the other variables at their mean values.
6.4 Logistic regression No. 4: combining pupil gender, school location and number of books in the home
The final logistic regression sought to cross not just two variables simultaneously but, this time, three. The proportions of pupils in each sub-group are that much smaller as a result, which can limit the hypothesis of its representativeness (see Tables I.6.a. –I.6.c. for grade 4 and Tables I.7.a.-I.7.d. for grade 8). It is nonetheless possible to determine, once other
31
variables are included in the analysis, whether or not gender is a factor in marginalization. Earlier, we had found that gender had no significant effect in the majority of countries tested.
These results are to some extent confirmed for certain countries, for in the same circumstances regarding school location and the number of books in the home, there is little difference between boys’ and girls’ chances of scoring below the LIB. This makes it all the more useful to compare boys and girls with different characteristics and thus to combine situations in order to identify cases of marginalization.
Thus, at grade 4, certain differences exist in countries such as El Salvador where almost all girls (92%) living in villages and having few books at home were found to be at risk of being “marginalized”, whereas for boys having a large number of books at home and living in large towns, the chances were less than one in two (45%). These differences were also encountered in some developed countries, in Hungary, for example. Thus, girls with few books and living in the countryside stand a 27% chance of being marginalized, whereas the chances for boys with a large number of books at home and living in large towns are about 1%, in other words virtually nil.
At grade 8, as will be seen from Tables I.7.a.-I.7.d., significant differences are again apparent. As an illustration, one might take Bulgaria, where girls with few books and living in the countryside have a 36% chance of being marginalized, whereas for boys who have a large number of books and live in big towns, the chances are only 11%. The difference between the two population groups is, in this respect, unambiguous. Turkey is another very typical case of girls being marginalized if they live in the country and are economically disadvantaged, since their chances of being marginalized were close to 57%, whereas for boys who live in a large town and are economically privileged, the figure was only 15%, in other words 4 times less. However, this difference is more particularly a consequence of possessing few books and of living in a village than of being a girl, if these figures are set against the other possible combinations. This partly confirms the results obtained earlier.
7. Conclusion
The analysis of marginalization in education is an important issue, especially within the framework of the education for all objective. The aim of the present study has been to identify possible cases of marginalization by assessing potential differences in the level of achievement of pupils in mathematics and science at grades 4 and 8.
In order to test these possible differences, we have based our analysis on the results of the Trends in International Mathematics and Science Study of 2007 (TIMSS 2007 Study), undertaken by the International Association for the Evaluation of Educational Achievement (IEA). The main aim of this study was to assess the attainment level of pupils from some 60 countries in mathematics and science at two different grades: grade 4 and grade 8.
Our study has sought to determine whether groups of pupils sharing specific characteristics obtained significantly lower scores than the other students. More precisely, marginalization is perceived in our study as reaching a level of performance that falls short of the minimum standard set by the IEA, known as the Low International Benchmark (LIB). If a group of pupils, to whom a specific set of factors applies, is more likely to perform below the LIB than the other pupils, then we consider that group of pupils to be marginalized.
It has been possible to identify specific marginalized groups in certain countries, just as it has been possible to identify a clear absence of marginalization in other countries. This points up the impossibility of generalizing from cases of marginalization found in a single country to countries as a whole.
32
33
The work involved in making the necessary calculations and analyses within a set time-scale has meant that not all issues could be dealt with. One such issue, in particular, that should be mentioned is an analysis of how the marginalized population has changed over the period from 2003 to 2007, which the TIMSS Study makes possible. With the help of the data generated by the TIMSS 2007 Bridging Study, it is possible to determine the performance pattern of predefined groups over this four-year period. There is one further important dimension of marginalization that we were unable to study. This is mainly a consideration of the regions tested, information which is available for a number of countries. It would be interesting to discover whether specific geographical regions within a country are more or less likely to be marginalized in comparison to other regions in that country, or even to other countries.
34
ANNEX A
Main results from TIMSS 2007

35
Table A.1. Mathematics Achievement and Benchmarks, Grade 4
Country Number of Pupils
Mathematics % Pupils Below Low Benchmark
(400)
% Pupils Below High Benchmark
(550)
% Pupils Below Adv. Benchmark
(625) Mean score Standard
Deviation
Algeria 4223 378 90 60 98 100 Armenia 4079 500 90 14 72 92 Australia 4108 516 83 8 65 91 Austria 4859 505 68 7 74 97 Chinese Tapei 4131 576 69 1 34 75 Colombia 4801 355 90 69 98 100 Czech Republic 4235 486 71 12 81 98 Denmark 3519 523 71 5 64 94 El Salvador 4166 330 91 78 99 100 England 4316 541 86 6 52 83 Georgia 4108 438 88 33 90 99 Germany 5200 525 68 4 63 94 Hong Kong SAR 3791 607 67 0 19 60 Hungary 4048 510 91 12 65 91 Iran, Republic Islamic of 3833 402 84 48 97 100 Italy 4470 507 77 9 71 94 Japan 4487 568 76 2 39 76 Kazakhstan 3990 549 84 5 48 81 Kuwait 3803 316 99 79 100 100 Latvia 3908 537 72 3 56 89 Lithuania 3980 530 76 6 58 90 Mongolia 4523 436 85 33 92 99 Morocco 3894 341 95 74 98 100 Netherlands 3349 535 61 2 58 93 New Zealand 4940 492 86 15 74 95 Norway 4108 473 76 17 85 98 Qatar 7019 296 90 87 100 100 Russian Federation 4464 544 83 5 52 84 Scotland 3929 494 79 12 75 96 Singapore 5041 599 84 2 26 59 Slovak Republic 4963 496 85 12 74 95 Slovenia 4351 502 71 8 75 97 Sweden 4676 503 66 7 76 97 Tunisia 4134 327 111 72 99 100 Ukraine 4292 469 84 21 83 97 United States 7896 529 75 5 60 90 Yemen 5811 224 110 94 100 100
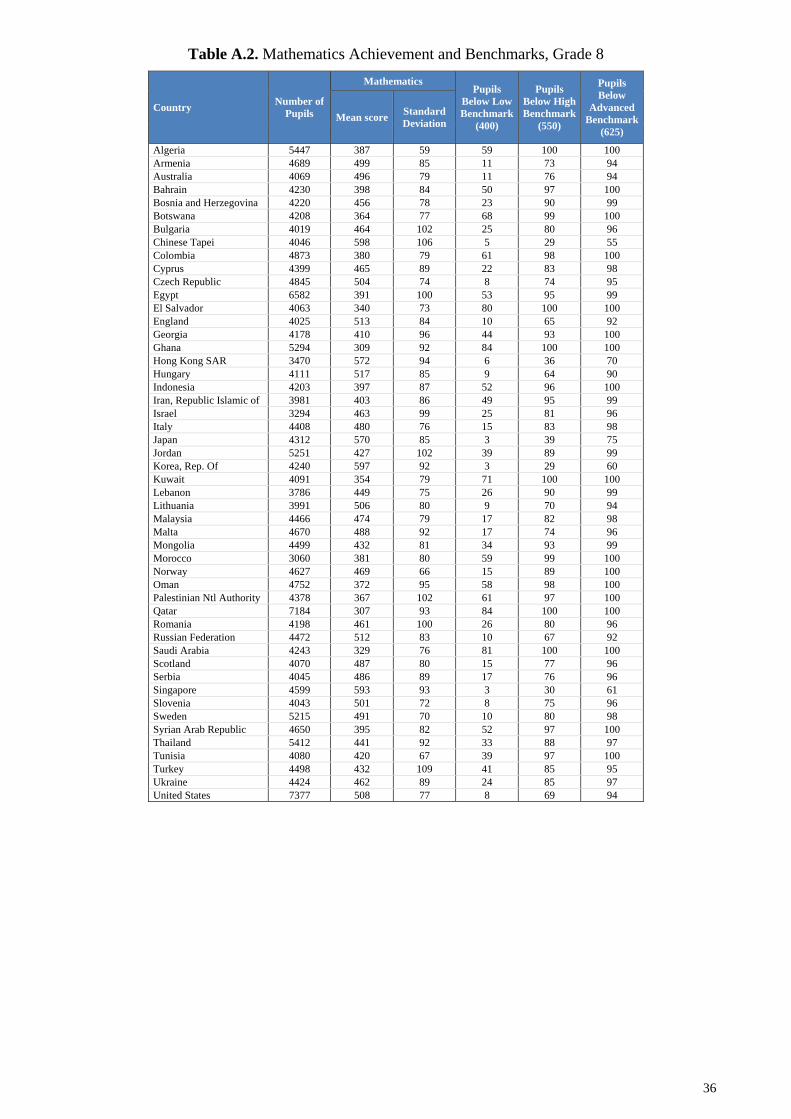
36
Table A.2. Mathematics Achievement and Benchmarks, Grade 8
Country Number of Pupils
Mathematics Pupils
Below Low Benchmark
(400)
Pupils Below High Benchmark
(550)
Pupils Below
Advanced Benchmark
(625) Mean score Standard
Deviation
Algeria 5447 387 59 59 100 100 Armenia 4689 499 85 11 73 94 Australia 4069 496 79 11 76 94 Bahrain 4230 398 84 50 97 100 Bosnia and Herzegovina 4220 456 78 23 90 99 Botswana 4208 364 77 68 99 100 Bulgaria 4019 464 102 25 80 96 Chinese Tapei 4046 598 106 5 29 55 Colombia 4873 380 79 61 98 100 Cyprus 4399 465 89 22 83 98 Czech Republic 4845 504 74 8 74 95 Egypt 6582 391 100 53 95 99 El Salvador 4063 340 73 80 100 100 England 4025 513 84 10 65 92 Georgia 4178 410 96 44 93 100 Ghana 5294 309 92 84 100 100 Hong Kong SAR 3470 572 94 6 36 70 Hungary 4111 517 85 9 64 90 Indonesia 4203 397 87 52 96 100 Iran, Republic Islamic of 3981 403 86 49 95 99 Israel 3294 463 99 25 81 96 Italy 4408 480 76 15 83 98 Japan 4312 570 85 3 39 75 Jordan 5251 427 102 39 89 99 Korea, Rep. Of 4240 597 92 3 29 60 Kuwait 4091 354 79 71 100 100 Lebanon 3786 449 75 26 90 99 Lithuania 3991 506 80 9 70 94 Malaysia 4466 474 79 17 82 98 Malta 4670 488 92 17 74 96 Mongolia 4499 432 81 34 93 99 Morocco 3060 381 80 59 99 100 Norway 4627 469 66 15 89 100 Oman 4752 372 95 58 98 100 Palestinian Ntl Authority 4378 367 102 61 97 100 Qatar 7184 307 93 84 100 100 Romania 4198 461 100 26 80 96 Russian Federation 4472 512 83 10 67 92 Saudi Arabia 4243 329 76 81 100 100 Scotland 4070 487 80 15 77 96 Serbia 4045 486 89 17 76 96 Singapore 4599 593 93 3 30 61 Slovenia 4043 501 72 8 75 96 Sweden 5215 491 70 10 80 98 Syrian Arab Republic 4650 395 82 52 97 100 Thailand 5412 441 92 33 88 97 Tunisia 4080 420 67 39 97 100 Turkey 4498 432 109 41 85 95 Ukraine 4424 462 89 24 85 97 United States 7377 508 77 8 69 94
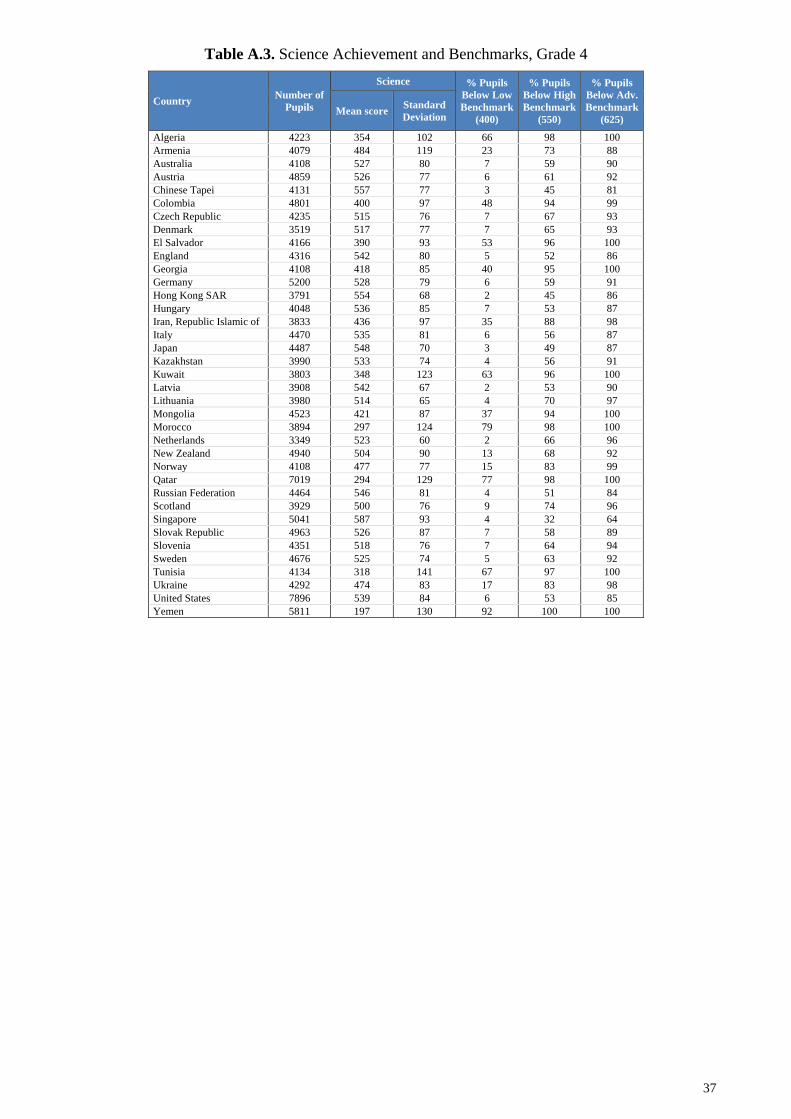
37
Table A.3. Science Achievement and Benchmarks, Grade 4
Country Number of Pupils
Science % Pupils Below Low Benchmark
(400)
% Pupils Below High Benchmark
(550)
% Pupils Below Adv. Benchmark
(625) Mean score Standard
Deviation
Algeria 4223 354 102 66 98 100 Armenia 4079 484 119 23 73 88 Australia 4108 527 80 7 59 90 Austria 4859 526 77 6 61 92 Chinese Tapei 4131 557 77 3 45 81 Colombia 4801 400 97 48 94 99 Czech Republic 4235 515 76 7 67 93 Denmark 3519 517 77 7 65 93 El Salvador 4166 390 93 53 96 100 England 4316 542 80 5 52 86 Georgia 4108 418 85 40 95 100 Germany 5200 528 79 6 59 91 Hong Kong SAR 3791 554 68 2 45 86 Hungary 4048 536 85 7 53 87 Iran, Republic Islamic of 3833 436 97 35 88 98 Italy 4470 535 81 6 56 87 Japan 4487 548 70 3 49 87 Kazakhstan 3990 533 74 4 56 91 Kuwait 3803 348 123 63 96 100 Latvia 3908 542 67 2 53 90 Lithuania 3980 514 65 4 70 97 Mongolia 4523 421 87 37 94 100 Morocco 3894 297 124 79 98 100 Netherlands 3349 523 60 2 66 96 New Zealand 4940 504 90 13 68 92 Norway 4108 477 77 15 83 99 Qatar 7019 294 129 77 98 100 Russian Federation 4464 546 81 4 51 84 Scotland 3929 500 76 9 74 96 Singapore 5041 587 93 4 32 64 Slovak Republic 4963 526 87 7 58 89 Slovenia 4351 518 76 7 64 94 Sweden 4676 525 74 5 63 92 Tunisia 4134 318 141 67 97 100 Ukraine 4292 474 83 17 83 98 United States 7896 539 84 6 53 85 Yemen 5811 197 130 92 100 100
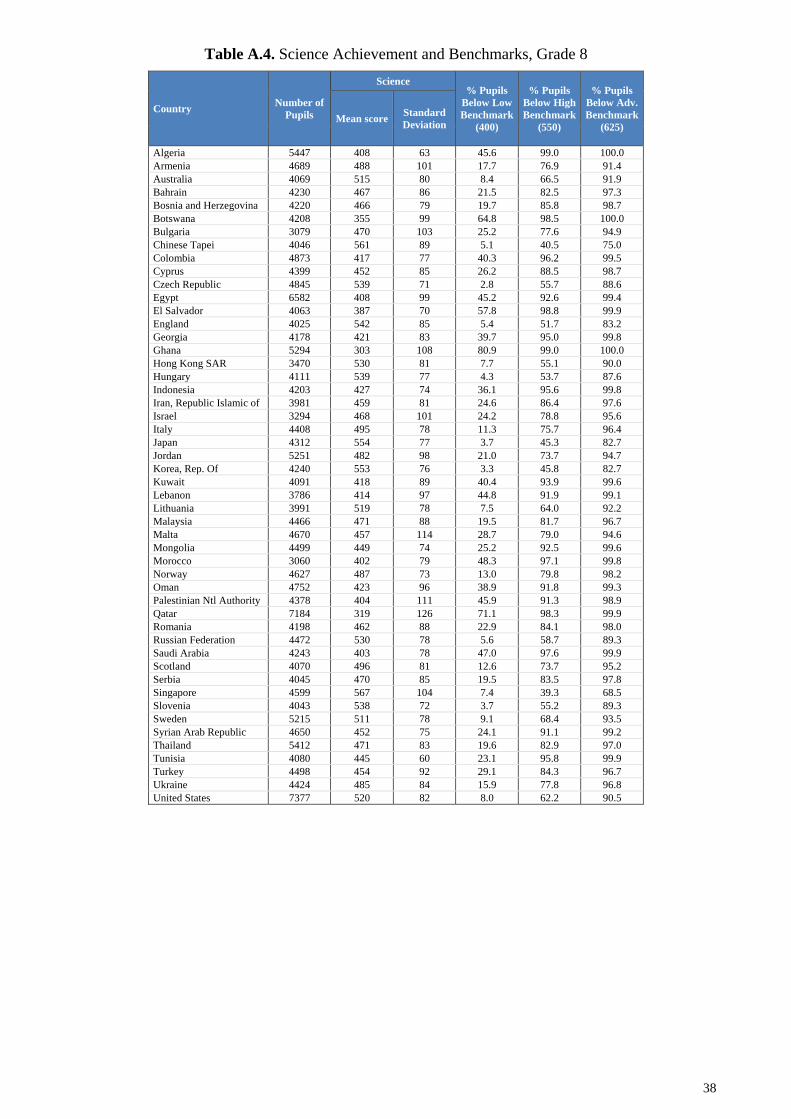
38
Table A.4. Science Achievement and Benchmarks, Grade 8
Country Number of Pupils
Science % Pupils
Below Low Benchmark
(400)
% Pupils Below High Benchmark
(550)
% Pupils Below Adv. Benchmark
(625) Mean score Standard
Deviation
Algeria 5447 408 63 45.6 99.0 100.0 Armenia 4689 488 101 17.7 76.9 91.4 Australia 4069 515 80 8.4 66.5 91.9 Bahrain 4230 467 86 21.5 82.5 97.3 Bosnia and Herzegovina 4220 466 79 19.7 85.8 98.7 Botswana 4208 355 99 64.8 98.5 100.0 Bulgaria 3079 470 103 25.2 77.6 94.9 Chinese Tapei 4046 561 89 5.1 40.5 75.0 Colombia 4873 417 77 40.3 96.2 99.5 Cyprus 4399 452 85 26.2 88.5 98.7 Czech Republic 4845 539 71 2.8 55.7 88.6 Egypt 6582 408 99 45.2 92.6 99.4 El Salvador 4063 387 70 57.8 98.8 99.9 England 4025 542 85 5.4 51.7 83.2 Georgia 4178 421 83 39.7 95.0 99.8 Ghana 5294 303 108 80.9 99.0 100.0 Hong Kong SAR 3470 530 81 7.7 55.1 90.0 Hungary 4111 539 77 4.3 53.7 87.6 Indonesia 4203 427 74 36.1 95.6 99.8 Iran, Republic Islamic of 3981 459 81 24.6 86.4 97.6 Israel 3294 468 101 24.2 78.8 95.6 Italy 4408 495 78 11.3 75.7 96.4 Japan 4312 554 77 3.7 45.3 82.7 Jordan 5251 482 98 21.0 73.7 94.7 Korea, Rep. Of 4240 553 76 3.3 45.8 82.7 Kuwait 4091 418 89 40.4 93.9 99.6 Lebanon 3786 414 97 44.8 91.9 99.1 Lithuania 3991 519 78 7.5 64.0 92.2 Malaysia 4466 471 88 19.5 81.7 96.7 Malta 4670 457 114 28.7 79.0 94.6 Mongolia 4499 449 74 25.2 92.5 99.6 Morocco 3060 402 79 48.3 97.1 99.8 Norway 4627 487 73 13.0 79.8 98.2 Oman 4752 423 96 38.9 91.8 99.3 Palestinian Ntl Authority 4378 404 111 45.9 91.3 98.9 Qatar 7184 319 126 71.1 98.3 99.9 Romania 4198 462 88 22.9 84.1 98.0 Russian Federation 4472 530 78 5.6 58.7 89.3 Saudi Arabia 4243 403 78 47.0 97.6 99.9 Scotland 4070 496 81 12.6 73.7 95.2 Serbia 4045 470 85 19.5 83.5 97.8 Singapore 4599 567 104 7.4 39.3 68.5 Slovenia 4043 538 72 3.7 55.2 89.3 Sweden 5215 511 78 9.1 68.4 93.5 Syrian Arab Republic 4650 452 75 24.1 91.1 99.2 Thailand 5412 471 83 19.6 82.9 97.0 Tunisia 4080 445 60 23.1 95.8 99.9 Turkey 4498 454 92 29.1 84.3 96.7 Ukraine 4424 485 84 15.9 77.8 96.8 United States 7377 520 82 8.0 62.2 90.5

39
ANNEX B
Students’ Performance Trends (1995-2007)

40
Table B.1. Trends on Mathematics Achievement (1995-2007), Grade 4
Countries Mean score 1995 to 2007
difference 2003 to 2007
difference 1995 2003 2007 Diff. Sig. Diff. Sig.
Armenia 456 500 44 ▲ Australia 495 499 516 21.5 ▲ 17 ▲ Austria 531 505 -25.0 ▼ Chinese Tapei 564 576 12 ▲ Czech Republic 541 486 -54.0 ▼ England 484 531 541 57.0 ▲ 10 ▲ Hong-Kong China 557 575 607 50.0 ▲ 32 ▲ Hungary 521 529 510 -11.6 ▼ -19 ▼ Iran, Islamic Rep. 387 389 402 15.5 ▲ 13 ▲ Italy 503 507 4 ► Japan 567 565 568 0.8 ► 4 ► Latvia 499 533 536 38.0 ▲ 4 ► Lithuania 534 530 -4 ► Morocco 347 343 -6 ► Netherlands 549 540 535 -14.3 ▼ -5 ► New Zealand 469 496 492 22.8 ▲ -3 ► Norway 476 451 473 -3.0 ▼ 22 ▲ Russian Federation 532 544 12 ► Scotland 493 490 494 1.3 ► 4 ► Singapore 590 594 599 8.8 ► 5 ► Slovenia 462 479 502 39.8 ▲ 23 ▲ Tunisia 339 326 -13 ▼ United States 518 518 529 11.2 ▲ 11 ▲
► Difference not statistically significant, country’s performance did not changed between the two years considered. ▼ or ▲ Difference statistically significant. ▲ means that country’s performance significantly improved between the two years coinsidered, while ▼ means that country’s performance significantly decreased between the two years considered. Significance level: 10%. Because results are rounded to the nearest whole number, some totals may appear inconsistent.

41
Table B.2. Trends on Science Achievement (1995-2007), Grade 4
Countries Mean 1995 to 2007
difference 2003 to 2007
difference
1995 2003 2007 Diff Evo Diff Evo Armenia 437 484 48 ▲ Australia 521 521 527 6 ► 7 ► Austria 538 526 -12 ▼ Chinese Tapei 551 557 5 ▲ Czech Republic 532 515 -17 ▼ England 528 540 542 14 ▲ 1 ► Hong-Kong China 508 542 554 46 ▲ 12 ▲ Hungary 508 530 536 28 ▲ 6 ► Iran, Islamic Rep. 380 414 436 55 ▲ 22 ▲ Italy 516 535 20 ▲ Japan 553 543 548 -5 ▼ 4 ► Latvia 486 530 542 56 ▲ 12 ▲ Lithuania 512 514 2 ► Morocco 304 297 -7 ► Netherlands 530 525 523 -7 ► -2 ► New Zealand 505 523 504 -1 ► -19 ▼ Norway 504 466 477 -27 ▼ 10 ▲ Russian Federation 526 546 20 ► Scotland 514 502 500 -14 ▼ -2 ► Singapore 523 565 587 63 ▲ 22 ▲ Slovenia 464 490 518 54 ▲ 28 ▲ Tunisia 314 317 3 ► United States 542 536 539 -3 ► 3 ►
► Difference not statistically significant, country’s performance did not changed between the two years considered. ▼ or ▲ Difference statistically significant. ▲ means that country’s performance significantly improved between the two years coinsidered, while ▼ means that country’s performance significantly decreased between the two years considered. Significance level: 10%. Because results are rounded to the nearest whole number, some totals may appear inconsistent.
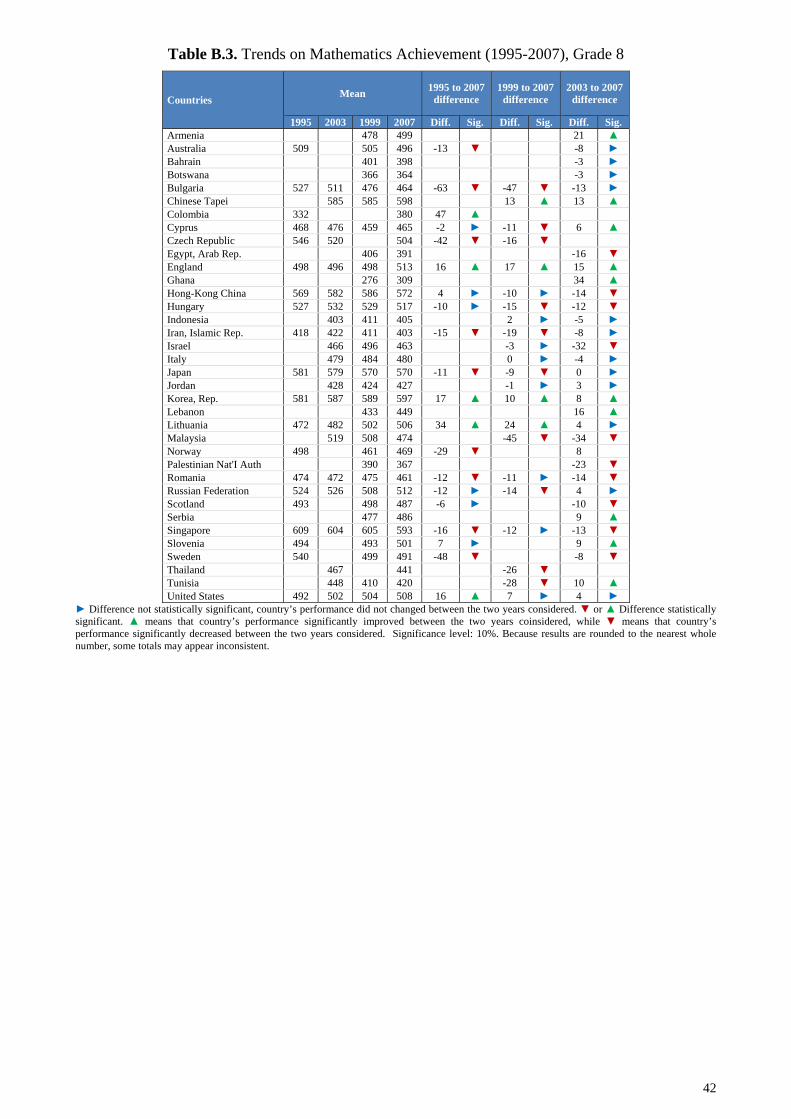
42
Table B.3. Trends on Mathematics Achievement (1995-2007), Grade 8
Countries Mean 1995 to 2007 difference
1999 to 2007 difference
2003 to 2007 difference
1995 2003 1999 2007 Diff. Sig. Diff. Sig. Diff. Sig. Armenia 478 499 21 ▲ Australia 509 505 496 -13 ▼ -8 ► Bahrain 401 398 -3 ► Botswana 366 364 -3 ► Bulgaria 527 511 476 464 -63 ▼ -47 ▼ -13 ► Chinese Tapei 585 585 598 13 ▲ 13 ▲ Colombia 332 380 47 ▲ Cyprus 468 476 459 465 -2 ► -11 ▼ 6 ▲ Czech Republic 546 520 504 -42 ▼ -16 ▼ Egypt, Arab Rep. 406 391 -16 ▼ England 498 496 498 513 16 ▲ 17 ▲ 15 ▲ Ghana 276 309 34 ▲ Hong-Kong China 569 582 586 572 4 ► -10 ► -14 ▼ Hungary 527 532 529 517 -10 ► -15 ▼ -12 ▼ Indonesia 403 411 405 2 ► -5 ► Iran, Islamic Rep. 418 422 411 403 -15 ▼ -19 ▼ -8 ► Israel 466 496 463 -3 ► -32 ▼ Italy 479 484 480 0 ► -4 ► Japan 581 579 570 570 -11 ▼ -9 ▼ 0 ► Jordan 428 424 427 -1 ► 3 ► Korea, Rep. 581 587 589 597 17 ▲ 10 ▲ 8 ▲ Lebanon 433 449 16 ▲ Lithuania 472 482 502 506 34 ▲ 24 ▲ 4 ► Malaysia 519 508 474 -45 ▼ -34 ▼ Norway 498 461 469 -29 ▼ 8 Palestinian Nat'I Auth 390 367 -23 ▼ Romania 474 472 475 461 -12 ▼ -11 ► -14 ▼ Russian Federation 524 526 508 512 -12 ► -14 ▼ 4 ► Scotland 493 498 487 -6 ► -10 ▼ Serbia 477 486 9 ▲ Singapore 609 604 605 593 -16 ▼ -12 ► -13 ▼ Slovenia 494 493 501 7 ► 9 ▲ Sweden 540 499 491 -48 ▼ -8 ▼ Thailand 467 441 -26 ▼ Tunisia 448 410 420 -28 ▼ 10 ▲ United States 492 502 504 508 16 ▲ 7 ► 4 ►
► Difference not statistically significant, country’s performance did not changed between the two years considered. ▼ or ▲ Difference statistically significant. ▲ means that country’s performance significantly improved between the two years coinsidered, while ▼ means that country’s performance significantly decreased between the two years considered. Significance level: 10%. Because results are rounded to the nearest whole number, some totals may appear inconsistent.
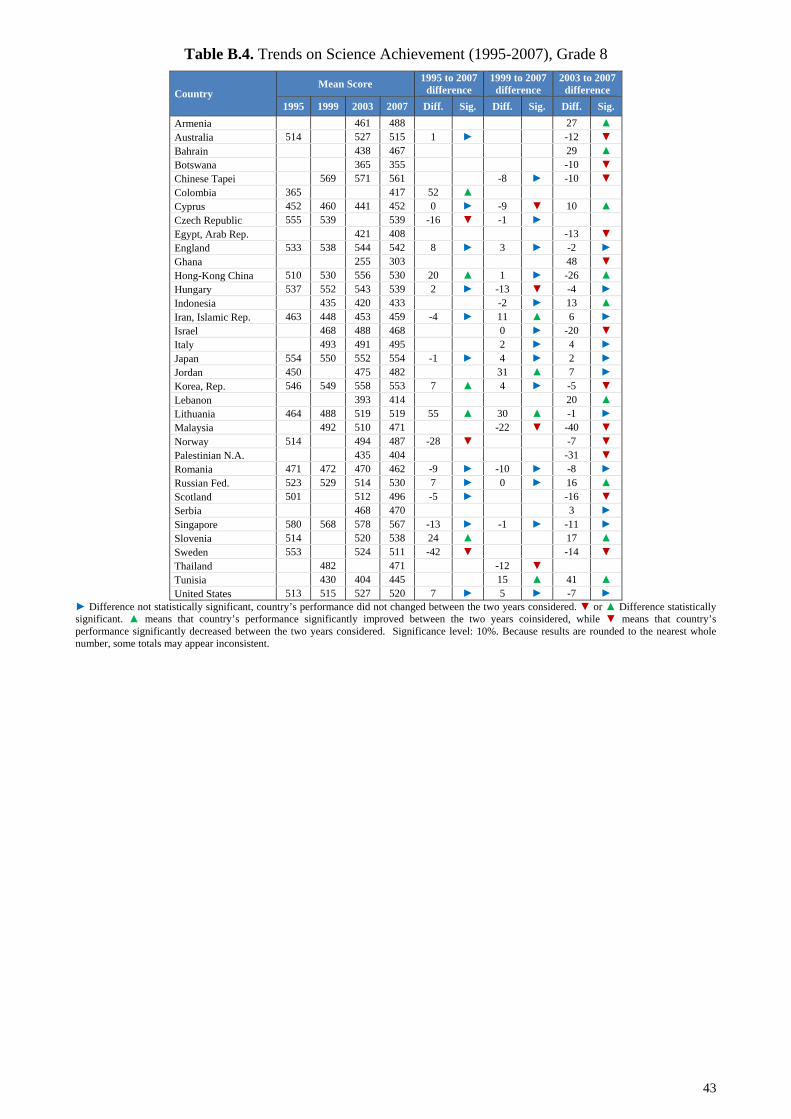
43
Table B.4. Trends on Science Achievement (1995-2007), Grade 8
Country Mean Score 1995 to 2007
difference 1999 to 2007
difference 2003 to 2007
difference 1995 1999 2003 2007 Diff. Sig. Diff. Sig. Diff. Sig.
Armenia 461 488 27 ▲ Australia 514 527 515 1 ► -12 ▼ Bahrain 438 467 29 ▲ Botswana 365 355 -10 ▼ Chinese Tapei 569 571 561 -8 ► -10 ▼ Colombia 365 417 52 ▲ Cyprus 452 460 441 452 0 ► -9 ▼ 10 ▲ Czech Republic 555 539 539 -16 ▼ -1 ► Egypt, Arab Rep. 421 408 -13 ▼ England 533 538 544 542 8 ► 3 ► -2 ► Ghana 255 303 48 ▼ Hong-Kong China 510 530 556 530 20 ▲ 1 ► -26 ▲ Hungary 537 552 543 539 2 ► -13 ▼ -4 ► Indonesia 435 420 433 -2 ► 13 ▲ Iran, Islamic Rep. 463 448 453 459 -4 ► 11 ▲ 6 ► Israel 468 488 468 0 ► -20 ▼ Italy 493 491 495 2 ► 4 ► Japan 554 550 552 554 -1 ► 4 ► 2 ► Jordan 450 475 482 31 ▲ 7 ► Korea, Rep. 546 549 558 553 7 ▲ 4 ► -5 ▼ Lebanon 393 414 20 ▲ Lithuania 464 488 519 519 55 ▲ 30 ▲ -1 ► Malaysia 492 510 471 -22 ▼ -40 ▼ Norway 514 494 487 -28 ▼ -7 ▼ Palestinian N.A. 435 404 -31 ▼ Romania 471 472 470 462 -9 ► -10 ► -8 ► Russian Fed. 523 529 514 530 7 ► 0 ► 16 ▲ Scotland 501 512 496 -5 ► -16 ▼ Serbia 468 470 3 ► Singapore 580 568 578 567 -13 ► -1 ► -11 ► Slovenia 514 520 538 24 ▲ 17 ▲ Sweden 553 524 511 -42 ▼ -14 ▼ Thailand 482 471 -12 ▼ Tunisia 430 404 445 15 ▲ 41 ▲ United States 513 515 527 520 7 ► 5 ► -7 ►
► Difference not statistically significant, country’s performance did not changed between the two years considered. ▼ or ▲ Difference statistically significant. ▲ means that country’s performance significantly improved between the two years coinsidered, while ▼ means that country’s performance significantly decreased between the two years considered. Significance level: 10%. Because results are rounded to the nearest whole number, some totals may appear inconsistent.
44
ANNEX C
Trends on Benchmarks (1995-2007)

45
Table C.1. Trends in Percentages of Students Reaching the TIMSS 2007 International Benchmarks of Mathematics Achievement (1995-2007), grade 4
Country
Advanced international benchmark
(Below 625 points)
High international benchmark
(Below 550 points)
Intermediate international benchmark
(Below 475 points)
Low international benchmark
(Below 400 points) 2007 2003 1995 2007 2003 1995 2007 2003 1995 2007 2003 1995
% % * % * % % * % * % % * % * % % * % * Armenia 92 98 ▲ 72 87 ▲ 40 57 ▲ 13 25 ▲ Australia 91 95 ▲ 94 ▲ 65 74 ▲ 73 ▲ 29 36 ▲ 39 ▲ 9 12 ▲ 14 ▲Austria 97 90 ▼ 74 58 ▼ 31 23 ▼ 7 6 ►Chinese Tapei 76 84 ▲ 34 39 ▲ 8 8 ► 1 1 ► Czech Republic 98 84 ▼ 81 54 ▼ 41 21 ▼ 12 5 ▼England 84 86 ► 93 ▲ 52 57 ▲ 76 ▲ 21 25 ▲ 46 ▲ 6 7 ► 18 ▲Hong-Kong China 60 78 ▲ 83 ▲ 19 33 ▲ 44 ▲ 3 6 ▲ 13 ▲ 0 1 ► 3 ▲Hungary 91 90 ► 89 ► 65 59 ► 62 ▼ 33 24 ▼ 28 ► 12 6 ▼ 9 ▼Iran, Islamic Rep. 100 100 ► 100 97 98 ► 97 ► 80 83 ▲ 85 ▲ 47 55 ▲ 56 ▲Italy 94 94 ► 71 71 ► 33 35 ► 9 11 ► 14 ►Japan 77 79 ► 78 ► 39 40 ► 39 ► 11 11 ► 11 ► 2 2 ► 2 ►Latvia 89 91 ► 94 ▲ 56 57 ► 73 ▲ 19 20 ► 39 ▲ 3 4 ► 12 ▲Lithuania 90 90 ► 58 56 ► 23 21 ► 6 4 ► Morocco 100 100 ► 98 99 ► 91 92 ► 74 71 ► Netherlands 93 95 ► 88 ▼ 58 56 ► 50 ▼ 16 11 ▼ 13 ► 2 1 ▼ 1 ►New Zealand 95 95 ► 96 ► 74 73 ► 81 ▲ 39 38 ► 49 ▲ 15 14 ► 22 ▲Norway 98 99 ▲ 98 ► 85 90 ▲ 84 ► 48 59 ▲ 47 ► 17 25 ▲ 16 ►Russian Fed. 84 89 ► 52 59 ▲ 19 24 ► 5 5 ► Scotland 96 97 ► 93 ▼ 75 78 ► 73 ► 38 40 ► 40 ► 12 12 ► 15 ►Singapore 59 62 ► 62 ► 26 27 ► 30 ► 8 9 ► 11 ▲ 2 3 ► 4 ▲Slovenia 97 98 ▲ 98 ▲ 75 82 ▲ 86 ▲ 33 45 ▲ 55 ▲ 8 16 ▲ 23 ▲Tunisia 100 100 ► 99 99 ► 91 91 ► 72 72 ► United States 90 93 ► 91 ▲ 60 65 ▲ 63 23 28 ▲ 29 ▲ 5 7 ▲ 8 ▲
► Difference not statistically significant, country’s performance did not changed between the two years considered (1995, 1999 or 2003 and 2007). ▼ or ▲ Difference statistically significant. ▲ means that country’s performance significantly improved between the two years considered (1995, 1999 or 2003 and 2007), that means that the proportion of students below benchmarks decreased, while ▼ means that country’s performance significantly decreased between the two years considered (1995, 1999 or 2003 and 2007), that means that the proportion of students below benchmarks increased. Significance level: 10%. * The evolution analysis always refers to 2007.

46
Table C.2. Trends in Percentages of Students Reaching the TIMSS 2007 International Benchmarks of Science Achievement (1995-2007), grade 4
Country
Advanced international benchmark
(Below 625 points)
High international benchmark
(Below 550 points)
Intermediate international benchmark
(Below 475 points)
Low international benchmark
(Below 400 points) 2007 2003 1995 2007 2003 1995 2007 2003 1995 2007 2003 1995
% % * % * % % * % * % % * % * % % * % * Armenia 88 98 ▲ 73 90 ▲ 48 62 ▲ 23 34 ▲ Australia 90 91 ► 87 ► 59 62 ► 60 ► 24 26 ► 28 ▲ 7 8 ► 11 ▲Austria 91 87 ▼ 61 55 ▼ 24 21 ▼ 7 6 Chinese Tapei 81 86 ▲ 45 48 ► 14 13 ► 3 2 ▼ Czech Republic 93 88 ▼ 67 58 ▼ 28 23 ▼ 7 5 England 86 85 ► 85 52 53 ► 58 ▲ 19 21 ► 28 ▲ 5 6 ► 10 ▲Hong-Kong 86 93 ▲ 95 ▲ 45 53 ▲ 70 ▲ 12 13 ► 31 ▲ 2 2 ► 9 ▲Hungary 87 90 ▲ 93 ▲ 53 58 ► 68 ▲ 22 24 ► 33 ▲ 7 6 ► 10 ▲Iran, Islamic 98 99 ▲ 100 ▲ 88 93 ▲ 97 ▲ 64 72 ▲ 85 ▲ 35 42 ▲ 58 ▲Italy 87 91 ▲ 56 65 ▲ 22 30 ▲ 6 9 ▲ Japan 88 88 ► 85 ▼ 49 51 ► 46 ► 14 16 ▲ 13 ► 3 4 ► 3 ►Latvia 90 93 ▲ 95 ▲ 53 61 ▲ 79 ▲ 13 20 ▲ 45 ▲ 2 4 ► 15 ▲Lithuania 97 97 ► 70 70 ► 26 27 ► 5 5 ► Morocco 100 100 ► 98 99 ► 91 91 ► 79 76 ► Netherlands 96 97 ► 94 ▼ 66 68 ► 62 ► 21 17 ▼ 18 ► 3 1 ► 2 ►New Zealand 92 91 ► 89 ▼ 68 61 ▼ 65 ► 35 26 ▼ 34 ► 13 8 ▼ 15 ►Norway 99 98 ► 92 ▼ 83 85 ► 68 ▼ 46 51 ▲ 35 ▲ 16 21 ▲ 12 ▼Russian 84 89 ► 51 61 ▲ 18 26 ▲ 4 7 ► Scotland 96 95 ► 88 ▼ 74 73 ► 63 ▼ 35 34 ► 32 ► 10 10 ► 12 ►Singapore 64 75 ▲ 86 ▲ 32 39 ▲ 58 ▲ 12 14 ► 29 ▲ 4 5 ► 11 ▲Slovenia 94 97 ▲ 98 ▲ 64 78 ▲ 86 ▲ 26 39 ▲ 55 ▲ 7 13 ▲ 21 ▲Tunisia 100 100 ► 97 98 ▲ 86 90 ▲ 69 73 ▲ United States 85 87 ► 81 ▼ 53 55 ► 50 ► 22 22 ► 22 ► 6 6 ► 8 ►
► Difference not statistically significant, country’s performance did not changed between the two years considered (1995, 1999 or 2003 and 2007). ▼ or ▲ Difference statistically significant. ▲ means that country’s performance significantly improved between the two years considered (1995, 1999 or 2003 and 2007), that means that the proportion of students below benchmarks decreased, while ▼ means that country’s performance significantly decreased between the two years considered (1995, 1999 or 2003 and 2007), that means that the proportion of students below benchmarks increased. Significance level: 10%. * The evolution analysis always refers to 2007.

47
Table C.3.a. Trends in Percentages of Students Reaching the TIMSS 2007 International Benchmarks of Mathematics Achievement (1995-2007), grade 8 (Advanced and High Int. Benchm.)
Country
Advanced International Benchmark (Below 625 points)
High International Benchmark (Below 550 points)
2007 2003 1999 1995 2007 2003 1999 1995
% % * % * % * % % * % * % * Armenia 94 98 ▲ 73 79 ▲ Australia 94 93 ► 93 ► 76 71 ► 67 ► Bahrain 100 100 ▲ 97 98 ► Botswana 100 100 ► 99 99 ► Bulgaria 96 97 ► 91 ▼ 83 ▼ 80 81 ► 68 ▼ 60 ▼ Chinese Tapei 55 62 ▲ 63 ▲ 29 34 ▲ 33 Colombia 100 100 ▲ 2 98 ► Cyprus 98 99 ▲ 98 ► 97 ► 83 87 ▲ 81 ► 81 ► Czech Republic 94 91 ▼ 85 ▼ 26 65 ▼ 53 ▼ Egypt, Arab Rep. 99 99 ► 95 94 ► England 92 95 ► 94 94 65 74 ▲ 75 ▲ 73 ► Ghana 100 100 ► 100 100 ► Hong-Kong China 69 69 ► 72 77 ▲ 36 17 ▼ 30 ► 35 ► Hungary 90 89 ► 87 ▼ 90 64 59 ▼ 57 ▼ 60 ► Indonesia 99 99 ► 98 ▼ 95 94 ► 92 ▼ Iran, Islamic Rep. 99 100 ► 99 ► 100 ► 95 97 ► 94 ► 96 ► Israel 96 94 ▼ 96 ► 81 73 ▼ 81 ► Italy 97 97 ► 96 ► 83 81 ► 79 ▼ Japan 74 76 ► 71 ► 71 ► 39 38 ► 34 ▼ 33 ▼ Jordan 99 99 ▲ 97 ▼ 89 92 ▲ 88 ► Korea, Rep. 60 65 ▲ 68 ▲ 69 ▲ 29 30 ► 30 ► 33 ▲ Lebanon 99 100 ▲ 90 96 ▲ Lithuania 94 95 ► 97 ▲ 98 70 72 ► 82 ▲ 83 ▲ Malaysia 98 94 ▼ 90 ▼ 82 70 ▼ 64 ▼ Norway 100 100 ► 96 ▼ 89 90 ► 74 ▼ Palestinian Nat'I Auth 100 100 ► 97 96 ► Romania 96 96 ► 96 ► 96 ► 80 79 ► 80 ► 79 ► Russian Federation 92 94 ▲ 88 ▼ 91 ► 67 70 ► 61 ► 62 ► Scotland 96 96 ► 95 ► 77 75 ► 76 ► Serbia 95 96 ► 76 79 ► Singapore 60 56 ► 58 ► 60 ► 30 23 ▼ 23 ▼ 16 ▼ Slovenia 96 97 ► 96 ► 75 79 ▲ 78 ► Sweden 98 97 ► 88 ▼ 80 76 ▼ 54 ▼ Thailand 97 97 ► 88 83 ► Tunisia 100 100 ► 100 ► 97 99 ▲ 95 ▼ United States 94 93 ► 93 ► 96 69 71 ► 70 ► 74 ▲
► Difference not statistically significant, country’s performance did not changed between the two years considered (1995, 1999 or 2003 and 2007). ▼ or ▲ Difference statistically significant. ▲ means that country’s performance significantly improved between the two years considered (1995, 1999 or 2003 and 2007), that means that the proportion of students below benchmarks decreased, while ▼ means that country’s performance significantly decreased between the two years considered (1995, 1999 or 2003 and 2007), that means that the proportion of students below benchmarks increased. Significance level: 10%. * The evolution analysis always refers to 2007.

48
Table C.3.b. Trends in Percentages of Students Reaching the TIMSS 2007 International Benchmarks of Mathematics Achievement (1995-2007), grade 8 (Interm. and Low Int. Benchm.)
Country
Intermediate International Benchmark
(Below 475 points)
Low International Benchmark
(Below 400 points)
2007 2003 1999 1995 2007 2003 1999 1995
% % * % * % * % % * % * % * Armenia 37 46 ▲ 12 18 ▲ Australia 39 35 ► 32 ▼ 11 10 ► 10 ► Bahrain 81 83 ► 51 49 ► Botswana 93 93 ► 68 68 ► Bulgaria 51 49 ► 33 ▼ 31 ▼ 26 18 ▼ 10 ▼ 10 ▼ Chinese Tapei 14 15 ► 15 ► 5 4 ► 5 ► Colombia 89 93 ▲ 61 80 ▲ Cyprus 52 55 ▲ 47 ▼ 49 ► 22 23 ► 18 ▼ 23 Czech Republic 34 29 ▼ 18 ▼ 8 6 ► 2 ▼ Egypt, Arab Rep. 79 76 ► 53 48 ▼ England 31 39 ▲ 40 ▲ 39 ▲ 10 10 ► 12 ► 13 ► Ghana 96 98 ▲ 83 91 ▲ Hong-Kong China 15 7 ▼ 8 ▼ 12 ► 6 2 ▼ 2 ▼ 4 ► Hungary 31 25 ▼ 25 ▼ 26 ▼ 9 5 ▼ 7 ► 6 ▼ Indonesia 78 76 ► 77 ► 48 45 ► 50 ► Iran, Islamic Rep. 80 80 ► 74 ▼ 76 ▼ 49 45 ► 39 ▼ 41 ▼ Israel 52 40 ▼ 51 ► 25 14 ▼ 24 ► Italy 46 44 ► 47 ► 15 14 ► 18 ► Japan 13 12 ► 10 ▼ 9 ▼ 3 2 ▼ 2 ▼ 2 ▼ Jordan 65 70 ▲ 67 ► 39 40 ► 39 ► Korea, Rep. 10 10 ► 9 ► 11 ► 2 2 ► 1 ▼ 3 ► Lebanon 64 73 ▲ 26 32 ► Lithuania 35 37 ► 47 ▲ 50 ▲ 10 10 ► 15 ▲ 19 ▲ Malaysia 50 34 ▼ 30 ▼ 18 7 ▼ 7 ▼ Norway 52 56 ► 36 ▼ 15 19 ▲ 10 ▼ Palestinian Nat'I Auth 85 81 ▼ 61 54 ▼ Romania 54 48 ▼ 49 ► 48 ▼ 27 21 ▼ 21 ► 21 ▼ Russian Federation 32 34 ► 27 ► 27 ► 9 8 ► 7 ► 7 ► Scotland 43 37 ▼ 40 ► 15 10 ▼ 13 ► Serbia 43 48 ▲ 17 20 ► Singapore 12 7 ▼ 6 ▼ 2 ▼ 3 1 ▼ 1 ▼ 0 ▼ Slovenia 35 40 ▲ 40 ► 8 10 ► 10 ► Sweden 40 36 ▼ 19 ▼ 10 9 ► 4 ▼ Thailand 66 55 ▼ 34 21 ▼ Tunisia 79 85 ▲ 66 ▼ 39 45 ▲ 22 ▼ United States 33 36 ► 38 ► 39 ▲ 8 10 ► 13 ▲ 14 ▲
► Difference not statistically significant, country’s performance did not changed between the two years considered (1995, 1999 or 2003 and 2007). ▼ or ▲ Difference statistically significant. ▲ means that country’s performance significantly improved between the two years considered (1995, 1999 or 2003 and 2007), that means that the proportion of students below benchmarks decreased, while ▼ means that country’s performance significantly decreased between the two years considered (1995, 1999 or 2003 and 2007), that means that the proportion of students below benchmarks increased. Significance level: 10%. * The evolution analysis always refers to 2007.

49
Table C.4.a. Trends in Percentages of Students Reaching the TIMSS 2007 International Benchmarks of Science Achievement (1995-2007), grade 8 (Advanced and High Int. Benchmarks)
Country
Advanced International Benchmark (Below 625 points)
High International Benchmark (Below 550 points)
2007 2003 1999 1995 2007 2003 1999 1995
% % * % * % * % % * % * % * Armenia 92 99 ▲ 77 86 ▲ Australia 92 91 ► 90 ► 67 60 ▼ 64 ► Bahrain 98 100 ▲ 83 94 ▲ Botswana 100 100 ► 98 99 ► Chinese Tapei 75 74 ► 73 ► 40 37 ► 39 ► Colombia 99 100 ► 96 98 ▲ Cyprus 99 100 ▲ 98 ► 98 ► 88 92 ▲ 86 ► 85 ▼ Czech Republic 89 86 ► 83 ▼ 56 55 ► 48 ▼ Egypt, Arab Rep. 99 99 ▼ 93 90 ▼ England 83 85 ► 83 ► 85 ► 52 52 ► 55 ► 57 ► Ghana 100 100 ► 100 ► 99 100 ▲ Hong-Kong China 90 87 ► 93 ▼ 93 ▲ 55 42 ► 60 ► 67 ▲ Hungary 87 86 ► 81 ▼ 88 ► 54 54 ► 47 ▼ 56 ► Indonesia 100 100 ► 99 ▼ 95 96 ► 92 ► Iran, Islamic Rep. 98 99 ▲ 99 ► 99 ► 86 91 ▲ 89 ► 89 ► Israel 95 95 ► 95 79 76 ► 77 ► Italy 96 96 ► 94 ▼ 76 77 ► 74 ► Japan 83 85 ► 84 ► 82 ► 45 47 ► 48 ► 46 ► Jordan 95 97 ▲ 96 ▲ 74 79 ▲ 83 ▲ Korea, Rep. 83 83 ► 81 ► 83 ► 46 43 ► 50 ▲ 50 ▲ Lebanon 99 100 ► 92 96 ▲ Lithuania 92 94 ▲ 95 ▲ 98 ▲ 64 66 ► 78 ▲ 86 ▲ Malaysia 97 96 ► 95 ► 82 72 ▼ 76 ► Norway 98 98 ► 94 ▼ 80 79 ► 68 ▼ Palestinian Nat'I Auth 99 99 ► 91 90 ► Romania 98 96 ► 95 ▼ 95 ▼ 84 80 ► 79 ▼ 78 ▼ Russian Federation 89 94 ▲ 85 ▲ 89 ► 59 68 ▲ 59 ▲ 62 ► Scotland 95 94 ► 91 ▼ 74 68 ▼ 70 ► Serbia 98 98 ► 84 84 ► Singapore 68 67 ► 71 ► 71 ► 39 34 ► 40 ► 36 ► Slovenia 89 94 ▲ 92 ▲ 55 67 ▲ 68 ▲ Sweden 94 92 ► 81 ▼ 68 62 ▼ 48 ▼ Thailand 97 98 ► 83 82 ► Tunisia 100 100 ► 100 ► 96 99 ▲ 97 ► United States 90 89 ► 88 ▼ 89 ► 62 59 ► 63 ► 62 ►
► Difference not statistically significant, country’s performance did not changed between the two years considered (1995, 1999 or 2003 and 2007). ▼ or ▲ Difference statistically significant. ▲ means that country’s performance significantly improved between the two years considered (1995, 1999 or 2003 and 2007), that means that the proportion of students below benchmarks decreased, while ▼ means that country’s performance significantly decreased between the two years considered (1995, 1999 or 2003 and 2007), that means that the proportion of students below benchmarks increased. Significance level: 10%. * The evolution analysis always refers to 2007.
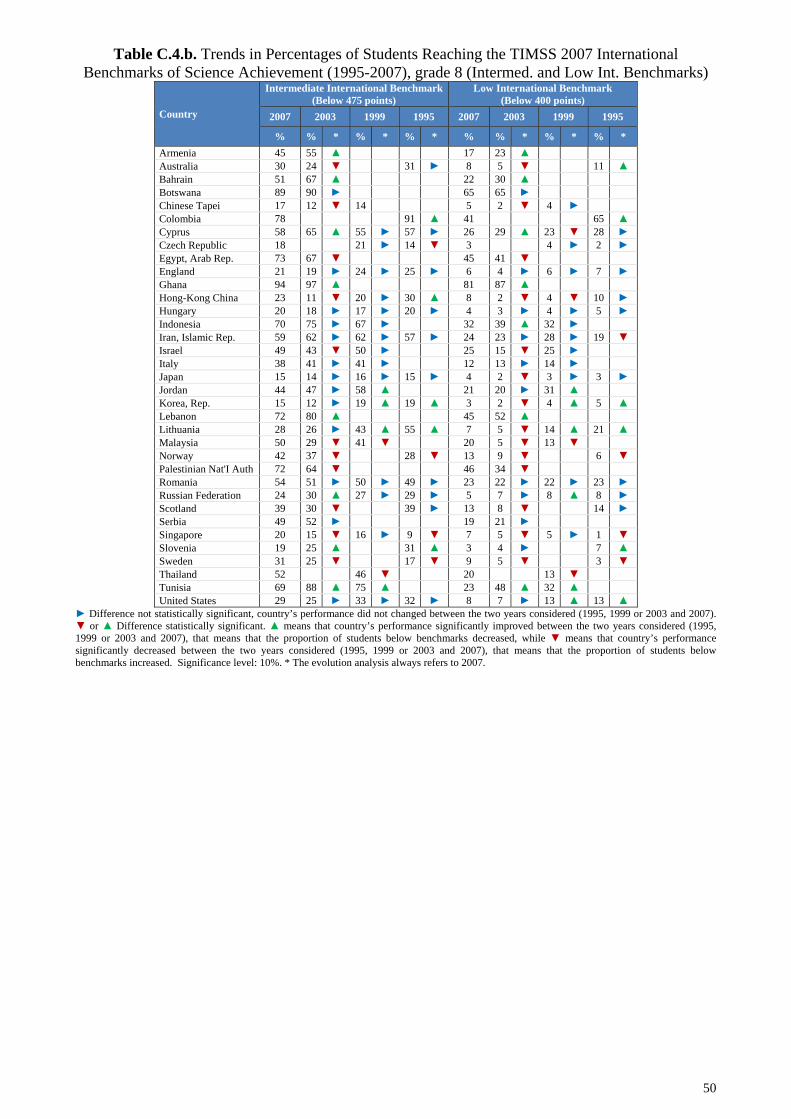
50
Table C.4.b. Trends in Percentages of Students Reaching the TIMSS 2007 International Benchmarks of Science Achievement (1995-2007), grade 8 (Intermed. and Low Int. Benchmarks)
Country
Intermediate International Benchmark (Below 475 points)
Low International Benchmark (Below 400 points)
2007 2003 1999 1995 2007 2003 1999 1995
% % * % * % * % % * % * % * Armenia 45 55 ▲ 17 23 ▲ Australia 30 24 ▼ 31 ► 8 5 ▼ 11 ▲ Bahrain 51 67 ▲ 22 30 ▲ Botswana 89 90 ► 65 65 ► Chinese Tapei 17 12 ▼ 14 5 2 ▼ 4 ► Colombia 78 91 ▲ 41 65 ▲ Cyprus 58 65 ▲ 55 ► 57 ► 26 29 ▲ 23 ▼ 28 ► Czech Republic 18 21 ► 14 ▼ 3 4 ► 2 ► Egypt, Arab Rep. 73 67 ▼ 45 41 ▼ England 21 19 ► 24 ► 25 ► 6 4 ► 6 ► 7 ► Ghana 94 97 ▲ 81 87 ▲ Hong-Kong China 23 11 ▼ 20 ► 30 ▲ 8 2 ▼ 4 ▼ 10 ► Hungary 20 18 ► 17 ► 20 ► 4 3 ► 4 ► 5 ► Indonesia 70 75 ► 67 ► 32 39 ▲ 32 ► Iran, Islamic Rep. 59 62 ► 62 ► 57 ► 24 23 ► 28 ► 19 ▼ Israel 49 43 ▼ 50 ► 25 15 ▼ 25 ► Italy 38 41 ► 41 ► 12 13 ► 14 ► Japan 15 14 ► 16 ► 15 ► 4 2 ▼ 3 ► 3 ► Jordan 44 47 ► 58 ▲ 21 20 ► 31 ▲ Korea, Rep. 15 12 ► 19 ▲ 19 ▲ 3 2 ▼ 4 ▲ 5 ▲ Lebanon 72 80 ▲ 45 52 ▲ Lithuania 28 26 ► 43 ▲ 55 ▲ 7 5 ▼ 14 ▲ 21 ▲ Malaysia 50 29 ▼ 41 ▼ 20 5 ▼ 13 ▼ Norway 42 37 ▼ 28 ▼ 13 9 ▼ 6 ▼ Palestinian Nat'I Auth 72 64 ▼ 46 34 ▼ Romania 54 51 ► 50 ► 49 ► 23 22 ► 22 ► 23 ► Russian Federation 24 30 ▲ 27 ► 29 ► 5 7 ► 8 ▲ 8 ► Scotland 39 30 ▼ 39 ► 13 8 ▼ 14 ► Serbia 49 52 ► 19 21 ► Singapore 20 15 ▼ 16 ► 9 ▼ 7 5 ▼ 5 ► 1 ▼ Slovenia 19 25 ▲ 31 ▲ 3 4 ► 7 ▲ Sweden 31 25 ▼ 17 ▼ 9 5 ▼ 3 ▼ Thailand 52 46 ▼ 20 13 ▼ Tunisia 69 88 ▲ 75 ▲ 23 48 ▲ 32 ▲ United States 29 25 ► 33 ► 32 ► 8 7 ► 13 ▲ 13 ▲
► Difference not statistically significant, country’s performance did not changed between the two years considered (1995, 1999 or 2003 and 2007). ▼ or ▲ Difference statistically significant. ▲ means that country’s performance significantly improved between the two years considered (1995, 1999 or 2003 and 2007), that means that the proportion of students below benchmarks decreased, while ▼ means that country’s performance significantly decreased between the two years considered (1995, 1999 or 2003 and 2007), that means that the proportion of students below benchmarks increased. Significance level: 10%. * The evolution analysis always refers to 2007.

51
ANNEX D
Macro-Analysis of variability in students’ performance
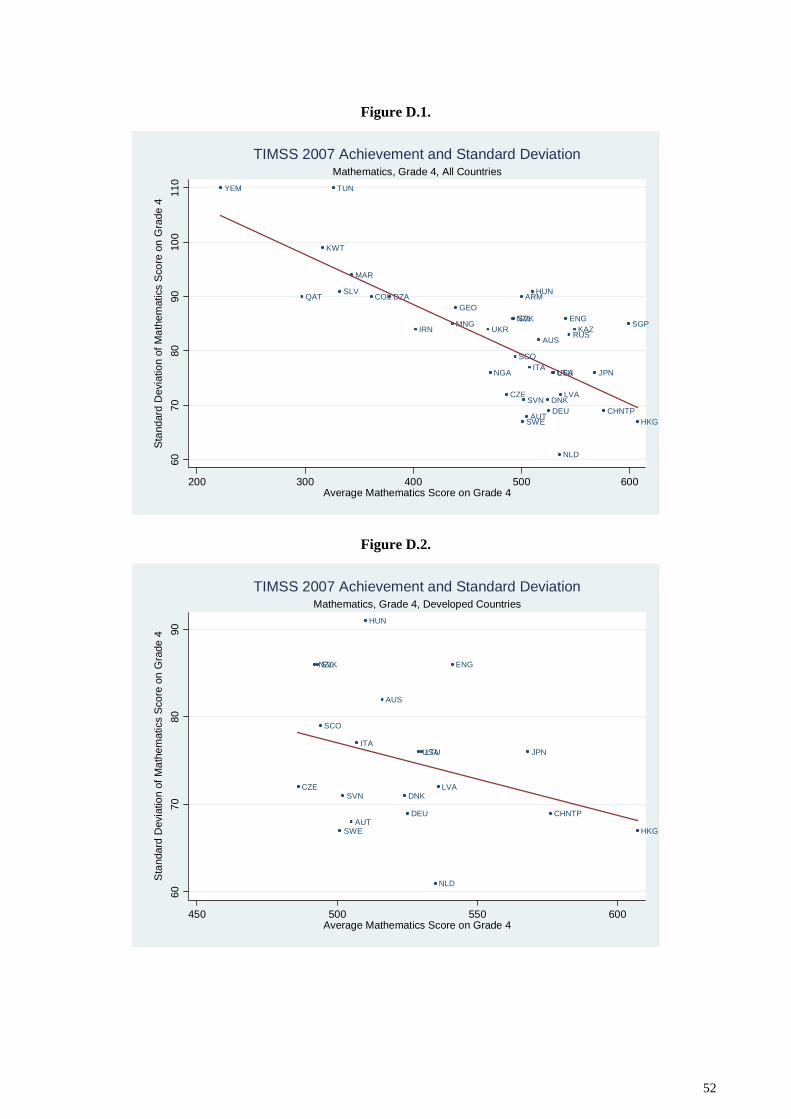
Figure D.1.
DZA ARM
AUS
AUTCHNTP
COL
CZEDNK
SLV
GEO
DEUHKG
HUN
IRN
ITAJPN
KAZ
KWT
LVA
LTU
MNG
MAR
NLD
NZL
NGA
RUS
SCO
SGPSVK
SVN
SWE
TUN
UKRENG
USA
YEM
QAT
6070
8090
100
110
Sta
ndar
d D
evia
tion
of M
athe
mat
ics
Sco
re o
n G
rade
4
200 300 400 500 600Average Mathematics Score on Grade 4
Mathematics, Grade 4, All CountriesTIMSS 2007 Achievement and Standard Deviation
Figure D.2.
AUS
AUTCHNTP
CZEDNK
DEU
HKG
HUN
ITAJPN
LVA
LTU
NLD
NZL
SCO
SVK
SVN
SWE
ENG
USA
6070
8090
Sta
ndar
d D
evia
tion
of M
athe
mat
ics
Sco
re o
n G
rade
4
450 500 550 600Average Mathematics Score on Grade 4
Mathematics, Grade 4, Developed CountriesTIMSS 2007 Achievement and Standard Deviation
52

Figure D.3.
DZA ARMCOLSLV
GEO
IRN KAZ
KWT
MNG
MAR
NGA
RUS
SGP
TUN
UKR
YEM
QAT
7080
9010
011
0S
tand
ard
Dev
iatio
n of
Mat
hem
atic
s S
core
on
Gra
de 4
200 300 400 500 600Average Mathematics Score on Grade 4
Mathematics, Grade 4, Developing Countries (Including Countries in Transition)TIMSS 2007 Achievement and Standard Deviation
Figure D.4.
DZA
ARM
AUS
BHR
BIHBWA
BGR
CHNTP
COL
CYP
CZE
EGY
SLV
GEO
GHA
HKG
HUNIDNIRN
ISR
ITA
JPN
JOR
KOR
KWT
LBN
LTUMYS
MNGMAR
NOR
OMN
PSEROU
RUS
SAU
SCO
SCG
SGP
SVNSWE
SYR
THA
TUN
TUR
UKR
ENG
USA
QATMLT
6070
8090
100
110
Sta
ndar
d D
evia
tion
of M
athe
mat
ics
Sco
re o
n G
rade
8
300 400 500 600Average Mathematics Score on Grade 8
Mathematics, Grade 8, All CountriesTIMSS 2007 Achievement and Standard Deviation
53
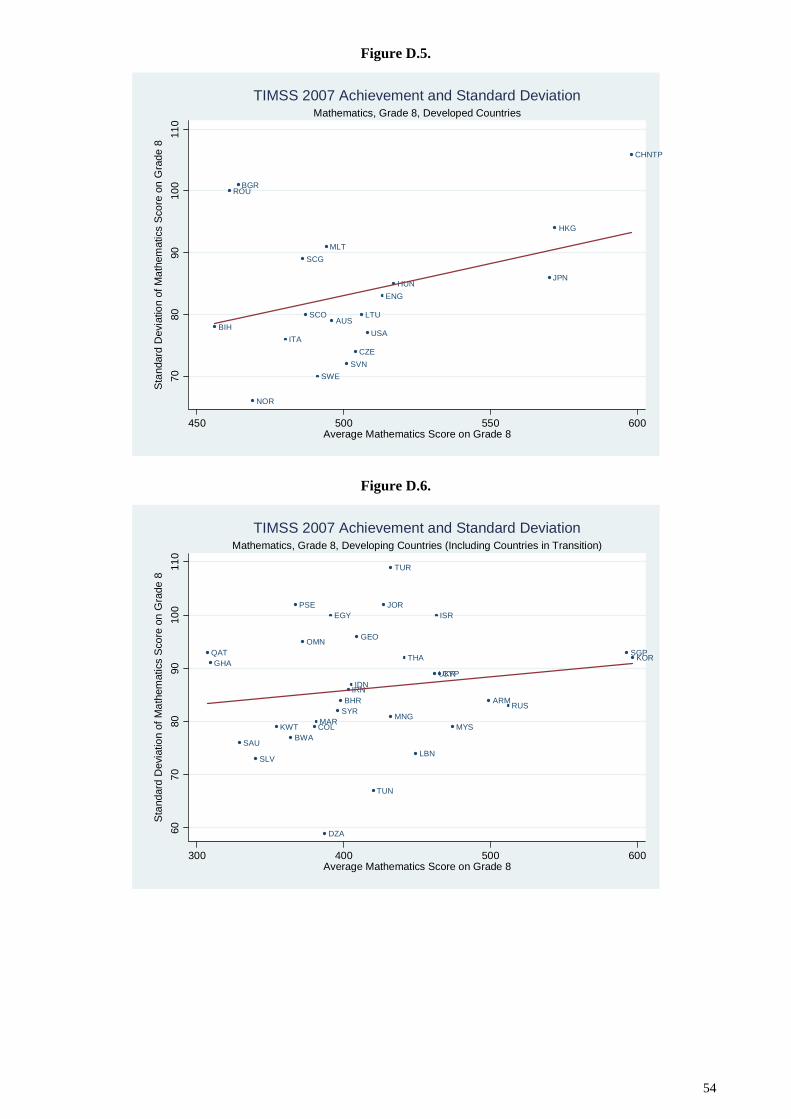
Figure D.5.
AUSBIH
BGR
CHNTP
CZE
HKG
HUN
ITA
JPN
LTU
NOR
ROU
SCO
SCG
SVNSWE
ENG
USA
MLT
7080
9010
011
0S
tand
ard
Dev
iatio
n of
Mat
hem
atic
s S
core
on
Gra
de 8
450 500 550 600Average Mathematics Score on Grade 8
Mathematics, Grade 8, Developed CountriesTIMSS 2007 Achievement and Standard Deviation
Figure D.6.
DZA
ARMBHR
BWACOL
CYP
EGY
SLV
GEO
GHA
IDNIRN
ISRJOR
KOR
KWT
LBN
MYSMNGMAR
OMN
PSE
RUS
SAU
SGP
SYR
THA
TUN
TUR
UKR
QAT
6070
8090
100
110
Sta
ndar
d D
evia
tion
of M
athe
mat
ics
Sco
re o
n G
rade
8
300 400 500 600Average Mathematics Score on Grade 8
Mathematics, Grade 8, Developing Countries (Including Countries in Transition)TIMSS 2007 Achievement and Standard Deviation
54
55
ANNEX E
Univariate Analysis of Key Marginalization Variables

56
Table E.1.a. TIMSS Average Mathematics Achievement by Books at Home, Grade 4
Country
More than 200 books (a)
Between 26 and 200 books Less than 26 books (b)
Difference (b) - (a)
Test Mean Test Benchmark
% Mean %
Below 400
% Mean %
Below 400
% Mean %
Below 400
Dif Sig Dif Sig
Qatar 22 297 88 39 317 82 39 293 88 -3 ► 0 ► Hong-Kong China 12 628 0 49 614 0 39 593 1 -35 ▼ 0 ► Lithuania 6 540 7 43 549 3 51 514 8 -27 ▼ 1 ► Algeria 2 379 56 15 396 51 83 381 58 2 ► 1 ► Netherlands 11 547 2 55 546 1 33 514 4 -33 ▼ 2 ► Mongolia 3 430 36 21 458 23 75 434 34 4 ► -2 ► Singapore 13 627 1 56 615 1 32 565 3 -62 ▼ 2 ► Kazakhstan 6 560 4 38 551 3 57 547 6 -13 ▼ 2 ► Japan 7 599 1 50 585 1 42 545 3 -55 ▼ 2 ► Armenia 17 499 11 37 506 10 46 505 14 5 ► 3 ► El Salvador 3 336 76 18 350 69 78 328 79 -8 ► 3 ► Russian Federation 11 556 5 53 556 3 36 524 8 -32 ▼ 3 ► Yemen, Rep. 4 201 97 14 228 93 82 233 93 32 ▲ -4 ► Kuwait 14 300 83 34 339 72 52 324 78 24 ▲ -5 ► Colombia 5 339 76 24 375 61 71 355 69 15 ▲ -6 ► Tunisia 3 359 61 24 377 54 73 324 75 -35 ▼ 14 ► Chinese Tapei 14 606 0 45 593 0 41 549 2 -57 ▼ 1 ▼ Latvia 13 556 2 58 547 2 29 513 6 -43 ▼ 4 ▼ United States 15 552 4 50 543 3 35 500 8 -53 ▼ 4 ▼ Italy 12 517 7 43 518 6 45 495 12 -22 ▼ 5 ▼ Slovenia 10 519 7 51 517 5 39 480 13 -39 ▼ 6 ▼ Slovak Republic 8 517 10 48 517 6 44 475 17 -42 ▼ 7 ▼ Denmark 12 544 1 56 533 3 32 502 8 -42 ▼ 7 ▼ Germany 14 561 1 52 541 2 34 496 9 -65 ▼ 7 ▼ England 19 575 4 55 551 3 26 499 12 -76 ▼ 8 ▼ Austria 12 535 3 48 520 4 40 481 12 -54 ▼ 9 ▼ Australia 22 531 7 59 526 6 19 477 17 -54 ▼ 10 ▼ Czech Republic 11 505 10 56 501 7 33 458 20 -46 ▼ 10 ▼ Sweden 17 530 2 56 509 5 27 476 13 -54 ▼ 10 ▼ Ukraine 9 488 16 49 486 15 42 450 27 -38 ▼ 11 ▼ Georgia 17 448 26 42 454 27 41 428 38 -19 ▼ 12 ▼ Scotland 17 518 8 51 509 7 32 461 21 -57 ▼ 13 ▼ Norway 13 489 13 57 484 12 30 450 26 -38 ▼ 13 ▼ Morocco 5 378 57 18 365 63 76 342 74 -35 ▼ 17 ▼ New Zealand 17 524 9 55 506 9 28 450 27 -73 ▼ 18 ▼ Hungary 16 557 3 49 530 6 35 467 21 -89 ▼ 18 ▼ Iran, Islamic Rep. 5 449 26 18 443 29 78 392 52 -57 ▼ 26 ▼
► Difference not statistically significant ▼ or ▲ Difference statistically significant. ▲ means that (b) is higher than (a), while ▼ means that (a) is higher than (b). Significance level: 10%. Because results are rounded to the nearest whole number, some totals may appear inconsistent.

57
Table E.1.b. TIMSS Average Science Achievement by Books at Home, Grade 4
Country
More than 200 books (a)
Between 26 and 200 books Less than 26 books (b)
Difference (b) - (a)
Test Mean Test Benchmark
% Mean %
Below 400
% Mean %
Below 400
% Mean %
Below 400
Dif Sig Dif Sig
Qatar 22 293 77 39 315 72 39 295 77 2 ► 0 ► Lithuania 6 520 6 43 531 3 51 501 6 -19 ▼ 0 ► Hong-Kong China 12 568 2 49 560 1 39 544 3 -24 ▼ 1 ► Mongolia 3 427 39 21 438 30 75 421 38 -6 ► -1 ► Yemen, Rep. 4 181 93 14 222 88 82 203 92 22 ▲ -1 ► Japan 7 577 2 50 560 1 42 529 4 -48 ▼ 3 ► Russian Federation 11 555 4 53 556 2 36 530 7 -25 ▼ 3 ► Algeria 2 355 63 15 377 58 83 357 66 3 ► 3 ► Netherlands 11 550 2 55 532 1 33 502 5 -49 ▼ 3 ► Kazakhstan 6 554 3 38 539 3 57 526 6 -27 ▼ 4 ► Armenia 17 489 19 37 485 21 46 496 23 7 ► 4 ► Slovak Republic 8 548 6 48 549 3 44 502 11 -46 ▼ 4 ► Kuwait 14 337 66 34 374 55 52 355 62 18 ▼ -4 ► Colombia 5 384 55 24 419 43 71 401 48 16 ▼ -8 ► El Salvador 3 410 46 18 411 45 78 387 54 -22 ▼ 8 ► Tunisia 3 362 57 24 387 48 73 312 71 -50 ▼ 15 ► Latvia 13 559 2 58 553 1 29 517 5 -42 ▼ 3 ▼ Chinese Tapei 14 590 1 45 574 2 41 529 5 -62 ▼ 3 ▼ Italy 12 555 3 43 547 4 45 520 7 -35 ▼ 4 ▼ Singapore 13 617 2 56 605 2 32 546 7 -72 ▼ 5 ▼ United States 15 564 4 50 555 3 35 506 10 -59 ▼ 6 ▼ Slovenia 10 541 4 51 532 5 39 497 10 -44 ▼ 6 ▼ England 19 579 3 55 550 2 26 499 10 -79 ▼ 8 ▼ Czech Republic 11 535 5 56 531 4 33 484 12 -50 ▼ 8 ▼ Sweden 17 561 1 56 531 3 27 493 10 -68 ▼ 9 ▼ Denmark 12 546 2 56 527 5 32 492 12 -54 ▼ 9 ▼ Hungary 16 579 2 49 553 3 35 501 11 -78 ▼ 9 ▼ Austria 12 561 2 48 543 3 40 496 12 -66 ▼ 9 ▼ Australia 22 550 5 59 535 4 19 485 14 -65 ▼ 10 ▼ Scotland 17 528 7 51 513 6 32 467 18 -61 ▼ 10 ▼ Germany 14 574 2 52 546 2 34 490 12 -84 ▼ 11 ▼ Ukraine 9 494 13 49 490 13 42 455 24 -39 ▼ 11 ▼ Norway 13 497 12 57 488 11 30 451 25 -46 ▼ 13 ▼ Morocco 5 342 64 18 338 67 76 295 80 -46 ▼ 16 ▼ Georgia 17 434 32 42 434 33 41 402 49 -32 ▼ 17 ▼ New Zealand 17 541 8 55 519 9 28 456 25 -85 ▼ 17 ▼ Iran, Islamic Rep. 5 500 18 18 478 20 78 424 38 -75 ▼ 20 ▼
► Difference not statistically significant ▼ or ▲ Difference statistically significant. ▲ means that (b) is higher than (a), while ▼ means that (a) is higher than (b). Significance level: 10%. Because results are rounded to the nearest whole number, some totals may appear inconsistent.
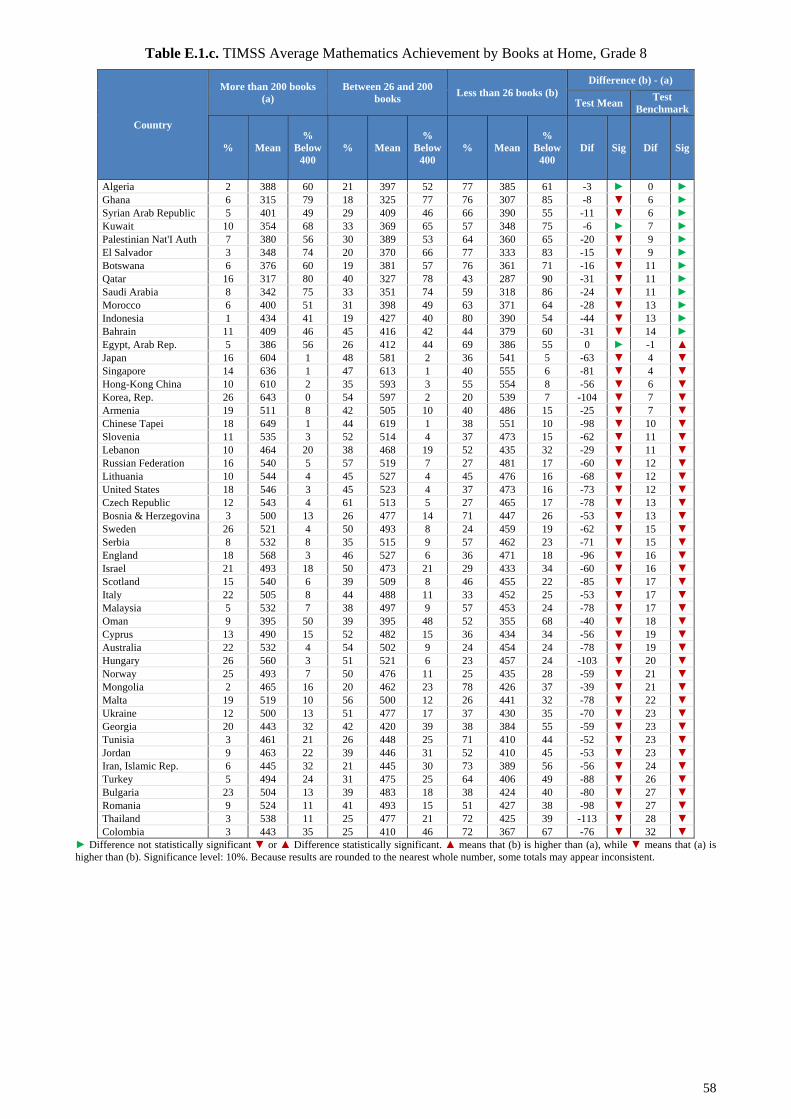
58
Table E.1.c. TIMSS Average Mathematics Achievement by Books at Home, Grade 8
Country
More than 200 books (a)
Between 26 and 200 books Less than 26 books (b)
Difference (b) - (a)
Test Mean Test Benchmark
% Mean %
Below 400
% Mean %
Below 400
% Mean %
Below 400
Dif Sig Dif Sig
Algeria 2 388 60 21 397 52 77 385 61 -3 ► 0 ► Ghana 6 315 79 18 325 77 76 307 85 -8 ▼ 6 ► Syrian Arab Republic 5 401 49 29 409 46 66 390 55 -11 ▼ 6 ► Kuwait 10 354 68 33 369 65 57 348 75 -6 ► 7 ► Palestinian Nat'I Auth 7 380 56 30 389 53 64 360 65 -20 ▼ 9 ► El Salvador 3 348 74 20 370 66 77 333 83 -15 ▼ 9 ► Botswana 6 376 60 19 381 57 76 361 71 -16 ▼ 11 ► Qatar 16 317 80 40 327 78 43 287 90 -31 ▼ 11 ► Saudi Arabia 8 342 75 33 351 74 59 318 86 -24 ▼ 11 ► Morocco 6 400 51 31 398 49 63 371 64 -28 ▼ 13 ► Indonesia 1 434 41 19 427 40 80 390 54 -44 ▼ 13 ► Bahrain 11 409 46 45 416 42 44 379 60 -31 ▼ 14 ► Egypt, Arab Rep. 5 386 56 26 412 44 69 386 55 0 ► -1 ▲ Japan 16 604 1 48 581 2 36 541 5 -63 ▼ 4 ▼ Singapore 14 636 1 47 613 1 40 555 6 -81 ▼ 4 ▼ Hong-Kong China 10 610 2 35 593 3 55 554 8 -56 ▼ 6 ▼ Korea, Rep. 26 643 0 54 597 2 20 539 7 -104 ▼ 7 ▼ Armenia 19 511 8 42 505 10 40 486 15 -25 ▼ 7 ▼ Chinese Tapei 18 649 1 44 619 1 38 551 10 -98 ▼ 10 ▼ Slovenia 11 535 3 52 514 4 37 473 15 -62 ▼ 11 ▼ Lebanon 10 464 20 38 468 19 52 435 32 -29 ▼ 11 ▼ Russian Federation 16 540 5 57 519 7 27 481 17 -60 ▼ 12 ▼ Lithuania 10 544 4 45 527 4 45 476 16 -68 ▼ 12 ▼ United States 18 546 3 45 523 4 37 473 16 -73 ▼ 12 ▼ Czech Republic 12 543 4 61 513 5 27 465 17 -78 ▼ 13 ▼ Bosnia & Herzegovina 3 500 13 26 477 14 71 447 26 -53 ▼ 13 ▼ Sweden 26 521 4 50 493 8 24 459 19 -62 ▼ 15 ▼ Serbia 8 532 8 35 515 9 57 462 23 -71 ▼ 15 ▼ England 18 568 3 46 527 6 36 471 18 -96 ▼ 16 ▼ Israel 21 493 18 50 473 21 29 433 34 -60 ▼ 16 ▼ Scotland 15 540 6 39 509 8 46 455 22 -85 ▼ 17 ▼ Italy 22 505 8 44 488 11 33 452 25 -53 ▼ 17 ▼ Malaysia 5 532 7 38 497 9 57 453 24 -78 ▼ 17 ▼ Oman 9 395 50 39 395 48 52 355 68 -40 ▼ 18 ▼ Cyprus 13 490 15 52 482 15 36 434 34 -56 ▼ 19 ▼ Australia 22 532 4 54 502 9 24 454 24 -78 ▼ 19 ▼ Hungary 26 560 3 51 521 6 23 457 24 -103 ▼ 20 ▼ Norway 25 493 7 50 476 11 25 435 28 -59 ▼ 21 ▼ Mongolia 2 465 16 20 462 23 78 426 37 -39 ▼ 21 ▼ Malta 19 519 10 56 500 12 26 441 32 -78 ▼ 22 ▼ Ukraine 12 500 13 51 477 17 37 430 35 -70 ▼ 23 ▼ Georgia 20 443 32 42 420 39 38 384 55 -59 ▼ 23 ▼ Tunisia 3 461 21 26 448 25 71 410 44 -52 ▼ 23 ▼ Jordan 9 463 22 39 446 31 52 410 45 -53 ▼ 23 ▼ Iran, Islamic Rep. 6 445 32 21 445 30 73 389 56 -56 ▼ 24 ▼ Turkey 5 494 24 31 475 25 64 406 49 -88 ▼ 26 ▼ Bulgaria 23 504 13 39 483 18 38 424 40 -80 ▼ 27 ▼ Romania 9 524 11 41 493 15 51 427 38 -98 ▼ 27 ▼ Thailand 3 538 11 25 477 21 72 425 39 -113 ▼ 28 ▼ Colombia 3 443 35 25 410 46 72 367 67 -76 ▼ 32 ▼
► Difference not statistically significant ▼ or ▲ Difference statistically significant. ▲ means that (b) is higher than (a), while ▼ means that (a) is higher than (b). Significance level: 10%. Because results are rounded to the nearest whole number, some totals may appear inconsistent.
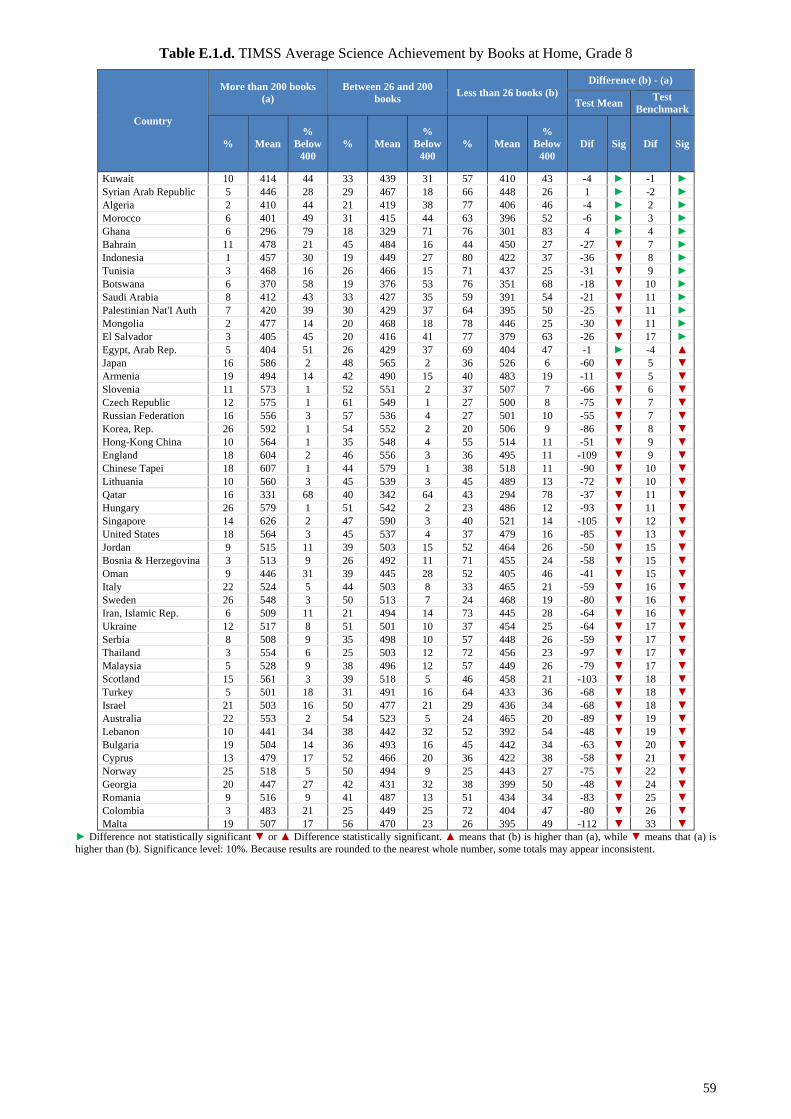
59
Table E.1.d. TIMSS Average Science Achievement by Books at Home, Grade 8
Country
More than 200 books (a)
Between 26 and 200 books Less than 26 books (b)
Difference (b) - (a)
Test Mean Test Benchmark
% Mean %
Below 400
% Mean %
Below 400
% Mean %
Below 400
Dif Sig Dif Sig
Kuwait 10 414 44 33 439 31 57 410 43 -4 ► -1 ► Syrian Arab Republic 5 446 28 29 467 18 66 448 26 1 ► -2 ► Algeria 2 410 44 21 419 38 77 406 46 -4 ► 2 ► Morocco 6 401 49 31 415 44 63 396 52 -6 ► 3 ► Ghana 6 296 79 18 329 71 76 301 83 4 ► 4 ► Bahrain 11 478 21 45 484 16 44 450 27 -27 ▼ 7 ► Indonesia 1 457 30 19 449 27 80 422 37 -36 ▼ 8 ► Tunisia 3 468 16 26 466 15 71 437 25 -31 ▼ 9 ► Botswana 6 370 58 19 376 53 76 351 68 -18 ▼ 10 ► Saudi Arabia 8 412 43 33 427 35 59 391 54 -21 ▼ 11 ► Palestinian Nat'I Auth 7 420 39 30 429 37 64 395 50 -25 ▼ 11 ► Mongolia 2 477 14 20 468 18 78 446 25 -30 ▼ 11 ► El Salvador 3 405 45 20 416 41 77 379 63 -26 ▼ 17 ► Egypt, Arab Rep. 5 404 51 26 429 37 69 404 47 -1 ► -4 ▲ Japan 16 586 2 48 565 2 36 526 6 -60 ▼ 5 ▼ Armenia 19 494 14 42 490 15 40 483 19 -11 ▼ 5 ▼ Slovenia 11 573 1 52 551 2 37 507 7 -66 ▼ 6 ▼ Czech Republic 12 575 1 61 549 1 27 500 8 -75 ▼ 7 ▼ Russian Federation 16 556 3 57 536 4 27 501 10 -55 ▼ 7 ▼ Korea, Rep. 26 592 1 54 552 2 20 506 9 -86 ▼ 8 ▼ Hong-Kong China 10 564 1 35 548 4 55 514 11 -51 ▼ 9 ▼ England 18 604 2 46 556 3 36 495 11 -109 ▼ 9 ▼ Chinese Tapei 18 607 1 44 579 1 38 518 11 -90 ▼ 10 ▼ Lithuania 10 560 3 45 539 3 45 489 13 -72 ▼ 10 ▼ Qatar 16 331 68 40 342 64 43 294 78 -37 ▼ 11 ▼ Hungary 26 579 1 51 542 2 23 486 12 -93 ▼ 11 ▼ Singapore 14 626 2 47 590 3 40 521 14 -105 ▼ 12 ▼ United States 18 564 3 45 537 4 37 479 16 -85 ▼ 13 ▼ Jordan 9 515 11 39 503 15 52 464 26 -50 ▼ 15 ▼ Bosnia & Herzegovina 3 513 9 26 492 11 71 455 24 -58 ▼ 15 ▼ Oman 9 446 31 39 445 28 52 405 46 -41 ▼ 15 ▼ Italy 22 524 5 44 503 8 33 465 21 -59 ▼ 16 ▼ Sweden 26 548 3 50 513 7 24 468 19 -80 ▼ 16 ▼ Iran, Islamic Rep. 6 509 11 21 494 14 73 445 28 -64 ▼ 16 ▼ Ukraine 12 517 8 51 501 10 37 454 25 -64 ▼ 17 ▼ Serbia 8 508 9 35 498 10 57 448 26 -59 ▼ 17 ▼ Thailand 3 554 6 25 503 12 72 456 23 -97 ▼ 17 ▼ Malaysia 5 528 9 38 496 12 57 449 26 -79 ▼ 17 ▼ Scotland 15 561 3 39 518 5 46 458 21 -103 ▼ 18 ▼ Turkey 5 501 18 31 491 16 64 433 36 -68 ▼ 18 ▼ Israel 21 503 16 50 477 21 29 436 34 -68 ▼ 18 ▼ Australia 22 553 2 54 523 5 24 465 20 -89 ▼ 19 ▼ Lebanon 10 441 34 38 442 32 52 392 54 -48 ▼ 19 ▼ Bulgaria 19 504 14 36 493 16 45 442 34 -63 ▼ 20 ▼ Cyprus 13 479 17 52 466 20 36 422 38 -58 ▼ 21 ▼ Norway 25 518 5 50 494 9 25 443 27 -75 ▼ 22 ▼ Georgia 20 447 27 42 431 32 38 399 50 -48 ▼ 24 ▼ Romania 9 516 9 41 487 13 51 434 34 -83 ▼ 25 ▼ Colombia 3 483 21 25 449 25 72 404 47 -80 ▼ 26 ▼ Malta 19 507 17 56 470 23 26 395 49 -112 ▼ 33 ▼
► Difference not statistically significant ▼ or ▲ Difference statistically significant. ▲ means that (b) is higher than (a), while ▼ means that (a) is higher than (b). Significance level: 10%. Because results are rounded to the nearest whole number, some totals may appear inconsistent.
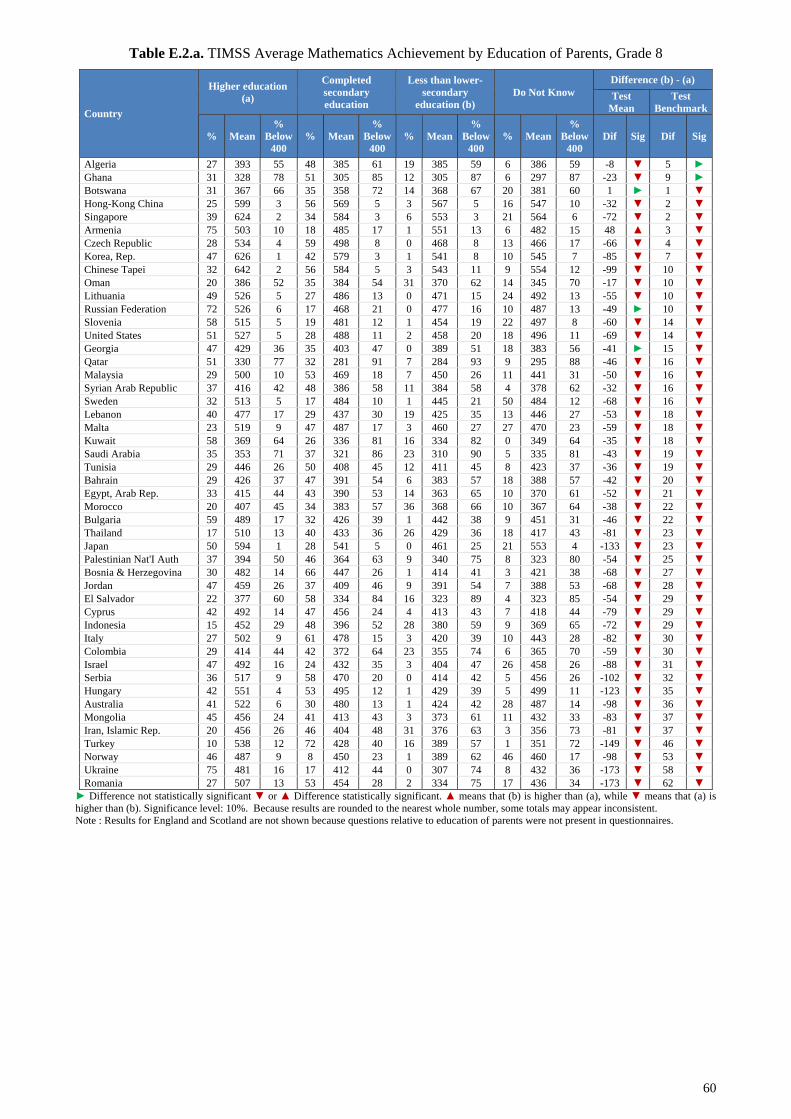
60
Table E.2.a. TIMSS Average Mathematics Achievement by Education of Parents, Grade 8
Country
Higher education (a)
Completed secondary education
Less than lower-secondary
education (b) Do Not Know
Difference (b) - (a) Test
Mean Test
Benchmark
% Mean %
Below 400
% Mean%
Below 400
% Mean%
Below 400
% Mean%
Below 400
Dif Sig Dif Sig
Algeria 27 393 55 48 385 61 19 385 59 6 386 59 -8 ▼ 5 ► Ghana 31 328 78 51 305 85 12 305 87 6 297 87 -23 ▼ 9 ► Botswana 31 367 66 35 358 72 14 368 67 20 381 60 1 ► 1 ▼ Hong-Kong China 25 599 3 56 569 5 3 567 5 16 547 10 -32 ▼ 2 ▼ Singapore 39 624 2 34 584 3 6 553 3 21 564 6 -72 ▼ 2 ▼ Armenia 75 503 10 18 485 17 1 551 13 6 482 15 48 ▲ 3 ▼ Czech Republic 28 534 4 59 498 8 0 468 8 13 466 17 -66 ▼ 4 ▼ Korea, Rep. 47 626 1 42 579 3 1 541 8 10 545 7 -85 ▼ 7 ▼ Chinese Tapei 32 642 2 56 584 5 3 543 11 9 554 12 -99 ▼ 10 ▼ Oman 20 386 52 35 384 54 31 370 62 14 345 70 -17 ▼ 10 ▼ Lithuania 49 526 5 27 486 13 0 471 15 24 492 13 -55 ▼ 10 ▼ Russian Federation 72 526 6 17 468 21 0 477 16 10 487 13 -49 ► 10 ▼ Slovenia 58 515 5 19 481 12 1 454 19 22 497 8 -60 ▼ 14 ▼ United States 51 527 5 28 488 11 2 458 20 18 496 11 -69 ▼ 14 ▼ Georgia 47 429 36 35 403 47 0 389 51 18 383 56 -41 ► 15 ▼ Qatar 51 330 77 32 281 91 7 284 93 9 295 88 -46 ▼ 16 ▼ Malaysia 29 500 10 53 469 18 7 450 26 11 441 31 -50 ▼ 16 ▼ Syrian Arab Republic 37 416 42 48 386 58 11 384 58 4 378 62 -32 ▼ 16 ▼ Sweden 32 513 5 17 484 10 1 445 21 50 484 12 -68 ▼ 16 ▼ Lebanon 40 477 17 29 437 30 19 425 35 13 446 27 -53 ▼ 18 ▼ Malta 23 519 9 47 487 17 3 460 27 27 470 23 -59 ▼ 18 ▼ Kuwait 58 369 64 26 336 81 16 334 82 0 349 64 -35 ▼ 18 ▼ Saudi Arabia 35 353 71 37 321 86 23 310 90 5 335 81 -43 ▼ 19 ▼ Tunisia 29 446 26 50 408 45 12 411 45 8 423 37 -36 ▼ 19 ▼ Bahrain 29 426 37 47 391 54 6 383 57 18 388 57 -42 ▼ 20 ▼ Egypt, Arab Rep. 33 415 44 43 390 53 14 363 65 10 370 61 -52 ▼ 21 ▼ Morocco 20 407 45 34 383 57 36 368 66 10 367 64 -38 ▼ 22 ▼ Bulgaria 59 489 17 32 426 39 1 442 38 9 451 31 -46 ▼ 22 ▼ Thailand 17 510 13 40 433 36 26 429 36 18 417 43 -81 ▼ 23 ▼ Japan 50 594 1 28 541 5 0 461 25 21 553 4 -133 ▼ 23 ▼ Palestinian Nat'I Auth 37 394 50 46 364 63 9 340 75 8 323 80 -54 ▼ 25 ▼ Bosnia & Herzegovina 30 482 14 66 447 26 1 414 41 3 421 38 -68 ▼ 27 ▼ Jordan 47 459 26 37 409 46 9 391 54 7 388 53 -68 ▼ 28 ▼ El Salvador 22 377 60 58 334 84 16 323 89 4 323 85 -54 ▼ 29 ▼ Cyprus 42 492 14 47 456 24 4 413 43 7 418 44 -79 ▼ 29 ▼ Indonesia 15 452 29 48 396 52 28 380 59 9 369 65 -72 ▼ 29 ▼ Italy 27 502 9 61 478 15 3 420 39 10 443 28 -82 ▼ 30 ▼ Colombia 29 414 44 42 372 64 23 355 74 6 365 70 -59 ▼ 30 ▼ Israel 47 492 16 24 432 35 3 404 47 26 458 26 -88 ▼ 31 ▼ Serbia 36 517 9 58 470 20 0 414 42 5 456 26 -102 ▼ 32 ▼ Hungary 42 551 4 53 495 12 1 429 39 5 499 11 -123 ▼ 35 ▼ Australia 41 522 6 30 480 13 1 424 42 28 487 14 -98 ▼ 36 ▼ Mongolia 45 456 24 41 413 43 3 373 61 11 432 33 -83 ▼ 37 ▼ Iran, Islamic Rep. 20 456 26 46 404 48 31 376 63 3 356 73 -81 ▼ 37 ▼ Turkey 10 538 12 72 428 40 16 389 57 1 351 72 -149 ▼ 46 ▼ Norway 46 487 9 8 450 23 1 389 62 46 460 17 -98 ▼ 53 ▼ Ukraine 75 481 16 17 412 44 0 307 74 8 432 36 -173 ▼ 58 ▼ Romania 27 507 13 53 454 28 2 334 75 17 436 34 -173 ▼ 62 ▼
► Difference not statistically significant ▼ or ▲ Difference statistically significant. ▲ means that (b) is higher than (a), while ▼ means that (a) is higher than (b). Significance level: 10%. Because results are rounded to the nearest whole number, some totals may appear inconsistent. Note : Results for England and Scotland are not shown because questions relative to education of parents were not present in questionnaires.
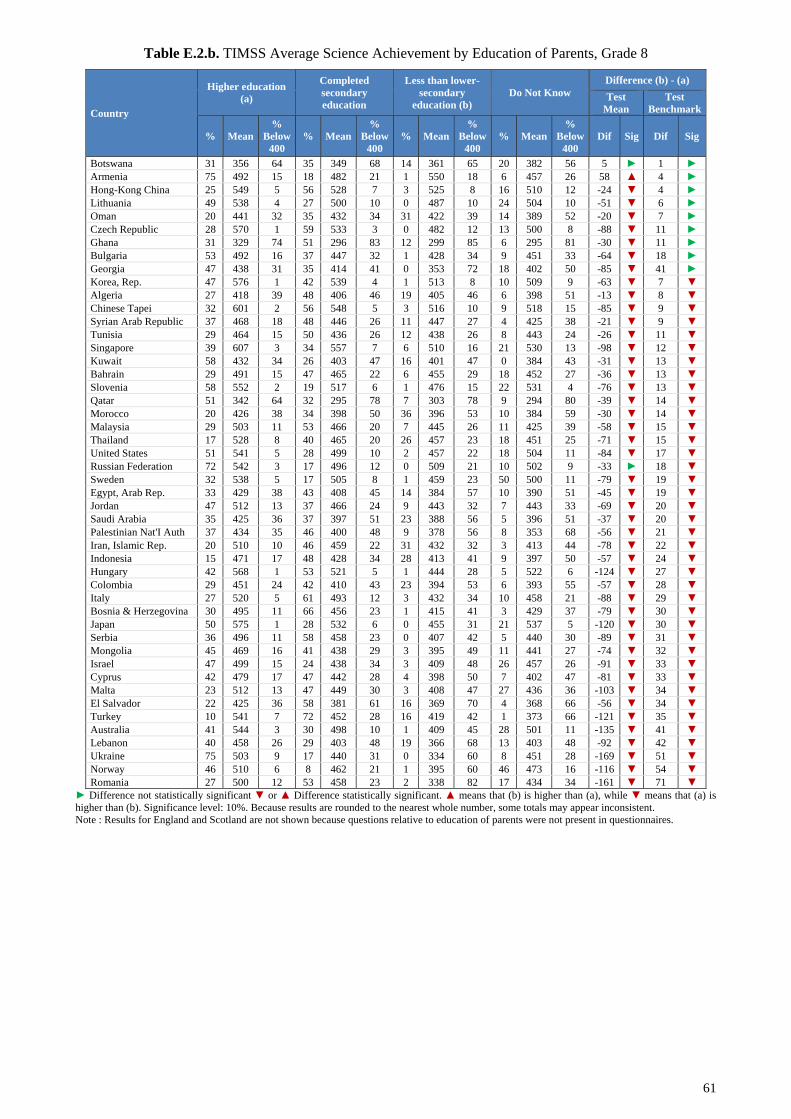
61
Table E.2.b. TIMSS Average Science Achievement by Education of Parents, Grade 8
Country
Higher education (a)
Completed secondary education
Less than lower-secondary
education (b) Do Not Know
Difference (b) - (a) Test
Mean Test
Benchmark
% Mean %
Below 400
% Mean%
Below 400
% Mean%
Below 400
% Mean%
Below 400
Dif Sig Dif Sig
Botswana 31 356 64 35 349 68 14 361 65 20 382 56 5 ► 1 ► Armenia 75 492 15 18 482 21 1 550 18 6 457 26 58 ▲ 4 ► Hong-Kong China 25 549 5 56 528 7 3 525 8 16 510 12 -24 ▼ 4 ► Lithuania 49 538 4 27 500 10 0 487 10 24 504 10 -51 ▼ 6 ► Oman 20 441 32 35 432 34 31 422 39 14 389 52 -20 ▼ 7 ► Czech Republic 28 570 1 59 533 3 0 482 12 13 500 8 -88 ▼ 11 ► Ghana 31 329 74 51 296 83 12 299 85 6 295 81 -30 ▼ 11 ► Bulgaria 53 492 16 37 447 32 1 428 34 9 451 33 -64 ▼ 18 ► Georgia 47 438 31 35 414 41 0 353 72 18 402 50 -85 ▼ 41 ► Korea, Rep. 47 576 1 42 539 4 1 513 8 10 509 9 -63 ▼ 7 ▼ Algeria 27 418 39 48 406 46 19 405 46 6 398 51 -13 ▼ 8 ▼ Chinese Tapei 32 601 2 56 548 5 3 516 10 9 518 15 -85 ▼ 9 ▼ Syrian Arab Republic 37 468 18 48 446 26 11 447 27 4 425 38 -21 ▼ 9 ▼ Tunisia 29 464 15 50 436 26 12 438 26 8 443 24 -26 ▼ 11 ▼ Singapore 39 607 3 34 557 7 6 510 16 21 530 13 -98 ▼ 12 ▼ Kuwait 58 432 34 26 403 47 16 401 47 0 384 43 -31 ▼ 13 ▼ Bahrain 29 491 15 47 465 22 6 455 29 18 452 27 -36 ▼ 13 ▼ Slovenia 58 552 2 19 517 6 1 476 15 22 531 4 -76 ▼ 13 ▼ Qatar 51 342 64 32 295 78 7 303 78 9 294 80 -39 ▼ 14 ▼ Morocco 20 426 38 34 398 50 36 396 53 10 384 59 -30 ▼ 14 ▼ Malaysia 29 503 11 53 466 20 7 445 26 11 425 39 -58 ▼ 15 ▼ Thailand 17 528 8 40 465 20 26 457 23 18 451 25 -71 ▼ 15 ▼ United States 51 541 5 28 499 10 2 457 22 18 504 11 -84 ▼ 17 ▼ Russian Federation 72 542 3 17 496 12 0 509 21 10 502 9 -33 ► 18 ▼ Sweden 32 538 5 17 505 8 1 459 23 50 500 11 -79 ▼ 19 ▼ Egypt, Arab Rep. 33 429 38 43 408 45 14 384 57 10 390 51 -45 ▼ 19 ▼ Jordan 47 512 13 37 466 24 9 443 32 7 443 33 -69 ▼ 20 ▼ Saudi Arabia 35 425 36 37 397 51 23 388 56 5 396 51 -37 ▼ 20 ▼ Palestinian Nat'I Auth 37 434 35 46 400 48 9 378 56 8 353 68 -56 ▼ 21 ▼ Iran, Islamic Rep. 20 510 10 46 459 22 31 432 32 3 413 44 -78 ▼ 22 ▼ Indonesia 15 471 17 48 428 34 28 413 41 9 397 50 -57 ▼ 24 ▼ Hungary 42 568 1 53 521 5 1 444 28 5 522 6 -124 ▼ 27 ▼ Colombia 29 451 24 42 410 43 23 394 53 6 393 55 -57 ▼ 28 ▼ Italy 27 520 5 61 493 12 3 432 34 10 458 21 -88 ▼ 29 ▼ Bosnia & Herzegovina 30 495 11 66 456 23 1 415 41 3 429 37 -79 ▼ 30 ▼ Japan 50 575 1 28 532 6 0 455 31 21 537 5 -120 ▼ 30 ▼ Serbia 36 496 11 58 458 23 0 407 42 5 440 30 -89 ▼ 31 ▼ Mongolia 45 469 16 41 438 29 3 395 49 11 441 27 -74 ▼ 32 ▼ Israel 47 499 15 24 438 34 3 409 48 26 457 26 -91 ▼ 33 ▼ Cyprus 42 479 17 47 442 28 4 398 50 7 402 47 -81 ▼ 33 ▼ Malta 23 512 13 47 449 30 3 408 47 27 436 36 -103 ▼ 34 ▼ El Salvador 22 425 36 58 381 61 16 369 70 4 368 66 -56 ▼ 34 ▼ Turkey 10 541 7 72 452 28 16 419 42 1 373 66 -121 ▼ 35 ▼ Australia 41 544 3 30 498 10 1 409 45 28 501 11 -135 ▼ 41 ▼ Lebanon 40 458 26 29 403 48 19 366 68 13 403 48 -92 ▼ 42 ▼ Ukraine 75 503 9 17 440 31 0 334 60 8 451 28 -169 ▼ 51 ▼ Norway 46 510 6 8 462 21 1 395 60 46 473 16 -116 ▼ 54 ▼ Romania 27 500 12 53 458 23 2 338 82 17 434 34 -161 ▼ 71 ▼
► Difference not statistically significant ▼ or ▲ Difference statistically significant. ▲ means that (b) is higher than (a), while ▼ means that (a) is higher than (b). Significance level: 10%. Because results are rounded to the nearest whole number, some totals may appear inconsistent. Note : Results for England and Scotland are not shown because questions relative to education of parents were not present in questionnaires.
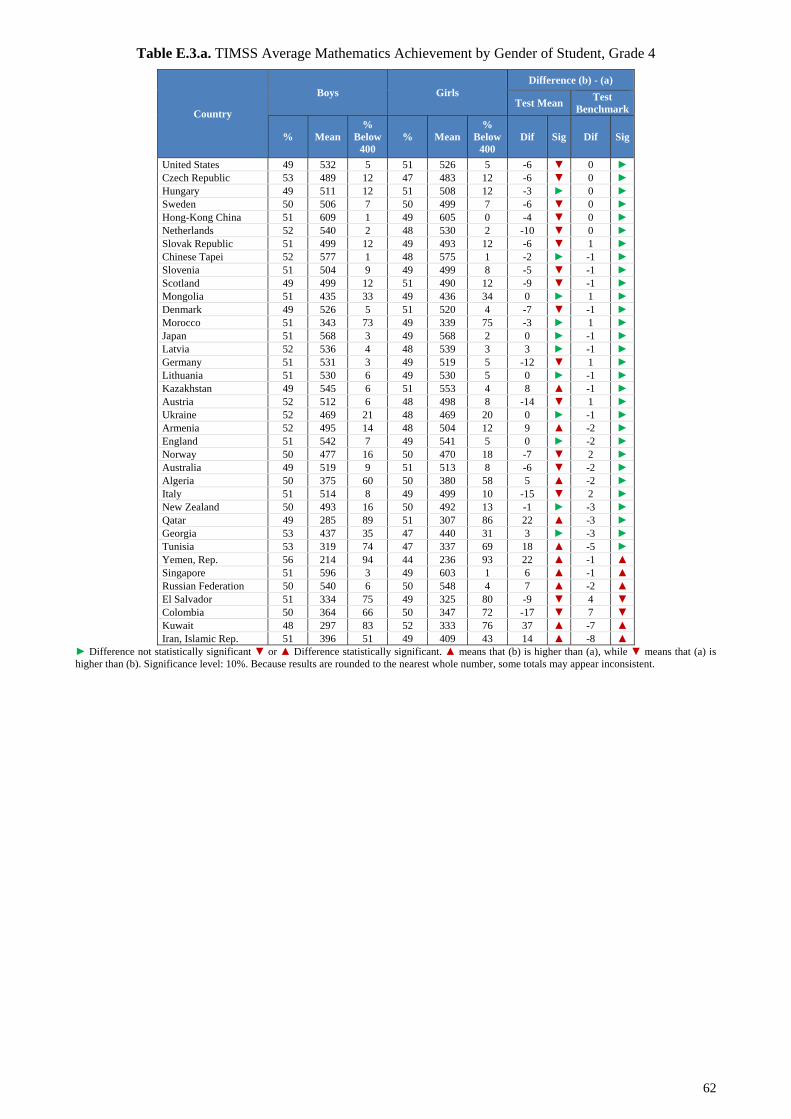
62
Table E.3.a. TIMSS Average Mathematics Achievement by Gender of Student, Grade 4
Country
Boys Girls Difference (b) - (a)
Test Mean Test Benchmark
% Mean %
Below 400
% Mean %
Below 400
Dif Sig Dif Sig
United States 49 532 5 51 526 5 -6 ▼ 0 ► Czech Republic 53 489 12 47 483 12 -6 ▼ 0 ► Hungary 49 511 12 51 508 12 -3 ► 0 ► Sweden 50 506 7 50 499 7 -6 ▼ 0 ► Hong-Kong China 51 609 1 49 605 0 -4 ▼ 0 ► Netherlands 52 540 2 48 530 2 -10 ▼ 0 ► Slovak Republic 51 499 12 49 493 12 -6 ▼ 1 ► Chinese Tapei 52 577 1 48 575 1 -2 ► -1 ► Slovenia 51 504 9 49 499 8 -5 ▼ -1 ► Scotland 49 499 12 51 490 12 -9 ▼ -1 ► Mongolia 51 435 33 49 436 34 0 ► 1 ► Denmark 49 526 5 51 520 4 -7 ▼ -1 ► Morocco 51 343 73 49 339 75 -3 ► 1 ► Japan 51 568 3 49 568 2 0 ► -1 ► Latvia 52 536 4 48 539 3 3 ► -1 ► Germany 51 531 3 49 519 5 -12 ▼ 1 ► Lithuania 51 530 6 49 530 5 0 ► -1 ► Kazakhstan 49 545 6 51 553 4 8 ▲ -1 ► Austria 52 512 6 48 498 8 -14 ▼ 1 ► Ukraine 52 469 21 48 469 20 0 ► -1 ► Armenia 52 495 14 48 504 12 9 ▲ -2 ► England 51 542 7 49 541 5 0 ► -2 ► Norway 50 477 16 50 470 18 -7 ▼ 2 ► Australia 49 519 9 51 513 8 -6 ▼ -2 ► Algeria 50 375 60 50 380 58 5 ▲ -2 ► Italy 51 514 8 49 499 10 -15 ▼ 2 ► New Zealand 50 493 16 50 492 13 -1 ► -3 ► Qatar 49 285 89 51 307 86 22 ▲ -3 ► Georgia 53 437 35 47 440 31 3 ► -3 ► Tunisia 53 319 74 47 337 69 18 ▲ -5 ► Yemen, Rep. 56 214 94 44 236 93 22 ▲ -1 ▲ Singapore 51 596 3 49 603 1 6 ▲ -1 ▲ Russian Federation 50 540 6 50 548 4 7 ▲ -2 ▲ El Salvador 51 334 75 49 325 80 -9 ▼ 4 ▼ Colombia 50 364 66 50 347 72 -17 ▼ 7 ▼ Kuwait 48 297 83 52 333 76 37 ▲ -7 ▲ Iran, Islamic Rep. 51 396 51 49 409 43 14 ▲ -8 ▲
► Difference not statistically significant ▼ or ▲ Difference statistically significant. ▲ means that (b) is higher than (a), while ▼ means that (a) is higher than (b). Significance level: 10%. Because results are rounded to the nearest whole number, some totals may appear inconsistent.
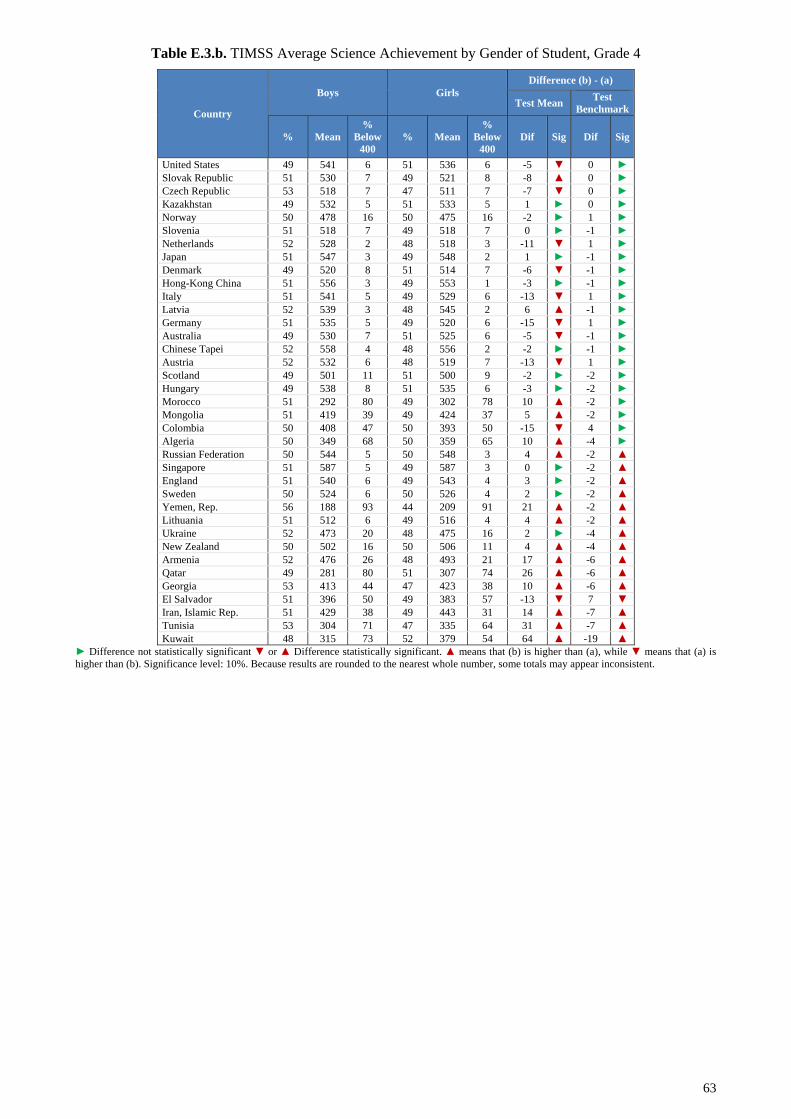
63
Table E.3.b. TIMSS Average Science Achievement by Gender of Student, Grade 4
Country
Boys Girls Difference (b) - (a)
Test Mean Test Benchmark
% Mean %
Below 400
% Mean %
Below 400
Dif Sig Dif Sig
United States 49 541 6 51 536 6 -5 ▼ 0 ► Slovak Republic 51 530 7 49 521 8 -8 ▲ 0 ► Czech Republic 53 518 7 47 511 7 -7 ▼ 0 ► Kazakhstan 49 532 5 51 533 5 1 ► 0 ► Norway 50 478 16 50 475 16 -2 ► 1 ► Slovenia 51 518 7 49 518 7 0 ► -1 ► Netherlands 52 528 2 48 518 3 -11 ▼ 1 ► Japan 51 547 3 49 548 2 1 ► -1 ► Denmark 49 520 8 51 514 7 -6 ▼ -1 ► Hong-Kong China 51 556 3 49 553 1 -3 ► -1 ► Italy 51 541 5 49 529 6 -13 ▼ 1 ► Latvia 52 539 3 48 545 2 6 ▲ -1 ► Germany 51 535 5 49 520 6 -15 ▼ 1 ► Australia 49 530 7 51 525 6 -5 ▼ -1 ► Chinese Tapei 52 558 4 48 556 2 -2 ► -1 ► Austria 52 532 6 48 519 7 -13 ▼ 1 ► Scotland 49 501 11 51 500 9 -2 ► -2 ► Hungary 49 538 8 51 535 6 -3 ► -2 ► Morocco 51 292 80 49 302 78 10 ▲ -2 ► Mongolia 51 419 39 49 424 37 5 ▲ -2 ► Colombia 50 408 47 50 393 50 -15 ▼ 4 ► Algeria 50 349 68 50 359 65 10 ▲ -4 ► Russian Federation 50 544 5 50 548 3 4 ▲ -2 ▲ Singapore 51 587 5 49 587 3 0 ► -2 ▲ England 51 540 6 49 543 4 3 ► -2 ▲ Sweden 50 524 6 50 526 4 2 ► -2 ▲ Yemen, Rep. 56 188 93 44 209 91 21 ▲ -2 ▲ Lithuania 51 512 6 49 516 4 4 ▲ -2 ▲ Ukraine 52 473 20 48 475 16 2 ► -4 ▲ New Zealand 50 502 16 50 506 11 4 ▲ -4 ▲ Armenia 52 476 26 48 493 21 17 ▲ -6 ▲ Qatar 49 281 80 51 307 74 26 ▲ -6 ▲ Georgia 53 413 44 47 423 38 10 ▲ -6 ▲ El Salvador 51 396 50 49 383 57 -13 ▼ 7 ▼ Iran, Islamic Rep. 51 429 38 49 443 31 14 ▲ -7 ▲ Tunisia 53 304 71 47 335 64 31 ▲ -7 ▲ Kuwait 48 315 73 52 379 54 64 ▲ -19 ▲
► Difference not statistically significant ▼ or ▲ Difference statistically significant. ▲ means that (b) is higher than (a), while ▼ means that (a) is higher than (b). Significance level: 10%. Because results are rounded to the nearest whole number, some totals may appear inconsistent.
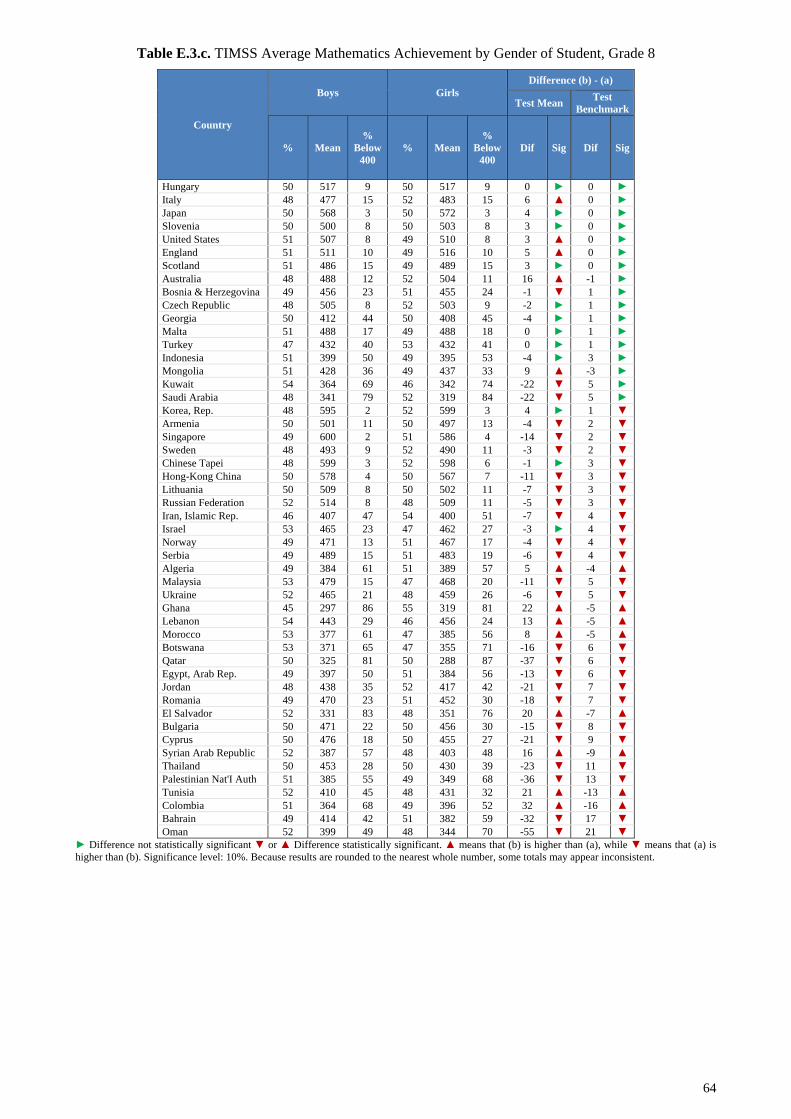
64
Table E.3.c. TIMSS Average Mathematics Achievement by Gender of Student, Grade 8
Country
Boys Girls Difference (b) - (a)
Test Mean Test Benchmark
% Mean %
Below 400
% Mean %
Below 400
Dif Sig Dif Sig
Hungary 50 517 9 50 517 9 0 ► 0 ► Italy 48 477 15 52 483 15 6 ▲ 0 ► Japan 50 568 3 50 572 3 4 ► 0 ► Slovenia 50 500 8 50 503 8 3 ► 0 ► United States 51 507 8 49 510 8 3 ▲ 0 ► England 51 511 10 49 516 10 5 ▲ 0 ► Scotland 51 486 15 49 489 15 3 ► 0 ► Australia 48 488 12 52 504 11 16 ▲ -1 ► Bosnia & Herzegovina 49 456 23 51 455 24 -1 ▼ 1 ► Czech Republic 48 505 8 52 503 9 -2 ► 1 ► Georgia 50 412 44 50 408 45 -4 ► 1 ► Malta 51 488 17 49 488 18 0 ► 1 ► Turkey 47 432 40 53 432 41 0 ► 1 ► Indonesia 51 399 50 49 395 53 -4 ► 3 ► Mongolia 51 428 36 49 437 33 9 ▲ -3 ► Kuwait 54 364 69 46 342 74 -22 ▼ 5 ► Saudi Arabia 48 341 79 52 319 84 -22 ▼ 5 ► Korea, Rep. 48 595 2 52 599 3 4 ► 1 ▼ Armenia 50 501 11 50 497 13 -4 ▼ 2 ▼ Singapore 49 600 2 51 586 4 -14 ▼ 2 ▼ Sweden 48 493 9 52 490 11 -3 ▼ 2 ▼ Chinese Tapei 48 599 3 52 598 6 -1 ► 3 ▼ Hong-Kong China 50 578 4 50 567 7 -11 ▼ 3 ▼ Lithuania 50 509 8 50 502 11 -7 ▼ 3 ▼ Russian Federation 52 514 8 48 509 11 -5 ▼ 3 ▼ Iran, Islamic Rep. 46 407 47 54 400 51 -7 ▼ 4 ▼ Israel 53 465 23 47 462 27 -3 ► 4 ▼ Norway 49 471 13 51 467 17 -4 ▼ 4 ▼ Serbia 49 489 15 51 483 19 -6 ▼ 4 ▼ Algeria 49 384 61 51 389 57 5 ▲ -4 ▲ Malaysia 53 479 15 47 468 20 -11 ▼ 5 ▼ Ukraine 52 465 21 48 459 26 -6 ▼ 5 ▼ Ghana 45 297 86 55 319 81 22 ▲ -5 ▲ Lebanon 54 443 29 46 456 24 13 ▲ -5 ▲ Morocco 53 377 61 47 385 56 8 ▲ -5 ▲ Botswana 53 371 65 47 355 71 -16 ▼ 6 ▼ Qatar 50 325 81 50 288 87 -37 ▼ 6 ▼ Egypt, Arab Rep. 49 397 50 51 384 56 -13 ▼ 6 ▼ Jordan 48 438 35 52 417 42 -21 ▼ 7 ▼ Romania 49 470 23 51 452 30 -18 ▼ 7 ▼ El Salvador 52 331 83 48 351 76 20 ▲ -7 ▲ Bulgaria 50 471 22 50 456 30 -15 ▼ 8 ▼ Cyprus 50 476 18 50 455 27 -21 ▼ 9 ▼ Syrian Arab Republic 52 387 57 48 403 48 16 ▲ -9 ▲ Thailand 50 453 28 50 430 39 -23 ▼ 11 ▼ Palestinian Nat'I Auth 51 385 55 49 349 68 -36 ▼ 13 ▼ Tunisia 52 410 45 48 431 32 21 ▲ -13 ▲ Colombia 51 364 68 49 396 52 32 ▲ -16 ▲ Bahrain 49 414 42 51 382 59 -32 ▼ 17 ▼ Oman 52 399 49 48 344 70 -55 ▼ 21 ▼
► Difference not statistically significant ▼ or ▲ Difference statistically significant. ▲ means that (b) is higher than (a), while ▼ means that (a) is higher than (b). Significance level: 10%. Because results are rounded to the nearest whole number, some totals may appear inconsistent.

65
Table E.3.d. TIMSS Average Science Achievement by Gender of Student, Grade 8
Country
Boys Girls Difference (b) - (a) Test
Mean Test
Benchmark
% Mean%
Below 400
% Mean%
Below 400
Dif Sig Dif Sig
Scotland 49 498 13 51 493 13 -5 ▼ 0 ► Indonesia 49 428 35 51 426 35 -2 ► 0 ► Japan 50 556 4 50 552 3 -4 ▼ 0 ► England 49 546 6 51 537 6 -9 ▼ 0 ► Mongolia 49 449 25 51 450 24 1 ► 0 ► Lithuania 50 519 8 50 518 7 -1 ► 0 ► Algeria 51 408 45 49 408 45 1 ► 0 ► Bosnia & Herzegovina 51 467 20 49 464 20 -3 ► 0 ► Russian Federation 48 533 6 52 527 5 -6 ▼ 0 ► United States 49 526 8 51 514 8 -12 ▼ 1 ► Korea, Rep. 52 557 3 48 549 3 -8 ▼ -1 ► Italy 52 499 11 48 491 12 -8 ▼ 1 ► Czech Republic 52 543 3 48 534 4 -9 ▼ 1 ► Slovenia 50 539 4 50 536 3 -2 ► -1 ► Sweden 52 510 9 48 512 8 2 ► -1 ► Hungary 50 545 4 50 533 5 -12 ▼ 1 ► Malta 49 458 29 51 456 28 -2 ► -1 ► Australia 52 524 7 48 505 9 -18 ▼ 2 ► Morocco 47 401 50 53 403 49 2 ► -2 ► Norway 51 486 14 49 487 12 1 ► -2 ► Syrian Arab Republic 48 457 23 52 448 26 -9 ▼ 3 ► Ukraine 48 486 17 52 484 14 -2 ► -3 ► Serbia 51 469 21 49 472 17 3 ► -4 ► Turkey 53 452 31 47 457 27 5 ▲ -4 ► Lebanon 46 417 42 54 410 47 -7 ▼ 4 ► Chinese Tapei 52 563 6 48 559 4 -5 ▼ -2 ▲ Singapore 51 563 9 49 571 6 8 ▲ -3 ▲ Armenia 50 484 19 50 492 15 8 ▲ -3 ▲ Hong-Kong China 50 528 9 50 533 6 5 ▲ -3 ▲ Romania 51 458 26 49 466 21 8 ▲ -5 ▲ Malaysia 47 466 22 53 475 18 9 ▲ -5 ▲ Bulgaria 53 464 27 47 477 21 12 ▲ -6 ▲ Israel 47 463 28 53 472 22 9 ▲ -6 ▲ Iran, Islamic Rep. 54 453 27 46 466 21 12 ▲ -6 ▲ Botswana 47 343 69 53 365 62 22 ▲ -7 ▲ Ghana 55 316 78 45 288 85 -29 ▼ 7 ▼ Egypt, Arab Rep. 51 400 49 49 417 42 17 ▲ -8 ▲ Cyprus 50 444 31 50 460 22 16 ▲ -9 ▲ Thailand 50 462 24 50 480 15 18 ▲ -9 ▲ Tunisia 48 455 18 52 436 27 -19 ▼ 10 ▼ Georgia 50 410 44 50 432 34 22 ▲ -10 ▲ El Salvador 48 399 52 52 377 63 -22 ▼ 12 ▼ Jordan 52 466 27 48 499 14 34 ▲ -12 ▲ Palestinian Nat'I Auth 49 386 54 51 422 39 36 ▲ -14 ▲ Qatar 50 284 79 50 354 63 70 ▲ -16 ▲ Colombia 49 435 32 51 400 49 -35 ▼ 17 ▼ Saudi Arabia 52 383 58 48 426 36 43 ▲ -22 ▲ Kuwait 46 391 53 54 441 29 49 ▲ -24 ▲ Bahrain 51 437 35 49 499 9 62 ▲ -26 ▲ Oman 48 391 53 52 452 25 61 ▲ -27 ▲
► Difference not statistically significant ▼ or ▲ Difference statistically significant. ▲ means that (b) is higher than (a), while ▼ means that (a) is higher than (b). Significance level: 10%. Because results are rounded to the nearest whole number, some totals may appear inconsistent.

66
Table E.4.a. TIMSS Average Mathematics Achievement by Langage Spoken at Home, Grade 4
Country
Speaks always or almost always
Speaks sometimes or never
Difference (b) - (a)
Test Mean Test Benchmark
% Mean %
Below 400
% Mean %
Below 400
Dif Sig Dif Sig
Hong-Kong China 82 614 0 18 576 1 -38 ▼ 0 ► Algeria 56 382 58 44 378 59 -5 ▼ 1 ► Tunisia 26 327 73 74 335 70 9 ▲ -3 ► Kuwait 74 322 77 26 321 80 -1 ► 3 ► Kazakhstan 93 548 5 7 561 2 12 ▲ -3 ► Yemen, Rep. 85 233 93 15 202 96 -31 ▼ 3 ► Armenia 95 501 13 5 484 17 -17 ▼ 5 ► Lithuania 98 531 5 2 503 11 -27 ▼ 6 ► Qatar 71 307 85 29 280 91 -28 ▼ 6 ► Georgia 92 442 31 8 417 43 -25 ▼ 12 ► Colombia 89 363 67 11 316 83 -47 ▼ 16 ► Chinese Tapei 84 582 1 16 546 2 -36 ▼ 1 ▼ Singapore 50 623 1 50 576 3 -48 ▼ 2 ▼ Netherlands 89 538 2 11 511 5 -27 ▼ 3 ▼ Latvia 88 540 3 12 516 7 -24 ▼ 4 ▼ Ukraine 74 466 22 26 482 16 16 ▲ -6 ▲ United States 87 535 4 13 490 11 -45 ▼ 7 ▼ Italy 96 508 9 4 483 16 -25 ▼ 7 ▼ Germany 92 532 3 8 486 12 -46 ▼ 8 ▼ Morocco 50 334 77 50 355 69 21 ▲ -8 ▲ Slovenia 90 506 7 10 470 16 -36 ▼ 9 ▼ Czech Republic 97 487 11 3 461 20 -26 ▼ 9 ▼ England 93 545 5 7 495 14 -50 ▼ 9 ▼ Scotland 91 498 11 9 457 20 -41 ▼ 9 ▼ Russian Federation 92 547 4 8 518 14 -29 ▼ 10 ▼ Austria 88 510 6 12 469 17 -41 ▼ 11 ▼ Sweden 92 506 6 8 467 17 -39 ▼ 11 ▼ Australia 90 519 7 10 489 20 -30 ▼ 13 ▼ Norway 94 476 16 6 438 29 -38 ▼ 13 ▼ El Salvador 93 336 76 7 285 90 -50 ▼ 14 ▼ Denmark 94 527 4 6 475 18 -52 ▼ 14 ▼ New Zealand 87 498 12 13 457 29 -41 ▼ 16 ▼ Slovak Republic 87 505 9 13 448 26 -56 ▼ 16 ▼ Mongolia 86 443 30 14 406 48 -37 ▼ 18 ▼ Japan 99 570 2 1 490 21 -79 ▼ 19 ▼ Hungary 98 512 11 2 433 34 -79 ▼ 23 ▼ Iran, Islamic Rep. 62 421 38 38 375 62 -46 ▼ 24 ▼
► Difference not statistically significant ▼ or ▲ Difference statistically significant. ▲ means that (b) is higher than (a), while ▼ means that (a) is higher than (b). Significance level: 10%. Because results are rounded to the nearest whole number, some totals may appear inconsistent.
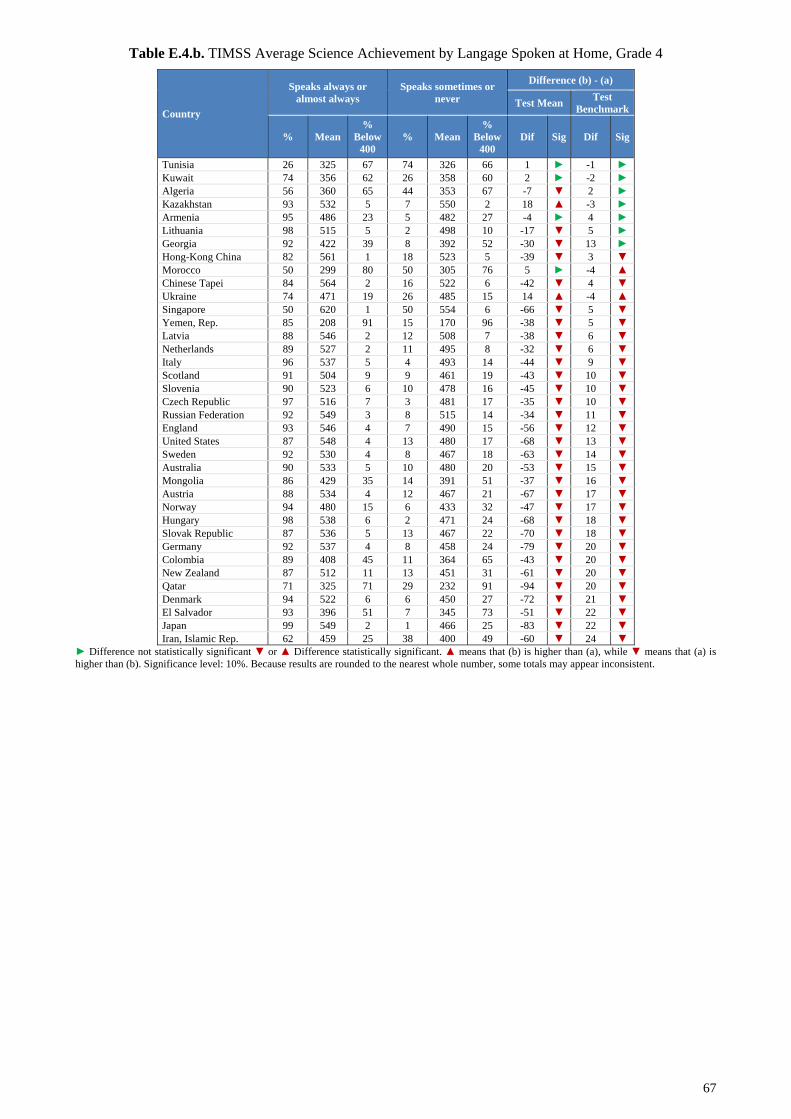
67
Table E.4.b. TIMSS Average Science Achievement by Langage Spoken at Home, Grade 4
Country
Speaks always or almost always
Speaks sometimes or never
Difference (b) - (a)
Test Mean Test Benchmark
% Mean %
Below 400
% Mean %
Below 400
Dif Sig Dif Sig
Tunisia 26 325 67 74 326 66 1 ► -1 ► Kuwait 74 356 62 26 358 60 2 ► -2 ► Algeria 56 360 65 44 353 67 -7 ▼ 2 ► Kazakhstan 93 532 5 7 550 2 18 ▲ -3 ► Armenia 95 486 23 5 482 27 -4 ► 4 ► Lithuania 98 515 5 2 498 10 -17 ▼ 5 ► Georgia 92 422 39 8 392 52 -30 ▼ 13 ► Hong-Kong China 82 561 1 18 523 5 -39 ▼ 3 ▼ Morocco 50 299 80 50 305 76 5 ► -4 ▲ Chinese Tapei 84 564 2 16 522 6 -42 ▼ 4 ▼ Ukraine 74 471 19 26 485 15 14 ▲ -4 ▲ Singapore 50 620 1 50 554 6 -66 ▼ 5 ▼ Yemen, Rep. 85 208 91 15 170 96 -38 ▼ 5 ▼ Latvia 88 546 2 12 508 7 -38 ▼ 6 ▼ Netherlands 89 527 2 11 495 8 -32 ▼ 6 ▼ Italy 96 537 5 4 493 14 -44 ▼ 9 ▼ Scotland 91 504 9 9 461 19 -43 ▼ 10 ▼ Slovenia 90 523 6 10 478 16 -45 ▼ 10 ▼ Czech Republic 97 516 7 3 481 17 -35 ▼ 10 ▼ Russian Federation 92 549 3 8 515 14 -34 ▼ 11 ▼ England 93 546 4 7 490 15 -56 ▼ 12 ▼ United States 87 548 4 13 480 17 -68 ▼ 13 ▼ Sweden 92 530 4 8 467 18 -63 ▼ 14 ▼ Australia 90 533 5 10 480 20 -53 ▼ 15 ▼ Mongolia 86 429 35 14 391 51 -37 ▼ 16 ▼ Austria 88 534 4 12 467 21 -67 ▼ 17 ▼ Norway 94 480 15 6 433 32 -47 ▼ 17 ▼ Hungary 98 538 6 2 471 24 -68 ▼ 18 ▼ Slovak Republic 87 536 5 13 467 22 -70 ▼ 18 ▼ Germany 92 537 4 8 458 24 -79 ▼ 20 ▼ Colombia 89 408 45 11 364 65 -43 ▼ 20 ▼ New Zealand 87 512 11 13 451 31 -61 ▼ 20 ▼ Qatar 71 325 71 29 232 91 -94 ▼ 20 ▼ Denmark 94 522 6 6 450 27 -72 ▼ 21 ▼ El Salvador 93 396 51 7 345 73 -51 ▼ 22 ▼ Japan 99 549 2 1 466 25 -83 ▼ 22 ▼ Iran, Islamic Rep. 62 459 25 38 400 49 -60 ▼ 24 ▼
► Difference not statistically significant ▼ or ▲ Difference statistically significant. ▲ means that (b) is higher than (a), while ▼ means that (a) is higher than (b). Significance level: 10%. Because results are rounded to the nearest whole number, some totals may appear inconsistent.
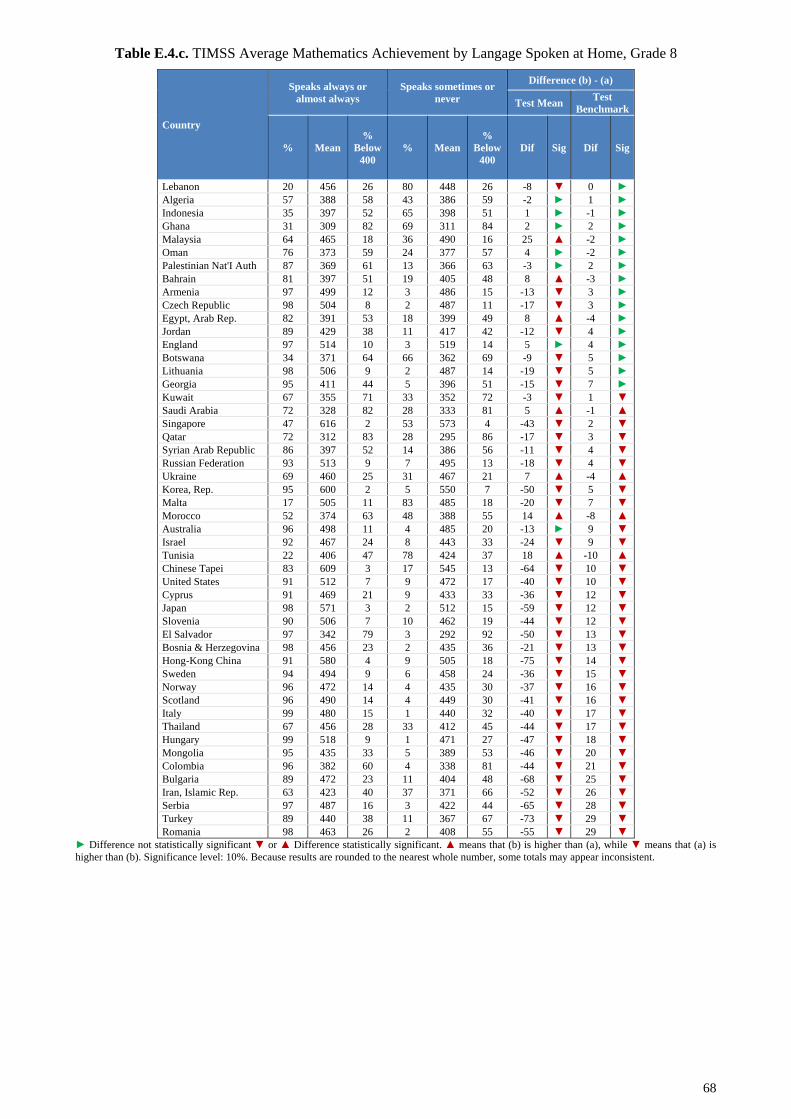
68
Table E.4.c. TIMSS Average Mathematics Achievement by Langage Spoken at Home, Grade 8
Country
Speaks always or almost always
Speaks sometimes or never
Difference (b) - (a)
Test Mean Test Benchmark
% Mean %
Below 400
% Mean %
Below 400
Dif Sig Dif Sig
Lebanon 20 456 26 80 448 26 -8 ▼ 0 ► Algeria 57 388 58 43 386 59 -2 ► 1 ► Indonesia 35 397 52 65 398 51 1 ► -1 ► Ghana 31 309 82 69 311 84 2 ► 2 ► Malaysia 64 465 18 36 490 16 25 ▲ -2 ► Oman 76 373 59 24 377 57 4 ► -2 ► Palestinian Nat'I Auth 87 369 61 13 366 63 -3 ► 2 ► Bahrain 81 397 51 19 405 48 8 ▲ -3 ► Armenia 97 499 12 3 486 15 -13 ▼ 3 ► Czech Republic 98 504 8 2 487 11 -17 ▼ 3 ► Egypt, Arab Rep. 82 391 53 18 399 49 8 ▲ -4 ► Jordan 89 429 38 11 417 42 -12 ▼ 4 ► England 97 514 10 3 519 14 5 ► 4 ► Botswana 34 371 64 66 362 69 -9 ▼ 5 ► Lithuania 98 506 9 2 487 14 -19 ▼ 5 ► Georgia 95 411 44 5 396 51 -15 ▼ 7 ► Kuwait 67 355 71 33 352 72 -3 ▼ 1 ▼ Saudi Arabia 72 328 82 28 333 81 5 ▲ -1 ▲ Singapore 47 616 2 53 573 4 -43 ▼ 2 ▼ Qatar 72 312 83 28 295 86 -17 ▼ 3 ▼ Syrian Arab Republic 86 397 52 14 386 56 -11 ▼ 4 ▼ Russian Federation 93 513 9 7 495 13 -18 ▼ 4 ▼ Ukraine 69 460 25 31 467 21 7 ▲ -4 ▲ Korea, Rep. 95 600 2 5 550 7 -50 ▼ 5 ▼ Malta 17 505 11 83 485 18 -20 ▼ 7 ▼ Morocco 52 374 63 48 388 55 14 ▲ -8 ▲ Australia 96 498 11 4 485 20 -13 ► 9 ▼ Israel 92 467 24 8 443 33 -24 ▼ 9 ▼ Tunisia 22 406 47 78 424 37 18 ▲ -10 ▲ Chinese Tapei 83 609 3 17 545 13 -64 ▼ 10 ▼ United States 91 512 7 9 472 17 -40 ▼ 10 ▼ Cyprus 91 469 21 9 433 33 -36 ▼ 12 ▼ Japan 98 571 3 2 512 15 -59 ▼ 12 ▼ Slovenia 90 506 7 10 462 19 -44 ▼ 12 ▼ El Salvador 97 342 79 3 292 92 -50 ▼ 13 ▼ Bosnia & Herzegovina 98 456 23 2 435 36 -21 ▼ 13 ▼ Hong-Kong China 91 580 4 9 505 18 -75 ▼ 14 ▼ Sweden 94 494 9 6 458 24 -36 ▼ 15 ▼ Norway 96 472 14 4 435 30 -37 ▼ 16 ▼ Scotland 96 490 14 4 449 30 -41 ▼ 16 ▼ Italy 99 480 15 1 440 32 -40 ▼ 17 ▼ Thailand 67 456 28 33 412 45 -44 ▼ 17 ▼ Hungary 99 518 9 1 471 27 -47 ▼ 18 ▼ Mongolia 95 435 33 5 389 53 -46 ▼ 20 ▼ Colombia 96 382 60 4 338 81 -44 ▼ 21 ▼ Bulgaria 89 472 23 11 404 48 -68 ▼ 25 ▼ Iran, Islamic Rep. 63 423 40 37 371 66 -52 ▼ 26 ▼ Serbia 97 487 16 3 422 44 -65 ▼ 28 ▼ Turkey 89 440 38 11 367 67 -73 ▼ 29 ▼ Romania 98 463 26 2 408 55 -55 ▼ 29 ▼
► Difference not statistically significant ▼ or ▲ Difference statistically significant. ▲ means that (b) is higher than (a), while ▼ means that (a) is higher than (b). Significance level: 10%. Because results are rounded to the nearest whole number, some totals may appear inconsistent.
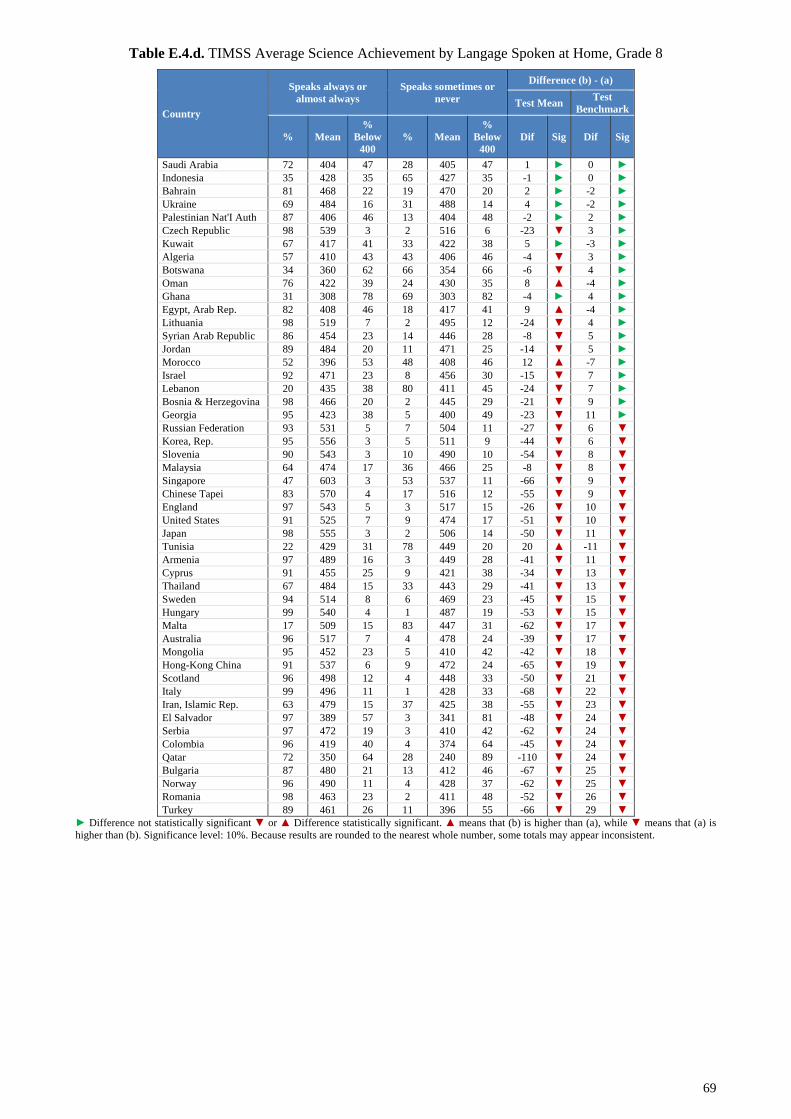
69
Table E.4.d. TIMSS Average Science Achievement by Langage Spoken at Home, Grade 8
Country
Speaks always or almost always
Speaks sometimes or never
Difference (b) - (a)
Test Mean Test Benchmark
% Mean %
Below 400
% Mean %
Below 400
Dif Sig Dif Sig
Saudi Arabia 72 404 47 28 405 47 1 ► 0 ► Indonesia 35 428 35 65 427 35 -1 ► 0 ► Bahrain 81 468 22 19 470 20 2 ► -2 ► Ukraine 69 484 16 31 488 14 4 ► -2 ► Palestinian Nat'I Auth 87 406 46 13 404 48 -2 ► 2 ► Czech Republic 98 539 3 2 516 6 -23 ▼ 3 ► Kuwait 67 417 41 33 422 38 5 ► -3 ► Algeria 57 410 43 43 406 46 -4 ▼ 3 ► Botswana 34 360 62 66 354 66 -6 ▼ 4 ► Oman 76 422 39 24 430 35 8 ▲ -4 ► Ghana 31 308 78 69 303 82 -4 ► 4 ► Egypt, Arab Rep. 82 408 46 18 417 41 9 ▲ -4 ► Lithuania 98 519 7 2 495 12 -24 ▼ 4 ► Syrian Arab Republic 86 454 23 14 446 28 -8 ▼ 5 ► Jordan 89 484 20 11 471 25 -14 ▼ 5 ► Morocco 52 396 53 48 408 46 12 ▲ -7 ► Israel 92 471 23 8 456 30 -15 ▼ 7 ► Lebanon 20 435 38 80 411 45 -24 ▼ 7 ► Bosnia & Herzegovina 98 466 20 2 445 29 -21 ▼ 9 ► Georgia 95 423 38 5 400 49 -23 ▼ 11 ► Russian Federation 93 531 5 7 504 11 -27 ▼ 6 ▼ Korea, Rep. 95 556 3 5 511 9 -44 ▼ 6 ▼ Slovenia 90 543 3 10 490 10 -54 ▼ 8 ▼ Malaysia 64 474 17 36 466 25 -8 ▼ 8 ▼ Singapore 47 603 3 53 537 11 -66 ▼ 9 ▼ Chinese Tapei 83 570 4 17 516 12 -55 ▼ 9 ▼ England 97 543 5 3 517 15 -26 ▼ 10 ▼ United States 91 525 7 9 474 17 -51 ▼ 10 ▼ Japan 98 555 3 2 506 14 -50 ▼ 11 ▼ Tunisia 22 429 31 78 449 20 20 ▲ -11 ▼ Armenia 97 489 16 3 449 28 -41 ▼ 11 ▼ Cyprus 91 455 25 9 421 38 -34 ▼ 13 ▼ Thailand 67 484 15 33 443 29 -41 ▼ 13 ▼ Sweden 94 514 8 6 469 23 -45 ▼ 15 ▼ Hungary 99 540 4 1 487 19 -53 ▼ 15 ▼ Malta 17 509 15 83 447 31 -62 ▼ 17 ▼ Australia 96 517 7 4 478 24 -39 ▼ 17 ▼ Mongolia 95 452 23 5 410 42 -42 ▼ 18 ▼ Hong-Kong China 91 537 6 9 472 24 -65 ▼ 19 ▼ Scotland 96 498 12 4 448 33 -50 ▼ 21 ▼ Italy 99 496 11 1 428 33 -68 ▼ 22 ▼ Iran, Islamic Rep. 63 479 15 37 425 38 -55 ▼ 23 ▼ El Salvador 97 389 57 3 341 81 -48 ▼ 24 ▼ Serbia 97 472 19 3 410 42 -62 ▼ 24 ▼ Colombia 96 419 40 4 374 64 -45 ▼ 24 ▼ Qatar 72 350 64 28 240 89 -110 ▼ 24 ▼ Bulgaria 87 480 21 13 412 46 -67 ▼ 25 ▼ Norway 96 490 11 4 428 37 -62 ▼ 25 ▼ Romania 98 463 23 2 411 48 -52 ▼ 26 ▼ Turkey 89 461 26 11 396 55 -66 ▼ 29 ▼
► Difference not statistically significant ▼ or ▲ Difference statistically significant. ▲ means that (b) is higher than (a), while ▼ means that (a) is higher than (b). Significance level: 10%. Because results are rounded to the nearest whole number, some totals may appear inconsistent.

70
Table E.5.a. TIMSS Average Mathematics Achievement by Location of School, Grade 4
Country
More than 100,001 (a) 15,001 to 100,000 3,001 to 15,000 Less than 3,000 (b) Difference (b) - (a)
Score % Below
400
Score % Below
400
Score % Below
400
Score % Below
400
Test Mean
Test Benchmark
% Mean % Mean % Mean % Mean Dif Sig Dif Sig
Armenia 30 499 13 14 502 11 29 483 16 27 516 12 17 ▲ 0 ►Sweden 19 503 8 37 506 6 25 501 7 19 497 8 -6 ► 0 ►United States 25 525 6 35 536 4 28 526 4 12 520 6 -5 ► 0 ►Denmark 14 521 6 30 525 4 31 526 4 25 523 5 1 ► -1 ►Algeria 30 367 63 31 391 54 20 376 60 19 368 62 1 ► -1 ►Italy 19 500 11 44 510 8 33 508 8 4 496 12 -4 ► 1 ►Chinese Tapei 61 585 0 36 560 2 1 545 3 2 554 2 -31 ▼ 1 ►Georgia 31 440 31 18 445 30 20 418 42 30 444 33 4 ► 2 ►Norway 25 494 11 32 466 20 37 464 20 6 473 14 -22 ▼ 3 ►New Zealand 43 498 14 26 482 18 15 495 13 16 496 11 -1 ▼ -3 ►Netherlands 20 521 4 60 538 1 15 538 1 5 529 1 7 ► -3 ►Australia 42 528 5 28 499 12 17 501 11 13 517 9 -11 ▼ 4 ►England 40 536 7 31 540 6 20 540 5 10 563 3 26 ▲ -4 ►Scotland 24 484 17 33 503 11 26 492 11 17 496 10 13 ▲ -7 ►Qatar 18 316 82 35 294 88 25 292 89 22 290 89 -26 ▼ 7 ►Kuwait 13 317 80 30 318 78 41 304 83 16 344 71 27 ▲ -10 ►Colombia 44 378 60 26 345 73 14 327 77 16 340 77 -38 ▼ 16 ►Yemen, Rep. 12 244 93 18 199 97 31 220 95 39 232 92 -12 ▼ -1 ▲Morocco 30 360 68 26 330 79 23 311 86 22 347 67 -13 ▼ -1 ▲Kazakhstan 28 533 5 17 544 4 28 577 2 26 541 9 8 ► 4 ▼Austria 25 497 11 7 504 7 34 510 5 34 506 7 9 ▲ -4 ▲Latvia 19 562 1 23 539 2 25 536 2 34 525 5 -37 ▼ 4 ▼Germany 26 517 6 32 525 3 26 531 4 15 532 2 14 ▲ -4 ▲Slovenia 13 515 7 13 506 8 48 503 7 26 491 11 -25 ▼ 5 ▼Slovak Republic 9 511 6 38 508 10 18 490 14 35 485 13 -25 ▼ 7 ▼Czech Republic 15 505 7 34 489 10 25 477 14 26 481 15 -24 ▼ 8 ▼Lithuania 35 551 3 19 533 4 21 527 4 26 502 12 -49 ▼ 9 ▼Russian Federation 38 562 2 24 544 4 13 537 5 24 518 11 -44 ▼ 9 ▼Hungary 19 533 9 34 535 6 24 497 13 23 467 22 -66 ▼ 14 ▼Ukraine 34 496 12 19 479 16 23 452 27 24 439 32 -57 ▼ 20 ▼Tunisia 18 358 62 19 355 63 33 332 71 31 285 85 -73 ▼ 22 ▼Iran, Islamic Rep. 40 425 37 15 421 36 13 382 57 32 373 63 -52 ▼ 26 ▼Mongolia 26 461 20 33 454 25 29 401 50 11 409 46 -52 ▼ 26 ▼El Salvador 16 391 51 19 343 75 26 334 79 40 297 88 -94 ▼ 38 ▼
► Difference not statistically significant ▼ or ▲ Difference statistically significant. ▲ means that (b) is higher than (a), while ▼ means that (a) is higher than (b). Significance level: 10%. Because results are rounded to the nearest whole number, some totals may appear inconsistent.
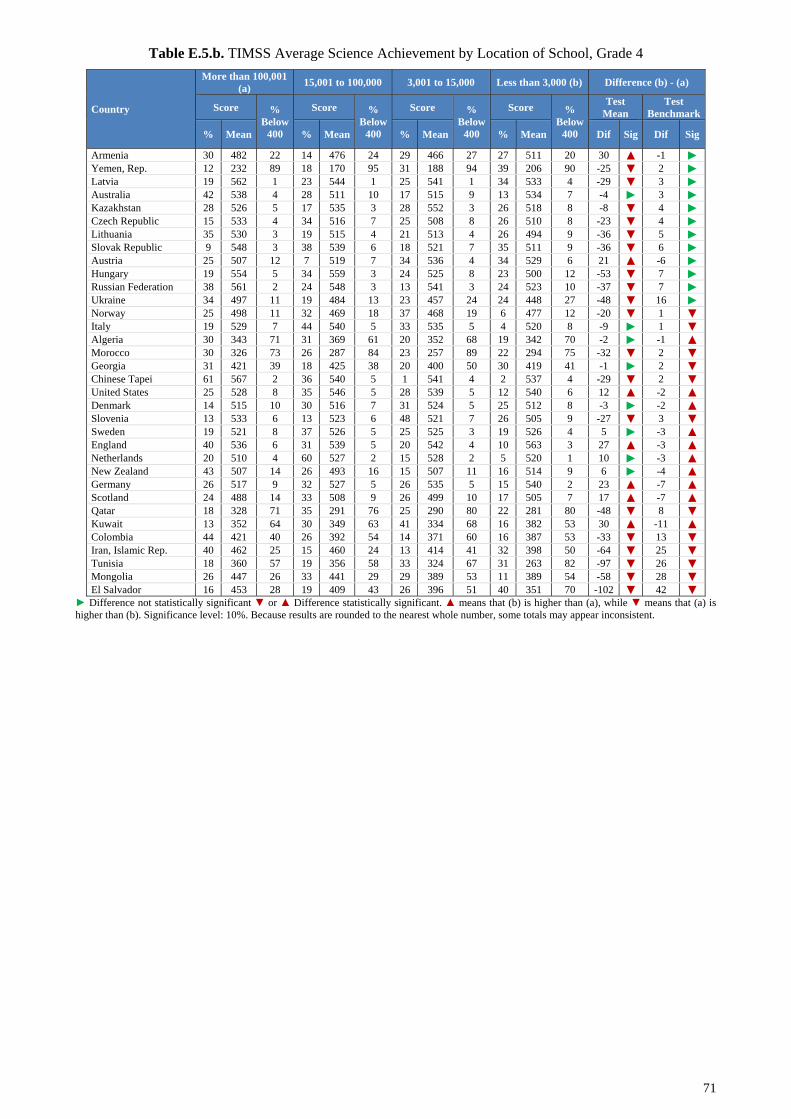
71
Table E.5.b. TIMSS Average Science Achievement by Location of School, Grade 4
Country
More than 100,001 (a) 15,001 to 100,000 3,001 to 15,000 Less than 3,000 (b) Difference (b) - (a)
Score % Below
400
Score % Below
400
Score % Below
400
Score % Below
400
Test Mean
Test Benchmark
% Mean % Mean % Mean % Mean Dif Sig Dif Sig
Armenia 30 482 22 14 476 24 29 466 27 27 511 20 30 ▲ -1 ►Yemen, Rep. 12 232 89 18 170 95 31 188 94 39 206 90 -25 ▼ 2 ►Latvia 19 562 1 23 544 1 25 541 1 34 533 4 -29 ▼ 3 ►Australia 42 538 4 28 511 10 17 515 9 13 534 7 -4 ► 3 ►Kazakhstan 28 526 5 17 535 3 28 552 3 26 518 8 -8 ▼ 4 ►Czech Republic 15 533 4 34 516 7 25 508 8 26 510 8 -23 ▼ 4 ►Lithuania 35 530 3 19 515 4 21 513 4 26 494 9 -36 ▼ 5 ►Slovak Republic 9 548 3 38 539 6 18 521 7 35 511 9 -36 ▼ 6 ►Austria 25 507 12 7 519 7 34 536 4 34 529 6 21 ▲ -6 ►Hungary 19 554 5 34 559 3 24 525 8 23 500 12 -53 ▼ 7 ►Russian Federation 38 561 2 24 548 3 13 541 3 24 523 10 -37 ▼ 7 ►Ukraine 34 497 11 19 484 13 23 457 24 24 448 27 -48 ▼ 16 ►Norway 25 498 11 32 469 18 37 468 19 6 477 12 -20 ▼ 1 ▼Italy 19 529 7 44 540 5 33 535 5 4 520 8 -9 ► 1 ▼Algeria 30 343 71 31 369 61 20 352 68 19 342 70 -2 ► -1 ▲Morocco 30 326 73 26 287 84 23 257 89 22 294 75 -32 ▼ 2 ▼Georgia 31 421 39 18 425 38 20 400 50 30 419 41 -1 ► 2 ▼Chinese Tapei 61 567 2 36 540 5 1 541 4 2 537 4 -29 ▼ 2 ▼United States 25 528 8 35 546 5 28 539 5 12 540 6 12 ▲ -2 ▲Denmark 14 515 10 30 516 7 31 524 5 25 512 8 -3 ► -2 ▲Slovenia 13 533 6 13 523 6 48 521 7 26 505 9 -27 ▼ 3 ▼Sweden 19 521 8 37 526 5 25 525 3 19 526 4 5 ► -3 ▲England 40 536 6 31 539 5 20 542 4 10 563 3 27 ▲ -3 ▲Netherlands 20 510 4 60 527 2 15 528 2 5 520 1 10 ► -3 ▲New Zealand 43 507 14 26 493 16 15 507 11 16 514 9 6 ► -4 ▲Germany 26 517 9 32 527 5 26 535 5 15 540 2 23 ▲ -7 ▲Scotland 24 488 14 33 508 9 26 499 10 17 505 7 17 ▲ -7 ▲Qatar 18 328 71 35 291 76 25 290 80 22 281 80 -48 ▼ 8 ▼Kuwait 13 352 64 30 349 63 41 334 68 16 382 53 30 ▲ -11 ▲Colombia 44 421 40 26 392 54 14 371 60 16 387 53 -33 ▼ 13 ▼Iran, Islamic Rep. 40 462 25 15 460 24 13 414 41 32 398 50 -64 ▼ 25 ▼Tunisia 18 360 57 19 356 58 33 324 67 31 263 82 -97 ▼ 26 ▼Mongolia 26 447 26 33 441 29 29 389 53 11 389 54 -58 ▼ 28 ▼El Salvador 16 453 28 19 409 43 26 396 51 40 351 70 -102 ▼ 42 ▼
► Difference not statistically significant ▼ or ▲ Difference statistically significant. ▲ means that (b) is higher than (a), while ▼ means that (a) is higher than (b). Significance level: 10%. Because results are rounded to the nearest whole number, some totals may appear inconsistent.
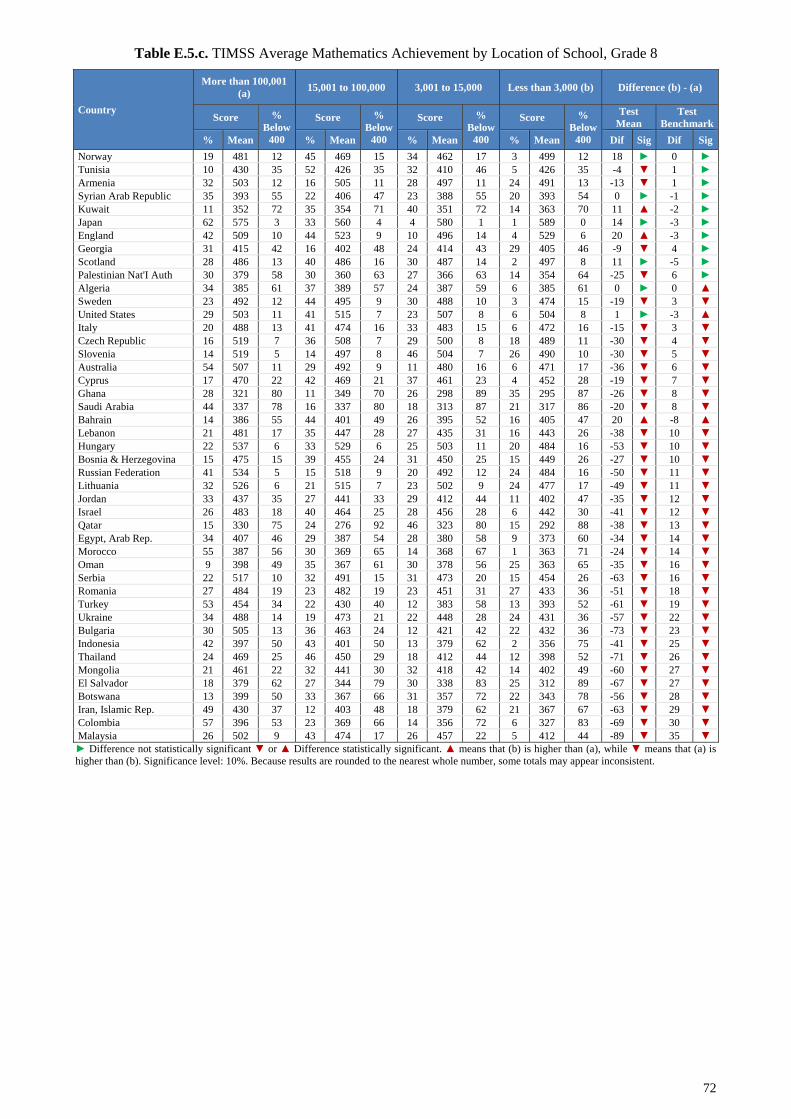
72
Table E.5.c. TIMSS Average Mathematics Achievement by Location of School, Grade 8
Country
More than 100,001 (a) 15,001 to 100,000 3,001 to 15,000 Less than 3,000 (b) Difference (b) - (a)
Score % Below
400
Score % Below
400
Score % Below
400
Score % Below
400
Test Mean
Test Benchmark
% Mean % Mean % Mean % Mean Dif Sig Dif Sig Norway 19 481 12 45 469 15 34 462 17 3 499 12 18 ► 0 ► Tunisia 10 430 35 52 426 35 32 410 46 5 426 35 -4 ▼ 1 ► Armenia 32 503 12 16 505 11 28 497 11 24 491 13 -13 ▼ 1 ► Syrian Arab Republic 35 393 55 22 406 47 23 388 55 20 393 54 0 ► -1 ► Kuwait 11 352 72 35 354 71 40 351 72 14 363 70 11 ▲ -2 ► Japan 62 575 3 33 560 4 4 580 1 1 589 0 14 ► -3 ► England 42 509 10 44 523 9 10 496 14 4 529 6 20 ▲ -3 ► Georgia 31 415 42 16 402 48 24 414 43 29 405 46 -9 ▼ 4 ► Scotland 28 486 13 40 486 16 30 487 14 2 497 8 11 ► -5 ► Palestinian Nat'I Auth 30 379 58 30 360 63 27 366 63 14 354 64 -25 ▼ 6 ► Algeria 34 385 61 37 389 57 24 387 59 6 385 61 0 ► 0 ▲ Sweden 23 492 12 44 495 9 30 488 10 3 474 15 -19 ▼ 3 ▼ United States 29 503 11 41 515 7 23 507 8 6 504 8 1 ► -3 ▲ Italy 20 488 13 41 474 16 33 483 15 6 472 16 -15 ▼ 3 ▼ Czech Republic 16 519 7 36 508 7 29 500 8 18 489 11 -30 ▼ 4 ▼ Slovenia 14 519 5 14 497 8 46 504 7 26 490 10 -30 ▼ 5 ▼ Australia 54 507 11 29 492 9 11 480 16 6 471 17 -36 ▼ 6 ▼ Cyprus 17 470 22 42 469 21 37 461 23 4 452 28 -19 ▼ 7 ▼ Ghana 28 321 80 11 349 70 26 298 89 35 295 87 -26 ▼ 8 ▼ Saudi Arabia 44 337 78 16 337 80 18 313 87 21 317 86 -20 ▼ 8 ▼ Bahrain 14 386 55 44 401 49 26 395 52 16 405 47 20 ▲ -8 ▲ Lebanon 21 481 17 35 447 28 27 435 31 16 443 26 -38 ▼ 10 ▼ Hungary 22 537 6 33 529 6 25 503 11 20 484 16 -53 ▼ 10 ▼ Bosnia & Herzegovina 15 475 15 39 455 24 31 450 25 15 449 26 -27 ▼ 10 ▼ Russian Federation 41 534 5 15 518 9 20 492 12 24 484 16 -50 ▼ 11 ▼ Lithuania 32 526 6 21 515 7 23 502 9 24 477 17 -49 ▼ 11 ▼ Jordan 33 437 35 27 441 33 29 412 44 11 402 47 -35 ▼ 12 ▼ Israel 26 483 18 40 464 25 28 456 28 6 442 30 -41 ▼ 12 ▼ Qatar 15 330 75 24 276 92 46 323 80 15 292 88 -38 ▼ 13 ▼ Egypt, Arab Rep. 34 407 46 29 387 54 28 380 58 9 373 60 -34 ▼ 14 ▼ Morocco 55 387 56 30 369 65 14 368 67 1 363 71 -24 ▼ 14 ▼ Oman 9 398 49 35 367 61 30 378 56 25 363 65 -35 ▼ 16 ▼ Serbia 22 517 10 32 491 15 31 473 20 15 454 26 -63 ▼ 16 ▼ Romania 27 484 19 23 482 19 23 451 31 27 433 36 -51 ▼ 18 ▼ Turkey 53 454 34 22 430 40 12 383 58 13 393 52 -61 ▼ 19 ▼ Ukraine 34 488 14 19 473 21 22 448 28 24 431 36 -57 ▼ 22 ▼ Bulgaria 30 505 13 36 463 24 12 421 42 22 432 36 -73 ▼ 23 ▼ Indonesia 42 397 50 43 401 50 13 379 62 2 356 75 -41 ▼ 25 ▼ Thailand 24 469 25 46 450 29 18 412 44 12 398 52 -71 ▼ 26 ▼ Mongolia 21 461 22 32 441 30 32 418 42 14 402 49 -60 ▼ 27 ▼ El Salvador 18 379 62 27 344 79 30 338 83 25 312 89 -67 ▼ 27 ▼ Botswana 13 399 50 33 367 66 31 357 72 22 343 78 -56 ▼ 28 ▼ Iran, Islamic Rep. 49 430 37 12 403 48 18 379 62 21 367 67 -63 ▼ 29 ▼ Colombia 57 396 53 23 369 66 14 356 72 6 327 83 -69 ▼ 30 ▼ Malaysia 26 502 9 43 474 17 26 457 22 5 412 44 -89 ▼ 35 ▼ ► Difference not statistically significant ▼ or ▲ Difference statistically significant. ▲ means that (b) is higher than (a), while ▼ means that (a) is higher than (b). Significance level: 10%. Because results are rounded to the nearest whole number, some totals may appear inconsistent.
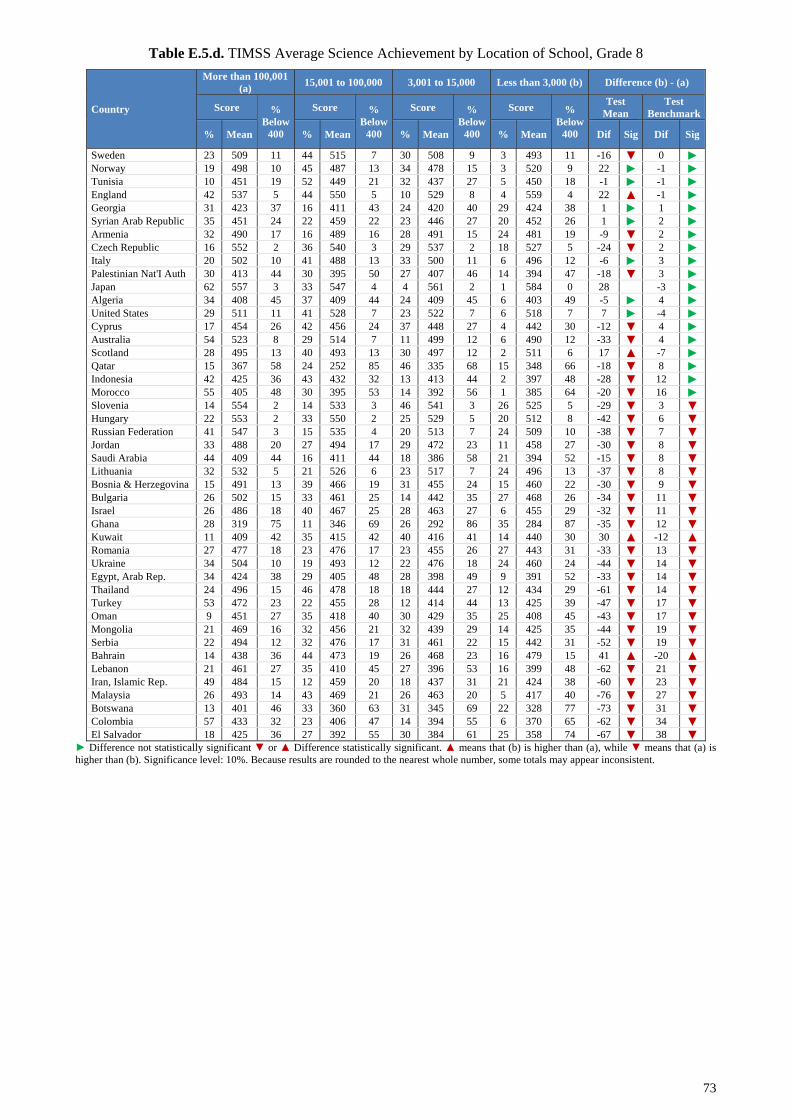
73
Table E.5.d. TIMSS Average Science Achievement by Location of School, Grade 8
Country
More than 100,001 (a) 15,001 to 100,000 3,001 to 15,000 Less than 3,000 (b) Difference (b) - (a)
Score % Below
400
Score % Below
400
Score % Below
400
Score % Below
400
Test Mean
Test Benchmark
% Mean % Mean % Mean % Mean Dif Sig Dif Sig
Sweden 23 509 11 44 515 7 30 508 9 3 493 11 -16 ▼ 0 ►Norway 19 498 10 45 487 13 34 478 15 3 520 9 22 ► -1 ►Tunisia 10 451 19 52 449 21 32 437 27 5 450 18 -1 ► -1 ►England 42 537 5 44 550 5 10 529 8 4 559 4 22 ▲ -1 ►Georgia 31 423 37 16 411 43 24 420 40 29 424 38 1 ► 1 ►Syrian Arab Republic 35 451 24 22 459 22 23 446 27 20 452 26 1 ► 2 ►Armenia 32 490 17 16 489 16 28 491 15 24 481 19 -9 ▼ 2 ►Czech Republic 16 552 2 36 540 3 29 537 2 18 527 5 -24 ▼ 2 ►Italy 20 502 10 41 488 13 33 500 11 6 496 12 -6 ► 3 ►Palestinian Nat'I Auth 30 413 44 30 395 50 27 407 46 14 394 47 -18 ▼ 3 ►Japan 62 557 3 33 547 4 4 561 2 1 584 0 28 -3 ►Algeria 34 408 45 37 409 44 24 409 45 6 403 49 -5 ► 4 ►United States 29 511 11 41 528 7 23 522 7 6 518 7 7 ► -4 ►Cyprus 17 454 26 42 456 24 37 448 27 4 442 30 -12 ▼ 4 ►Australia 54 523 8 29 514 7 11 499 12 6 490 12 -33 ▼ 4 ►Scotland 28 495 13 40 493 13 30 497 12 2 511 6 17 ▲ -7 ►Qatar 15 367 58 24 252 85 46 335 68 15 348 66 -18 ▼ 8 ►Indonesia 42 425 36 43 432 32 13 413 44 2 397 48 -28 ▼ 12 ►Morocco 55 405 48 30 395 53 14 392 56 1 385 64 -20 ▼ 16 ►Slovenia 14 554 2 14 533 3 46 541 3 26 525 5 -29 ▼ 3 ▼Hungary 22 553 2 33 550 2 25 529 5 20 512 8 -42 ▼ 6 ▼Russian Federation 41 547 3 15 535 4 20 513 7 24 509 10 -38 ▼ 7 ▼Jordan 33 488 20 27 494 17 29 472 23 11 458 27 -30 ▼ 8 ▼Saudi Arabia 44 409 44 16 411 44 18 386 58 21 394 52 -15 ▼ 8 ▼Lithuania 32 532 5 21 526 6 23 517 7 24 496 13 -37 ▼ 8 ▼Bosnia & Herzegovina 15 491 13 39 466 19 31 455 24 15 460 22 -30 ▼ 9 ▼Bulgaria 26 502 15 33 461 25 14 442 35 27 468 26 -34 ▼ 11 ▼Israel 26 486 18 40 467 25 28 463 27 6 455 29 -32 ▼ 11 ▼Ghana 28 319 75 11 346 69 26 292 86 35 284 87 -35 ▼ 12 ▼Kuwait 11 409 42 35 415 42 40 416 41 14 440 30 30 ▲ -12 ▲Romania 27 477 18 23 476 17 23 455 26 27 443 31 -33 ▼ 13 ▼Ukraine 34 504 10 19 493 12 22 476 18 24 460 24 -44 ▼ 14 ▼Egypt, Arab Rep. 34 424 38 29 405 48 28 398 49 9 391 52 -33 ▼ 14 ▼Thailand 24 496 15 46 478 18 18 444 27 12 434 29 -61 ▼ 14 ▼Turkey 53 472 23 22 455 28 12 414 44 13 425 39 -47 ▼ 17 ▼Oman 9 451 27 35 418 40 30 429 35 25 408 45 -43 ▼ 17 ▼Mongolia 21 469 16 32 456 21 32 439 29 14 425 35 -44 ▼ 19 ▼Serbia 22 494 12 32 476 17 31 461 22 15 442 31 -52 ▼ 19 ▼Bahrain 14 438 36 44 473 19 26 468 23 16 479 15 41 ▲ -20 ▲Lebanon 21 461 27 35 410 45 27 396 53 16 399 48 -62 ▼ 21 ▼Iran, Islamic Rep. 49 484 15 12 459 20 18 437 31 21 424 38 -60 ▼ 23 ▼Malaysia 26 493 14 43 469 21 26 463 20 5 417 40 -76 ▼ 27 ▼Botswana 13 401 46 33 360 63 31 345 69 22 328 77 -73 ▼ 31 ▼Colombia 57 433 32 23 406 47 14 394 55 6 370 65 -62 ▼ 34 ▼El Salvador 18 425 36 27 392 55 30 384 61 25 358 74 -67 ▼ 38 ▼
► Difference not statistically significant ▼ or ▲ Difference statistically significant. ▲ means that (b) is higher than (a), while ▼ means that (a) is higher than (b). Significance level: 10%. Because results are rounded to the nearest whole number, some totals may appear inconsistent.

74
Table E.6.a. TIMSS Average Mathematics Achievement by Country of Birth, Grade 4
Country
Pupil born in the country of test (a)
Pupil born in another country (b)
Difference (b) - (a)
Test Mean Test Benchmark
% Mean %
Below 400
% Mean %
Below 400
Dif Sig Dif Sig
Hong-Kong China 75 610 0 25 598 1 -12 ▼ 1 ► Kazakhstan 93 550 5 7 546 6 -4 ► 1 ► Singapore 90 597 2 10 624 1 27 ▲ -1 ► Yemen, Rep. 56 237 92 44 218 95 -19 ▼ 4 ► Japan 99 569 2 1 547 6 -22 ► 4 ► Iran, Islamic Rep. 98 404 47 2 391 54 -13 ► 7 ► Algeria 84 383 57 16 363 65 -19 ▼ 8 ► Morocco 88 347 72 12 316 84 -31 ▼ 12 ► Chinese Tapei 77 588 0 23 535 4 -53 ▼ 3 ▼ Netherlands 82 542 1 18 505 6 -37 ▼ 5 ▼ Armenia 70 503 11 30 498 17 -4 ► 7 ▼ Germany 90 533 3 10 484 11 -49 ▼ 8 ▼ Italy 95 508 8 5 480 17 -28 ▼ 9 ▼ Denmark 90 528 4 10 488 13 -40 ▼ 9 ▼ Qatar 42 324 81 58 284 90 -40 ▼ 10 ▼ Russian Federation 93 548 4 7 498 15 -50 ▼ 11 ▼ Norway 95 478 15 5 447 27 -31 ▼ 12 ▼ Australia 84 523 6 16 486 18 -37 ▼ 12 ▼ Tunisia 88 336 69 12 305 81 -32 ▼ 12 ▼ Latvia 92 543 2 8 480 14 -63 ▼ 12 ▼ United States 81 542 2 19 479 15 -63 ▼ 12 ▼ Kuwait 59 341 72 41 293 86 -48 ▼ 13 ▼ El Salvador 72 342 73 28 306 87 -36 ▼ 13 ▼ Sweden 89 508 5 11 467 19 -41 ▼ 14 ▼ England 86 551 4 14 486 18 -65 ▼ 15 ▼ Colombia 81 364 65 19 334 80 -30 ▼ 15 ▼ Austria 84 514 5 16 461 20 -53 ▼ 15 ▼ New Zealand 74 504 10 26 465 27 -38 ▼ 17 ▼ Slovenia 88 509 6 12 456 23 -53 ▼ 17 ▼ Czech Republic 96 489 11 4 437 32 -51 ▼ 21 ▼ Lithuania 92 537 4 8 454 25 -82 ▼ 21 ▼ Mongolia 63 456 24 37 405 47 -51 ▼ 23 ▼ Scotland 87 504 9 13 434 35 -70 ▼ 26 ▼ Ukraine 87 479 16 13 417 43 -63 ▼ 27 ▼ Georgia 86 450 28 14 388 57 -62 ▼ 29 ▼ Hungary 93 518 9 7 423 39 -95 ▼ 30 ▼ Slovak Republic 97 500 10 3 409 45 -92 ▼ 35 ▼
► Difference not statistically significant ▼ or ▲ Difference statistically significant. ▲ means that (b) is higher than (a), while ▼ means that (a) is higher than (b). Significance level: 10%. Because results are rounded to the nearest whole number, some totals may appear inconsistent.
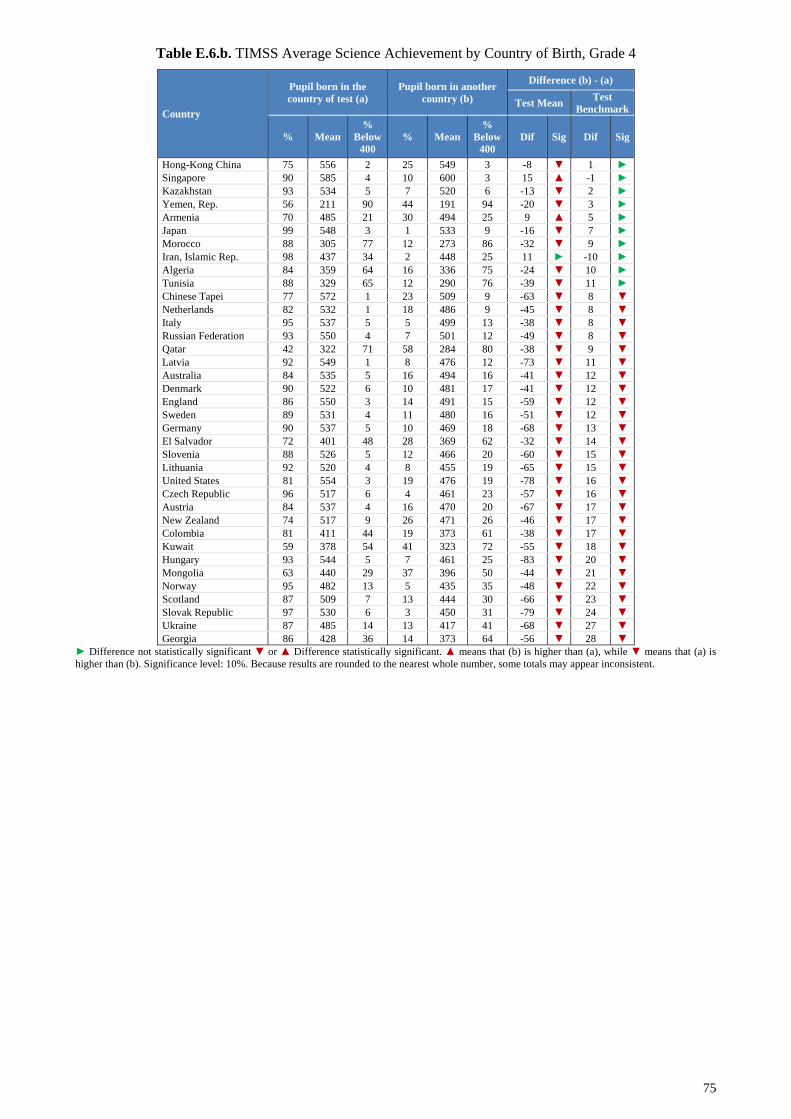
75
Table E.6.b. TIMSS Average Science Achievement by Country of Birth, Grade 4
Country
Pupil born in the country of test (a)
Pupil born in another country (b)
Difference (b) - (a)
Test Mean Test Benchmark
% Mean %
Below 400
% Mean %
Below 400
Dif Sig Dif Sig
Hong-Kong China 75 556 2 25 549 3 -8 ▼ 1 ► Singapore 90 585 4 10 600 3 15 ▲ -1 ► Kazakhstan 93 534 5 7 520 6 -13 ▼ 2 ► Yemen, Rep. 56 211 90 44 191 94 -20 ▼ 3 ► Armenia 70 485 21 30 494 25 9 ▲ 5 ► Japan 99 548 3 1 533 9 -16 ▼ 7 ► Morocco 88 305 77 12 273 86 -32 ▼ 9 ► Iran, Islamic Rep. 98 437 34 2 448 25 11 ► -10 ► Algeria 84 359 64 16 336 75 -24 ▼ 10 ► Tunisia 88 329 65 12 290 76 -39 ▼ 11 ► Chinese Tapei 77 572 1 23 509 9 -63 ▼ 8 ▼ Netherlands 82 532 1 18 486 9 -45 ▼ 8 ▼ Italy 95 537 5 5 499 13 -38 ▼ 8 ▼ Russian Federation 93 550 4 7 501 12 -49 ▼ 8 ▼ Qatar 42 322 71 58 284 80 -38 ▼ 9 ▼ Latvia 92 549 1 8 476 12 -73 ▼ 11 ▼ Australia 84 535 5 16 494 16 -41 ▼ 12 ▼ Denmark 90 522 6 10 481 17 -41 ▼ 12 ▼ England 86 550 3 14 491 15 -59 ▼ 12 ▼ Sweden 89 531 4 11 480 16 -51 ▼ 12 ▼ Germany 90 537 5 10 469 18 -68 ▼ 13 ▼ El Salvador 72 401 48 28 369 62 -32 ▼ 14 ▼ Slovenia 88 526 5 12 466 20 -60 ▼ 15 ▼ Lithuania 92 520 4 8 455 19 -65 ▼ 15 ▼ United States 81 554 3 19 476 19 -78 ▼ 16 ▼ Czech Republic 96 517 6 4 461 23 -57 ▼ 16 ▼ Austria 84 537 4 16 470 20 -67 ▼ 17 ▼ New Zealand 74 517 9 26 471 26 -46 ▼ 17 ▼ Colombia 81 411 44 19 373 61 -38 ▼ 17 ▼ Kuwait 59 378 54 41 323 72 -55 ▼ 18 ▼ Hungary 93 544 5 7 461 25 -83 ▼ 20 ▼ Mongolia 63 440 29 37 396 50 -44 ▼ 21 ▼ Norway 95 482 13 5 435 35 -48 ▼ 22 ▼ Scotland 87 509 7 13 444 30 -66 ▼ 23 ▼ Slovak Republic 97 530 6 3 450 31 -79 ▼ 24 ▼ Ukraine 87 485 14 13 417 41 -68 ▼ 27 ▼ Georgia 86 428 36 14 373 64 -56 ▼ 28 ▼
► Difference not statistically significant ▼ or ▲ Difference statistically significant. ▲ means that (b) is higher than (a), while ▼ means that (a) is higher than (b). Significance level: 10%. Because results are rounded to the nearest whole number, some totals may appear inconsistent.
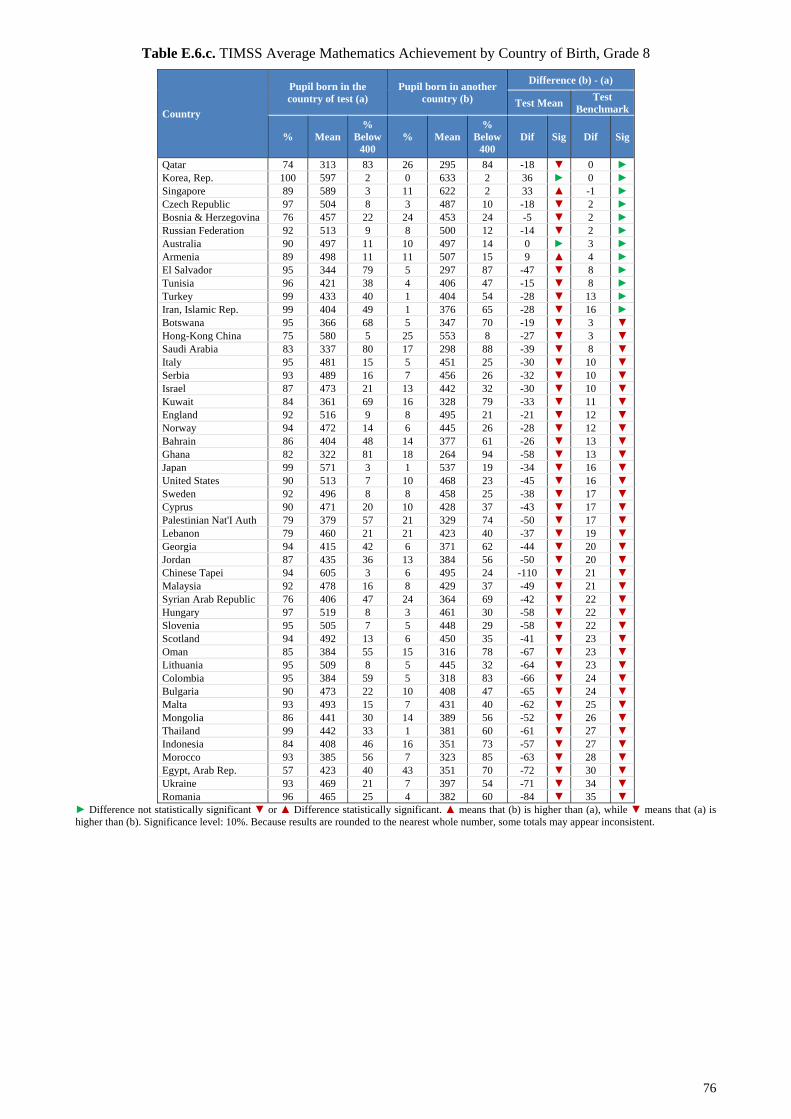
76
Table E.6.c. TIMSS Average Mathematics Achievement by Country of Birth, Grade 8
Country
Pupil born in the country of test (a)
Pupil born in another country (b)
Difference (b) - (a)
Test Mean Test Benchmark
% Mean %
Below 400
% Mean %
Below 400
Dif Sig Dif Sig
Qatar 74 313 83 26 295 84 -18 ▼ 0 ► Korea, Rep. 100 597 2 0 633 2 36 ► 0 ► Singapore 89 589 3 11 622 2 33 ▲ -1 ► Czech Republic 97 504 8 3 487 10 -18 ▼ 2 ► Bosnia & Herzegovina 76 457 22 24 453 24 -5 ▼ 2 ► Russian Federation 92 513 9 8 500 12 -14 ▼ 2 ► Australia 90 497 11 10 497 14 0 ► 3 ► Armenia 89 498 11 11 507 15 9 ▲ 4 ► El Salvador 95 344 79 5 297 87 -47 ▼ 8 ► Tunisia 96 421 38 4 406 47 -15 ▼ 8 ► Turkey 99 433 40 1 404 54 -28 ▼ 13 ► Iran, Islamic Rep. 99 404 49 1 376 65 -28 ▼ 16 ► Botswana 95 366 68 5 347 70 -19 ▼ 3 ▼ Hong-Kong China 75 580 5 25 553 8 -27 ▼ 3 ▼ Saudi Arabia 83 337 80 17 298 88 -39 ▼ 8 ▼ Italy 95 481 15 5 451 25 -30 ▼ 10 ▼ Serbia 93 489 16 7 456 26 -32 ▼ 10 ▼ Israel 87 473 21 13 442 32 -30 ▼ 10 ▼ Kuwait 84 361 69 16 328 79 -33 ▼ 11 ▼ England 92 516 9 8 495 21 -21 ▼ 12 ▼ Norway 94 472 14 6 445 26 -28 ▼ 12 ▼ Bahrain 86 404 48 14 377 61 -26 ▼ 13 ▼ Ghana 82 322 81 18 264 94 -58 ▼ 13 ▼ Japan 99 571 3 1 537 19 -34 ▼ 16 ▼ United States 90 513 7 10 468 23 -45 ▼ 16 ▼ Sweden 92 496 8 8 458 25 -38 ▼ 17 ▼ Cyprus 90 471 20 10 428 37 -43 ▼ 17 ▼ Palestinian Nat'I Auth 79 379 57 21 329 74 -50 ▼ 17 ▼ Lebanon 79 460 21 21 423 40 -37 ▼ 19 ▼ Georgia 94 415 42 6 371 62 -44 ▼ 20 ▼ Jordan 87 435 36 13 384 56 -50 ▼ 20 ▼ Chinese Tapei 94 605 3 6 495 24 -110 ▼ 21 ▼ Malaysia 92 478 16 8 429 37 -49 ▼ 21 ▼ Syrian Arab Republic 76 406 47 24 364 69 -42 ▼ 22 ▼ Hungary 97 519 8 3 461 30 -58 ▼ 22 ▼ Slovenia 95 505 7 5 448 29 -58 ▼ 22 ▼ Scotland 94 492 13 6 450 35 -41 ▼ 23 ▼ Oman 85 384 55 15 316 78 -67 ▼ 23 ▼ Lithuania 95 509 8 5 445 32 -64 ▼ 23 ▼ Colombia 95 384 59 5 318 83 -66 ▼ 24 ▼ Bulgaria 90 473 22 10 408 47 -65 ▼ 24 ▼ Malta 93 493 15 7 431 40 -62 ▼ 25 ▼ Mongolia 86 441 30 14 389 56 -52 ▼ 26 ▼ Thailand 99 442 33 1 381 60 -61 ▼ 27 ▼ Indonesia 84 408 46 16 351 73 -57 ▼ 27 ▼ Morocco 93 385 56 7 323 85 -63 ▼ 28 ▼ Egypt, Arab Rep. 57 423 40 43 351 70 -72 ▼ 30 ▼ Ukraine 93 469 21 7 397 54 -71 ▼ 34 ▼ Romania 96 465 25 4 382 60 -84 ▼ 35 ▼
► Difference not statistically significant ▼ or ▲ Difference statistically significant. ▲ means that (b) is higher than (a), while ▼ means that (a) is higher than (b). Significance level: 10%. Because results are rounded to the nearest whole number, some totals may appear inconsistent.

77
Table E.6.d. TIMSS Average Science Achievement by Country of Birth, Grade 8
Country
Pupil born in the country of test (a)
Pupil born in another country (b)
Difference (b) - (a)
Test Mean Test Benchmark
% Mean %
Below 400
% Mean %
Below 400
Dif Sig Dif Sig
Bosnia & Herzegovina 76 467 20 24 465 21 -1 ► 1 ► Qatar 74 324 70 26 314 72 -10 ▼ 1 ► Singapore 89 566 8 11 583 6 17 ▲ -2 ► Korea, Rep. 100 553 3 0 605 5 52 ▼ 2 ► Russian Federation 92 531 5 8 516 7 -15 ▼ 2 ► Armenia 89 487 16 11 503 19 16 ▲ 3 ► Iran, Islamic Rep. 99 459 24 1 444 33 -15 ► 10 ► Hong-Kong China 75 535 6 25 518 10 -17 ▼ 4 ▼ Czech Republic 97 540 3 3 510 8 -30 ▼ 5 ▼ Australia 90 516 7 10 508 14 -9 ▼ 7 ▼ Botswana 95 358 64 5 316 71 -42 ▼ 7 ▼ Italy 95 497 11 5 463 20 -33 ▼ 9 ▼ England 92 545 5 8 514 16 -31 ▼ 11 ▼ Israel 87 477 21 13 444 32 -34 ▼ 11 ▼ Serbia 93 474 18 7 440 31 -33 ▼ 13 ▼ Cyprus 90 455 24 10 426 38 -29 ▼ 14 ▼ Hungary 97 541 4 3 485 18 -56 ▼ 14 ▼ Slovenia 95 541 3 5 484 17 -57 ▼ 14 ▼ Tunisia 96 446 22 4 424 37 -22 ▼ 15 ▼ United States 90 526 6 10 473 22 -53 ▼ 15 ▼ Ghana 82 318 78 18 248 93 -71 ▼ 15 ▼ Sweden 92 516 7 8 465 24 -51 ▼ 17 ▼ Norway 94 491 11 6 448 28 -43 ▼ 17 ▼ Japan 99 555 3 1 510 21 -45 ▼ 17 ▼ Bulgaria 88 479 21 12 424 40 -56 ▼ 18 ▼ Turkey 99 455 28 1 427 47 -28 ▼ 19 ▼ Lebanon 79 427 39 21 384 58 -43 ▼ 19 ▼ Lithuania 95 522 7 5 458 27 -64 ▼ 20 ▼ Jordan 87 491 17 13 433 39 -58 ▼ 22 ▼ Scotland 94 500 11 6 455 32 -45 ▼ 22 ▼ Bahrain 86 475 18 14 435 40 -40 ▼ 22 ▼ Kuwait 84 427 36 16 383 57 -44 ▼ 22 ▼ Malta 93 462 27 7 408 49 -53 ▼ 22 ▼ Syrian Arab Republic 76 464 18 24 418 40 -46 ▼ 22 ▼ El Salvador 95 391 56 5 345 78 -46 ▼ 22 ▼ Palestinian Nat'I Auth 79 418 41 21 358 64 -60 ▼ 23 ▼ Morocco 93 406 48 7 357 71 -49 ▼ 24 ▼ Saudi Arabia 83 412 43 17 366 67 -46 ▼ 24 ▼ Chinese Tapei 94 567 4 6 473 27 -94 ▼ 24 ▼ Mongolia 86 458 20 14 410 44 -48 ▼ 24 ▼ Romania 96 465 22 4 398 49 -67 ▼ 27 ▼ Georgia 94 427 35 6 371 63 -57 ▼ 28 ▼ Indonesia 84 437 30 16 383 60 -54 ▼ 30 ▼ Thailand 99 471 20 1 415 49 -57 ▼ 30 ▼ Oman 85 434 33 15 367 64 -67 ▼ 30 ▼ Ukraine 93 491 13 7 420 43 -72 ▼ 31 ▼ Malaysia 92 477 17 8 397 48 -81 ▼ 31 ▼ Colombia 95 421 39 5 358 71 -63 ▼ 33 ▼ Egypt, Arab Rep. 57 442 31 43 367 64 -76 ▼ 33 ▼
► Difference not statistically significant ▼ or ▲ Difference statistically significant. ▲ means that (b) is higher than (a), while ▼ means that (a) is higher than (b). Significance level: 10%. Because results are rounded to the nearest whole number, some totals may appear inconsistent.
78
ANNEX F
Synthesis of Univariate Analysis
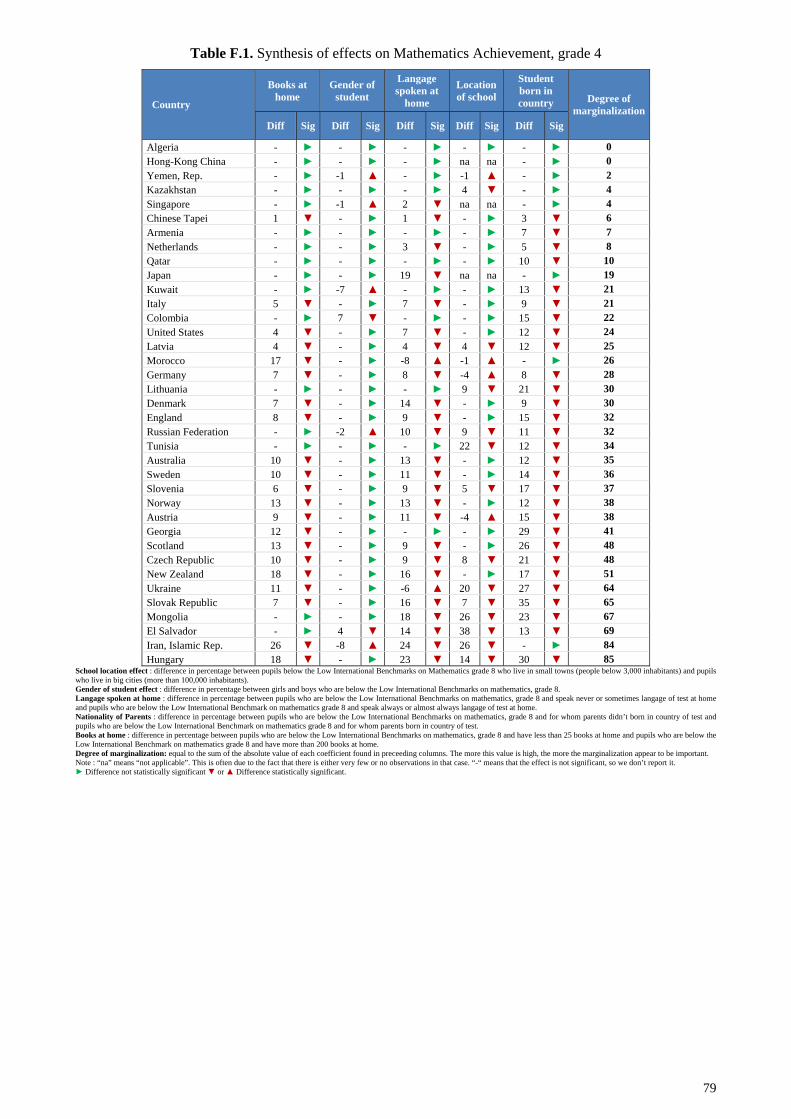
79
Table F.1. Synthesis of effects on Mathematics Achievement, grade 4
Country
Books at home
Gender of student
Langage spoken at
home
Location of school
Student born in country Degree of
marginalization Diff Sig Diff Sig Diff Sig Diff Sig Diff Sig
Algeria - ► - ► - ► - ► - ► 0 Hong-Kong China - ► - ► - ► na na - ► 0 Yemen, Rep. - ► -1 ▲ - ► -1 ▲ - ► 2 Kazakhstan - ► - ► - ► 4 ▼ - ► 4 Singapore - ► -1 ▲ 2 ▼ na na - ► 4 Chinese Tapei 1 ▼ - ► 1 ▼ - ► 3 ▼ 6 Armenia - ► - ► - ► - ► 7 ▼ 7 Netherlands - ► - ► 3 ▼ - ► 5 ▼ 8 Qatar - ► - ► - ► - ► 10 ▼ 10 Japan - ► - ► 19 ▼ na na - ► 19 Kuwait - ► -7 ▲ - ► - ► 13 ▼ 21 Italy 5 ▼ - ► 7 ▼ - ► 9 ▼ 21 Colombia - ► 7 ▼ - ► - ► 15 ▼ 22 United States 4 ▼ - ► 7 ▼ - ► 12 ▼ 24 Latvia 4 ▼ - ► 4 ▼ 4 ▼ 12 ▼ 25 Morocco 17 ▼ - ► -8 ▲ -1 ▲ - ► 26 Germany 7 ▼ - ► 8 ▼ -4 ▲ 8 ▼ 28 Lithuania - ► - ► - ► 9 ▼ 21 ▼ 30 Denmark 7 ▼ - ► 14 ▼ - ► 9 ▼ 30 England 8 ▼ - ► 9 ▼ - ► 15 ▼ 32 Russian Federation - ► -2 ▲ 10 ▼ 9 ▼ 11 ▼ 32 Tunisia - ► - ► - ► 22 ▼ 12 ▼ 34 Australia 10 ▼ - ► 13 ▼ - ► 12 ▼ 35 Sweden 10 ▼ - ► 11 ▼ - ► 14 ▼ 36 Slovenia 6 ▼ - ► 9 ▼ 5 ▼ 17 ▼ 37 Norway 13 ▼ - ► 13 ▼ - ► 12 ▼ 38 Austria 9 ▼ - ► 11 ▼ -4 ▲ 15 ▼ 38 Georgia 12 ▼ - ► - ► - ► 29 ▼ 41 Scotland 13 ▼ - ► 9 ▼ - ► 26 ▼ 48 Czech Republic 10 ▼ - ► 9 ▼ 8 ▼ 21 ▼ 48 New Zealand 18 ▼ - ► 16 ▼ - ► 17 ▼ 51 Ukraine 11 ▼ - ► -6 ▲ 20 ▼ 27 ▼ 64 Slovak Republic 7 ▼ - ► 16 ▼ 7 ▼ 35 ▼ 65 Mongolia - ► - ► 18 ▼ 26 ▼ 23 ▼ 67 El Salvador - ► 4 ▼ 14 ▼ 38 ▼ 13 ▼ 69 Iran, Islamic Rep. 26 ▼ -8 ▲ 24 ▼ 26 ▼ - ► 84 Hungary 18 ▼ - ► 23 ▼ 14 ▼ 30 ▼ 85
School location effect : difference in percentage between pupils below the Low International Benchmarks on Mathematics grade 8 who live in small towns (people below 3,000 inhabitants) and pupils who live in big cities (more than 100,000 inhabitants). Gender of student effect : difference in percentage between girls and boys who are below the Low International Benchmarks on mathematics, grade 8. Langage spoken at home : difference in percentage between pupils who are below the Low International Benchmarks on mathematics, grade 8 and speak never or sometimes langage of test at home and pupils who are below the Low International Benchmark on mathematics grade 8 and speak always or almost always langage of test at home. Nationality of Parents : difference in percentage between pupils who are below the Low International Benchmarks on mathematics, grade 8 and for whom parents didn’t born in country of test and pupils who are below the Low International Benchmark on mathematics grade 8 and for whom parents born in country of test. Books at home : difference in percentage between pupils who are below the Low International Benchmarks on mathematics, grade 8 and have less than 25 books at home and pupils who are below the Low International Benchmark on mathematics grade 8 and have more than 200 books at home. Degree of marginalization: equal to the sum of the absolute value of each coefficient found in preceeding columns. The more this value is high, the more the marginalization appear to be important. Note : “na” means “not applicable”. This is often due to the fact that there is either very few or no observations in that case. “-“ means that the effect is not significant, so we don’t report it. ► Difference not statistically significant ▼ or ▲ Difference statistically significant.
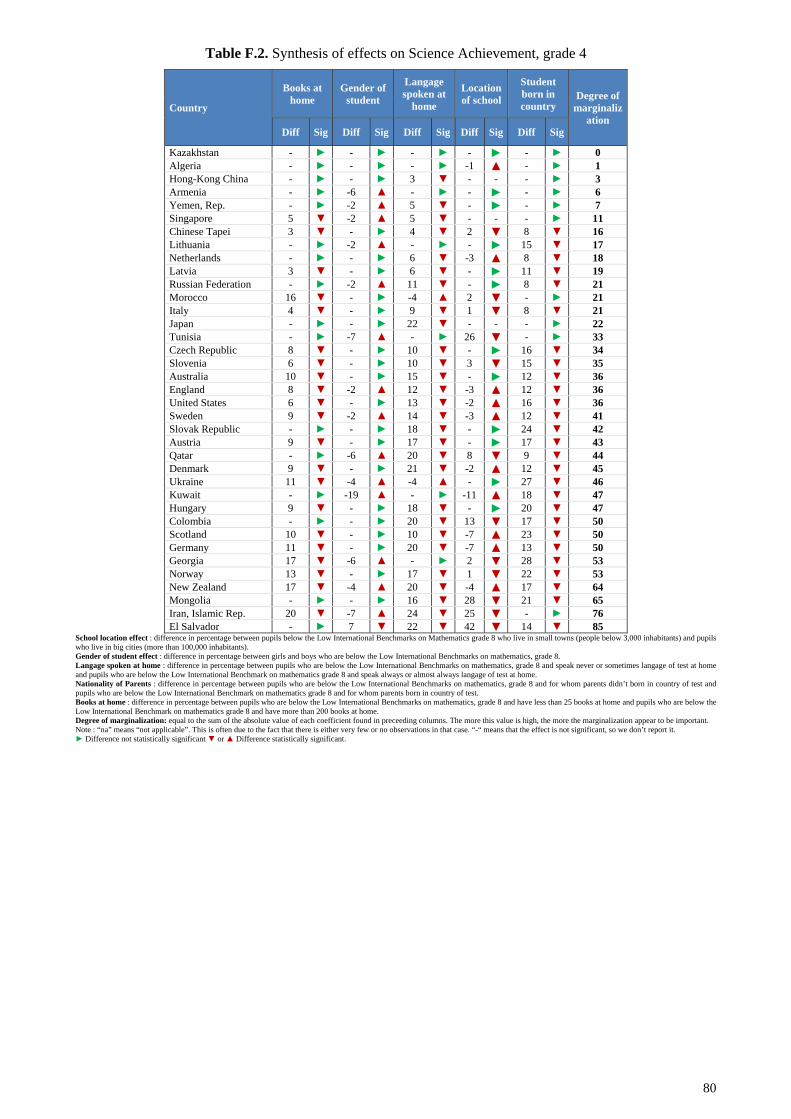
80
Table F.2. Synthesis of effects on Science Achievement, grade 4
Country
Books at home
Gender of student
Langage spoken at
home
Location of school
Student born in country
Degree of marginaliz
ation Diff Sig Diff Sig Diff Sig Diff Sig Diff Sig
Kazakhstan - ► - ► - ► - ► - ► 0 Algeria - ► - ► - ► -1 ▲ - ► 1 Hong-Kong China - ► - ► 3 ▼ - - - ► 3 Armenia - ► -6 ▲ - ► - ► - ► 6 Yemen, Rep. - ► -2 ▲ 5 ▼ - ► - ► 7 Singapore 5 ▼ -2 ▲ 5 ▼ - - - ► 11 Chinese Tapei 3 ▼ - ► 4 ▼ 2 ▼ 8 ▼ 16 Lithuania - ► -2 ▲ - ► - ► 15 ▼ 17 Netherlands - ► - ► 6 ▼ -3 ▲ 8 ▼ 18 Latvia 3 ▼ - ► 6 ▼ - ► 11 ▼ 19 Russian Federation - ► -2 ▲ 11 ▼ - ► 8 ▼ 21 Morocco 16 ▼ - ► -4 ▲ 2 ▼ - ► 21 Italy 4 ▼ - ► 9 ▼ 1 ▼ 8 ▼ 21 Japan - ► - ► 22 ▼ - - - ► 22 Tunisia - ► -7 ▲ - ► 26 ▼ - ► 33 Czech Republic 8 ▼ - ► 10 ▼ - ► 16 ▼ 34 Slovenia 6 ▼ - ► 10 ▼ 3 ▼ 15 ▼ 35 Australia 10 ▼ - ► 15 ▼ - ► 12 ▼ 36 England 8 ▼ -2 ▲ 12 ▼ -3 ▲ 12 ▼ 36 United States 6 ▼ - ► 13 ▼ -2 ▲ 16 ▼ 36 Sweden 9 ▼ -2 ▲ 14 ▼ -3 ▲ 12 ▼ 41 Slovak Republic - ► - ► 18 ▼ - ► 24 ▼ 42 Austria 9 ▼ - ► 17 ▼ - ► 17 ▼ 43 Qatar - ► -6 ▲ 20 ▼ 8 ▼ 9 ▼ 44 Denmark 9 ▼ - ► 21 ▼ -2 ▲ 12 ▼ 45 Ukraine 11 ▼ -4 ▲ -4 ▲ - ► 27 ▼ 46 Kuwait - ► -19 ▲ - ► -11 ▲ 18 ▼ 47 Hungary 9 ▼ - ► 18 ▼ - ► 20 ▼ 47 Colombia - ► - ► 20 ▼ 13 ▼ 17 ▼ 50 Scotland 10 ▼ - ► 10 ▼ -7 ▲ 23 ▼ 50 Germany 11 ▼ - ► 20 ▼ -7 ▲ 13 ▼ 50 Georgia 17 ▼ -6 ▲ - ► 2 ▼ 28 ▼ 53 Norway 13 ▼ - ► 17 ▼ 1 ▼ 22 ▼ 53 New Zealand 17 ▼ -4 ▲ 20 ▼ -4 ▲ 17 ▼ 64 Mongolia - ► - ► 16 ▼ 28 ▼ 21 ▼ 65 Iran, Islamic Rep. 20 ▼ -7 ▲ 24 ▼ 25 ▼ - ► 76 El Salvador - ► 7 ▼ 22 ▼ 42 ▼ 14 ▼ 85
School location effect : difference in percentage between pupils below the Low International Benchmarks on Mathematics grade 8 who live in small towns (people below 3,000 inhabitants) and pupils who live in big cities (more than 100,000 inhabitants). Gender of student effect : difference in percentage between girls and boys who are below the Low International Benchmarks on mathematics, grade 8. Langage spoken at home : difference in percentage between pupils who are below the Low International Benchmarks on mathematics, grade 8 and speak never or sometimes langage of test at home and pupils who are below the Low International Benchmark on mathematics grade 8 and speak always or almost always langage of test at home. Nationality of Parents : difference in percentage between pupils who are below the Low International Benchmarks on mathematics, grade 8 and for whom parents didn’t born in country of test and pupils who are below the Low International Benchmark on mathematics grade 8 and for whom parents born in country of test. Books at home : difference in percentage between pupils who are below the Low International Benchmarks on mathematics, grade 8 and have less than 25 books at home and pupils who are below the Low International Benchmark on mathematics grade 8 and have more than 200 books at home. Degree of marginalization: equal to the sum of the absolute value of each coefficient found in preceeding columns. The more this value is high, the more the marginalization appear to be important. Note : “na” means “not applicable”. This is often due to the fact that there is either very few or no observations in that case. “-“ means that the effect is not significant, so we don’t report it. ► Difference not statistically significant ▼ or ▲ Difference statistically significant.
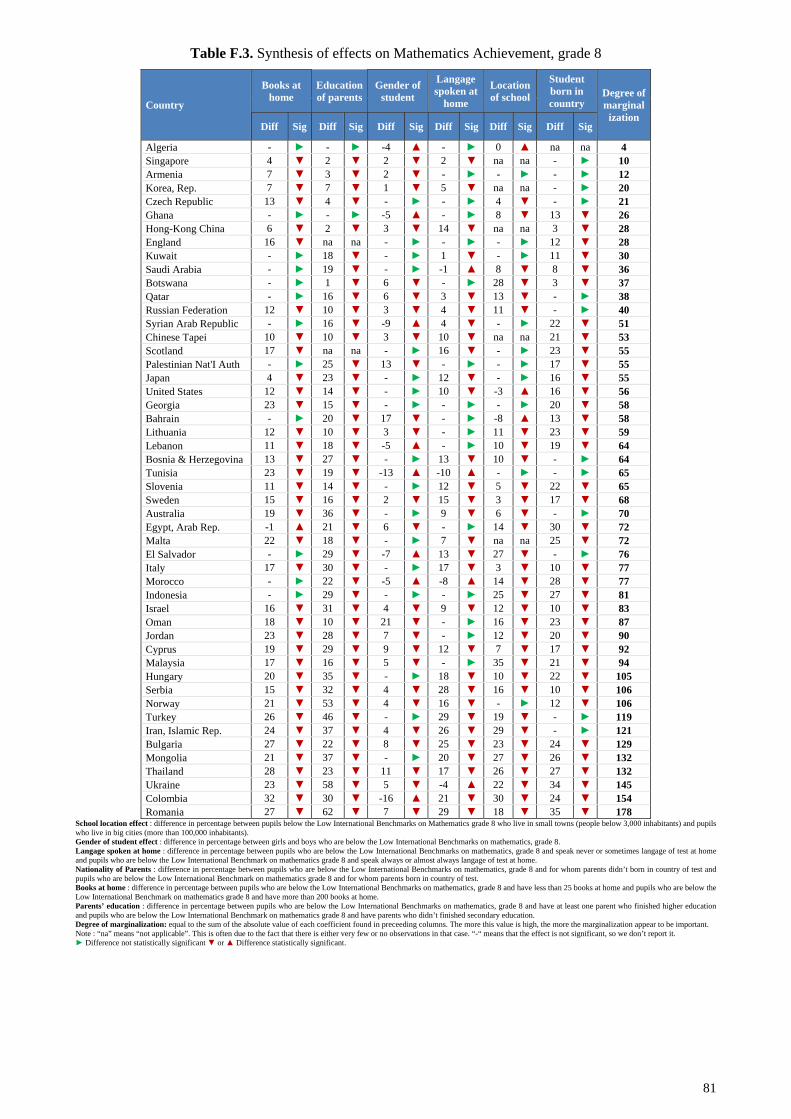
81
Table F.3. Synthesis of effects on Mathematics Achievement, grade 8
Country
Books at home
Education of parents
Gender of student
Langage spoken at
home
Location of school
Student born in country
Degree of marginal
ization Diff Sig Diff Sig Diff Sig Diff Sig Diff Sig Diff Sig
Algeria - ► - ► -4 ▲ - ► 0 ▲ na na 4 Singapore 4 ▼ 2 ▼ 2 ▼ 2 ▼ na na - ► 10 Armenia 7 ▼ 3 ▼ 2 ▼ - ► - ► - ► 12 Korea, Rep. 7 ▼ 7 ▼ 1 ▼ 5 ▼ na na - ► 20 Czech Republic 13 ▼ 4 ▼ - ► - ► 4 ▼ - ► 21 Ghana - ► - ► -5 ▲ - ► 8 ▼ 13 ▼ 26 Hong-Kong China 6 ▼ 2 ▼ 3 ▼ 14 ▼ na na 3 ▼ 28 England 16 ▼ na na - ► - ► - ► 12 ▼ 28 Kuwait - ► 18 ▼ - ► 1 ▼ - ► 11 ▼ 30 Saudi Arabia - ► 19 ▼ - ► -1 ▲ 8 ▼ 8 ▼ 36 Botswana - ► 1 ▼ 6 ▼ - ► 28 ▼ 3 ▼ 37 Qatar - ► 16 ▼ 6 ▼ 3 ▼ 13 ▼ - ► 38 Russian Federation 12 ▼ 10 ▼ 3 ▼ 4 ▼ 11 ▼ - ► 40 Syrian Arab Republic - ► 16 ▼ -9 ▲ 4 ▼ - ► 22 ▼ 51 Chinese Tapei 10 ▼ 10 ▼ 3 ▼ 10 ▼ na na 21 ▼ 53 Scotland 17 ▼ na na - ► 16 ▼ - ► 23 ▼ 55 Palestinian Nat'I Auth - ► 25 ▼ 13 ▼ - ► - ► 17 ▼ 55 Japan 4 ▼ 23 ▼ - ► 12 ▼ - ► 16 ▼ 55 United States 12 ▼ 14 ▼ - ► 10 ▼ -3 ▲ 16 ▼ 56 Georgia 23 ▼ 15 ▼ - ► - ► - ► 20 ▼ 58 Bahrain - ► 20 ▼ 17 ▼ - ► -8 ▲ 13 ▼ 58 Lithuania 12 ▼ 10 ▼ 3 ▼ - ► 11 ▼ 23 ▼ 59 Lebanon 11 ▼ 18 ▼ -5 ▲ - ► 10 ▼ 19 ▼ 64 Bosnia & Herzegovina 13 ▼ 27 ▼ - ► 13 ▼ 10 ▼ - ► 64 Tunisia 23 ▼ 19 ▼ -13 ▲ -10 ▲ - ► - ► 65 Slovenia 11 ▼ 14 ▼ - ► 12 ▼ 5 ▼ 22 ▼ 65 Sweden 15 ▼ 16 ▼ 2 ▼ 15 ▼ 3 ▼ 17 ▼ 68 Australia 19 ▼ 36 ▼ - ► 9 ▼ 6 ▼ - ► 70 Egypt, Arab Rep. -1 ▲ 21 ▼ 6 ▼ - ► 14 ▼ 30 ▼ 72 Malta 22 ▼ 18 ▼ - ► 7 ▼ na na 25 ▼ 72 El Salvador - ► 29 ▼ -7 ▲ 13 ▼ 27 ▼ - ► 76 Italy 17 ▼ 30 ▼ - ► 17 ▼ 3 ▼ 10 ▼ 77 Morocco - ► 22 ▼ -5 ▲ -8 ▲ 14 ▼ 28 ▼ 77 Indonesia - ► 29 ▼ - ► - ► 25 ▼ 27 ▼ 81 Israel 16 ▼ 31 ▼ 4 ▼ 9 ▼ 12 ▼ 10 ▼ 83 Oman 18 ▼ 10 ▼ 21 ▼ - ► 16 ▼ 23 ▼ 87 Jordan 23 ▼ 28 ▼ 7 ▼ - ► 12 ▼ 20 ▼ 90 Cyprus 19 ▼ 29 ▼ 9 ▼ 12 ▼ 7 ▼ 17 ▼ 92 Malaysia 17 ▼ 16 ▼ 5 ▼ - ► 35 ▼ 21 ▼ 94 Hungary 20 ▼ 35 ▼ - ► 18 ▼ 10 ▼ 22 ▼ 105 Serbia 15 ▼ 32 ▼ 4 ▼ 28 ▼ 16 ▼ 10 ▼ 106 Norway 21 ▼ 53 ▼ 4 ▼ 16 ▼ - ► 12 ▼ 106 Turkey 26 ▼ 46 ▼ - ► 29 ▼ 19 ▼ - ► 119 Iran, Islamic Rep. 24 ▼ 37 ▼ 4 ▼ 26 ▼ 29 ▼ - ► 121 Bulgaria 27 ▼ 22 ▼ 8 ▼ 25 ▼ 23 ▼ 24 ▼ 129 Mongolia 21 ▼ 37 ▼ - ► 20 ▼ 27 ▼ 26 ▼ 132 Thailand 28 ▼ 23 ▼ 11 ▼ 17 ▼ 26 ▼ 27 ▼ 132 Ukraine 23 ▼ 58 ▼ 5 ▼ -4 ▲ 22 ▼ 34 ▼ 145 Colombia 32 ▼ 30 ▼ -16 ▲ 21 ▼ 30 ▼ 24 ▼ 154 Romania 27 ▼ 62 ▼ 7 ▼ 29 ▼ 18 ▼ 35 ▼ 178
School location effect : difference in percentage between pupils below the Low International Benchmarks on Mathematics grade 8 who live in small towns (people below 3,000 inhabitants) and pupils who live in big cities (more than 100,000 inhabitants). Gender of student effect : difference in percentage between girls and boys who are below the Low International Benchmarks on mathematics, grade 8. Langage spoken at home : difference in percentage between pupils who are below the Low International Benchmarks on mathematics, grade 8 and speak never or sometimes langage of test at home and pupils who are below the Low International Benchmark on mathematics grade 8 and speak always or almost always langage of test at home. Nationality of Parents : difference in percentage between pupils who are below the Low International Benchmarks on mathematics, grade 8 and for whom parents didn’t born in country of test and pupils who are below the Low International Benchmark on mathematics grade 8 and for whom parents born in country of test. Books at home : difference in percentage between pupils who are below the Low International Benchmarks on mathematics, grade 8 and have less than 25 books at home and pupils who are below the Low International Benchmark on mathematics grade 8 and have more than 200 books at home. Parents’ education : difference in percentage between pupils who are below the Low International Benchmarks on mathematics, grade 8 and have at least one parent who finished higher education and pupils who are below the Low International Benchmark on mathematics grade 8 and have parents who didn’t finished secondary education. Degree of marginalization: equal to the sum of the absolute value of each coefficient found in preceeding columns. The more this value is high, the more the marginalization appear to be important. Note : “na” means “not applicable”. This is often due to the fact that there is either very few or no observations in that case. “-“ means that the effect is not significant, so we don’t report it. ► Difference not statistically significant ▼ or ▲ Difference statistically significant.

82
Table F.4. Synthesis of effects on Science Achievement, grade 8
Country
Books at home
Education of parents
Gender of
student
Langage spoken at
home
Location of school
Student born in country Degree of
marginalization
Diff Sig Diff Sig Diff Sig Diff Sig Diff Sig Diff Sig
Algeria - ► 8 ▼ - ► - ► - ► na na 8 Czech Republic 7 ▼ - ► - ► - ► - ► 5 ▼ 12 Armenia 5 ▼ - ► -3 ▲ 11 ▼ - ► - ► 19 Korea, Rep. 8 ▼ 7 ▼ - ► 6 ▼ na na - ► 21 England 9 ▼ na na - ► 10 ▼ - ► 11 ▼ 30 Syrian Arab Republic - ► 9 ▼ - ► - ► - ► 22 ▼ 31 Ghana - ► - ► 7 ▼ - ► 12 ▼ 15 ▼ 35 Hong-Kong China 9 ▼ - ► -3 ▲ 19 ▼ na na 4 ▼ 35 Singapore 12 ▼ 12 ▼ -3 ▲ 9 ▼ na na - ► 36 Morocco - ► 14 ▼ - ► - ► - ► 24 ▼ 38 Russian Federation 7 ▼ 18 ▼ - ► 6 ▼ 7 ▼ - ► 38 Lithuania 10 ▼ - ► - ► - ► 8 ▼ 20 ▼ 39 Slovenia 6 ▼ 13 ▼ - ► 8 ▼ 3 ▼ 14 ▼ 45 Botswana - ► - ► -7 ▲ - ► 31 ▼ 7 ▼ 45 Tunisia - ► 11 ▼ 10 ▼ -11 ▼ - ► 15 ▼ 46 Bosnia & Herzegovina 15 ▼ 30 ▼ - ► - ► 9 ▼ - ► 53 Indonesia - ► 24 ▼ - ► - ► - ► 30 ▼ 54 Chinese Tapei 10 ▼ 9 ▼ -2 ▲ 9 ▼ na na 24 ▼ 54 United States 13 ▼ 17 ▼ - ► 10 ▼ - ► 15 ▼ 55 Palestinian Nat'I Auth - ► 21 ▼ -14 ▲ - ► - ► 23 ▼ 59 Scotland 18 ▼ na na - ► 21 ▼ - ► 22 ▼ 60 Georgia 24 ▼ - ► -10 ▲ - ► - ► 28 ▼ 62 Japan 5 ▼ 30 ▼ - ► 11 ▼ - ► 17 ▼ 62 Qatar 11 ▼ 14 ▼ -16 ▲ 24 ▼ - ► - ► 65 Sweden 16 ▼ 19 ▼ - ► 15 ▼ - ► 17 ▼ 67 Kuwait - ► 13 ▼ -24 ▲ - ► -12 ▲ 22 ▼ 71 Hungary 11 ▼ 27 ▼ - ► 15 ▼ 6 ▼ 14 ▼ 74 Saudi Arabia - ► 20 ▼ -22 ▲ - ► 8 ▼ 24 ▼ 74 Jordan 15 ▼ 20 ▼ -12 ▲ - ► 8 ▼ 22 ▼ 76 Italy 16 ▼ 29 ▼ - ► 22 ▼ - ► 9 ▼ 76 Egypt, Arab Rep. -4 ▲ 19 ▼ -8 ▲ - ► 14 ▼ 33 ▼ 77 Israel 18 ▼ 33 ▼ -6 ▲ - ► 11 ▼ 11 ▼ 79 Bulgaria 20 ▼ - ► -6 ▲ 25 ▼ 11 ▼ 18 ▼ 80 Bahrain - ► 13 ▼ -26 ▲ - ► -20 ▲ 22 ▼ 81 Australia 19 ▼ 41 ▼ - ► 17 ▼ - ► 7 ▼ 83 Cyprus 21 ▼ 33 ▼ -9 ▲ 13 ▼ - ► 14 ▼ 90 Oman 15 ▼ - ► -27 ▲ - ► 17 ▼ 30 ▼ 90 Iran, Islamic Rep. 16 ▼ 22 ▼ -6 ▲ 23 ▼ 23 ▼ - ► 91 Mongolia - ► 32 ▼ - ► 18 ▼ 19 ▼ 24 ▼ 94 Thailand 17 ▼ 15 ▼ -9 ▲ 13 ▼ 14 ▼ 30 ▼ 98 Lebanon 19 ▼ 42 ▼ - ► - ► 21 ▼ 19 ▼ 101 Malaysia 17 ▼ 15 ▼ -5 ▲ 8 ▼ 27 ▼ 31 ▼ 102 Serbia 17 ▼ 31 ▼ - ► 24 ▼ 19 ▼ 13 ▼ 103 Malta 33 ▼ 34 ▼ - ► 17 ▼ na na 22 ▼ 105 Ukraine 17 ▼ 51 ▼ - ► - ► 14 ▼ 31 ▼ 112 Turkey 18 ▼ 35 ▼ - ► 29 ▼ 17 ▼ 19 ▼ 117 Norway 22 ▼ 54 ▼ - ► 25 ▼ - ► 17 ▼ 118 El Salvador - ► 34 ▼ 12 ▼ 24 ▼ 38 ▼ 22 ▼ 129 Colombia 26 ▼ 28 ▼ 17 ▼ 24 ▼ 34 ▼ 33 ▼ 161 Romania 25 ▼ 71 ▼ -5 ▲ 26 ▼ 13 ▼ 27 ▼ 166
School location effect : difference in percentage between pupils below the Low International Benchmarks on Mathematics grade 8 who live in small towns (people below 3,000 inhabitants) and pupils who live in big cities (more than 100,000 inhabitants). Gender of student effect : difference in percentage between girls and boys who are below the Low International Benchmarks on mathematics, grade 8. Langage spoken at home : difference in percentage between pupils who are below the Low International Benchmarks on mathematics, grade 8 and speak never or sometimes langage of test at home and pupils who are below the Low International Benchmark on mathematics grade 8 and speak always or almost always langage of test at home. Nationality of Parents : difference in percentage between pupils who are below the Low International Benchmarks on mathematics, grade 8 and for whom parents didn’t born in country of test and pupils who are below the Low International Benchmark on mathematics grade 8 and for whom parents born in country of test. Books at home : difference in percentage between pupils who are below the Low International Benchmarks on mathematics, grade 8 and have less than 25 books at home and pupils who are below the Low International Benchmark on mathematics grade 8 and have more than 200 books at home. Parents’ education : difference in percentage between pupils who are below the Low International Benchmarks on mathematics, grade 8 and have at least one parent who finished higher education and pupils who are below the Low International Benchmark on mathematics grade 8 and have parents who didn’t finished secondary education. Degree of marginalization: equal to the sum of the absolute value of each coefficient found in preceeding columns. The more this value is high, the more the marginalization appear to be important. Note : “na” means “not applicable”. This is often due to the fact that there is either very few or no observations in that case. “-“ means that the effect is not significant, so we don’t report it. ► Difference not statistically significant ▼ or ▲ Difference statistically significant.
83
ANNEX G
Univariate Analysis with Graphics
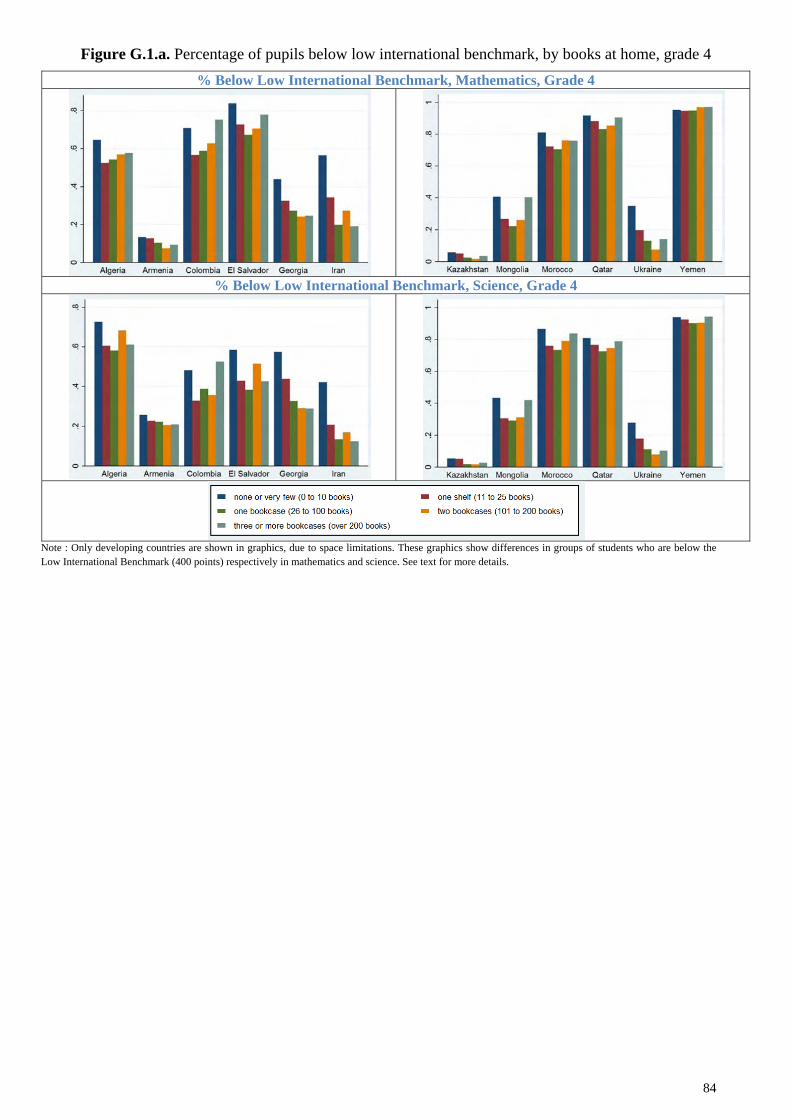
Figure G.1.a. Percentage of pupils below low international benchmark, by books at home, grade 4 % Below Low International Benchmark, Mathematics, Grade 4
% Below Low International Benchmark, Science, Grade 4
Note : Only developing countries are shown in graphics, due to space limitations. These graphics show differences in groups of students who are below the Low International Benchmark (400 points) respectively in mathematics and science. See text for more details.
84
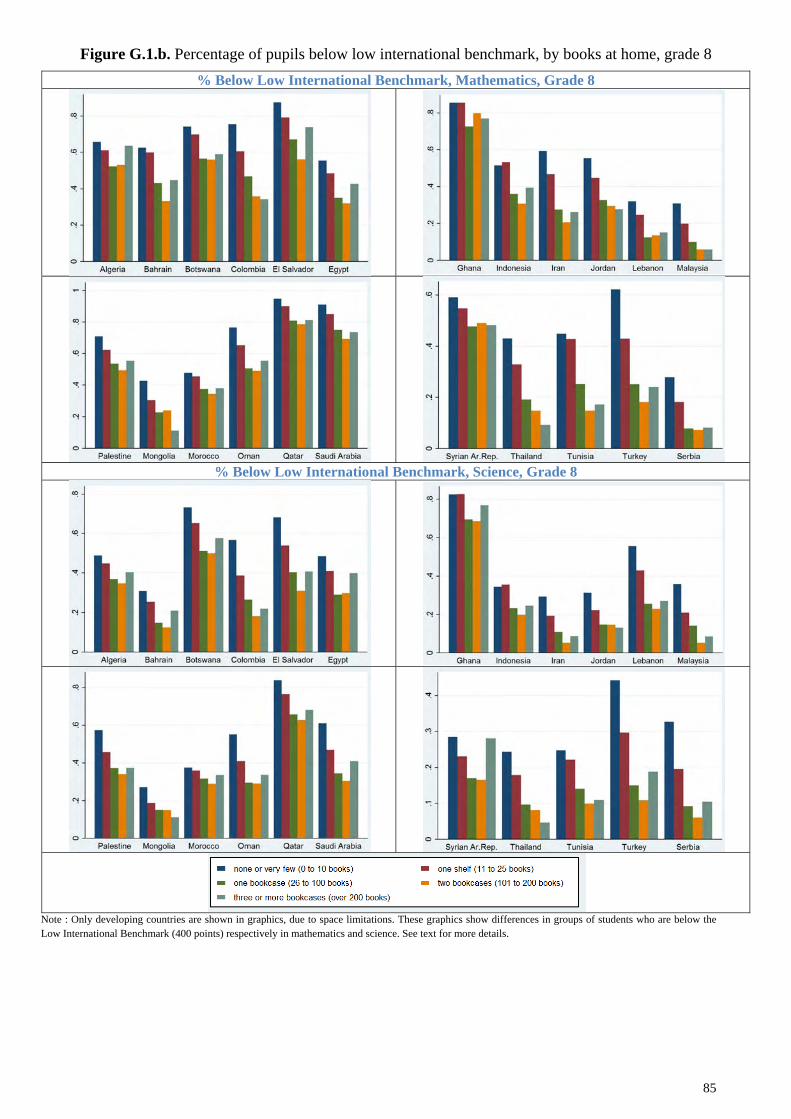
Figure G.1.b. Percentage of pupils below low international benchmark, by books at home, grade 8 % Below Low International Benchmark, Mathematics, Grade 8
% Below Low International Benchmark, Science, Grade 8
Note : Only developing countries are shown in graphics, due to space limitations. These graphics show differences in groups of students who are below the Low International Benchmark (400 points) respectively in mathematics and science. See text for more details.
85
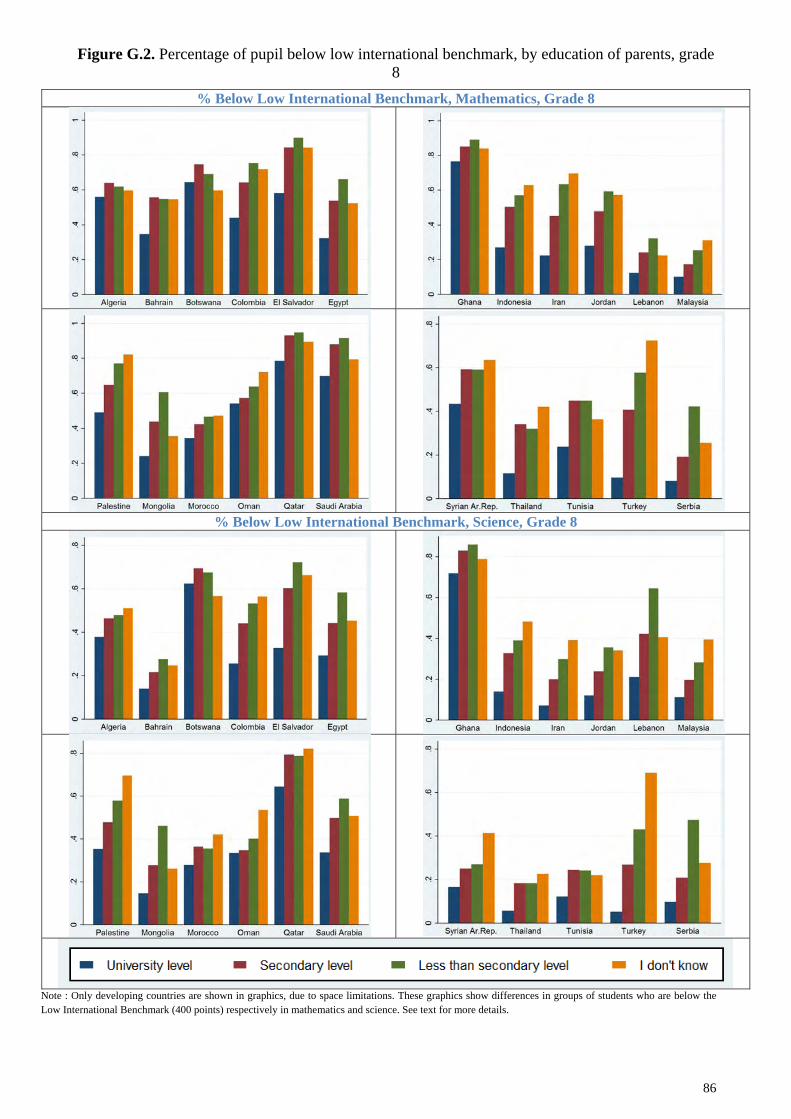
Figure G.2. Percentage of pupil below low international benchmark, by education of parents, grade 8
% Below Low International Benchmark, Mathematics, Grade 8
% Below Low International Benchmark, Science, Grade 8
Note : Only developing countries are shown in graphics, due to space limitations. These graphics show differences in groups of students who are below the Low International Benchmark (400 points) respectively in mathematics and science. See text for more details.
86
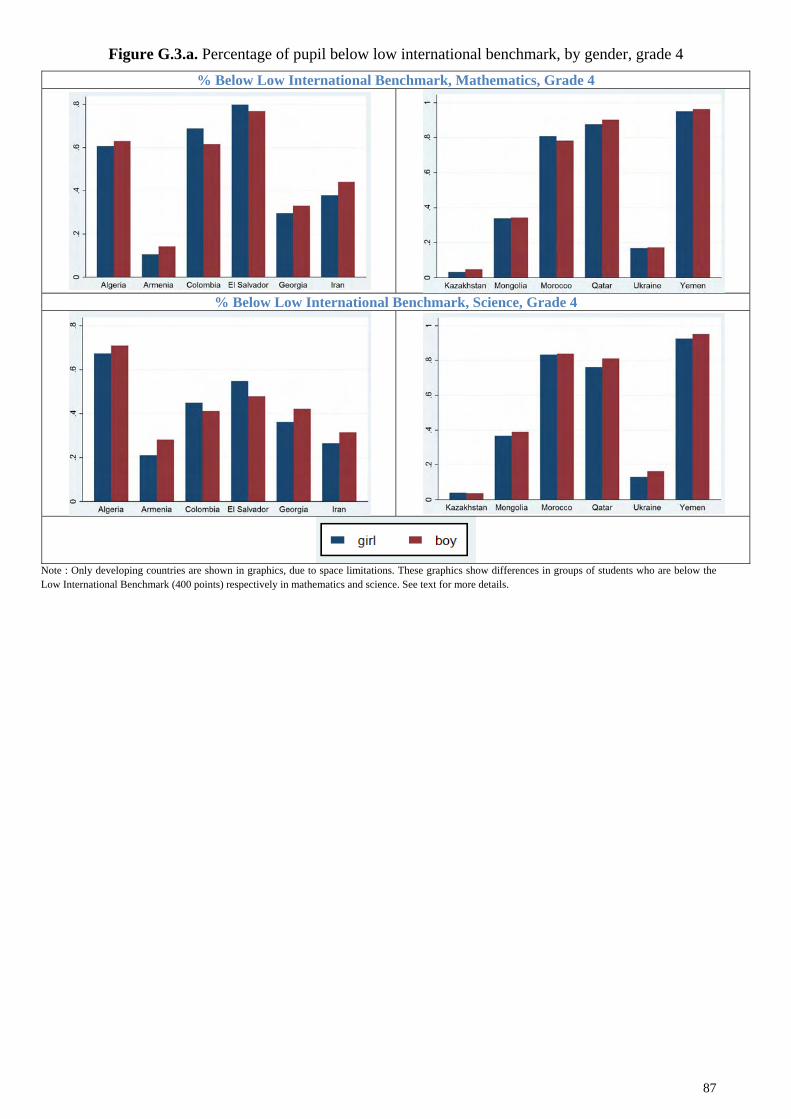
Figure G.3.a. Percentage of pupil below low international benchmark, by gender, grade 4 % Below Low International Benchmark, Mathematics, Grade 4
% Below Low International Benchmark, Science, Grade 4
Note : Only developing countries are shown in graphics, due to space limitations. These graphics show differences in groups of students who are below the Low International Benchmark (400 points) respectively in mathematics and science. See text for more details.
87
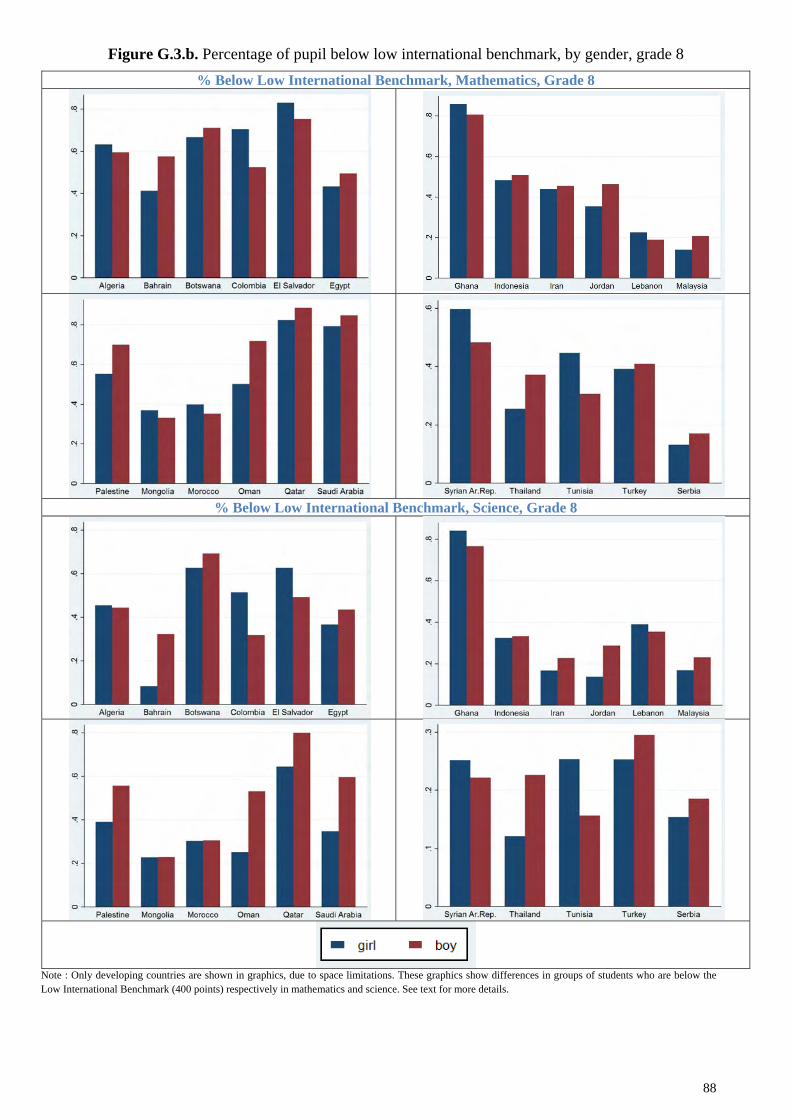
Figure G.3.b. Percentage of pupil below low international benchmark, by gender, grade 8 % Below Low International Benchmark, Mathematics, Grade 8
% Below Low International Benchmark, Science, Grade 8
Note : Only developing countries are shown in graphics, due to space limitations. These graphics show differences in groups of students who are below the Low International Benchmark (400 points) respectively in mathematics and science. See text for more details.
88
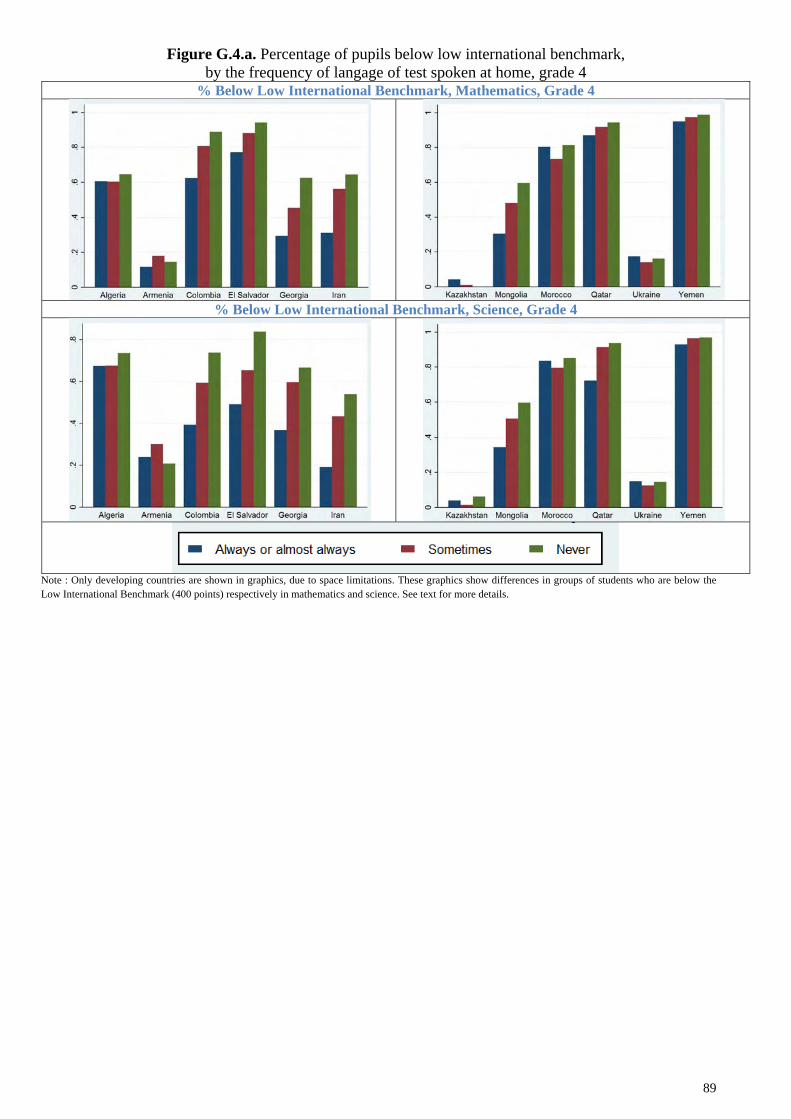
Figure G.4.a. Percentage of pupils below low international benchmark, by the frequency of langage of test spoken at home, grade 4
% Below Low International Benchmark, Mathematics, Grade 4
% Below Low International Benchmark, Science, Grade 4
Note : Only developing countries are shown in graphics, due to space limitations. These graphics show differences in groups of students who are below the Low International Benchmark (400 points) respectively in mathematics and science. See text for more details.
89

Figure G.4.b. Percentage of pupil below low international benchmark, by the frequency of langage of test spoken at home, grade 8
% Below Low International Benchmark, Mathematics, Grade 8
% Below Low International Benchmark, Science, Grade 8
Note : Only developing countries are shown in graphics, due to space limitations. These graphics show differences in groups of students who are below the Low International Benchmark (400 points) respectively in mathematics and science. See text for more details.
90
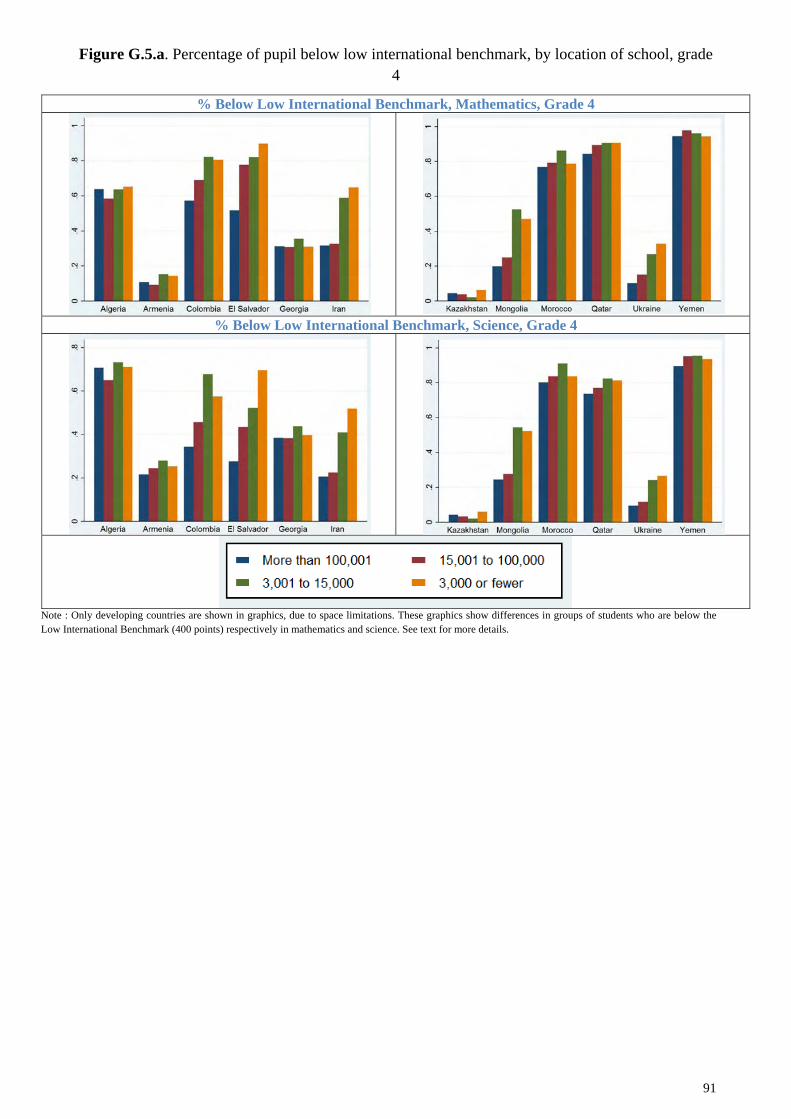
Figure G.5.a. Percentage of pupil below low international benchmark, by location of school, grade 4
% Below Low International Benchmark, Mathematics, Grade 4
% Below Low International Benchmark, Science, Grade 4
Note : Only developing countries are shown in graphics, due to space limitations. These graphics show differences in groups of students who are below the Low International Benchmark (400 points) respectively in mathematics and science. See text for more details.
91
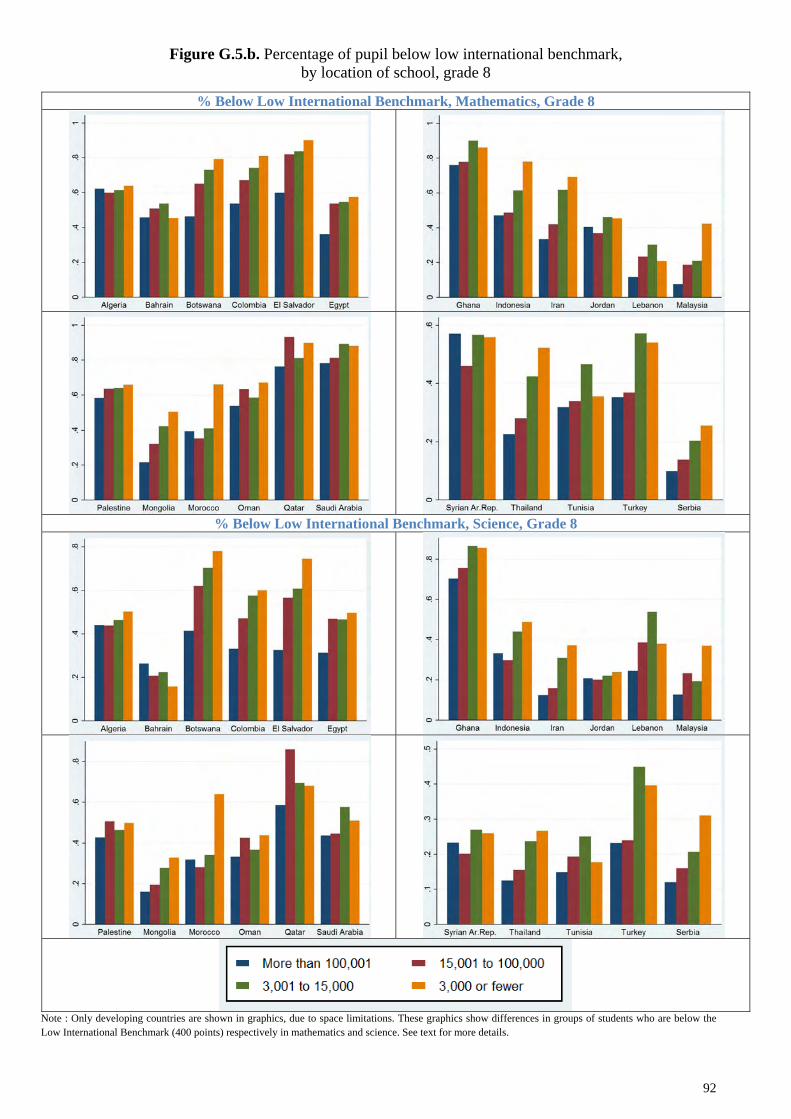
Figure G.5.b. Percentage of pupil below low international benchmark, by location of school, grade 8
% Below Low International Benchmark, Mathematics, Grade 8
% Below Low International Benchmark, Science, Grade 8
Note : Only developing countries are shown in graphics, due to space limitations. These graphics show differences in groups of students who are below the Low International Benchmark (400 points) respectively in mathematics and science. See text for more details.
92
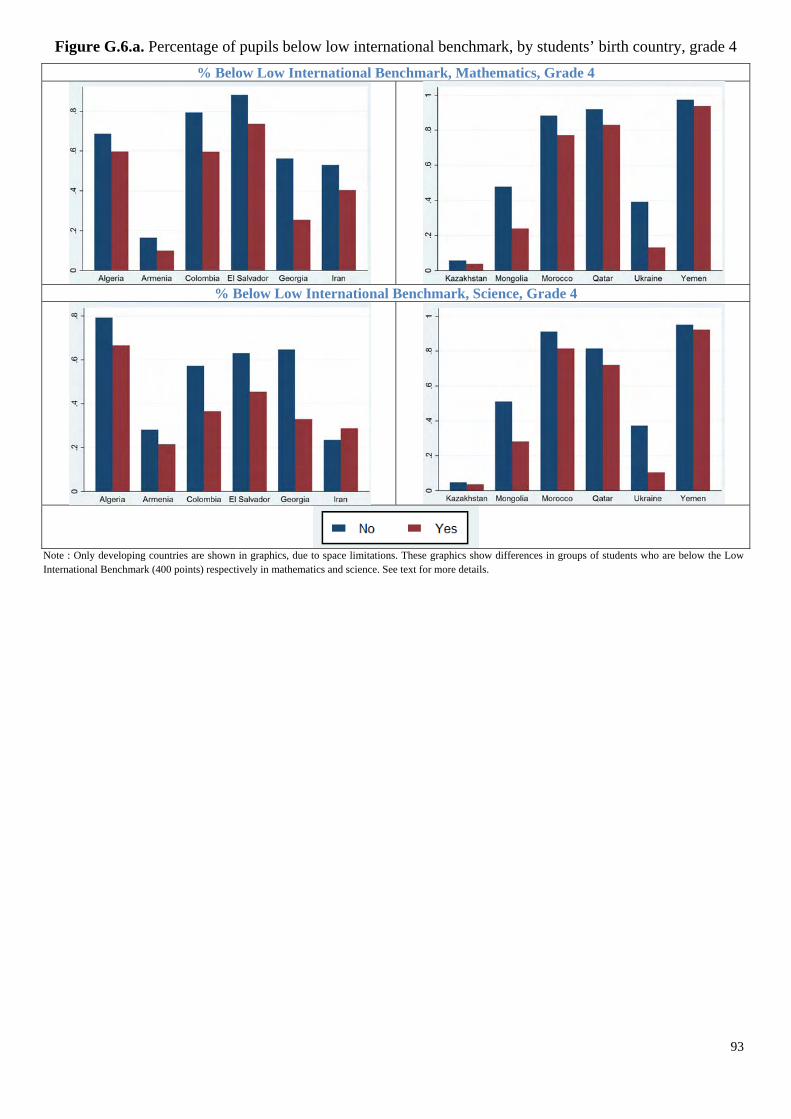
Figure G.6.a. Percentage of pupils below low international benchmark, by students’ birth country, grade 4 % Below Low International Benchmark, Mathematics, Grade 4
% Below Low International Benchmark, Science, Grade 4
Note : Only developing countries are shown in graphics, due to space limitations. These graphics show differences in groups of students who are below the Low International Benchmark (400 points) respectively in mathematics and science. See text for more details.
93
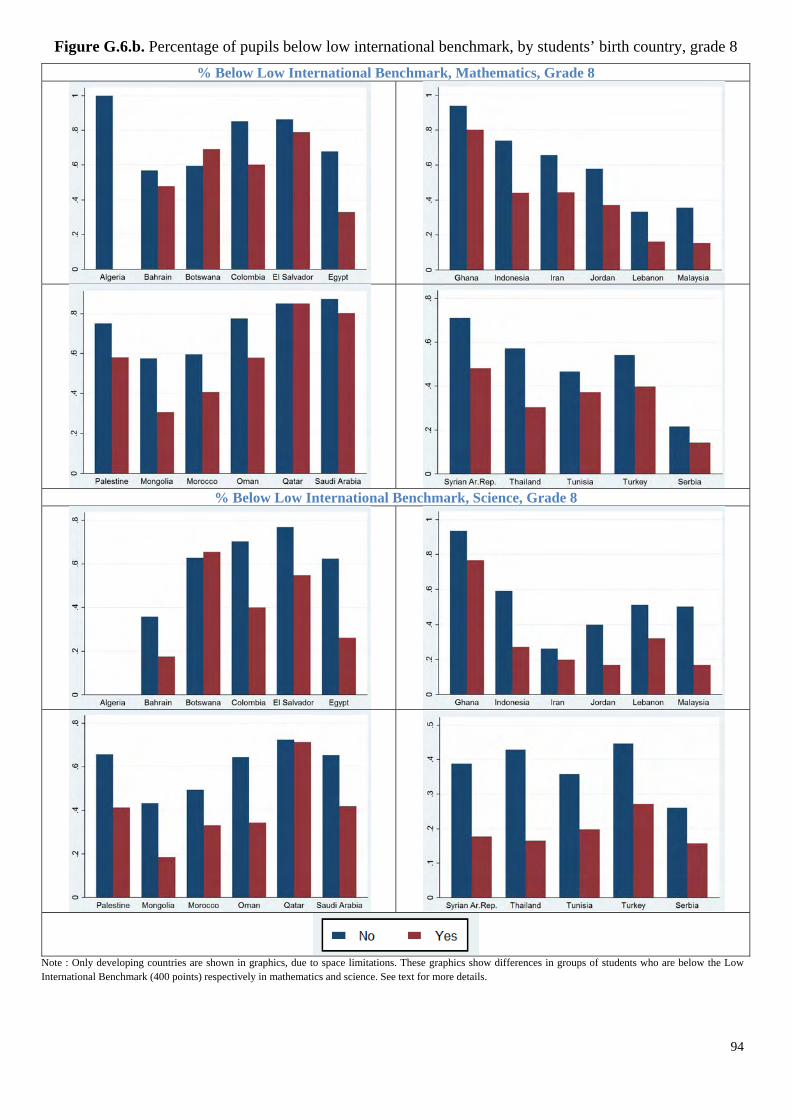
Figure G.6.b. Percentage of pupils below low international benchmark, by students’ birth country, grade 8 % Below Low International Benchmark, Mathematics, Grade 8
% Below Low International Benchmark, Science, Grade 8
Note : Only developing countries are shown in graphics, due to space limitations. These graphics show differences in groups of students who are below the Low International Benchmark (400 points) respectively in mathematics and science. See text for more details.
94
95
ANNEX H
Comparison Between « Marginalized Populations » and Global Population
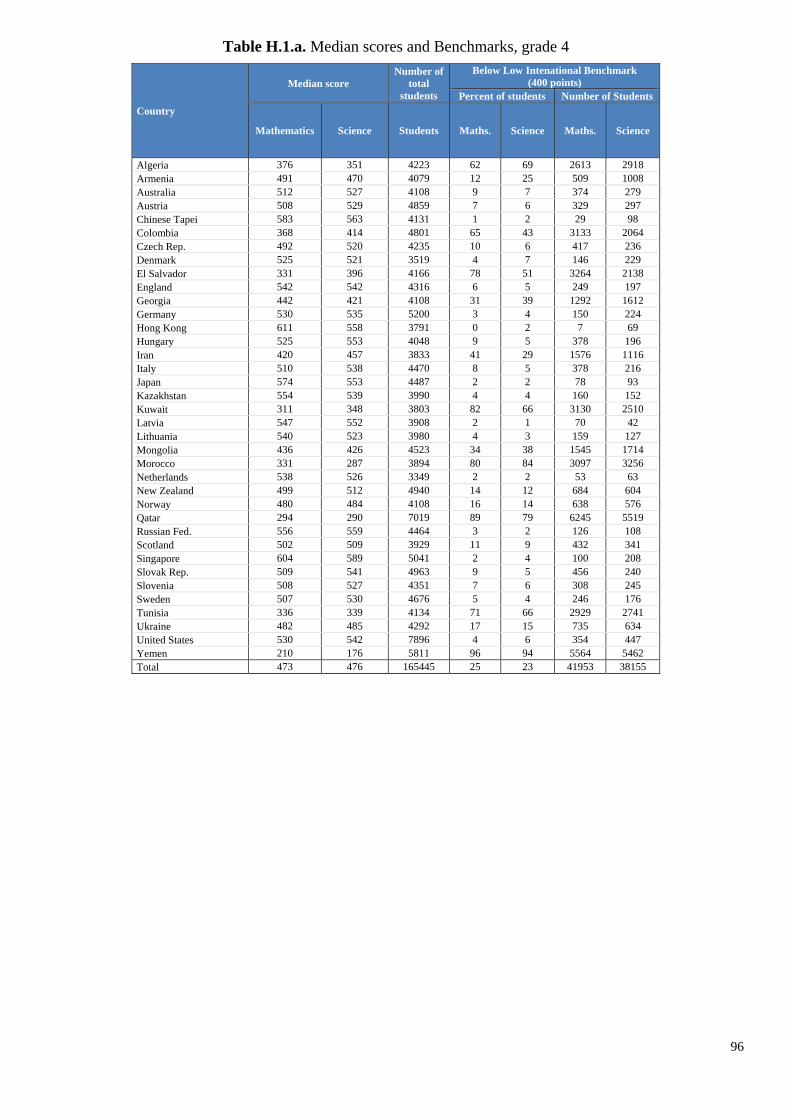
96
Table H.1.a. Median scores and Benchmarks, grade 4
Country
Median score Number of
total students
Below Low Intenational Benchmark (400 points)
Percent of students Number of Students
Mathematics Science Students Maths. Science Maths. Science
Algeria 376 351 4223 62 69 2613 2918 Armenia 491 470 4079 12 25 509 1008 Australia 512 527 4108 9 7 374 279 Austria 508 529 4859 7 6 329 297 Chinese Tapei 583 563 4131 1 2 29 98 Colombia 368 414 4801 65 43 3133 2064 Czech Rep. 492 520 4235 10 6 417 236 Denmark 525 521 3519 4 7 146 229 El Salvador 331 396 4166 78 51 3264 2138 England 542 542 4316 6 5 249 197 Georgia 442 421 4108 31 39 1292 1612 Germany 530 535 5200 3 4 150 224 Hong Kong 611 558 3791 0 2 7 69 Hungary 525 553 4048 9 5 378 196 Iran 420 457 3833 41 29 1576 1116 Italy 510 538 4470 8 5 378 216 Japan 574 553 4487 2 2 78 93 Kazakhstan 554 539 3990 4 4 160 152 Kuwait 311 348 3803 82 66 3130 2510 Latvia 547 552 3908 2 1 70 42 Lithuania 540 523 3980 4 3 159 127 Mongolia 436 426 4523 34 38 1545 1714 Morocco 331 287 3894 80 84 3097 3256 Netherlands 538 526 3349 2 2 53 63 New Zealand 499 512 4940 14 12 684 604 Norway 480 484 4108 16 14 638 576 Qatar 294 290 7019 89 79 6245 5519 Russian Fed. 556 559 4464 3 2 126 108 Scotland 502 509 3929 11 9 432 341 Singapore 604 589 5041 2 4 100 208 Slovak Rep. 509 541 4963 9 5 456 240 Slovenia 508 527 4351 7 6 308 245 Sweden 507 530 4676 5 4 246 176 Tunisia 336 339 4134 71 66 2929 2741 Ukraine 482 485 4292 17 15 735 634 United States 530 542 7896 4 6 354 447 Yemen 210 176 5811 96 94 5564 5462 Total 473 476 165445 25 23 41953 38155
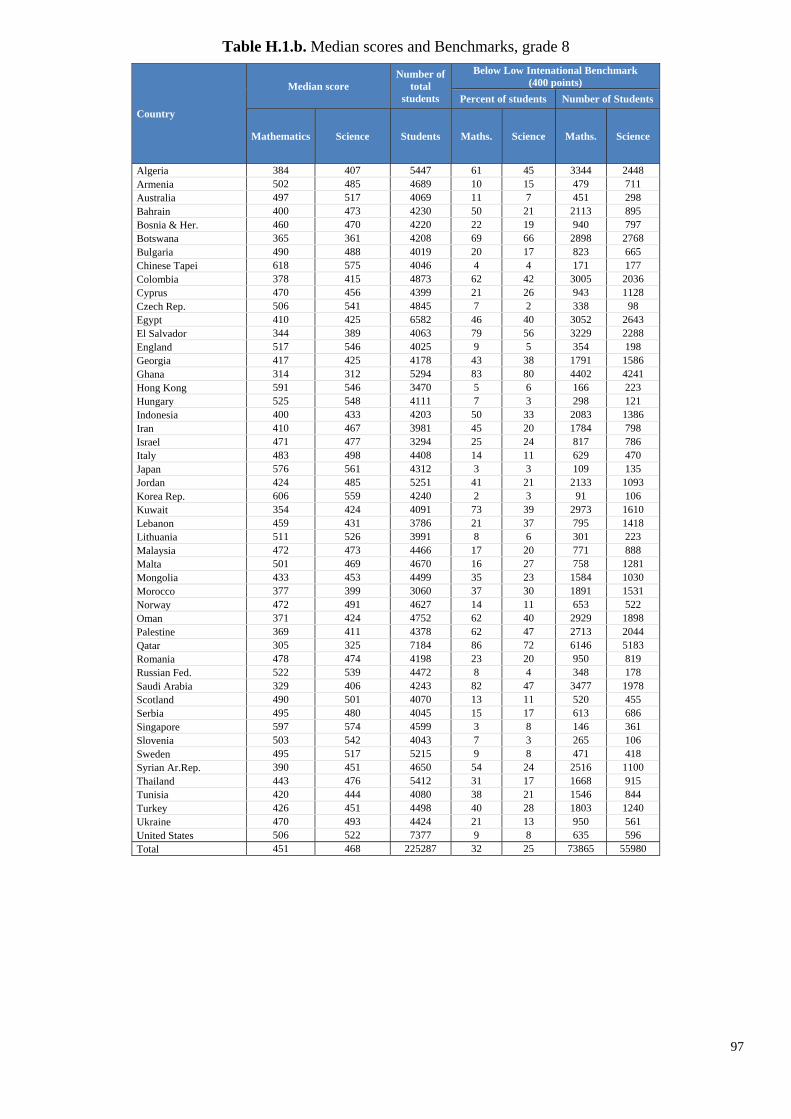
97
Table H.1.b. Median scores and Benchmarks, grade 8
Country
Median score Number of
total students
Below Low Intenational Benchmark (400 points)
Percent of students Number of Students
Mathematics Science Students Maths. Science Maths. Science
Algeria 384 407 5447 61 45 3344 2448 Armenia 502 485 4689 10 15 479 711 Australia 497 517 4069 11 7 451 298 Bahrain 400 473 4230 50 21 2113 895 Bosnia & Her. 460 470 4220 22 19 940 797 Botswana 365 361 4208 69 66 2898 2768 Bulgaria 490 488 4019 20 17 823 665 Chinese Tapei 618 575 4046 4 4 171 177 Colombia 378 415 4873 62 42 3005 2036 Cyprus 470 456 4399 21 26 943 1128 Czech Rep. 506 541 4845 7 2 338 98 Egypt 410 425 6582 46 40 3052 2643 El Salvador 344 389 4063 79 56 3229 2288 England 517 546 4025 9 5 354 198 Georgia 417 425 4178 43 38 1791 1586 Ghana 314 312 5294 83 80 4402 4241 Hong Kong 591 546 3470 5 6 166 223 Hungary 525 548 4111 7 3 298 121 Indonesia 400 433 4203 50 33 2083 1386 Iran 410 467 3981 45 20 1784 798 Israel 471 477 3294 25 24 817 786 Italy 483 498 4408 14 11 629 470 Japan 576 561 4312 3 3 109 135 Jordan 424 485 5251 41 21 2133 1093 Korea Rep. 606 559 4240 2 3 91 106 Kuwait 354 424 4091 73 39 2973 1610 Lebanon 459 431 3786 21 37 795 1418 Lithuania 511 526 3991 8 6 301 223 Malaysia 472 473 4466 17 20 771 888 Malta 501 469 4670 16 27 758 1281 Mongolia 433 453 4499 35 23 1584 1030 Morocco 377 399 3060 37 30 1891 1531 Norway 472 491 4627 14 11 653 522 Oman 371 424 4752 62 40 2929 1898 Palestine 369 411 4378 62 47 2713 2044 Qatar 305 325 7184 86 72 6146 5183 Romania 478 474 4198 23 20 950 819 Russian Fed. 522 539 4472 8 4 348 178 Saudi Arabia 329 406 4243 82 47 3477 1978 Scotland 490 501 4070 13 11 520 455 Serbia 495 480 4045 15 17 613 686 Singapore 597 574 4599 3 8 146 361 Slovenia 503 542 4043 7 3 265 106 Sweden 495 517 5215 9 8 471 418 Syrian Ar.Rep. 390 451 4650 54 24 2516 1100 Thailand 443 476 5412 31 17 1668 915 Tunisia 420 444 4080 38 21 1546 844 Turkey 426 451 4498 40 28 1803 1240 Ukraine 470 493 4424 21 13 950 561 United States 506 522 7377 9 8 635 596 Total 451 468 225287 32 25 73865 55980
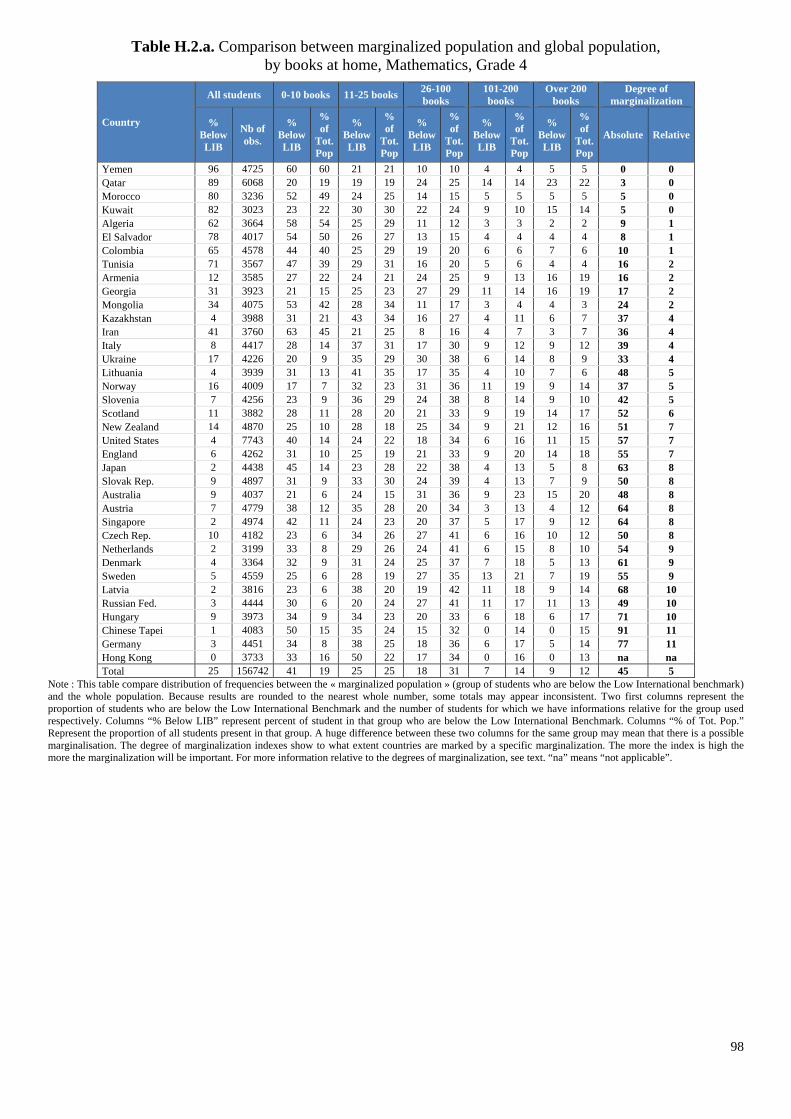
98
Table H.2.a. Comparison between marginalized population and global population, by books at home, Mathematics, Grade 4
Country
All students 0-10 books 11-25 books 26-100 books
101-200 books
Over 200 books
Degree of marginalization
% Below LIB
Nb of obs.
% Below LIB
% of
Tot. Pop
% Below LIB
% of
Tot. Pop
% Below LIB
% of
Tot. Pop
% Below LIB
% of
Tot. Pop
% Below LIB
% of
Tot. Pop
Absolute Relative
Yemen 96 4725 60 60 21 21 10 10 4 4 5 5 0 0 Qatar 89 6068 20 19 19 19 24 25 14 14 23 22 3 0 Morocco 80 3236 52 49 24 25 14 15 5 5 5 5 5 0 Kuwait 82 3023 23 22 30 30 22 24 9 10 15 14 5 0 Algeria 62 3664 58 54 25 29 11 12 3 3 2 2 9 1 El Salvador 78 4017 54 50 26 27 13 15 4 4 4 4 8 1 Colombia 65 4578 44 40 25 29 19 20 6 6 7 6 10 1 Tunisia 71 3567 47 39 29 31 16 20 5 6 4 4 16 2 Armenia 12 3585 27 22 24 21 24 25 9 13 16 19 16 2 Georgia 31 3923 21 15 25 23 27 29 11 14 16 19 17 2 Mongolia 34 4075 53 42 28 34 11 17 3 4 4 3 24 2 Kazakhstan 4 3988 31 21 43 34 16 27 4 11 6 7 37 4 Iran 41 3760 63 45 21 25 8 16 4 7 3 7 36 4 Italy 8 4417 28 14 37 31 17 30 9 12 9 12 39 4 Ukraine 17 4226 20 9 35 29 30 38 6 14 8 9 33 4 Lithuania 4 3939 31 13 41 35 17 35 4 10 7 6 48 5 Norway 16 4009 17 7 32 23 31 36 11 19 9 14 37 5 Slovenia 7 4256 23 9 36 29 24 38 8 14 9 10 42 5 Scotland 11 3882 28 11 28 20 21 33 9 19 14 17 52 6 New Zealand 14 4870 25 10 28 18 25 34 9 21 12 16 51 7 United States 4 7743 40 14 24 22 18 34 6 16 11 15 57 7 England 6 4262 31 10 25 19 21 33 9 20 14 18 55 7 Japan 2 4438 45 14 23 28 22 38 4 13 5 8 63 8 Slovak Rep. 9 4897 31 9 33 30 24 39 4 13 7 9 50 8 Australia 9 4037 21 6 24 15 31 36 9 23 15 20 48 8 Austria 7 4779 38 12 35 28 20 34 3 13 4 12 64 8 Singapore 2 4974 42 11 24 23 20 37 5 17 9 12 64 8 Czech Rep. 10 4182 23 6 34 26 27 41 6 16 10 12 50 8 Netherlands 2 3199 33 8 29 26 24 41 6 15 8 10 54 9 Denmark 4 3364 32 9 31 24 25 37 7 18 5 13 61 9 Sweden 5 4559 25 6 28 19 27 35 13 21 7 19 55 9 Latvia 2 3816 23 6 38 20 19 42 11 18 9 14 68 10 Russian Fed. 3 4444 30 6 20 24 27 41 11 17 11 13 49 10 Hungary 9 3973 34 9 34 23 20 33 6 18 6 17 71 10 Chinese Tapei 1 4083 50 15 35 24 15 32 0 14 0 15 91 11 Germany 3 4451 34 8 38 25 18 36 6 17 5 14 77 11 Hong Kong 0 3733 33 16 50 22 17 34 0 16 0 13 na na Total 25 156742 41 19 25 25 18 31 7 14 9 12 45 5
Note : This table compare distribution of frequencies between the « marginalized population » (group of students who are below the Low International benchmark) and the whole population. Because results are rounded to the nearest whole number, some totals may appear inconsistent. Two first columns represent the proportion of students who are below the Low International Benchmark and the number of students for which we have informations relative for the group used respectively. Columns “% Below LIB” represent percent of student in that group who are below the Low International Benchmark. Columns “% of Tot. Pop.” Represent the proportion of all students present in that group. A huge difference between these two columns for the same group may mean that there is a possible marginalisation. The degree of marginalization indexes show to what extent countries are marked by a specific marginalization. The more the index is high the more the marginalization will be important. For more information relative to the degrees of marginalization, see text. “na” means “not applicable”.
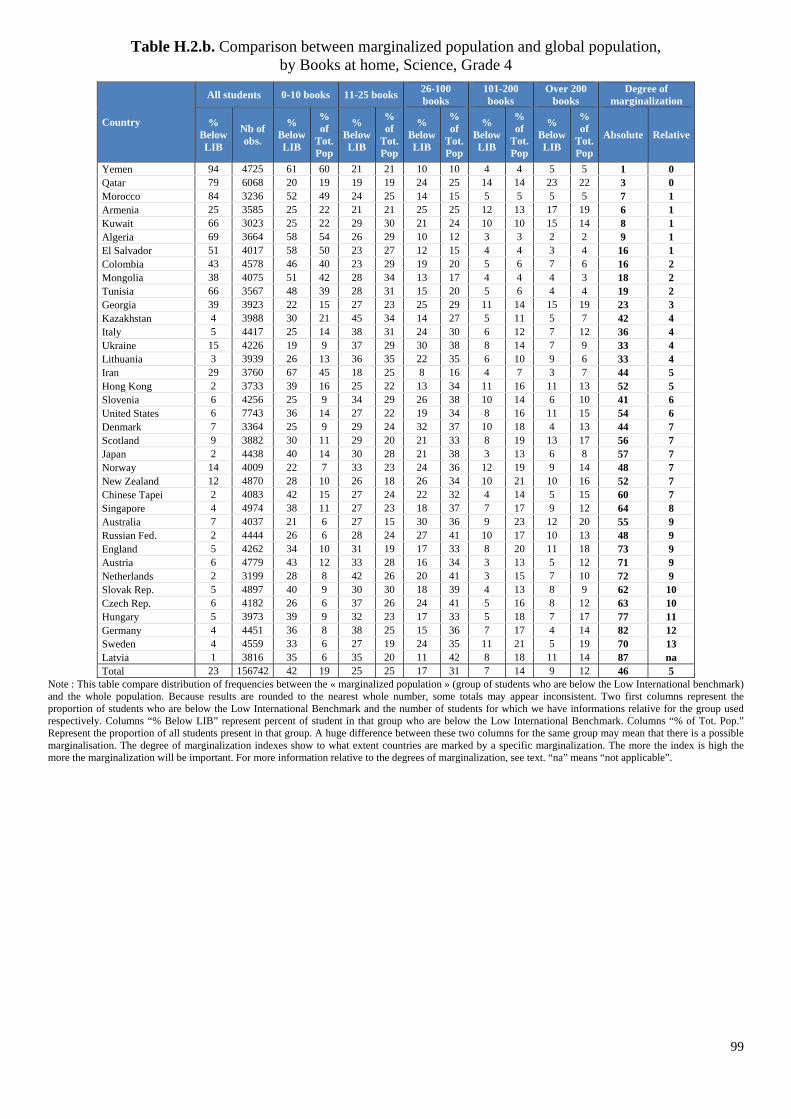
99
Table H.2.b. Comparison between marginalized population and global population, by Books at home, Science, Grade 4
Country
All students 0-10 books 11-25 books 26-100 books
101-200 books
Over 200 books
Degree of marginalization
% Below LIB
Nb of obs.
% Below LIB
% of
Tot. Pop
% Below LIB
% of
Tot. Pop
% Below LIB
% of
Tot. Pop
% Below LIB
% of
Tot. Pop
% Below LIB
% of
Tot. Pop
Absolute Relative
Yemen 94 4725 61 60 21 21 10 10 4 4 5 5 1 0 Qatar 79 6068 20 19 19 19 24 25 14 14 23 22 3 0 Morocco 84 3236 52 49 24 25 14 15 5 5 5 5 7 1 Armenia 25 3585 25 22 21 21 25 25 12 13 17 19 6 1 Kuwait 66 3023 25 22 29 30 21 24 10 10 15 14 8 1 Algeria 69 3664 58 54 26 29 10 12 3 3 2 2 9 1 El Salvador 51 4017 58 50 23 27 12 15 4 4 3 4 16 1 Colombia 43 4578 46 40 23 29 19 20 5 6 7 6 16 2 Mongolia 38 4075 51 42 28 34 13 17 4 4 4 3 18 2 Tunisia 66 3567 48 39 28 31 15 20 5 6 4 4 19 2 Georgia 39 3923 22 15 27 23 25 29 11 14 15 19 23 3 Kazakhstan 4 3988 30 21 45 34 14 27 5 11 5 7 42 4 Italy 5 4417 25 14 38 31 24 30 6 12 7 12 36 4 Ukraine 15 4226 19 9 37 29 30 38 8 14 7 9 33 4 Lithuania 3 3939 26 13 36 35 22 35 6 10 9 6 33 4 Iran 29 3760 67 45 18 25 8 16 4 7 3 7 44 5 Hong Kong 2 3733 39 16 25 22 13 34 11 16 11 13 52 5 Slovenia 6 4256 25 9 34 29 26 38 10 14 6 10 41 6 United States 6 7743 36 14 27 22 19 34 8 16 11 15 54 6 Denmark 7 3364 25 9 29 24 32 37 10 18 4 13 44 7 Scotland 9 3882 30 11 29 20 21 33 8 19 13 17 56 7 Japan 2 4438 40 14 30 28 21 38 3 13 6 8 57 7 Norway 14 4009 22 7 33 23 24 36 12 19 9 14 48 7 New Zealand 12 4870 28 10 26 18 26 34 10 21 10 16 52 7 Chinese Tapei 2 4083 42 15 27 24 22 32 4 14 5 15 60 7 Singapore 4 4974 38 11 27 23 18 37 7 17 9 12 64 8 Australia 7 4037 21 6 27 15 30 36 9 23 12 20 55 9 Russian Fed. 2 4444 26 6 28 24 27 41 10 17 10 13 48 9 England 5 4262 34 10 31 19 17 33 8 20 11 18 73 9 Austria 6 4779 43 12 33 28 16 34 3 13 5 12 71 9 Netherlands 2 3199 28 8 42 26 20 41 3 15 7 10 72 9 Slovak Rep. 5 4897 40 9 30 30 18 39 4 13 8 9 62 10 Czech Rep. 6 4182 26 6 37 26 24 41 5 16 8 12 63 10 Hungary 5 3973 39 9 32 23 17 33 5 18 7 17 77 11 Germany 4 4451 36 8 38 25 15 36 7 17 4 14 82 12 Sweden 4 4559 33 6 27 19 24 35 11 21 5 19 70 13 Latvia 1 3816 35 6 35 20 11 42 8 18 11 14 87 na Total 23 156742 42 19 25 25 17 31 7 14 9 12 46 5
Note : This table compare distribution of frequencies between the « marginalized population » (group of students who are below the Low International benchmark) and the whole population. Because results are rounded to the nearest whole number, some totals may appear inconsistent. Two first columns represent the proportion of students who are below the Low International Benchmark and the number of students for which we have informations relative for the group used respectively. Columns “% Below LIB” represent percent of student in that group who are below the Low International Benchmark. Columns “% of Tot. Pop.” Represent the proportion of all students present in that group. A huge difference between these two columns for the same group may mean that there is a possible marginalisation. The degree of marginalization indexes show to what extent countries are marked by a specific marginalization. The more the index is high the more the marginalization will be important. For more information relative to the degrees of marginalization, see text. “na” means “not applicable”.
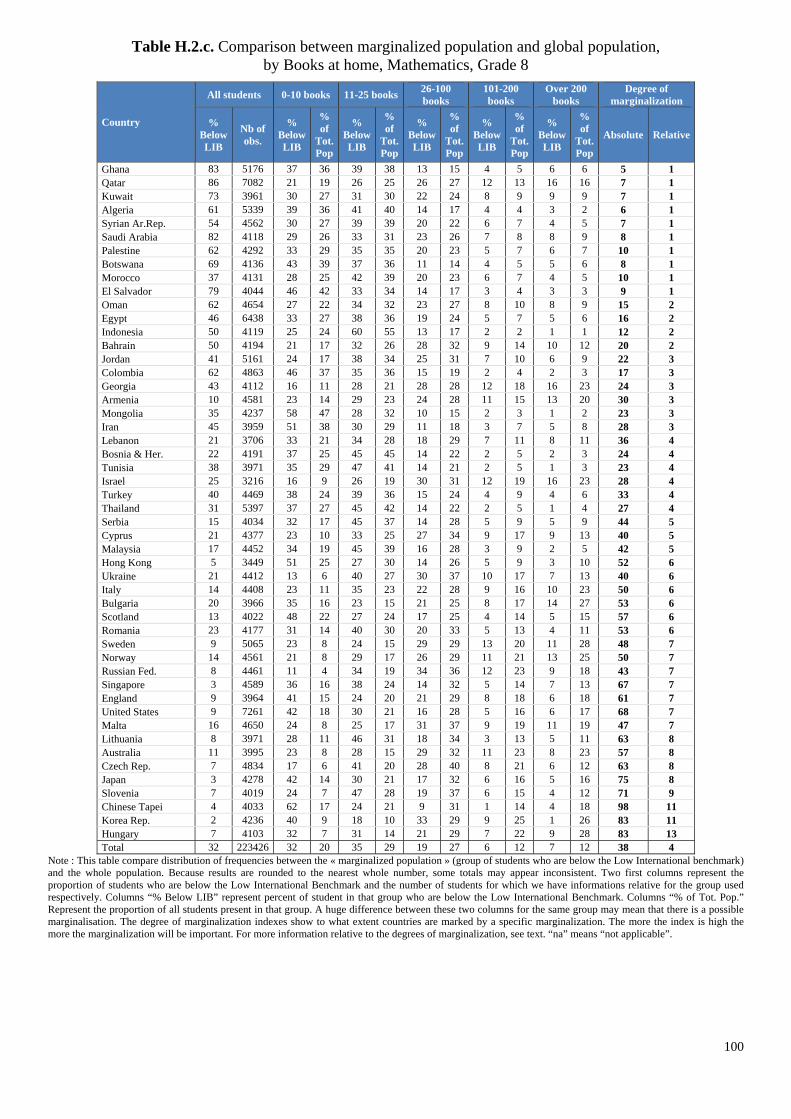
100
Table H.2.c. Comparison between marginalized population and global population, by Books at home, Mathematics, Grade 8
Country
All students 0-10 books 11-25 books 26-100 books
101-200 books
Over 200 books
Degree of marginalization
% Below LIB
Nb of obs.
% Below LIB
% of
Tot. Pop
% Below LIB
% of
Tot. Pop
% Below LIB
% of
Tot. Pop
% Below LIB
% of
Tot. Pop
% Below LIB
% of
Tot. Pop
Absolute Relative
Ghana 83 5176 37 36 39 38 13 15 4 5 6 6 5 1 Qatar 86 7082 21 19 26 25 26 27 12 13 16 16 7 1 Kuwait 73 3961 30 27 31 30 22 24 8 9 9 9 7 1 Algeria 61 5339 39 36 41 40 14 17 4 4 3 2 6 1 Syrian Ar.Rep. 54 4562 30 27 39 39 20 22 6 7 4 5 7 1 Saudi Arabia 82 4118 29 26 33 31 23 26 7 8 8 9 8 1 Palestine 62 4292 33 29 35 35 20 23 5 7 6 7 10 1 Botswana 69 4136 43 39 37 36 11 14 4 5 5 6 8 1 Morocco 37 4131 28 25 42 39 20 23 6 7 4 5 10 1 El Salvador 79 4044 46 42 33 34 14 17 3 4 3 3 9 1 Oman 62 4654 27 22 34 32 23 27 8 10 8 9 15 2 Egypt 46 6438 33 27 38 36 19 24 5 7 5 6 16 2 Indonesia 50 4119 25 24 60 55 13 17 2 2 1 1 12 2 Bahrain 50 4194 21 17 32 26 28 32 9 14 10 12 20 2 Jordan 41 5161 24 17 38 34 25 31 7 10 6 9 22 3 Colombia 62 4863 46 37 35 36 15 19 2 4 2 3 17 3 Georgia 43 4112 16 11 28 21 28 28 12 18 16 23 24 3 Armenia 10 4581 23 14 29 23 24 28 11 15 13 20 30 3 Mongolia 35 4237 58 47 28 32 10 15 2 3 1 2 23 3 Iran 45 3959 51 38 30 29 11 18 3 7 5 8 28 3 Lebanon 21 3706 33 21 34 28 18 29 7 11 8 11 36 4 Bosnia & Her. 22 4191 37 25 45 45 14 22 2 5 2 3 24 4 Tunisia 38 3971 35 29 47 41 14 21 2 5 1 3 23 4 Israel 25 3216 16 9 26 19 30 31 12 19 16 23 28 4 Turkey 40 4469 38 24 39 36 15 24 4 9 4 6 33 4 Thailand 31 5397 37 27 45 42 14 22 2 5 1 4 27 4 Serbia 15 4034 32 17 45 37 14 28 5 9 5 9 44 5 Cyprus 21 4377 23 10 33 25 27 34 9 17 9 13 40 5 Malaysia 17 4452 34 19 45 39 16 28 3 9 2 5 42 5 Hong Kong 5 3449 51 25 27 30 14 26 5 9 3 10 52 6 Ukraine 21 4412 13 6 40 27 30 37 10 17 7 13 40 6 Italy 14 4408 23 11 35 23 22 28 9 16 10 23 50 6 Bulgaria 20 3966 35 16 23 15 21 25 8 17 14 27 53 6 Scotland 13 4022 48 22 27 24 17 25 4 14 5 15 57 6 Romania 23 4177 31 14 40 30 20 33 5 13 4 11 53 6 Sweden 9 5065 23 8 24 15 29 29 13 20 11 28 48 7 Norway 14 4561 21 8 29 17 26 29 11 21 13 25 50 7 Russian Fed. 8 4461 11 4 34 19 34 36 12 23 9 18 43 7 Singapore 3 4589 36 16 38 24 14 32 5 14 7 13 67 7 England 9 3964 41 15 24 20 21 29 8 18 6 18 61 7 United States 9 7261 42 18 30 21 16 28 5 16 6 17 68 7 Malta 16 4650 24 8 25 17 31 37 9 19 11 19 47 7 Lithuania 8 3971 28 11 46 31 18 34 3 13 5 11 63 8 Australia 11 3995 23 8 28 15 29 32 11 23 8 23 57 8 Czech Rep. 7 4834 17 6 41 20 28 40 8 21 6 12 63 8 Japan 3 4278 42 14 30 21 17 32 6 16 5 16 75 8 Slovenia 7 4019 24 7 47 28 19 37 6 15 4 12 71 9 Chinese Tapei 4 4033 62 17 24 21 9 31 1 14 4 18 98 11 Korea Rep. 2 4236 40 9 18 10 33 29 9 25 1 26 83 11 Hungary 7 4103 32 7 31 14 21 29 7 22 9 28 83 13 Total 32 223426 32 20 35 29 19 27 6 12 7 12 38 4
Note : This table compare distribution of frequencies between the « marginalized population » (group of students who are below the Low International benchmark) and the whole population. Because results are rounded to the nearest whole number, some totals may appear inconsistent. Two first columns represent the proportion of students who are below the Low International Benchmark and the number of students for which we have informations relative for the group used respectively. Columns “% Below LIB” represent percent of student in that group who are below the Low International Benchmark. Columns “% of Tot. Pop.” Represent the proportion of all students present in that group. A huge difference between these two columns for the same group may mean that there is a possible marginalisation. The degree of marginalization indexes show to what extent countries are marked by a specific marginalization. The more the index is high the more the marginalization will be important. For more information relative to the degrees of marginalization, see text. “na” means “not applicable”.
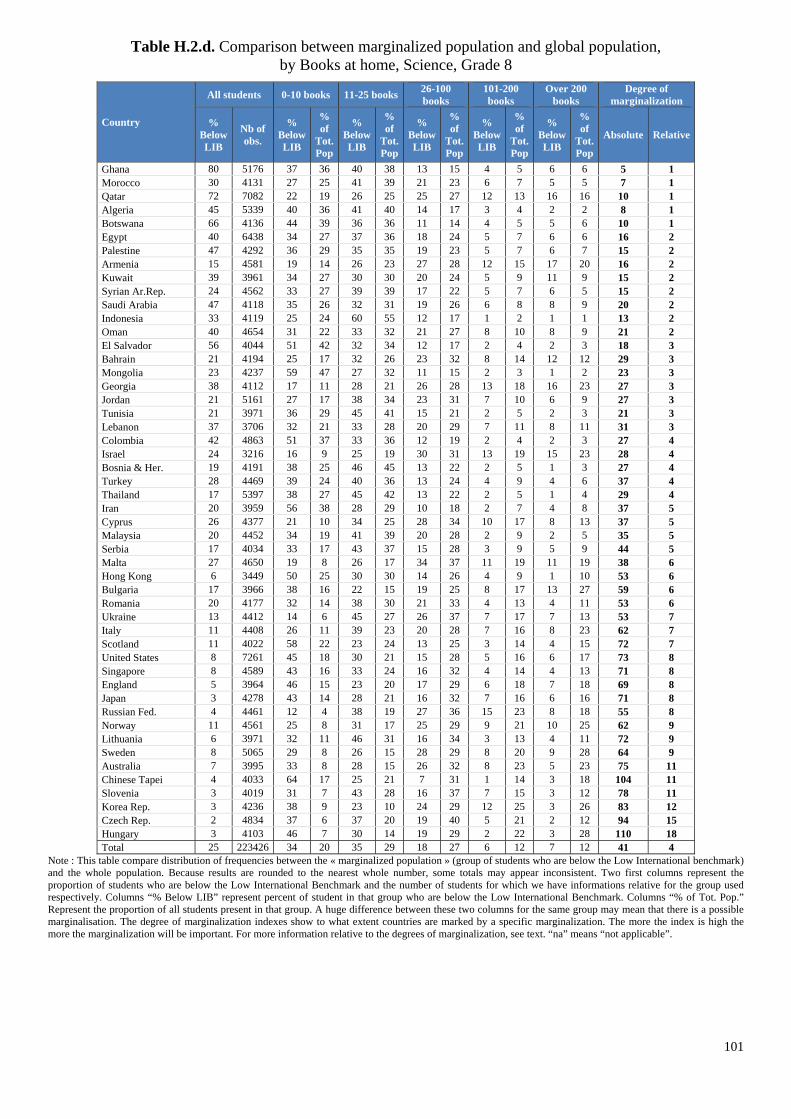
101
Table H.2.d. Comparison between marginalized population and global population, by Books at home, Science, Grade 8
Country
All students 0-10 books 11-25 books 26-100 books
101-200 books
Over 200 books
Degree of marginalization
% Below LIB
Nb of obs.
% Below LIB
% of
Tot. Pop
% Below LIB
% of
Tot. Pop
% Below LIB
% of
Tot. Pop
% Below LIB
% of
Tot. Pop
% Below LIB
% of
Tot. Pop
Absolute Relative
Ghana 80 5176 37 36 40 38 13 15 4 5 6 6 5 1 Morocco 30 4131 27 25 41 39 21 23 6 7 5 5 7 1 Qatar 72 7082 22 19 26 25 25 27 12 13 16 16 10 1 Algeria 45 5339 40 36 41 40 14 17 3 4 2 2 8 1 Botswana 66 4136 44 39 36 36 11 14 4 5 5 6 10 1 Egypt 40 6438 34 27 37 36 18 24 5 7 6 6 16 2 Palestine 47 4292 36 29 35 35 19 23 5 7 6 7 15 2 Armenia 15 4581 19 14 26 23 27 28 12 15 17 20 16 2 Kuwait 39 3961 34 27 30 30 20 24 5 9 11 9 15 2 Syrian Ar.Rep. 24 4562 33 27 39 39 17 22 5 7 6 5 15 2 Saudi Arabia 47 4118 35 26 32 31 19 26 6 8 8 9 20 2 Indonesia 33 4119 25 24 60 55 12 17 1 2 1 1 13 2 Oman 40 4654 31 22 33 32 21 27 8 10 8 9 21 2 El Salvador 56 4044 51 42 32 34 12 17 2 4 2 3 18 3 Bahrain 21 4194 25 17 32 26 23 32 8 14 12 12 29 3 Mongolia 23 4237 59 47 27 32 11 15 2 3 1 2 23 3 Georgia 38 4112 17 11 28 21 26 28 13 18 16 23 27 3 Jordan 21 5161 27 17 38 34 23 31 7 10 6 9 27 3 Tunisia 21 3971 36 29 45 41 15 21 2 5 2 3 21 3 Lebanon 37 3706 32 21 33 28 20 29 7 11 8 11 31 3 Colombia 42 4863 51 37 33 36 12 19 2 4 2 3 27 4 Israel 24 3216 16 9 25 19 30 31 13 19 15 23 28 4 Bosnia & Her. 19 4191 38 25 46 45 13 22 2 5 1 3 27 4 Turkey 28 4469 39 24 40 36 13 24 4 9 4 6 37 4 Thailand 17 5397 38 27 45 42 13 22 2 5 1 4 29 4 Iran 20 3959 56 38 28 29 10 18 2 7 4 8 37 5 Cyprus 26 4377 21 10 34 25 28 34 10 17 8 13 37 5 Malaysia 20 4452 34 19 41 39 20 28 2 9 2 5 35 5 Serbia 17 4034 33 17 43 37 15 28 3 9 5 9 44 5 Malta 27 4650 19 8 26 17 34 37 11 19 11 19 38 6 Hong Kong 6 3449 50 25 30 30 14 26 4 9 1 10 53 6 Bulgaria 17 3966 38 16 22 15 19 25 8 17 13 27 59 6 Romania 20 4177 32 14 38 30 21 33 4 13 4 11 53 6 Ukraine 13 4412 14 6 45 27 26 37 7 17 7 13 53 7 Italy 11 4408 26 11 39 23 20 28 7 16 8 23 62 7 Scotland 11 4022 58 22 23 24 13 25 3 14 4 15 72 7 United States 8 7261 45 18 30 21 15 28 5 16 6 17 73 8 Singapore 8 4589 43 16 33 24 16 32 4 14 4 13 71 8 England 5 3964 46 15 23 20 17 29 6 18 7 18 69 8 Japan 3 4278 43 14 28 21 16 32 7 16 6 16 71 8 Russian Fed. 4 4461 12 4 38 19 27 36 15 23 8 18 55 8 Norway 11 4561 25 8 31 17 25 29 9 21 10 25 62 9 Lithuania 6 3971 32 11 46 31 16 34 3 13 4 11 72 9 Sweden 8 5065 29 8 26 15 28 29 8 20 9 28 64 9 Australia 7 3995 33 8 28 15 26 32 8 23 5 23 75 11 Chinese Tapei 4 4033 64 17 25 21 7 31 1 14 3 18 104 11 Slovenia 3 4019 31 7 43 28 16 37 7 15 3 12 78 11 Korea Rep. 3 4236 38 9 23 10 24 29 12 25 3 26 83 12 Czech Rep. 2 4834 37 6 37 20 19 40 5 21 2 12 94 15 Hungary 3 4103 46 7 30 14 19 29 2 22 3 28 110 18 Total 25 223426 34 20 35 29 18 27 6 12 7 12 41 4
Note : This table compare distribution of frequencies between the « marginalized population » (group of students who are below the Low International benchmark) and the whole population. Because results are rounded to the nearest whole number, some totals may appear inconsistent. Two first columns represent the proportion of students who are below the Low International Benchmark and the number of students for which we have informations relative for the group used respectively. Columns “% Below LIB” represent percent of student in that group who are below the Low International Benchmark. Columns “% of Tot. Pop.” Represent the proportion of all students present in that group. A huge difference between these two columns for the same group may mean that there is a possible marginalisation. The degree of marginalization indexes show to what extent countries are marked by a specific marginalization. The more the index is high the more the marginalization will be important. For more information relative to the degrees of marginalization, see text. “na” means “not applicable”.
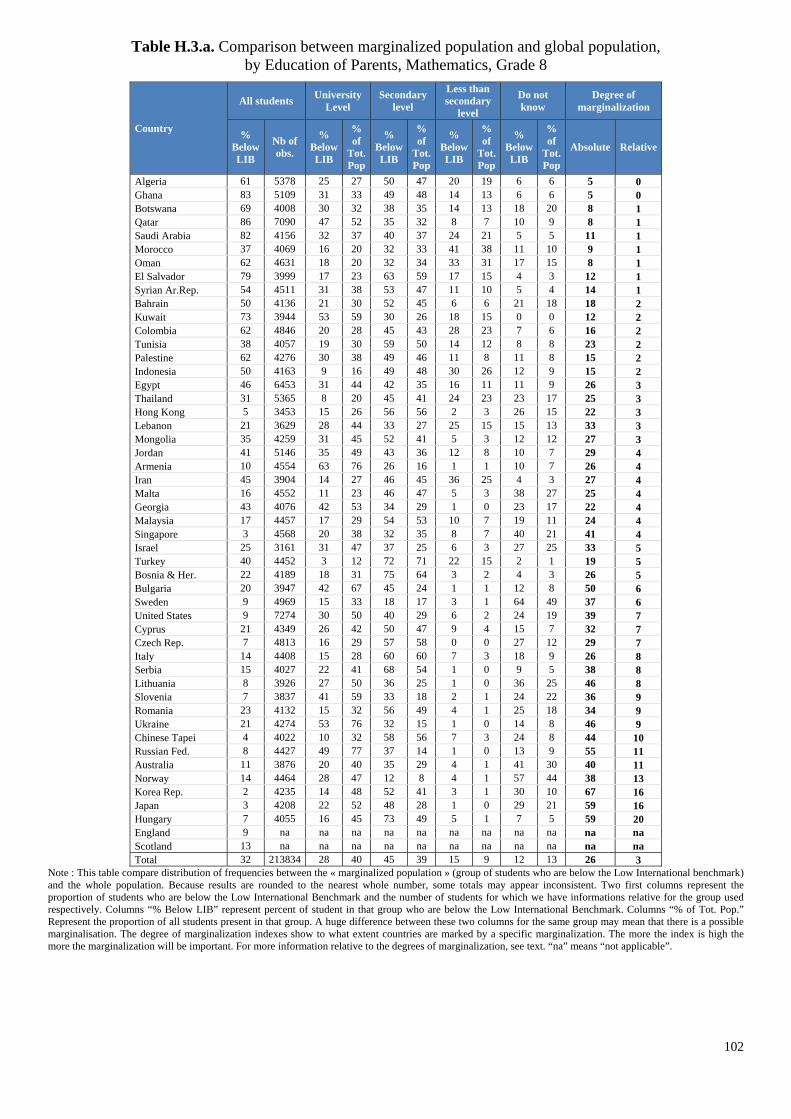
102
Table H.3.a. Comparison between marginalized population and global population, by Education of Parents, Mathematics, Grade 8
Country
All students University Level
Secondary level
Less than secondary
level
Do not know
Degree of marginalization
% Below LIB
Nb of obs.
% Below LIB
% of
Tot. Pop
% Below LIB
% of
Tot. Pop
% Below LIB
% of
Tot. Pop
% Below LIB
% of
Tot. Pop
Absolute Relative
Algeria 61 5378 25 27 50 47 20 19 6 6 5 0 Ghana 83 5109 31 33 49 48 14 13 6 6 5 0 Botswana 69 4008 30 32 38 35 14 13 18 20 8 1 Qatar 86 7090 47 52 35 32 8 7 10 9 8 1 Saudi Arabia 82 4156 32 37 40 37 24 21 5 5 11 1 Morocco 37 4069 16 20 32 33 41 38 11 10 9 1 Oman 62 4631 18 20 32 34 33 31 17 15 8 1 El Salvador 79 3999 17 23 63 59 17 15 4 3 12 1 Syrian Ar.Rep. 54 4511 31 38 53 47 11 10 5 4 14 1 Bahrain 50 4136 21 30 52 45 6 6 21 18 18 2 Kuwait 73 3944 53 59 30 26 18 15 0 0 12 2 Colombia 62 4846 20 28 45 43 28 23 7 6 16 2 Tunisia 38 4057 19 30 59 50 14 12 8 8 23 2 Palestine 62 4276 30 38 49 46 11 8 11 8 15 2 Indonesia 50 4163 9 16 49 48 30 26 12 9 15 2 Egypt 46 6453 31 44 42 35 16 11 11 9 26 3 Thailand 31 5365 8 20 45 41 24 23 23 17 25 3 Hong Kong 5 3453 15 26 56 56 2 3 26 15 22 3 Lebanon 21 3629 28 44 33 27 25 15 15 13 33 3 Mongolia 35 4259 31 45 52 41 5 3 12 12 27 3 Jordan 41 5146 35 49 43 36 12 8 10 7 29 4 Armenia 10 4554 63 76 26 16 1 1 10 7 26 4 Iran 45 3904 14 27 46 45 36 25 4 3 27 4 Malta 16 4552 11 23 46 47 5 3 38 27 25 4 Georgia 43 4076 42 53 34 29 1 0 23 17 22 4 Malaysia 17 4457 17 29 54 53 10 7 19 11 24 4 Singapore 3 4568 20 38 32 35 8 7 40 21 41 4 Israel 25 3161 31 47 37 25 6 3 27 25 33 5 Turkey 40 4452 3 12 72 71 22 15 2 1 19 5 Bosnia & Her. 22 4189 18 31 75 64 3 2 4 3 26 5 Bulgaria 20 3947 42 67 45 24 1 1 12 8 50 6 Sweden 9 4969 15 33 18 17 3 1 64 49 37 6 United States 9 7274 30 50 40 29 6 2 24 19 39 7 Cyprus 21 4349 26 42 50 47 9 4 15 7 32 7 Czech Rep. 7 4813 16 29 57 58 0 0 27 12 29 7 Italy 14 4408 15 28 60 60 7 3 18 9 26 8 Serbia 15 4027 22 41 68 54 1 0 9 5 38 8 Lithuania 8 3926 27 50 36 25 1 0 36 25 46 8 Slovenia 7 3837 41 59 33 18 2 1 24 22 36 9 Romania 23 4132 15 32 56 49 4 1 25 18 34 9 Ukraine 21 4274 53 76 32 15 1 0 14 8 46 9 Chinese Tapei 4 4022 10 32 58 56 7 3 24 8 44 10 Russian Fed. 8 4427 49 77 37 14 1 0 13 9 55 11 Australia 11 3876 20 40 35 29 4 1 41 30 40 11 Norway 14 4464 28 47 12 8 4 1 57 44 38 13 Korea Rep. 2 4235 14 48 52 41 3 1 30 10 67 16 Japan 3 4208 22 52 48 28 1 0 29 21 59 16 Hungary 7 4055 16 45 73 49 5 1 7 5 59 20 England 9 na na na na na na na na na na na Scotland 13 na na na na na na na na na na na Total 32 213834 28 40 45 39 15 9 12 13 26 3
Note : This table compare distribution of frequencies between the « marginalized population » (group of students who are below the Low International benchmark) and the whole population. Because results are rounded to the nearest whole number, some totals may appear inconsistent. Two first columns represent the proportion of students who are below the Low International Benchmark and the number of students for which we have informations relative for the group used respectively. Columns “% Below LIB” represent percent of student in that group who are below the Low International Benchmark. Columns “% of Tot. Pop.” Represent the proportion of all students present in that group. A huge difference between these two columns for the same group may mean that there is a possible marginalisation. The degree of marginalization indexes show to what extent countries are marked by a specific marginalization. The more the index is high the more the marginalization will be important. For more information relative to the degrees of marginalization, see text. “na” means “not applicable”.
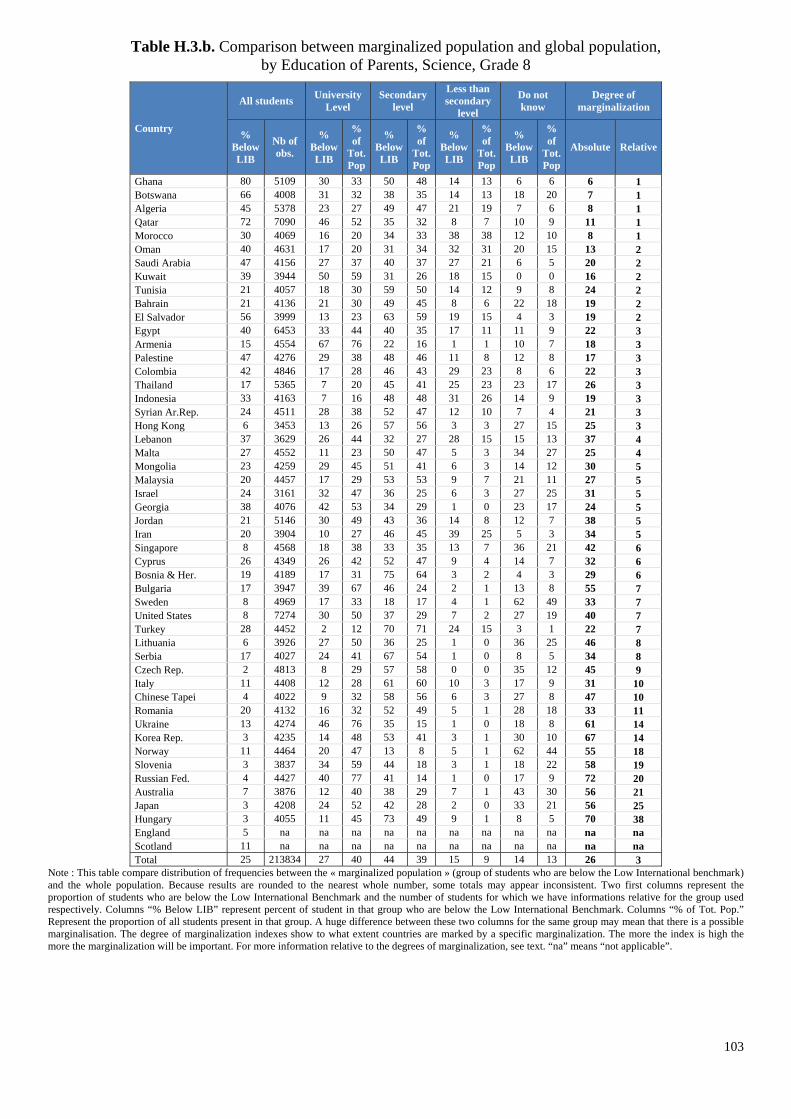
103
Table H.3.b. Comparison between marginalized population and global population, by Education of Parents, Science, Grade 8
Country
All students University Level
Secondary level
Less than secondary
level
Do not know
Degree of marginalization
% Below LIB
Nb of obs.
% Below LIB
% of
Tot. Pop
% Below LIB
% of
Tot. Pop
% Below LIB
% of
Tot. Pop
% Below LIB
% of
Tot. Pop
Absolute Relative
Ghana 80 5109 30 33 50 48 14 13 6 6 6 1 Botswana 66 4008 31 32 38 35 14 13 18 20 7 1 Algeria 45 5378 23 27 49 47 21 19 7 6 8 1 Qatar 72 7090 46 52 35 32 8 7 10 9 11 1 Morocco 30 4069 16 20 34 33 38 38 12 10 8 1 Oman 40 4631 17 20 31 34 32 31 20 15 13 2 Saudi Arabia 47 4156 27 37 40 37 27 21 6 5 20 2 Kuwait 39 3944 50 59 31 26 18 15 0 0 16 2 Tunisia 21 4057 18 30 59 50 14 12 9 8 24 2 Bahrain 21 4136 21 30 49 45 8 6 22 18 19 2 El Salvador 56 3999 13 23 63 59 19 15 4 3 19 2 Egypt 40 6453 33 44 40 35 17 11 11 9 22 3 Armenia 15 4554 67 76 22 16 1 1 10 7 18 3 Palestine 47 4276 29 38 48 46 11 8 12 8 17 3 Colombia 42 4846 17 28 46 43 29 23 8 6 22 3 Thailand 17 5365 7 20 45 41 25 23 23 17 26 3 Indonesia 33 4163 7 16 48 48 31 26 14 9 19 3 Syrian Ar.Rep. 24 4511 28 38 52 47 12 10 7 4 21 3 Hong Kong 6 3453 13 26 57 56 3 3 27 15 25 3 Lebanon 37 3629 26 44 32 27 28 15 15 13 37 4 Malta 27 4552 11 23 50 47 5 3 34 27 25 4 Mongolia 23 4259 29 45 51 41 6 3 14 12 30 5 Malaysia 20 4457 17 29 53 53 9 7 21 11 27 5 Israel 24 3161 32 47 36 25 6 3 27 25 31 5 Georgia 38 4076 42 53 34 29 1 0 23 17 24 5 Jordan 21 5146 30 49 43 36 14 8 12 7 38 5 Iran 20 3904 10 27 46 45 39 25 5 3 34 5 Singapore 8 4568 18 38 33 35 13 7 36 21 42 6 Cyprus 26 4349 26 42 52 47 9 4 14 7 32 6 Bosnia & Her. 19 4189 17 31 75 64 3 2 4 3 29 6 Bulgaria 17 3947 39 67 46 24 2 1 13 8 55 7 Sweden 8 4969 17 33 18 17 4 1 62 49 33 7 United States 8 7274 30 50 37 29 7 2 27 19 40 7 Turkey 28 4452 2 12 70 71 24 15 3 1 22 7 Lithuania 6 3926 27 50 36 25 1 0 36 25 46 8 Serbia 17 4027 24 41 67 54 1 0 8 5 34 8 Czech Rep. 2 4813 8 29 57 58 0 0 35 12 45 9 Italy 11 4408 12 28 61 60 10 3 17 9 31 10 Chinese Tapei 4 4022 9 32 58 56 6 3 27 8 47 10 Romania 20 4132 16 32 52 49 5 1 28 18 33 11 Ukraine 13 4274 46 76 35 15 1 0 18 8 61 14 Korea Rep. 3 4235 14 48 53 41 3 1 30 10 67 14 Norway 11 4464 20 47 13 8 5 1 62 44 55 18 Slovenia 3 3837 34 59 44 18 3 1 18 22 58 19 Russian Fed. 4 4427 40 77 41 14 1 0 17 9 72 20 Australia 7 3876 12 40 38 29 7 1 43 30 56 21 Japan 3 4208 24 52 42 28 2 0 33 21 56 25 Hungary 3 4055 11 45 73 49 9 1 8 5 70 38 England 5 na na na na na na na na na na na Scotland 11 na na na na na na na na na na na Total 25 213834 27 40 44 39 15 9 14 13 26 3
Note : This table compare distribution of frequencies between the « marginalized population » (group of students who are below the Low International benchmark) and the whole population. Because results are rounded to the nearest whole number, some totals may appear inconsistent. Two first columns represent the proportion of students who are below the Low International Benchmark and the number of students for which we have informations relative for the group used respectively. Columns “% Below LIB” represent percent of student in that group who are below the Low International Benchmark. Columns “% of Tot. Pop.” Represent the proportion of all students present in that group. A huge difference between these two columns for the same group may mean that there is a possible marginalisation. The degree of marginalization indexes show to what extent countries are marked by a specific marginalization. The more the index is high the more the marginalization will be important. For more information relative to the degrees of marginalization, see text. “na” means “not applicable”.
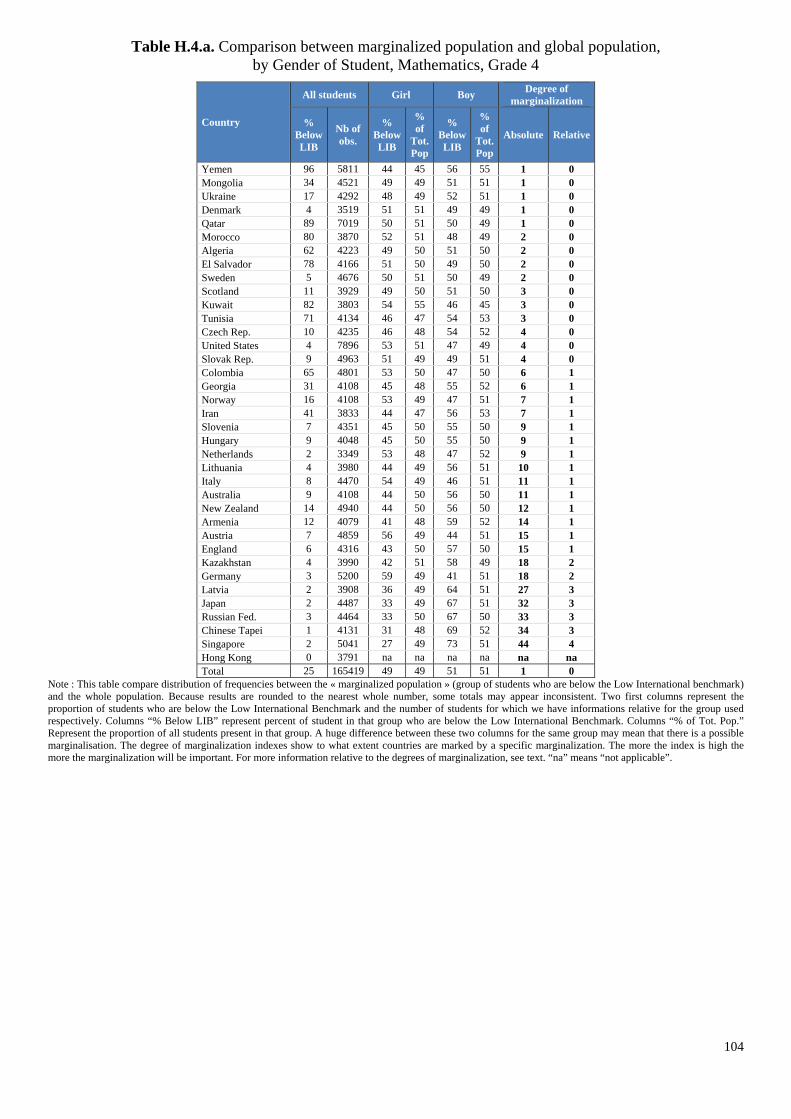
104
Table H.4.a. Comparison between marginalized population and global population, by Gender of Student, Mathematics, Grade 4
Country
All students Girl Boy Degree of marginalization
% Below LIB
Nb of obs.
% Below LIB
% of
Tot. Pop
% Below LIB
% of
Tot. Pop
Absolute Relative
Yemen 96 5811 44 45 56 55 1 0 Mongolia 34 4521 49 49 51 51 1 0 Ukraine 17 4292 48 49 52 51 1 0 Denmark 4 3519 51 51 49 49 1 0 Qatar 89 7019 50 51 50 49 1 0 Morocco 80 3870 52 51 48 49 2 0 Algeria 62 4223 49 50 51 50 2 0 El Salvador 78 4166 51 50 49 50 2 0 Sweden 5 4676 50 51 50 49 2 0 Scotland 11 3929 49 50 51 50 3 0 Kuwait 82 3803 54 55 46 45 3 0 Tunisia 71 4134 46 47 54 53 3 0 Czech Rep. 10 4235 46 48 54 52 4 0 United States 4 7896 53 51 47 49 4 0 Slovak Rep. 9 4963 51 49 49 51 4 0 Colombia 65 4801 53 50 47 50 6 1 Georgia 31 4108 45 48 55 52 6 1 Norway 16 4108 53 49 47 51 7 1 Iran 41 3833 44 47 56 53 7 1 Slovenia 7 4351 45 50 55 50 9 1 Hungary 9 4048 45 50 55 50 9 1 Netherlands 2 3349 53 48 47 52 9 1 Lithuania 4 3980 44 49 56 51 10 1 Italy 8 4470 54 49 46 51 11 1 Australia 9 4108 44 50 56 50 11 1 New Zealand 14 4940 44 50 56 50 12 1 Armenia 12 4079 41 48 59 52 14 1 Austria 7 4859 56 49 44 51 15 1 England 6 4316 43 50 57 50 15 1 Kazakhstan 4 3990 42 51 58 49 18 2 Germany 3 5200 59 49 41 51 18 2 Latvia 2 3908 36 49 64 51 27 3 Japan 2 4487 33 49 67 51 32 3 Russian Fed. 3 4464 33 50 67 50 33 3 Chinese Tapei 1 4131 31 48 69 52 34 3 Singapore 2 5041 27 49 73 51 44 4 Hong Kong 0 3791 na na na na na na Total 25 165419 49 49 51 51 1 0
Note : This table compare distribution of frequencies between the « marginalized population » (group of students who are below the Low International benchmark) and the whole population. Because results are rounded to the nearest whole number, some totals may appear inconsistent. Two first columns represent the proportion of students who are below the Low International Benchmark and the number of students for which we have informations relative for the group used respectively. Columns “% Below LIB” represent percent of student in that group who are below the Low International Benchmark. Columns “% of Tot. Pop.” Represent the proportion of all students present in that group. A huge difference between these two columns for the same group may mean that there is a possible marginalisation. The degree of marginalization indexes show to what extent countries are marked by a specific marginalization. The more the index is high the more the marginalization will be important. For more information relative to the degrees of marginalization, see text. “na” means “not applicable”.
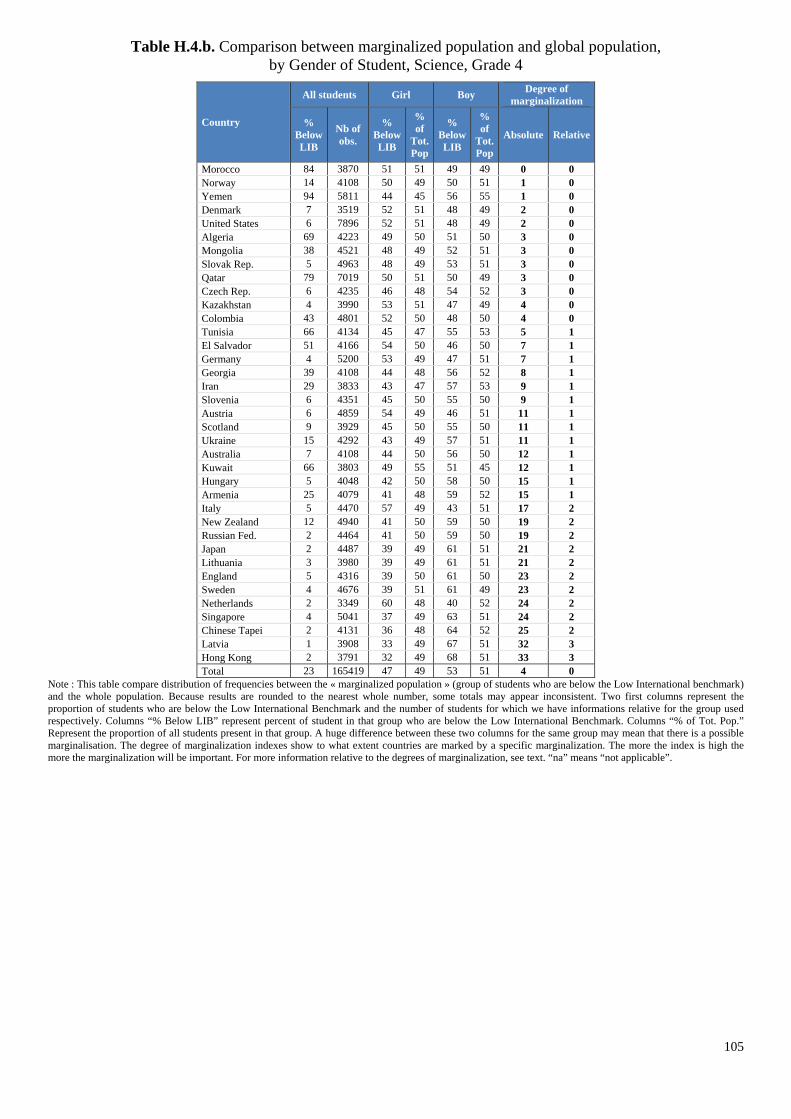
105
Table H.4.b. Comparison between marginalized population and global population, by Gender of Student, Science, Grade 4
Country
All students Girl Boy Degree of marginalization
% Below LIB
Nb of obs.
% Below LIB
% of
Tot. Pop
% Below LIB
% of
Tot. Pop
Absolute Relative
Morocco 84 3870 51 51 49 49 0 0 Norway 14 4108 50 49 50 51 1 0 Yemen 94 5811 44 45 56 55 1 0 Denmark 7 3519 52 51 48 49 2 0 United States 6 7896 52 51 48 49 2 0 Algeria 69 4223 49 50 51 50 3 0 Mongolia 38 4521 48 49 52 51 3 0 Slovak Rep. 5 4963 48 49 53 51 3 0 Qatar 79 7019 50 51 50 49 3 0 Czech Rep. 6 4235 46 48 54 52 3 0 Kazakhstan 4 3990 53 51 47 49 4 0 Colombia 43 4801 52 50 48 50 4 0 Tunisia 66 4134 45 47 55 53 5 1 El Salvador 51 4166 54 50 46 50 7 1 Germany 4 5200 53 49 47 51 7 1 Georgia 39 4108 44 48 56 52 8 1 Iran 29 3833 43 47 57 53 9 1 Slovenia 6 4351 45 50 55 50 9 1 Austria 6 4859 54 49 46 51 11 1 Scotland 9 3929 45 50 55 50 11 1 Ukraine 15 4292 43 49 57 51 11 1 Australia 7 4108 44 50 56 50 12 1 Kuwait 66 3803 49 55 51 45 12 1 Hungary 5 4048 42 50 58 50 15 1 Armenia 25 4079 41 48 59 52 15 1 Italy 5 4470 57 49 43 51 17 2 New Zealand 12 4940 41 50 59 50 19 2 Russian Fed. 2 4464 41 50 59 50 19 2 Japan 2 4487 39 49 61 51 21 2 Lithuania 3 3980 39 49 61 51 21 2 England 5 4316 39 50 61 50 23 2 Sweden 4 4676 39 51 61 49 23 2 Netherlands 2 3349 60 48 40 52 24 2 Singapore 4 5041 37 49 63 51 24 2 Chinese Tapei 2 4131 36 48 64 52 25 2 Latvia 1 3908 33 49 67 51 32 3 Hong Kong 2 3791 32 49 68 51 33 3 Total 23 165419 47 49 53 51 4 0
Note : This table compare distribution of frequencies between the « marginalized population » (group of students who are below the Low International benchmark) and the whole population. Because results are rounded to the nearest whole number, some totals may appear inconsistent. Two first columns represent the proportion of students who are below the Low International Benchmark and the number of students for which we have informations relative for the group used respectively. Columns “% Below LIB” represent percent of student in that group who are below the Low International Benchmark. Columns “% of Tot. Pop.” Represent the proportion of all students present in that group. A huge difference between these two columns for the same group may mean that there is a possible marginalisation. The degree of marginalization indexes show to what extent countries are marked by a specific marginalization. The more the index is high the more the marginalization will be important. For more information relative to the degrees of marginalization, see text. “na” means “not applicable”.

106
Table H.4.c. Comparison between marginalized population and global population, by Gender of Student, Mathematics, Grade 8
Country
All students Girl Boy Degree of marginalization
% Below LIB
Nb of obs.
% Below LIB
% of
Tot. Pop
% Below LIB
% of
Tot. Pop
Absolute Relative
Scotland 13 4070 50 51 50 49 1 0 Hungary 7 4111 51 50 49 50 2 0 Georgia 43 4178 50 51 50 49 2 0 Iran 45 3981 44 45 56 55 2 0 Turkey 40 4498 45 47 55 53 2 0 Australia 11 4069 46 45 54 55 2 0 Indonesia 50 4203 51 52 49 48 3 0 United States 9 7377 49 50 51 50 3 0 Italy 14 4408 49 48 51 52 3 0 Algeria 61 5447 51 49 49 51 3 0 England 9 4025 50 52 50 48 3 0 Armenia 10 4689 48 49 52 51 3 0 Ghana 83 5294 47 46 53 54 3 0 Botswana 69 4208 50 52 50 48 3 0 Saudi Arabia 82 4243 51 52 49 48 3 0 Bosnia & Her. 22 4220 47 49 53 51 3 0 Czech Rep. 7 4845 46 48 54 52 3 0 Qatar 86 7184 49 51 51 49 4 0 Japan 3 4312 48 50 52 50 4 0 Kuwait 73 4091 53 56 47 44 4 0 El Salvador 79 4063 55 53 45 47 5 0 Malta 16 4670 48 51 52 49 5 1 Mongolia 35 4493 54 51 46 49 5 1 Morocco 37 5016 53 50 47 50 6 1 Slovenia 7 4043 47 50 53 50 6 1 Egypt 46 6582 46 49 54 51 7 1 Korea Rep. 2 4240 44 48 56 52 7 1 Israel 25 3293 49 53 51 47 8 1 Lebanon 21 3786 58 54 42 46 8 1 Norway 14 4627 44 49 56 51 10 1 Sweden 9 5215 43 48 57 52 10 1 Ukraine 21 4424 47 52 53 48 10 1 Syrian Ar.Rep. 54 4650 56 50 44 50 11 1 Palestine 62 4378 48 54 52 46 12 1 Serbia 15 4045 43 49 57 51 13 1 Jordan 41 5251 47 53 53 47 13 1 Romania 23 4198 43 50 57 50 14 1 Lithuania 8 3991 43 51 57 49 15 1 Colombia 62 4873 58 51 42 49 15 1 Bulgaria 20 4019 43 51 57 49 15 2 Bahrain 50 4230 39 47 61 53 16 2 Oman 62 4752 38 47 62 53 18 2 Tunisia 38 4080 61 52 39 48 19 2 Thailand 31 5412 45 55 55 45 19 2 Malaysia 17 4466 43 53 57 47 19 2 Russian Fed. 8 4472 42 52 58 48 20 2 Cyprus 21 4399 40 50 60 50 20 2 Hong Kong 5 3470 39 50 61 50 24 2 Chinese Tapei 4 4046 36 48 64 52 25 2 Singapore 3 4599 34 49 66 51 31 3 Total 32 227236 49 50 51 50 3 0
Note : This table compare distribution of frequencies between the « marginalized population » (group of students who are below the Low International benchmark) and the whole population. Because results are rounded to the nearest whole number, some totals may appear inconsistent. Two first columns represent the proportion of students who are below the Low International Benchmark and the number of students for which we have informations relative for the group used respectively. Columns “% Below LIB” represent percent of student in that group who are below the Low International Benchmark. Columns “% of Tot. Pop.” Represent the proportion of all students present in that group. A huge difference between these two columns for the same group may mean that there is a possible marginalisation. The degree of marginalization indexes show to what extent countries are marked by a specific marginalization. The more the index is high the more the marginalization will be important. For more information relative to the degrees of marginalization, see text. “na” means “not applicable”.
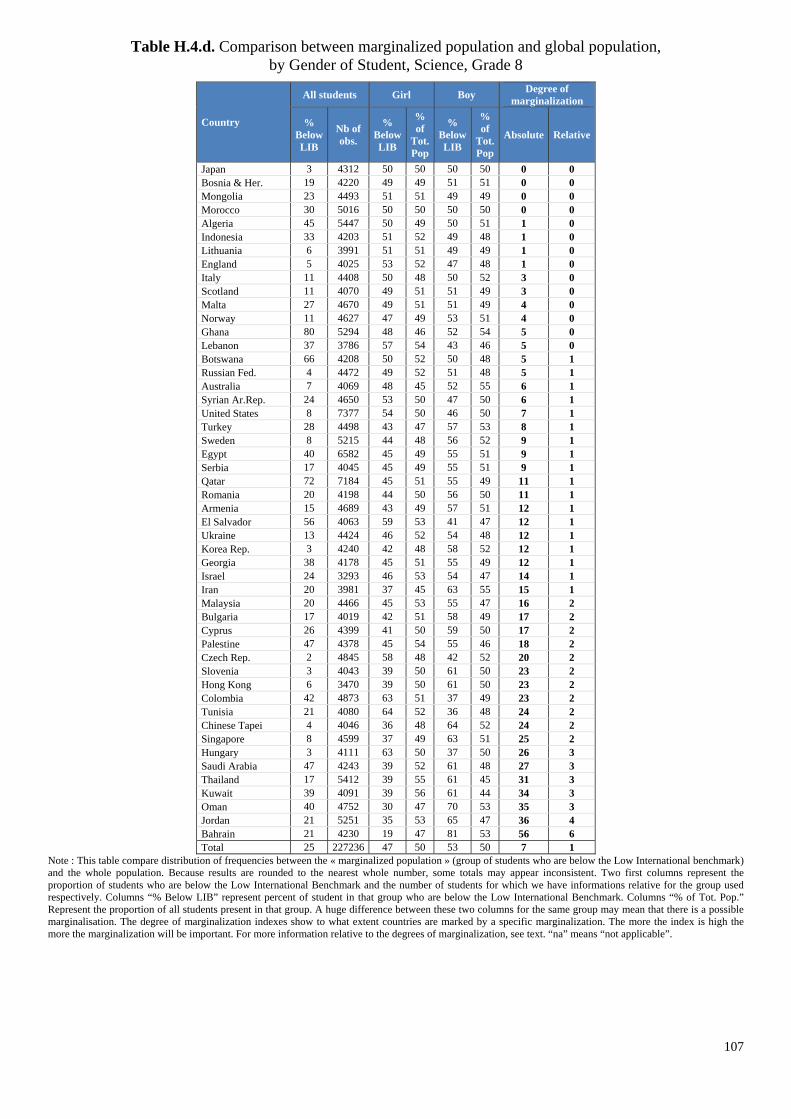
107
Table H.4.d. Comparison between marginalized population and global population, by Gender of Student, Science, Grade 8
Country
All students Girl Boy Degree of marginalization
% Below LIB
Nb of obs.
% Below LIB
% of
Tot. Pop
% Below LIB
% of
Tot. Pop
Absolute Relative
Japan 3 4312 50 50 50 50 0 0 Bosnia & Her. 19 4220 49 49 51 51 0 0 Mongolia 23 4493 51 51 49 49 0 0 Morocco 30 5016 50 50 50 50 0 0 Algeria 45 5447 50 49 50 51 1 0 Indonesia 33 4203 51 52 49 48 1 0 Lithuania 6 3991 51 51 49 49 1 0 England 5 4025 53 52 47 48 1 0 Italy 11 4408 50 48 50 52 3 0 Scotland 11 4070 49 51 51 49 3 0 Malta 27 4670 49 51 51 49 4 0 Norway 11 4627 47 49 53 51 4 0 Ghana 80 5294 48 46 52 54 5 0 Lebanon 37 3786 57 54 43 46 5 0 Botswana 66 4208 50 52 50 48 5 1 Russian Fed. 4 4472 49 52 51 48 5 1 Australia 7 4069 48 45 52 55 6 1 Syrian Ar.Rep. 24 4650 53 50 47 50 6 1 United States 8 7377 54 50 46 50 7 1 Turkey 28 4498 43 47 57 53 8 1 Sweden 8 5215 44 48 56 52 9 1 Egypt 40 6582 45 49 55 51 9 1 Serbia 17 4045 45 49 55 51 9 1 Qatar 72 7184 45 51 55 49 11 1 Romania 20 4198 44 50 56 50 11 1 Armenia 15 4689 43 49 57 51 12 1 El Salvador 56 4063 59 53 41 47 12 1 Ukraine 13 4424 46 52 54 48 12 1 Korea Rep. 3 4240 42 48 58 52 12 1 Georgia 38 4178 45 51 55 49 12 1 Israel 24 3293 46 53 54 47 14 1 Iran 20 3981 37 45 63 55 15 1 Malaysia 20 4466 45 53 55 47 16 2 Bulgaria 17 4019 42 51 58 49 17 2 Cyprus 26 4399 41 50 59 50 17 2 Palestine 47 4378 45 54 55 46 18 2 Czech Rep. 2 4845 58 48 42 52 20 2 Slovenia 3 4043 39 50 61 50 23 2 Hong Kong 6 3470 39 50 61 50 23 2 Colombia 42 4873 63 51 37 49 23 2 Tunisia 21 4080 64 52 36 48 24 2 Chinese Tapei 4 4046 36 48 64 52 24 2 Singapore 8 4599 37 49 63 51 25 2 Hungary 3 4111 63 50 37 50 26 3 Saudi Arabia 47 4243 39 52 61 48 27 3 Thailand 17 5412 39 55 61 45 31 3 Kuwait 39 4091 39 56 61 44 34 3 Oman 40 4752 30 47 70 53 35 3 Jordan 21 5251 35 53 65 47 36 4 Bahrain 21 4230 19 47 81 53 56 6 Total 25 227236 47 50 53 50 7 1
Note : This table compare distribution of frequencies between the « marginalized population » (group of students who are below the Low International benchmark) and the whole population. Because results are rounded to the nearest whole number, some totals may appear inconsistent. Two first columns represent the proportion of students who are below the Low International Benchmark and the number of students for which we have informations relative for the group used respectively. Columns “% Below LIB” represent percent of student in that group who are below the Low International Benchmark. Columns “% of Tot. Pop.” Represent the proportion of all students present in that group. A huge difference between these two columns for the same group may mean that there is a possible marginalisation. The degree of marginalization indexes show to what extent countries are marked by a specific marginalization. The more the index is high the more the marginalization will be important. For more information relative to the degrees of marginalization, see text. “na” means “not applicable”.
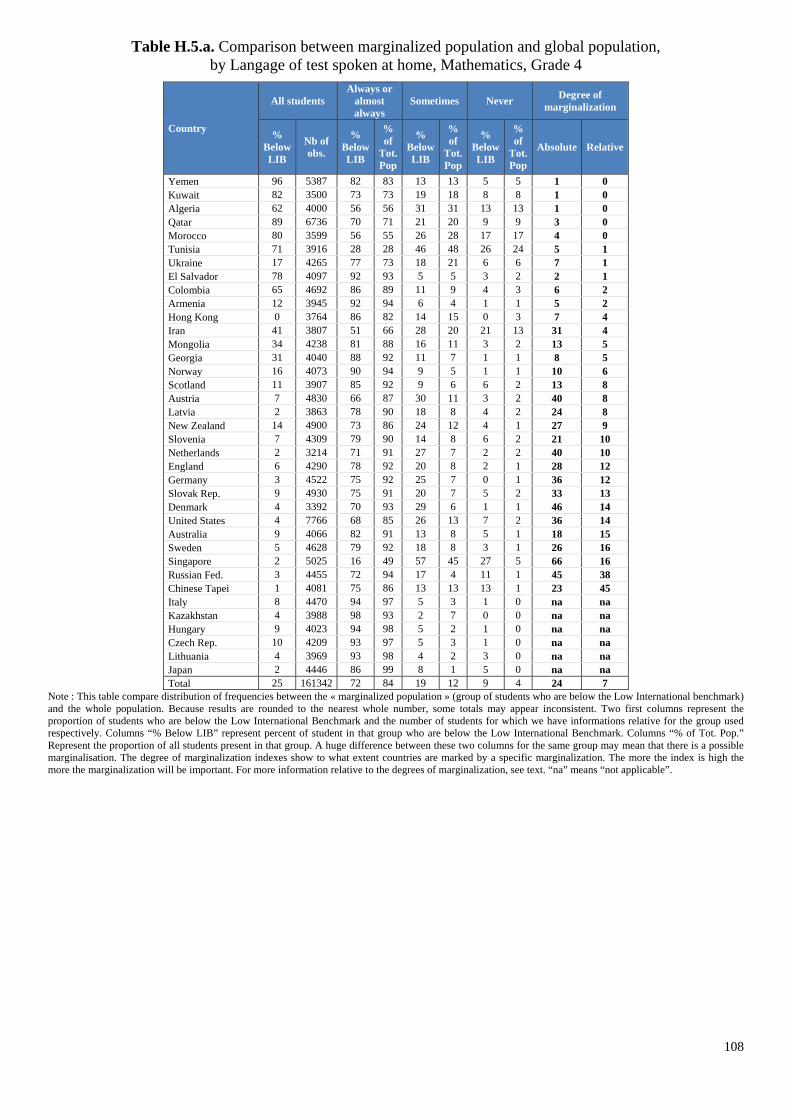
108
Table H.5.a. Comparison between marginalized population and global population, by Langage of test spoken at home, Mathematics, Grade 4
Country
All students Always or
almost always
Sometimes Never Degree of marginalization
% Below LIB
Nb of obs.
% Below LIB
% of
Tot. Pop
% Below LIB
% of
Tot. Pop
% Below LIB
% of
Tot. Pop
Absolute Relative
Yemen 96 5387 82 83 13 13 5 5 1 0 Kuwait 82 3500 73 73 19 18 8 8 1 0 Algeria 62 4000 56 56 31 31 13 13 1 0 Qatar 89 6736 70 71 21 20 9 9 3 0 Morocco 80 3599 56 55 26 28 17 17 4 0 Tunisia 71 3916 28 28 46 48 26 24 5 1 Ukraine 17 4265 77 73 18 21 6 6 7 1 El Salvador 78 4097 92 93 5 5 3 2 2 1 Colombia 65 4692 86 89 11 9 4 3 6 2 Armenia 12 3945 92 94 6 4 1 1 5 2 Hong Kong 0 3764 86 82 14 15 0 3 7 4 Iran 41 3807 51 66 28 20 21 13 31 4 Mongolia 34 4238 81 88 16 11 3 2 13 5 Georgia 31 4040 88 92 11 7 1 1 8 5 Norway 16 4073 90 94 9 5 1 1 10 6 Scotland 11 3907 85 92 9 6 6 2 13 8 Austria 7 4830 66 87 30 11 3 2 40 8 Latvia 2 3863 78 90 18 8 4 2 24 8 New Zealand 14 4900 73 86 24 12 4 1 27 9 Slovenia 7 4309 79 90 14 8 6 2 21 10 Netherlands 2 3214 71 91 27 7 2 2 40 10 England 6 4290 78 92 20 8 2 1 28 12 Germany 3 4522 75 92 25 7 0 1 36 12 Slovak Rep. 9 4930 75 91 20 7 5 2 33 13 Denmark 4 3392 70 93 29 6 1 1 46 14 United States 4 7766 68 85 26 13 7 2 36 14 Australia 9 4066 82 91 13 8 5 1 18 15 Sweden 5 4628 79 92 18 8 3 1 26 16 Singapore 2 5025 16 49 57 45 27 5 66 16 Russian Fed. 3 4455 72 94 17 4 11 1 45 38 Chinese Tapei 1 4081 75 86 13 13 13 1 23 45 Italy 8 4470 94 97 5 3 1 0 na na Kazakhstan 4 3988 98 93 2 7 0 0 na na Hungary 9 4023 94 98 5 2 1 0 na na Czech Rep. 10 4209 93 97 5 3 1 0 na na Lithuania 4 3969 93 98 4 2 3 0 na na Japan 2 4446 86 99 8 1 5 0 na na Total 25 161342 72 84 19 12 9 4 24 7
Note : This table compare distribution of frequencies between the « marginalized population » (group of students who are below the Low International benchmark) and the whole population. Because results are rounded to the nearest whole number, some totals may appear inconsistent. Two first columns represent the proportion of students who are below the Low International Benchmark and the number of students for which we have informations relative for the group used respectively. Columns “% Below LIB” represent percent of student in that group who are below the Low International Benchmark. Columns “% of Tot. Pop.” Represent the proportion of all students present in that group. A huge difference between these two columns for the same group may mean that there is a possible marginalisation. The degree of marginalization indexes show to what extent countries are marked by a specific marginalization. The more the index is high the more the marginalization will be important. For more information relative to the degrees of marginalization, see text. “na” means “not applicable”.

109
Table H.5.b. Comparison between marginalized population and global population, by Langage of test spoken at home, Science, Grade 4
Country
All students Always or
almost always
Sometimes Never Degree of marginalization
% Below LIB
Nb of obs.
% Below LIB
% of
Tot. Pop
% Below LIB
% of
Tot. Pop
% Below LIB
% of
Tot. Pop
Absolute Relative
Kuwait 66 3500 74 73 18 18 8 8 1 0 Yemen 94 5387 82 83 13 13 5 5 1 0 Morocco 84 3599 56 55 27 28 17 17 2 0 Algeria 69 4000 56 56 31 31 13 13 2 0 Tunisia 66 3916 28 28 46 48 26 24 5 1 Ukraine 15 4265 76 73 18 21 6 6 6 1 Armenia 25 3945 93 94 5 4 1 1 2 1 Qatar 79 6736 66 71 23 20 10 9 10 1 El Salvador 51 4097 90 93 6 5 4 2 6 3 Mongolia 38 4238 83 88 15 11 3 2 10 4 Colombia 43 4692 83 89 12 9 5 3 11 4 Georgia 39 4040 88 92 11 7 1 1 9 4 Iran 29 3807 44 66 31 20 25 13 44 6 Norway 14 4073 87 94 12 5 1 1 15 8 Scotland 9 3907 85 92 9 6 6 2 15 8 Slovenia 6 4309 74 90 21 8 5 2 31 10 Singapore 4 5025 20 49 59 45 22 5 59 13 New Zealand 12 4900 68 86 28 12 5 1 38 13 Latvia 1 3863 71 90 21 8 7 2 38 15 Austria 6 4830 52 87 43 11 5 2 70 15 United States 6 7766 58 85 35 13 7 2 55 17 Netherlands 2 3214 56 91 42 7 2 2 69 18 Sweden 4 4628 68 92 29 8 2 1 47 18 England 5 4290 71 92 27 8 3 1 42 20 Australia 7 4066 77 91 17 8 6 1 28 21 Denmark 7 3392 70 93 27 6 3 1 47 22 Hong Kong 2 3764 58 82 22 15 19 3 48 23 Germany 4 4522 61 92 37 7 2 1 63 24 Slovak Rep. 5 4930 60 91 32 7 8 2 61 25 Chinese Tapei 2 4081 68 86 22 13 10 1 35 36 Russian Fed. 2 4455 65 94 23 4 12 1 59 46 Lithuania 3 3969 94 98 3 2 2 0 na na Kazakhstan 4 3988 97 93 3 7 1 0 na na Italy 5 4470 91 97 8 3 0 0 na na Czech Rep. 6 4209 91 97 6 3 3 0 na na Hungary 5 4023 91 98 8 2 1 0 na na Japan 2 4446 84 99 10 1 6 0 na na Total 23 161342 70 84 21 12 9 4 29 8
Note : This table compare distribution of frequencies between the « marginalized population » (group of students who are below the Low International benchmark) and the whole population. Because results are rounded to the nearest whole number, some totals may appear inconsistent. Two first columns represent the proportion of students who are below the Low International Benchmark and the number of students for which we have informations relative for the group used respectively. Columns “% Below LIB” represent percent of student in that group who are below the Low International Benchmark. Columns “% of Tot. Pop.” Represent the proportion of all students present in that group. A huge difference between these two columns for the same group may mean that there is a possible marginalisation. The degree of marginalization indexes show to what extent countries are marked by a specific marginalization. The more the index is high the more the marginalization will be important. For more information relative to the degrees of marginalization, see text. “na” means “not applicable”.
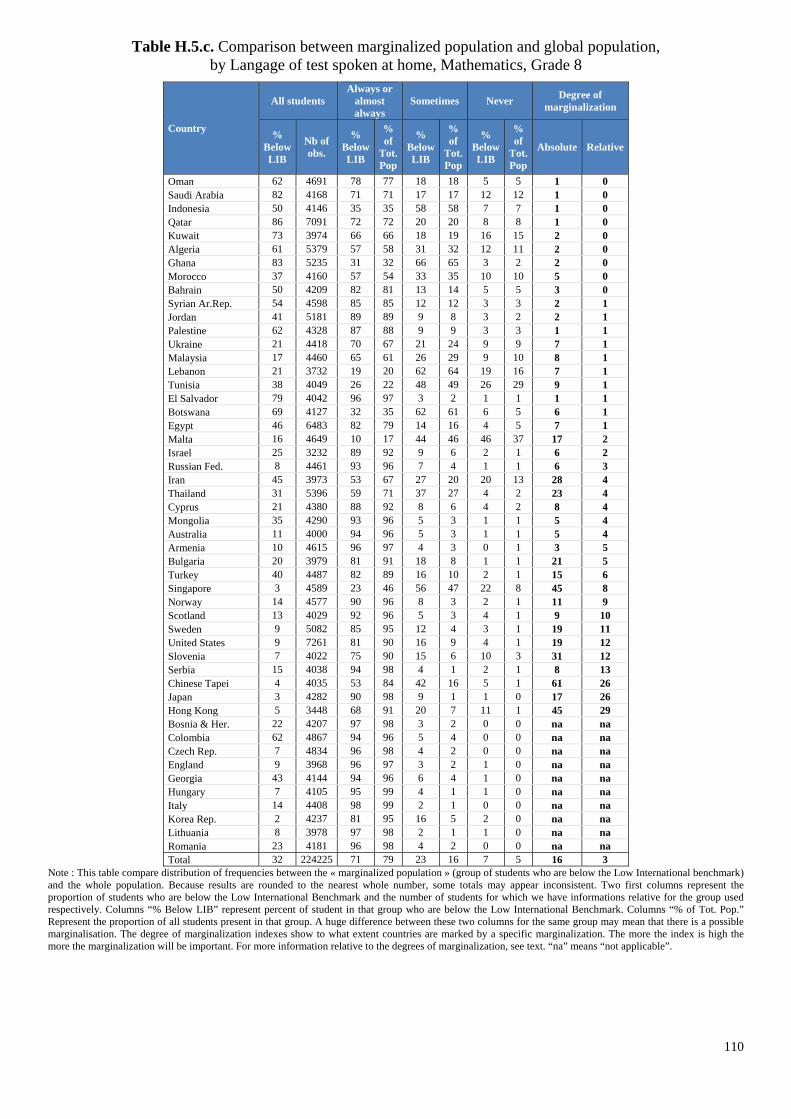
110
Table H.5.c. Comparison between marginalized population and global population, by Langage of test spoken at home, Mathematics, Grade 8
Country
All students Always or
almost always
Sometimes Never Degree of marginalization
% Below LIB
Nb of obs.
% Below LIB
% of
Tot. Pop
% Below LIB
% of
Tot. Pop
% Below LIB
% of
Tot. Pop
Absolute Relative
Oman 62 4691 78 77 18 18 5 5 1 0 Saudi Arabia 82 4168 71 71 17 17 12 12 1 0 Indonesia 50 4146 35 35 58 58 7 7 1 0 Qatar 86 7091 72 72 20 20 8 8 1 0 Kuwait 73 3974 66 66 18 19 16 15 2 0 Algeria 61 5379 57 58 31 32 12 11 2 0 Ghana 83 5235 31 32 66 65 3 2 2 0 Morocco 37 4160 57 54 33 35 10 10 5 0 Bahrain 50 4209 82 81 13 14 5 5 3 0 Syrian Ar.Rep. 54 4598 85 85 12 12 3 3 2 1 Jordan 41 5181 89 89 9 8 3 2 2 1 Palestine 62 4328 87 88 9 9 3 3 1 1 Ukraine 21 4418 70 67 21 24 9 9 7 1 Malaysia 17 4460 65 61 26 29 9 10 8 1 Lebanon 21 3732 19 20 62 64 19 16 7 1 Tunisia 38 4049 26 22 48 49 26 29 9 1 El Salvador 79 4042 96 97 3 2 1 1 1 1 Botswana 69 4127 32 35 62 61 6 5 6 1 Egypt 46 6483 82 79 14 16 4 5 7 1 Malta 16 4649 10 17 44 46 46 37 17 2 Israel 25 3232 89 92 9 6 2 1 6 2 Russian Fed. 8 4461 93 96 7 4 1 1 6 3 Iran 45 3973 53 67 27 20 20 13 28 4 Thailand 31 5396 59 71 37 27 4 2 23 4 Cyprus 21 4380 88 92 8 6 4 2 8 4 Mongolia 35 4290 93 96 5 3 1 1 5 4 Australia 11 4000 94 96 5 3 1 1 5 4 Armenia 10 4615 96 97 4 3 0 1 3 5 Bulgaria 20 3979 81 91 18 8 1 1 21 5 Turkey 40 4487 82 89 16 10 2 1 15 6 Singapore 3 4589 23 46 56 47 22 8 45 8 Norway 14 4577 90 96 8 3 2 1 11 9 Scotland 13 4029 92 96 5 3 4 1 9 10 Sweden 9 5082 85 95 12 4 3 1 19 11 United States 9 7261 81 90 16 9 4 1 19 12 Slovenia 7 4022 75 90 15 6 10 3 31 12 Serbia 15 4038 94 98 4 1 2 1 8 13 Chinese Tapei 4 4035 53 84 42 16 5 1 61 26 Japan 3 4282 90 98 9 1 1 0 17 26 Hong Kong 5 3448 68 91 20 7 11 1 45 29 Bosnia & Her. 22 4207 97 98 3 2 0 0 na na Colombia 62 4867 94 96 5 4 0 0 na na Czech Rep. 7 4834 96 98 4 2 0 0 na na England 9 3968 96 97 3 2 1 0 na na Georgia 43 4144 94 96 6 4 1 0 na na Hungary 7 4105 95 99 4 1 1 0 na na Italy 14 4408 98 99 2 1 0 0 na na Korea Rep. 2 4237 81 95 16 5 2 0 na na Lithuania 8 3978 97 98 2 1 1 0 na na Romania 23 4181 96 98 4 2 0 0 na na Total 32 224225 71 79 23 16 7 5 16 3
Note : This table compare distribution of frequencies between the « marginalized population » (group of students who are below the Low International benchmark) and the whole population. Because results are rounded to the nearest whole number, some totals may appear inconsistent. Two first columns represent the proportion of students who are below the Low International Benchmark and the number of students for which we have informations relative for the group used respectively. Columns “% Below LIB” represent percent of student in that group who are below the Low International Benchmark. Columns “% of Tot. Pop.” Represent the proportion of all students present in that group. A huge difference between these two columns for the same group may mean that there is a possible marginalisation. The degree of marginalization indexes show to what extent countries are marked by a specific marginalization. The more the index is high the more the marginalization will be important. For more information relative to the degrees of marginalization, see text. “na” means “not applicable”.
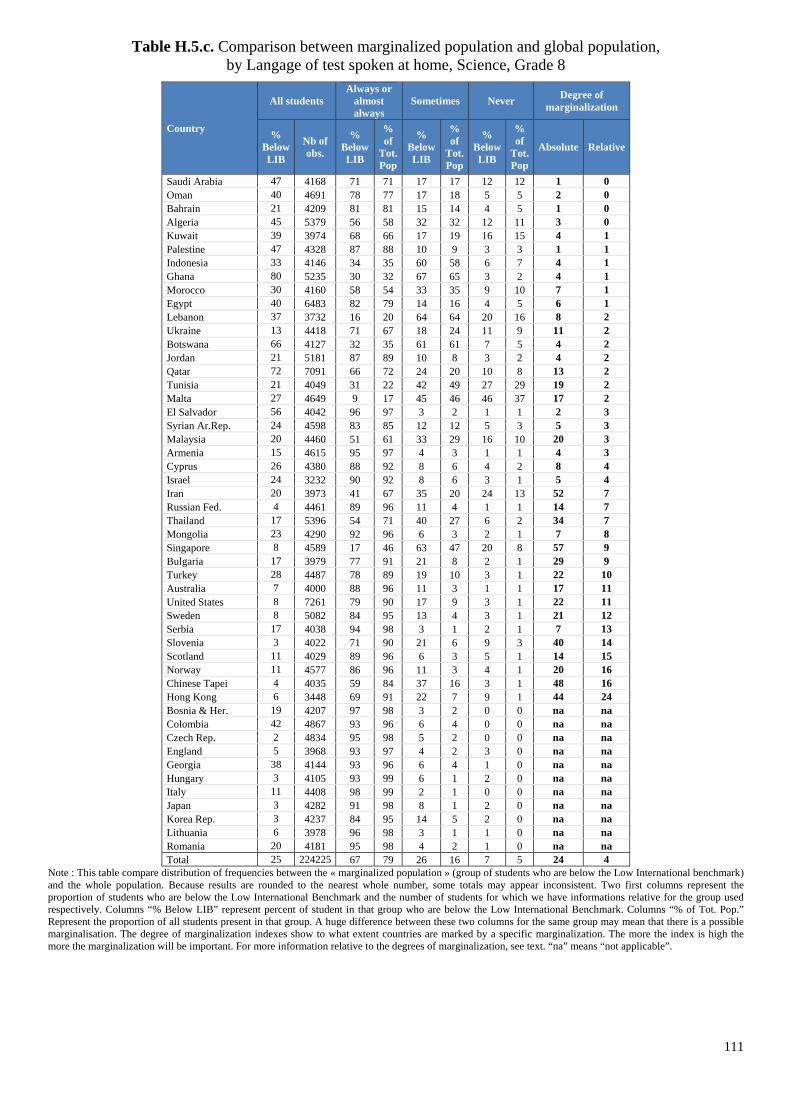
111
Table H.5.c. Comparison between marginalized population and global population, by Langage of test spoken at home, Science, Grade 8
Country
All students Always or
almost always
Sometimes Never Degree of marginalization
% Below LIB
Nb of obs.
% Below LIB
% of
Tot. Pop
% Below LIB
% of
Tot. Pop
% Below LIB
% of
Tot. Pop
Absolute Relative
Saudi Arabia 47 4168 71 71 17 17 12 12 1 0 Oman 40 4691 78 77 17 18 5 5 2 0 Bahrain 21 4209 81 81 15 14 4 5 1 0 Algeria 45 5379 56 58 32 32 12 11 3 0 Kuwait 39 3974 68 66 17 19 16 15 4 1 Palestine 47 4328 87 88 10 9 3 3 1 1 Indonesia 33 4146 34 35 60 58 6 7 4 1 Ghana 80 5235 30 32 67 65 3 2 4 1 Morocco 30 4160 58 54 33 35 9 10 7 1 Egypt 40 6483 82 79 14 16 4 5 6 1 Lebanon 37 3732 16 20 64 64 20 16 8 2 Ukraine 13 4418 71 67 18 24 11 9 11 2 Botswana 66 4127 32 35 61 61 7 5 4 2 Jordan 21 5181 87 89 10 8 3 2 4 2 Qatar 72 7091 66 72 24 20 10 8 13 2 Tunisia 21 4049 31 22 42 49 27 29 19 2 Malta 27 4649 9 17 45 46 46 37 17 2 El Salvador 56 4042 96 97 3 2 1 1 2 3 Syrian Ar.Rep. 24 4598 83 85 12 12 5 3 5 3 Malaysia 20 4460 51 61 33 29 16 10 20 3 Armenia 15 4615 95 97 4 3 1 1 4 3 Cyprus 26 4380 88 92 8 6 4 2 8 4 Israel 24 3232 90 92 8 6 3 1 5 4 Iran 20 3973 41 67 35 20 24 13 52 7 Russian Fed. 4 4461 89 96 11 4 1 1 14 7 Thailand 17 5396 54 71 40 27 6 2 34 7 Mongolia 23 4290 92 96 6 3 2 1 7 8 Singapore 8 4589 17 46 63 47 20 8 57 9 Bulgaria 17 3979 77 91 21 8 2 1 29 9 Turkey 28 4487 78 89 19 10 3 1 22 10 Australia 7 4000 88 96 11 3 1 1 17 11 United States 8 7261 79 90 17 9 3 1 22 11 Sweden 8 5082 84 95 13 4 3 1 21 12 Serbia 17 4038 94 98 3 1 2 1 7 13 Slovenia 3 4022 71 90 21 6 9 3 40 14 Scotland 11 4029 89 96 6 3 5 1 14 15 Norway 11 4577 86 96 11 3 4 1 20 16 Chinese Tapei 4 4035 59 84 37 16 3 1 48 16 Hong Kong 6 3448 69 91 22 7 9 1 44 24 Bosnia & Her. 19 4207 97 98 3 2 0 0 na na Colombia 42 4867 93 96 6 4 0 0 na na Czech Rep. 2 4834 95 98 5 2 0 0 na na England 5 3968 93 97 4 2 3 0 na na Georgia 38 4144 93 96 6 4 1 0 na na Hungary 3 4105 93 99 6 1 2 0 na na Italy 11 4408 98 99 2 1 0 0 na na Japan 3 4282 91 98 8 1 2 0 na na Korea Rep. 3 4237 84 95 14 5 2 0 na na Lithuania 6 3978 96 98 3 1 1 0 na na Romania 20 4181 95 98 4 2 1 0 na na Total 25 224225 67 79 26 16 7 5 24 4
Note : This table compare distribution of frequencies between the « marginalized population » (group of students who are below the Low International benchmark) and the whole population. Because results are rounded to the nearest whole number, some totals may appear inconsistent. Two first columns represent the proportion of students who are below the Low International Benchmark and the number of students for which we have informations relative for the group used respectively. Columns “% Below LIB” represent percent of student in that group who are below the Low International Benchmark. Columns “% of Tot. Pop.” Represent the proportion of all students present in that group. A huge difference between these two columns for the same group may mean that there is a possible marginalisation. The degree of marginalization indexes show to what extent countries are marked by a specific marginalization. The more the index is high the more the marginalization will be important. For more information relative to the degrees of marginalization, see text. “na” means “not applicable”.
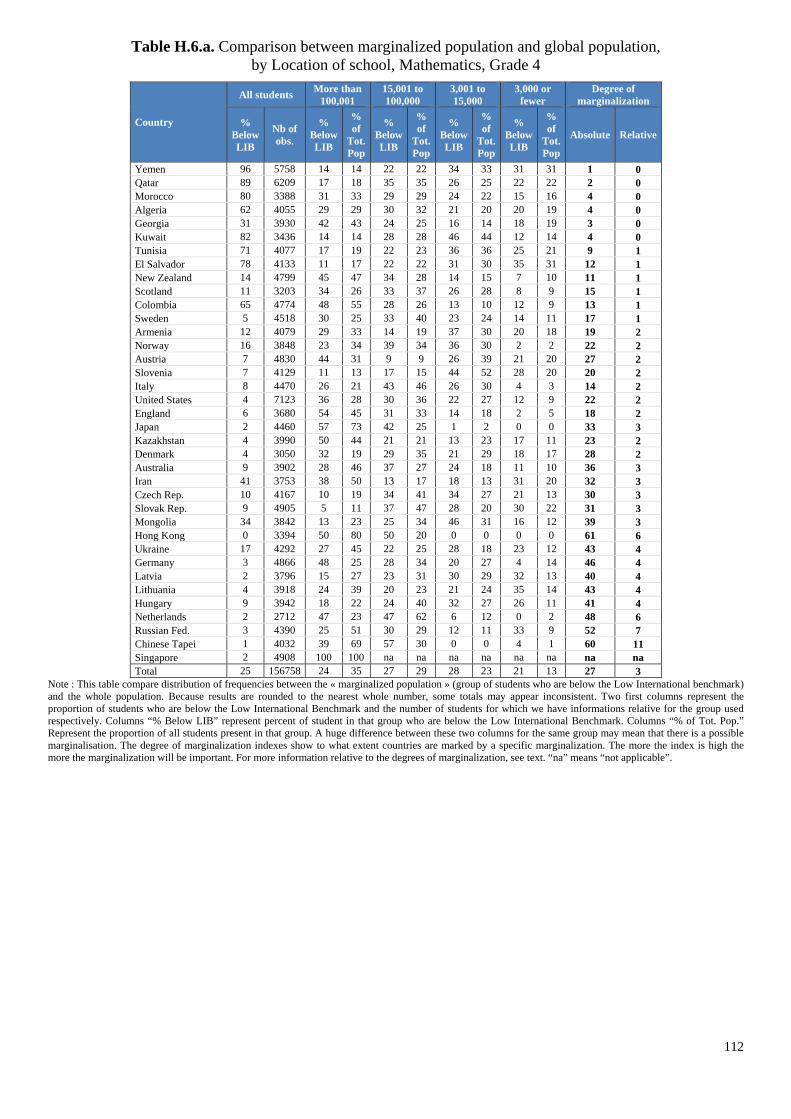
112
Table H.6.a. Comparison between marginalized population and global population, by Location of school, Mathematics, Grade 4
Country
All students More than 100,001
15,001 to 100,000
3,001 to 15,000
3,000 or fewer
Degree of marginalization
% Below LIB
Nb of obs.
% Below LIB
% of
Tot. Pop
% Below LIB
% of
Tot. Pop
% Below LIB
% of
Tot. Pop
% Below LIB
% of
Tot. Pop
Absolute Relative
Yemen 96 5758 14 14 22 22 34 33 31 31 1 0 Qatar 89 6209 17 18 35 35 26 25 22 22 2 0 Morocco 80 3388 31 33 29 29 24 22 15 16 4 0 Algeria 62 4055 29 29 30 32 21 20 20 19 4 0 Georgia 31 3930 42 43 24 25 16 14 18 19 3 0 Kuwait 82 3436 14 14 28 28 46 44 12 14 4 0 Tunisia 71 4077 17 19 22 23 36 36 25 21 9 1 El Salvador 78 4133 11 17 22 22 31 30 35 31 12 1 New Zealand 14 4799 45 47 34 28 14 15 7 10 11 1 Scotland 11 3203 34 26 33 37 26 28 8 9 15 1 Colombia 65 4774 48 55 28 26 13 10 12 9 13 1 Sweden 5 4518 30 25 33 40 23 24 14 11 17 1 Armenia 12 4079 29 33 14 19 37 30 20 18 19 2 Norway 16 3848 23 34 39 34 36 30 2 2 22 2 Austria 7 4830 44 31 9 9 26 39 21 20 27 2 Slovenia 7 4129 11 13 17 15 44 52 28 20 20 2 Italy 8 4470 26 21 43 46 26 30 4 3 14 2 United States 4 7123 36 28 30 36 22 27 12 9 22 2 England 6 3680 54 45 31 33 14 18 2 5 18 2 Japan 2 4460 57 73 42 25 1 2 0 0 33 3 Kazakhstan 4 3990 50 44 21 21 13 23 17 11 23 2 Denmark 4 3050 32 19 29 35 21 29 18 17 28 2 Australia 9 3902 28 46 37 27 24 18 11 10 36 3 Iran 41 3753 38 50 13 17 18 13 31 20 32 3 Czech Rep. 10 4167 10 19 34 41 34 27 21 13 30 3 Slovak Rep. 9 4905 5 11 37 47 28 20 30 22 31 3 Mongolia 34 3842 13 23 25 34 46 31 16 12 39 3 Hong Kong 0 3394 50 80 50 20 0 0 0 0 61 6 Ukraine 17 4292 27 45 22 25 28 18 23 12 43 4 Germany 3 4866 48 25 28 34 20 27 4 14 46 4 Latvia 2 3796 15 27 23 31 30 29 32 13 40 4 Lithuania 4 3918 24 39 20 23 21 24 35 14 43 4 Hungary 9 3942 18 22 24 40 32 27 26 11 41 4 Netherlands 2 2712 47 23 47 62 6 12 0 2 48 6 Russian Fed. 3 4390 25 51 30 29 12 11 33 9 52 7 Chinese Tapei 1 4032 39 69 57 30 0 0 4 1 60 11 Singapore 2 4908 100 100 na na na na na na na na Total 25 156758 24 35 27 29 28 23 21 13 27 3
Note : This table compare distribution of frequencies between the « marginalized population » (group of students who are below the Low International benchmark) and the whole population. Because results are rounded to the nearest whole number, some totals may appear inconsistent. Two first columns represent the proportion of students who are below the Low International Benchmark and the number of students for which we have informations relative for the group used respectively. Columns “% Below LIB” represent percent of student in that group who are below the Low International Benchmark. Columns “% of Tot. Pop.” Represent the proportion of all students present in that group. A huge difference between these two columns for the same group may mean that there is a possible marginalisation. The degree of marginalization indexes show to what extent countries are marked by a specific marginalization. The more the index is high the more the marginalization will be important. For more information relative to the degrees of marginalization, see text. “na” means “not applicable”.

113
Table H.6.b. Comparison between marginalized population and global population, by Location of school, Science, Grade 4
Country
All students More than 100,001
15,001 to 100,000
3,001 to 15,000
3,000 or fewer
Degree of marginalization
% Below LIB
Nb of obs.
% Below LIB
% of
Tot. Pop
% Below LIB
% of
Tot. Pop
% Below LIB
% of
Tot. Pop
% Below LIB
% of
Tot. Pop
Absolute Relative
Yemen 94 5758 13 14 22 22 34 33 31 31 2 0 Morocco 84 3388 31 33 29 29 24 22 15 16 4 0 Algeria 69 4055 29 29 30 32 21 20 19 19 4 0 Georgia 39 3930 42 43 24 25 15 14 19 19 3 0 Qatar 79 6209 17 18 34 35 26 25 23 22 4 0 Kuwait 66 3436 14 14 28 28 47 44 11 14 6 1 Armenia 25 4079 29 33 19 19 34 30 18 18 9 1 Tunisia 66 4077 16 19 21 23 36 36 26 21 11 1 Slovenia 6 4129 11 13 14 15 49 52 26 20 11 1 Hong Kong 2 3394 71 80 29 20 0 0 0 0 18 2 New Zealand 12 4799 47 47 34 28 13 15 6 10 11 1 Scotland 9 3203 35 26 34 37 25 28 6 9 18 2 Norway 14 3848 26 34 37 34 35 30 1 2 16 2 United States 6 7123 40 28 32 36 18 27 9 9 24 2 Japan 2 4460 64 73 35 25 1 2 0 0 19 2 El Salvador 51 4133 9 17 19 22 30 30 42 31 23 2 England 5 3680 56 45 29 33 13 18 2 5 23 2 Colombia 43 4774 44 55 28 26 16 10 13 9 21 2 Denmark 7 3050 33 19 28 35 23 29 16 17 28 2 Australia 7 3902 29 46 35 27 24 18 12 10 33 2 Czech Rep. 6 4167 9 19 39 41 30 27 21 13 23 2 Sweden 4 4518 39 25 34 40 15 24 13 11 31 3 Kazakhstan 4 3990 51 44 19 21 13 23 17 11 25 3 Austria 6 4830 54 31 8 9 20 39 18 20 45 3 Mongolia 38 3842 15 23 25 34 44 31 16 12 35 3 Slovak Rep. 5 4905 4 11 37 47 23 20 36 22 34 3 Iran 29 3753 35 50 13 17 18 13 34 20 39 3 Italy 5 4470 29 21 38 46 26 30 6 3 23 3 Lithuania 3 3918 24 39 19 23 26 24 31 14 37 4 Germany 4 4866 45 25 33 34 18 27 3 14 40 4 Netherlands 2 2712 36 23 56 62 9 12 0 2 25 4 Ukraine 15 4292 29 45 20 25 29 18 22 12 42 4 Latvia 1 3796 18 27 23 31 26 29 33 13 40 4 Chinese Tapei 2 4032 42 69 56 30 1 0 1 1 53 6 Hungary 5 3942 16 22 17 40 36 27 30 11 58 6 Russian Fed. 2 4390 29 51 30 29 8 11 33 9 49 7 Singapore 4 4908 100 100 na na na na na na na na Total 23 156758 24 35 26 29 28 23 21 13 28 3
Note : This table compare distribution of frequencies between the « marginalized population » (group of students who are below the Low International benchmark) and the whole population. Because results are rounded to the nearest whole number, some totals may appear inconsistent. Two first columns represent the proportion of students who are below the Low International Benchmark and the number of students for which we have informations relative for the group used respectively. Columns “% Below LIB” represent percent of student in that group who are below the Low International Benchmark. Columns “% of Tot. Pop.” Represent the proportion of all students present in that group. A huge difference between these two columns for the same group may mean that there is a possible marginalisation. The degree of marginalization indexes show to what extent countries are marked by a specific marginalization. The more the index is high the more the marginalization will be important. For more information relative to the degrees of marginalization, see text. “na” means “not applicable”.
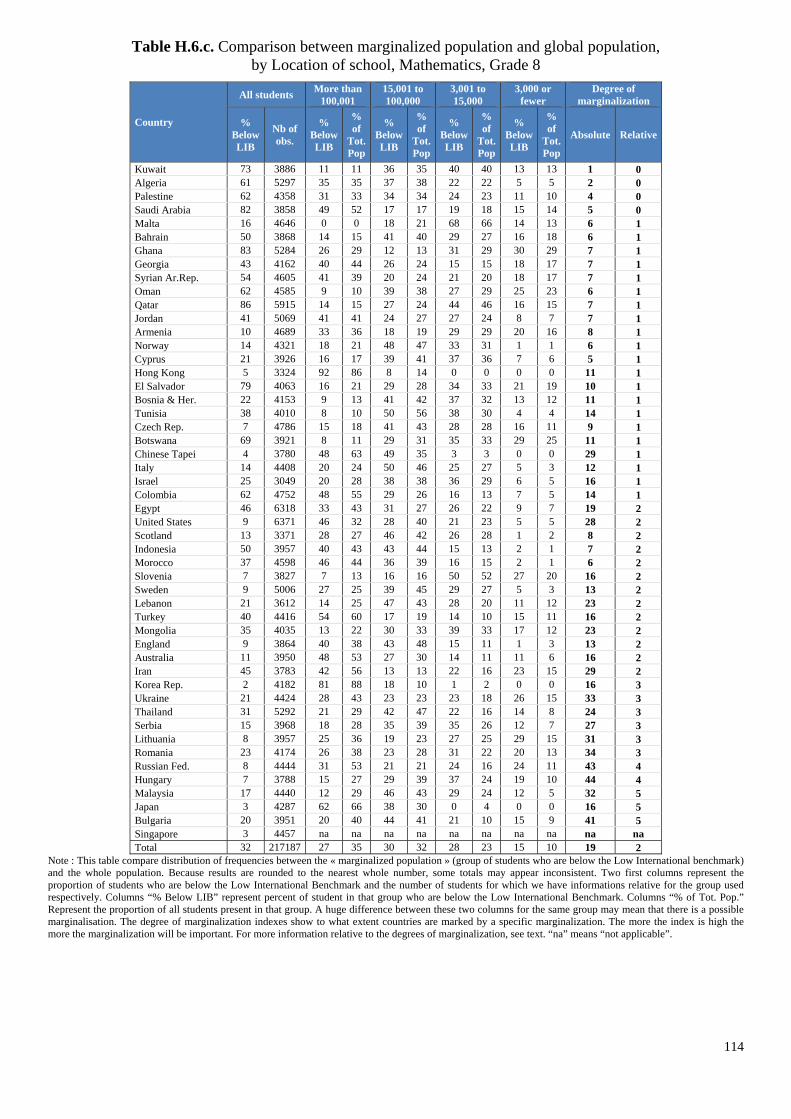
114
Table H.6.c. Comparison between marginalized population and global population, by Location of school, Mathematics, Grade 8
Country
All students More than 100,001
15,001 to 100,000
3,001 to 15,000
3,000 or fewer
Degree of marginalization
% Below LIB
Nb of obs.
% Below LIB
% of
Tot. Pop
% Below LIB
% of
Tot. Pop
% Below LIB
% of
Tot. Pop
% Below LIB
% of
Tot. Pop
Absolute Relative
Kuwait 73 3886 11 11 36 35 40 40 13 13 1 0 Algeria 61 5297 35 35 37 38 22 22 5 5 2 0 Palestine 62 4358 31 33 34 34 24 23 11 10 4 0 Saudi Arabia 82 3858 49 52 17 17 19 18 15 14 5 0 Malta 16 4646 0 0 18 21 68 66 14 13 6 1 Bahrain 50 3868 14 15 41 40 29 27 16 18 6 1 Ghana 83 5284 26 29 12 13 31 29 30 29 7 1 Georgia 43 4162 40 44 26 24 15 15 18 17 7 1 Syrian Ar.Rep. 54 4605 41 39 20 24 21 20 18 17 7 1 Oman 62 4585 9 10 39 38 27 29 25 23 6 1 Qatar 86 5915 14 15 27 24 44 46 16 15 7 1 Jordan 41 5069 41 41 24 27 27 24 8 7 7 1 Armenia 10 4689 33 36 18 19 29 29 20 16 8 1 Norway 14 4321 18 21 48 47 33 31 1 1 6 1 Cyprus 21 3926 16 17 39 41 37 36 7 6 5 1 Hong Kong 5 3324 92 86 8 14 0 0 0 0 11 1 El Salvador 79 4063 16 21 29 28 34 33 21 19 10 1 Bosnia & Her. 22 4153 9 13 41 42 37 32 13 12 11 1 Tunisia 38 4010 8 10 50 56 38 30 4 4 14 1 Czech Rep. 7 4786 15 18 41 43 28 28 16 11 9 1 Botswana 69 3921 8 11 29 31 35 33 29 25 11 1 Chinese Tapei 4 3780 48 63 49 35 3 3 0 0 29 1 Italy 14 4408 20 24 50 46 25 27 5 3 12 1 Israel 25 3049 20 28 38 38 36 29 6 5 16 1 Colombia 62 4752 48 55 29 26 16 13 7 5 14 1 Egypt 46 6318 33 43 31 27 26 22 9 7 19 2 United States 9 6371 46 32 28 40 21 23 5 5 28 2 Scotland 13 3371 28 27 46 42 26 28 1 2 8 2 Indonesia 50 3957 40 43 43 44 15 13 2 1 7 2 Morocco 37 4598 46 44 36 39 16 15 2 1 6 2 Slovenia 7 3827 7 13 16 16 50 52 27 20 16 2 Sweden 9 5006 27 25 39 45 29 27 5 3 13 2 Lebanon 21 3612 14 25 47 43 28 20 11 12 23 2 Turkey 40 4416 54 60 17 19 14 10 15 11 16 2 Mongolia 35 4035 13 22 30 33 39 33 17 12 23 2 England 9 3864 40 38 43 48 15 11 1 3 13 2 Australia 11 3950 48 53 27 30 14 11 11 6 16 2 Iran 45 3783 42 56 13 13 22 16 23 15 29 2 Korea Rep. 2 4182 81 88 18 10 1 2 0 0 16 3 Ukraine 21 4424 28 43 23 23 23 18 26 15 33 3 Thailand 31 5292 21 29 42 47 22 16 14 8 24 3 Serbia 15 3968 18 28 35 39 35 26 12 7 27 3 Lithuania 8 3957 25 36 19 23 27 25 29 15 31 3 Romania 23 4174 26 38 23 28 31 22 20 13 34 3 Russian Fed. 8 4444 31 53 21 21 24 16 24 11 43 4 Hungary 7 3788 15 27 29 39 37 24 19 10 44 4 Malaysia 17 4440 12 29 46 43 29 24 12 5 32 5 Japan 3 4287 62 66 38 30 0 4 0 0 16 5 Bulgaria 20 3951 20 40 44 41 21 10 15 9 41 5 Singapore 3 4457 na na na na na na na na na na Total 32 217187 27 35 30 32 28 23 15 10 19 2
Note : This table compare distribution of frequencies between the « marginalized population » (group of students who are below the Low International benchmark) and the whole population. Because results are rounded to the nearest whole number, some totals may appear inconsistent. Two first columns represent the proportion of students who are below the Low International Benchmark and the number of students for which we have informations relative for the group used respectively. Columns “% Below LIB” represent percent of student in that group who are below the Low International Benchmark. Columns “% of Tot. Pop.” Represent the proportion of all students present in that group. A huge difference between these two columns for the same group may mean that there is a possible marginalisation. The degree of marginalization indexes show to what extent countries are marked by a specific marginalization. The more the index is high the more the marginalization will be important. For more information relative to the degrees of marginalization, see text. “na” means “not applicable”.
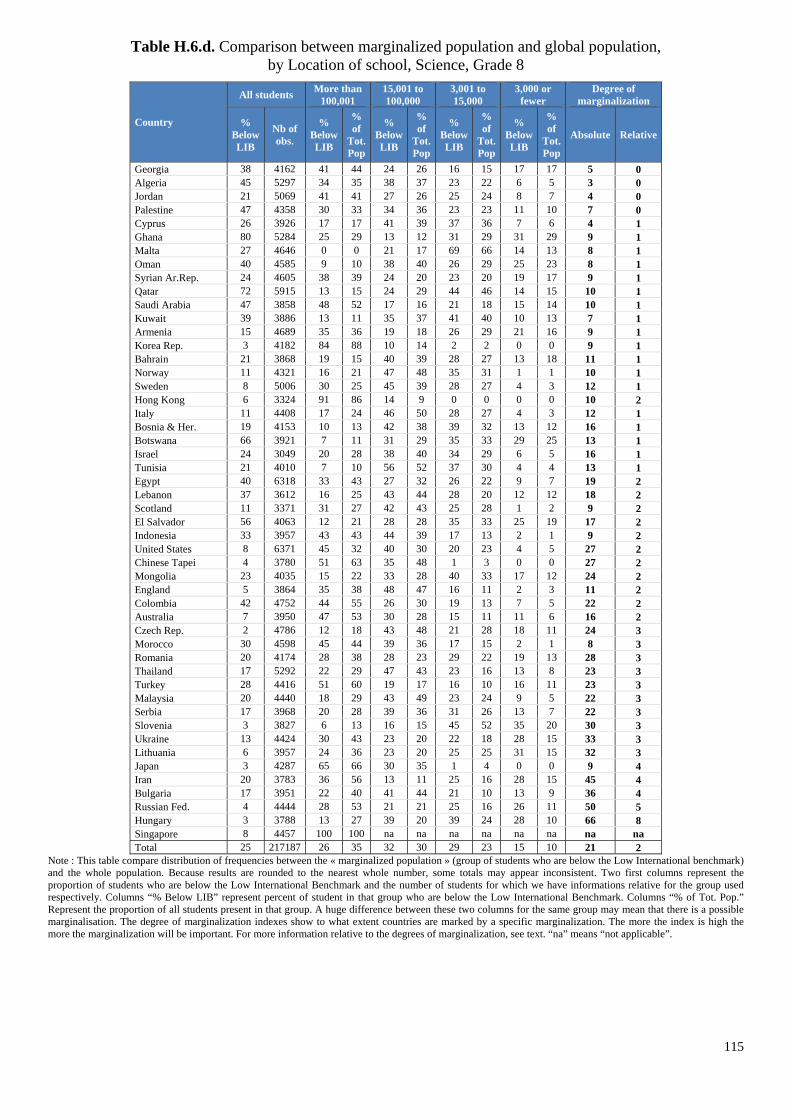
115
Table H.6.d. Comparison between marginalized population and global population, by Location of school, Science, Grade 8
Country
All students More than 100,001
15,001 to 100,000
3,001 to 15,000
3,000 or fewer
Degree of marginalization
% Below LIB
Nb of obs.
% Below LIB
% of
Tot. Pop
% Below LIB
% of
Tot. Pop
% Below LIB
% of
Tot. Pop
% Below LIB
% of
Tot. Pop
Absolute Relative
Georgia 38 4162 41 44 24 26 16 15 17 17 5 0 Algeria 45 5297 34 35 38 37 23 22 6 5 3 0 Jordan 21 5069 41 41 27 26 25 24 8 7 4 0 Palestine 47 4358 30 33 34 36 23 23 11 10 7 0 Cyprus 26 3926 17 17 41 39 37 36 7 6 4 1 Ghana 80 5284 25 29 13 12 31 29 31 29 9 1 Malta 27 4646 0 0 21 17 69 66 14 13 8 1 Oman 40 4585 9 10 38 40 26 29 25 23 8 1 Syrian Ar.Rep. 24 4605 38 39 24 20 23 20 19 17 9 1 Qatar 72 5915 13 15 24 29 44 46 14 15 10 1 Saudi Arabia 47 3858 48 52 17 16 21 18 15 14 10 1 Kuwait 39 3886 13 11 35 37 41 40 10 13 7 1 Armenia 15 4689 35 36 19 18 26 29 21 16 9 1 Korea Rep. 3 4182 84 88 10 14 2 2 0 0 9 1 Bahrain 21 3868 19 15 40 39 28 27 13 18 11 1 Norway 11 4321 16 21 47 48 35 31 1 1 10 1 Sweden 8 5006 30 25 45 39 28 27 4 3 12 1 Hong Kong 6 3324 91 86 14 9 0 0 0 0 10 2 Italy 11 4408 17 24 46 50 28 27 4 3 12 1 Bosnia & Her. 19 4153 10 13 42 38 39 32 13 12 16 1 Botswana 66 3921 7 11 31 29 35 33 29 25 13 1 Israel 24 3049 20 28 38 40 34 29 6 5 16 1 Tunisia 21 4010 7 10 56 52 37 30 4 4 13 1 Egypt 40 6318 33 43 27 32 26 22 9 7 19 2 Lebanon 37 3612 16 25 43 44 28 20 12 12 18 2 Scotland 11 3371 31 27 42 43 25 28 1 2 9 2 El Salvador 56 4063 12 21 28 28 35 33 25 19 17 2 Indonesia 33 3957 43 43 44 39 17 13 2 1 9 2 United States 8 6371 45 32 40 30 20 23 4 5 27 2 Chinese Tapei 4 3780 51 63 35 48 1 3 0 0 27 2 Mongolia 23 4035 15 22 33 28 40 33 17 12 24 2 England 5 3864 35 38 48 47 16 11 2 3 11 2 Colombia 42 4752 44 55 26 30 19 13 7 5 22 2 Australia 7 3950 47 53 30 28 15 11 11 6 16 2 Czech Rep. 2 4786 12 18 43 48 21 28 18 11 24 3 Morocco 30 4598 45 44 39 36 17 15 2 1 8 3 Romania 20 4174 28 38 28 23 29 22 19 13 28 3 Thailand 17 5292 22 29 47 43 23 16 13 8 23 3 Turkey 28 4416 51 60 19 17 16 10 16 11 23 3 Malaysia 20 4440 18 29 43 49 23 24 9 5 22 3 Serbia 17 3968 20 28 39 36 31 26 13 7 22 3 Slovenia 3 3827 6 13 16 15 45 52 35 20 30 3 Ukraine 13 4424 30 43 23 20 22 18 28 15 33 3 Lithuania 6 3957 24 36 23 20 25 25 31 15 32 3 Japan 3 4287 65 66 30 35 1 4 0 0 9 4 Iran 20 3783 36 56 13 11 25 16 28 15 45 4 Bulgaria 17 3951 22 40 41 44 21 10 13 9 36 4 Russian Fed. 4 4444 28 53 21 21 25 16 26 11 50 5 Hungary 3 3788 13 27 39 20 39 24 28 10 66 8 Singapore 8 4457 100 100 na na na na na na na na Total 25 217187 26 35 32 30 29 23 15 10 21 2
Note : This table compare distribution of frequencies between the « marginalized population » (group of students who are below the Low International benchmark) and the whole population. Because results are rounded to the nearest whole number, some totals may appear inconsistent. Two first columns represent the proportion of students who are below the Low International Benchmark and the number of students for which we have informations relative for the group used respectively. Columns “% Below LIB” represent percent of student in that group who are below the Low International Benchmark. Columns “% of Tot. Pop.” Represent the proportion of all students present in that group. A huge difference between these two columns for the same group may mean that there is a possible marginalisation. The degree of marginalization indexes show to what extent countries are marked by a specific marginalization. The more the index is high the more the marginalization will be important. For more information relative to the degrees of marginalization, see text. “na” means “not applicable”.
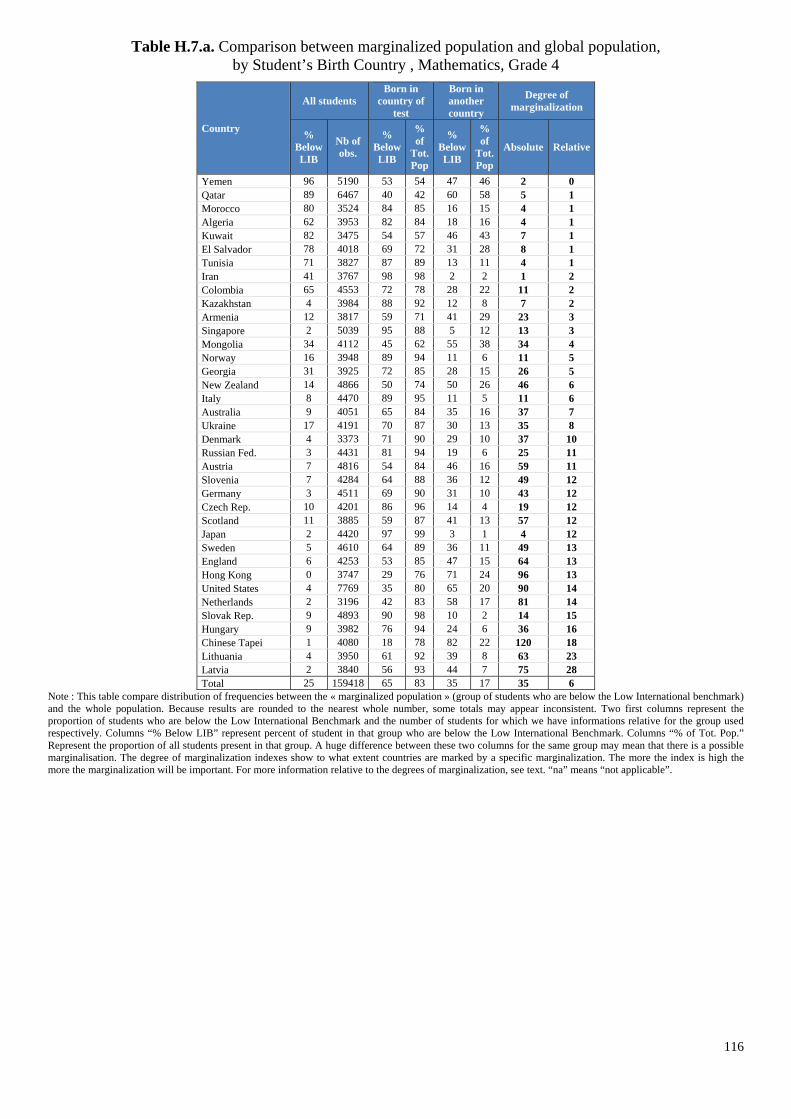
116
Table H.7.a. Comparison between marginalized population and global population, by Student’s Birth Country , Mathematics, Grade 4
Country
All students Born in
country of test
Born in another country
Degree of marginalization
% Below LIB
Nb of obs.
% Below LIB
% of
Tot. Pop
% Below LIB
% of
Tot. Pop
Absolute Relative
Yemen 96 5190 53 54 47 46 2 0 Qatar 89 6467 40 42 60 58 5 1 Morocco 80 3524 84 85 16 15 4 1 Algeria 62 3953 82 84 18 16 4 1 Kuwait 82 3475 54 57 46 43 7 1 El Salvador 78 4018 69 72 31 28 8 1 Tunisia 71 3827 87 89 13 11 4 1 Iran 41 3767 98 98 2 2 1 2 Colombia 65 4553 72 78 28 22 11 2 Kazakhstan 4 3984 88 92 12 8 7 2 Armenia 12 3817 59 71 41 29 23 3 Singapore 2 5039 95 88 5 12 13 3 Mongolia 34 4112 45 62 55 38 34 4 Norway 16 3948 89 94 11 6 11 5 Georgia 31 3925 72 85 28 15 26 5 New Zealand 14 4866 50 74 50 26 46 6 Italy 8 4470 89 95 11 5 11 6 Australia 9 4051 65 84 35 16 37 7 Ukraine 17 4191 70 87 30 13 35 8 Denmark 4 3373 71 90 29 10 37 10 Russian Fed. 3 4431 81 94 19 6 25 11 Austria 7 4816 54 84 46 16 59 11 Slovenia 7 4284 64 88 36 12 49 12 Germany 3 4511 69 90 31 10 43 12 Czech Rep. 10 4201 86 96 14 4 19 12 Scotland 11 3885 59 87 41 13 57 12 Japan 2 4420 97 99 3 1 4 12 Sweden 5 4610 64 89 36 11 49 13 England 6 4253 53 85 47 15 64 13 Hong Kong 0 3747 29 76 71 24 96 13 United States 4 7769 35 80 65 20 90 14 Netherlands 2 3196 42 83 58 17 81 14 Slovak Rep. 9 4893 90 98 10 2 14 15 Hungary 9 3982 76 94 24 6 36 16 Chinese Tapei 1 4080 18 78 82 22 120 18 Lithuania 4 3950 61 92 39 8 63 23 Latvia 2 3840 56 93 44 7 75 28 Total 25 159418 65 83 35 17 35 6
Note : This table compare distribution of frequencies between the « marginalized population » (group of students who are below the Low International benchmark) and the whole population. Because results are rounded to the nearest whole number, some totals may appear inconsistent. Two first columns represent the proportion of students who are below the Low International Benchmark and the number of students for which we have informations relative for the group used respectively. Columns “% Below LIB” represent percent of student in that group who are below the Low International Benchmark. Columns “% of Tot. Pop.” Represent the proportion of all students present in that group. A huge difference between these two columns for the same group may mean that there is a possible marginalisation. The degree of marginalization indexes show to what extent countries are marked by a specific marginalization. The more the index is high the more the marginalization will be important. For more information relative to the degrees of marginalization, see text. “na” means “not applicable”.

117
Table H.7.b. Comparison between marginalized population and global population, by Student’s Birth Country, Science, Grade 4
Country
All students Born in
country of test
Born in another country
Degree of marginalization
% Below LIB
Nb of obs.
% Below LIB
% of
Tot. Pop
% Below LIB
% of
Tot. Pop
Absolute Relative
Yemen 94 5190 53 54 47 46 2 0 Morocco 84 3524 84 85 16 15 3 1 Qatar 79 6467 39 42 61 58 6 1 Algeria 69 3953 81 84 19 16 5 1 Iran 29 3767 99 98 1 2 1 1 Tunisia 66 3827 87 89 13 11 4 1 Kuwait 66 3475 51 57 49 43 13 1 Kazakhstan 4 3984 89 92 11 8 4 1 Armenia 25 3817 65 71 35 29 12 1 El Salvador 51 4018 65 72 35 28 14 2 Singapore 4 5039 93 88 7 12 9 2 Colombia 43 4553 69 78 31 22 18 3 Mongolia 38 4112 47 62 53 38 29 3 Hong Kong 2 3747 64 76 36 24 26 4 Georgia 39 3925 74 85 26 15 22 4 New Zealand 12 4866 47 74 53 26 53 7 Australia 7 4051 63 84 37 16 42 8 Italy 5 4470 88 95 12 5 14 8 Ukraine 15 4191 66 87 34 13 42 10 Norway 14 3948 84 94 16 6 21 10 Denmark 7 3373 72 90 28 10 36 10 Russian Fed. 2 4431 81 94 19 6 26 11 Slovenia 6 4284 63 88 37 12 50 12 England 5 4253 54 85 46 15 63 12 Scotland 9 3885 57 87 43 13 60 13 Germany 4 4511 66 90 34 10 48 14 United States 6 7769 37 80 63 20 87 14 Chinese Tapei 2 4080 31 78 69 22 94 14 Czech Rep. 6 4201 85 96 15 4 22 14 Austria 6 4816 44 84 56 16 79 14 Netherlands 2 3196 40 83 60 17 86 15 Sweden 4 4610 58 89 42 11 61 16 Japan 2 4420 96 99 4 1 6 18 Hungary 5 3982 74 94 26 6 41 18 Slovak Rep. 5 4893 89 98 11 2 17 18 Lithuania 3 3950 66 92 34 8 53 19 Latvia 1 3840 35 93 65 7 116 44 Total 23 159418 64 83 36 17 37 7
Note : This table compare distribution of frequencies between the « marginalized population » (group of students who are below the Low International benchmark) and the whole population. Because results are rounded to the nearest whole number, some totals may appear inconsistent. Two first columns represent the proportion of students who are below the Low International Benchmark and the number of students for which we have informations relative for the group used respectively. Columns “% Below LIB” represent percent of student in that group who are below the Low International Benchmark. Columns “% of Tot. Pop.” Represent the proportion of all students present in that group. A huge difference between these two columns for the same group may mean that there is a possible marginalisation. The degree of marginalization indexes show to what extent countries are marked by a specific marginalization. The more the index is high the more the marginalization will be important. For more information relative to the degrees of marginalization, see text. “na” means “not applicable”.
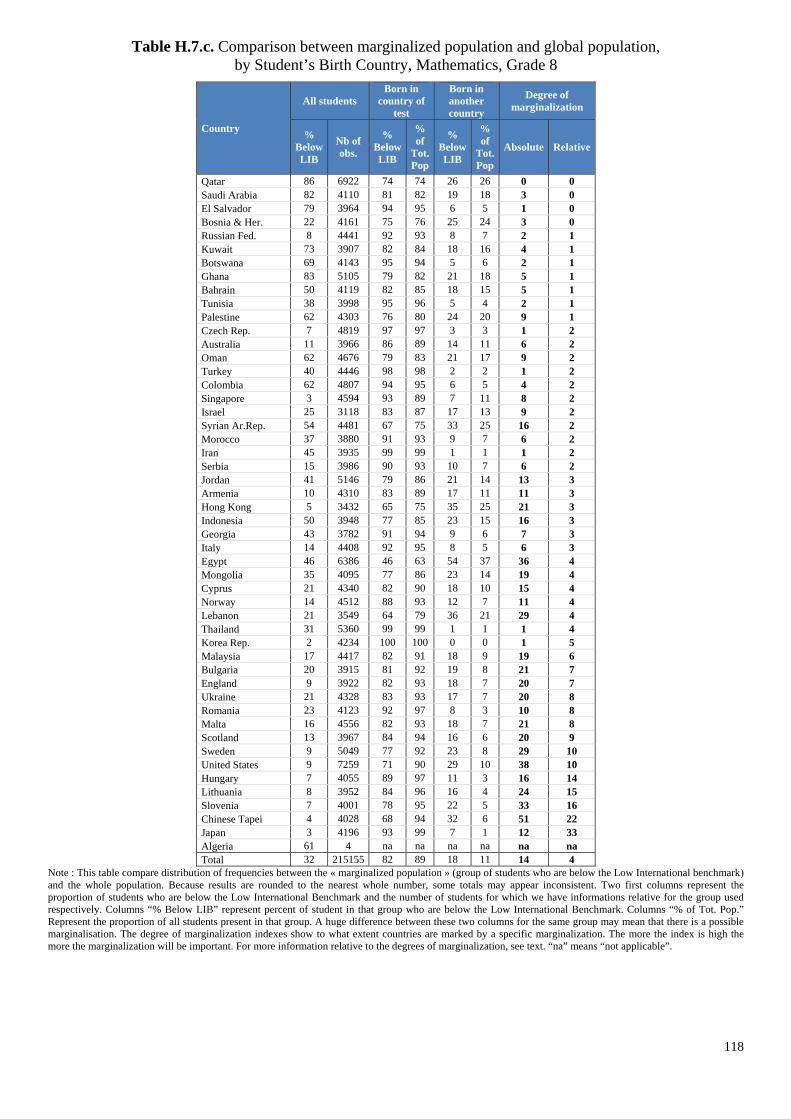
118
Table H.7.c. Comparison between marginalized population and global population, by Student’s Birth Country, Mathematics, Grade 8
Country
All students Born in
country of test
Born in another country
Degree of marginalization
% Below LIB
Nb of obs.
% Below LIB
% of
Tot. Pop
% Below LIB
% of
Tot. Pop
Absolute Relative
Qatar 86 6922 74 74 26 26 0 0 Saudi Arabia 82 4110 81 82 19 18 3 0 El Salvador 79 3964 94 95 6 5 1 0 Bosnia & Her. 22 4161 75 76 25 24 3 0 Russian Fed. 8 4441 92 93 8 7 2 1 Kuwait 73 3907 82 84 18 16 4 1 Botswana 69 4143 95 94 5 6 2 1 Ghana 83 5105 79 82 21 18 5 1 Bahrain 50 4119 82 85 18 15 5 1 Tunisia 38 3998 95 96 5 4 2 1 Palestine 62 4303 76 80 24 20 9 1 Czech Rep. 7 4819 97 97 3 3 1 2 Australia 11 3966 86 89 14 11 6 2 Oman 62 4676 79 83 21 17 9 2 Turkey 40 4446 98 98 2 2 1 2 Colombia 62 4807 94 95 6 5 4 2 Singapore 3 4594 93 89 7 11 8 2 Israel 25 3118 83 87 17 13 9 2 Syrian Ar.Rep. 54 4481 67 75 33 25 16 2 Morocco 37 3880 91 93 9 7 6 2 Iran 45 3935 99 99 1 1 1 2 Serbia 15 3986 90 93 10 7 6 2 Jordan 41 5146 79 86 21 14 13 3 Armenia 10 4310 83 89 17 11 11 3 Hong Kong 5 3432 65 75 35 25 21 3 Indonesia 50 3948 77 85 23 15 16 3 Georgia 43 3782 91 94 9 6 7 3 Italy 14 4408 92 95 8 5 6 3 Egypt 46 6386 46 63 54 37 36 4 Mongolia 35 4095 77 86 23 14 19 4 Cyprus 21 4340 82 90 18 10 15 4 Norway 14 4512 88 93 12 7 11 4 Lebanon 21 3549 64 79 36 21 29 4 Thailand 31 5360 99 99 1 1 1 4 Korea Rep. 2 4234 100 100 0 0 1 5 Malaysia 17 4417 82 91 18 9 19 6 Bulgaria 20 3915 81 92 19 8 21 7 England 9 3922 82 93 18 7 20 7 Ukraine 21 4328 83 93 17 7 20 8 Romania 23 4123 92 97 8 3 10 8 Malta 16 4556 82 93 18 7 21 8 Scotland 13 3967 84 94 16 6 20 9 Sweden 9 5049 77 92 23 8 29 10 United States 9 7259 71 90 29 10 38 10 Hungary 7 4055 89 97 11 3 16 14 Lithuania 8 3952 84 96 16 4 24 15 Slovenia 7 4001 78 95 22 5 33 16 Chinese Tapei 4 4028 68 94 32 6 51 22 Japan 3 4196 93 99 7 1 12 33 Algeria 61 4 na na na na na na Total 32 215155 82 89 18 11 14 4
Note : This table compare distribution of frequencies between the « marginalized population » (group of students who are below the Low International benchmark) and the whole population. Because results are rounded to the nearest whole number, some totals may appear inconsistent. Two first columns represent the proportion of students who are below the Low International Benchmark and the number of students for which we have informations relative for the group used respectively. Columns “% Below LIB” represent percent of student in that group who are below the Low International Benchmark. Columns “% of Tot. Pop.” Represent the proportion of all students present in that group. A huge difference between these two columns for the same group may mean that there is a possible marginalisation. The degree of marginalization indexes show to what extent countries are marked by a specific marginalization. The more the index is high the more the marginalization will be important. For more information relative to the degrees of marginalization, see text. “na” means “not applicable”.
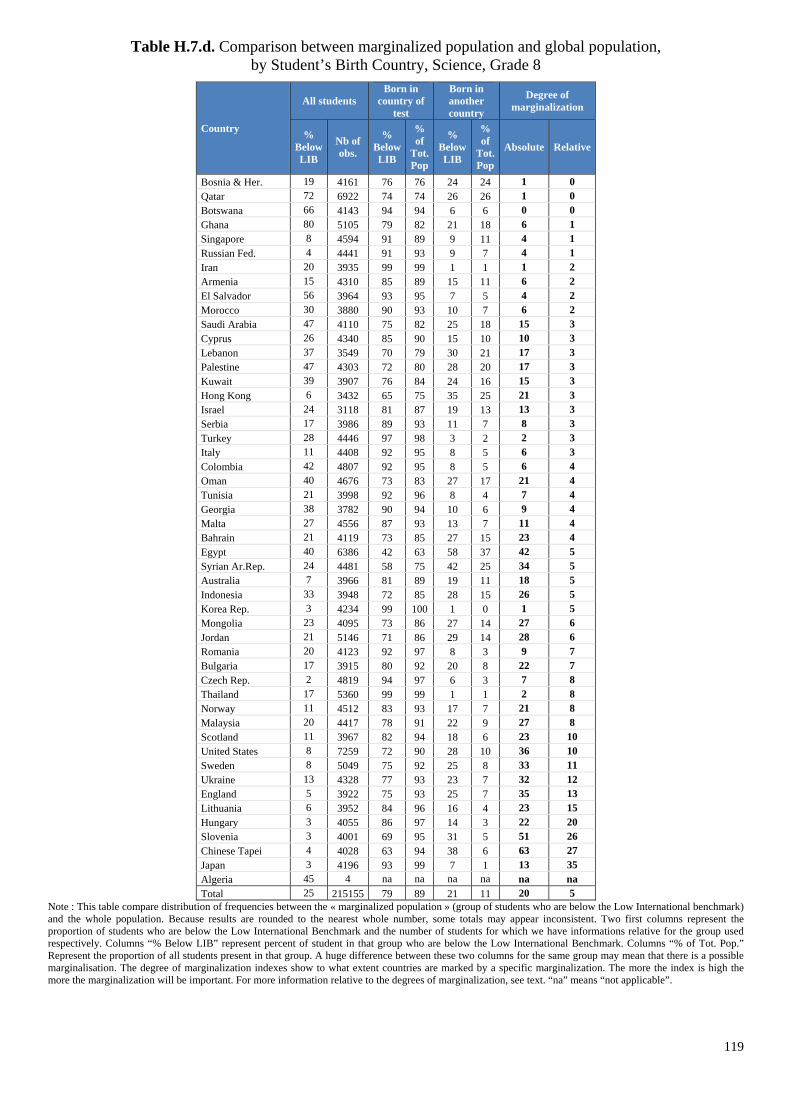
119
Table H.7.d. Comparison between marginalized population and global population, by Student’s Birth Country, Science, Grade 8
Country
All students Born in
country of test
Born in another country
Degree of marginalization
% Below LIB
Nb of obs.
% Below LIB
% of
Tot. Pop
% Below LIB
% of
Tot. Pop
Absolute Relative
Bosnia & Her. 19 4161 76 76 24 24 1 0 Qatar 72 6922 74 74 26 26 1 0 Botswana 66 4143 94 94 6 6 0 0 Ghana 80 5105 79 82 21 18 6 1 Singapore 8 4594 91 89 9 11 4 1 Russian Fed. 4 4441 91 93 9 7 4 1 Iran 20 3935 99 99 1 1 1 2 Armenia 15 4310 85 89 15 11 6 2 El Salvador 56 3964 93 95 7 5 4 2 Morocco 30 3880 90 93 10 7 6 2 Saudi Arabia 47 4110 75 82 25 18 15 3 Cyprus 26 4340 85 90 15 10 10 3 Lebanon 37 3549 70 79 30 21 17 3 Palestine 47 4303 72 80 28 20 17 3 Kuwait 39 3907 76 84 24 16 15 3 Hong Kong 6 3432 65 75 35 25 21 3 Israel 24 3118 81 87 19 13 13 3 Serbia 17 3986 89 93 11 7 8 3 Turkey 28 4446 97 98 3 2 2 3 Italy 11 4408 92 95 8 5 6 3 Colombia 42 4807 92 95 8 5 6 4 Oman 40 4676 73 83 27 17 21 4 Tunisia 21 3998 92 96 8 4 7 4 Georgia 38 3782 90 94 10 6 9 4 Malta 27 4556 87 93 13 7 11 4 Bahrain 21 4119 73 85 27 15 23 4 Egypt 40 6386 42 63 58 37 42 5 Syrian Ar.Rep. 24 4481 58 75 42 25 34 5 Australia 7 3966 81 89 19 11 18 5 Indonesia 33 3948 72 85 28 15 26 5 Korea Rep. 3 4234 99 100 1 0 1 5 Mongolia 23 4095 73 86 27 14 27 6 Jordan 21 5146 71 86 29 14 28 6 Romania 20 4123 92 97 8 3 9 7 Bulgaria 17 3915 80 92 20 8 22 7 Czech Rep. 2 4819 94 97 6 3 7 8 Thailand 17 5360 99 99 1 1 2 8 Norway 11 4512 83 93 17 7 21 8 Malaysia 20 4417 78 91 22 9 27 8 Scotland 11 3967 82 94 18 6 23 10 United States 8 7259 72 90 28 10 36 10 Sweden 8 5049 75 92 25 8 33 11 Ukraine 13 4328 77 93 23 7 32 12 England 5 3922 75 93 25 7 35 13 Lithuania 6 3952 84 96 16 4 23 15 Hungary 3 4055 86 97 14 3 22 20 Slovenia 3 4001 69 95 31 5 51 26 Chinese Tapei 4 4028 63 94 38 6 63 27 Japan 3 4196 93 99 7 1 13 35 Algeria 45 4 na na na na na na Total 25 215155 79 89 21 11 20 5
Note : This table compare distribution of frequencies between the « marginalized population » (group of students who are below the Low International benchmark) and the whole population. Because results are rounded to the nearest whole number, some totals may appear inconsistent. Two first columns represent the proportion of students who are below the Low International Benchmark and the number of students for which we have informations relative for the group used respectively. Columns “% Below LIB” represent percent of student in that group who are below the Low International Benchmark. Columns “% of Tot. Pop.” Represent the proportion of all students present in that group. A huge difference between these two columns for the same group may mean that there is a possible marginalisation. The degree of marginalization indexes show to what extent countries are marked by a specific marginalization. The more the index is high the more the marginalization will be important. For more information relative to the degrees of marginalization, see text. “na” means “not applicable”.
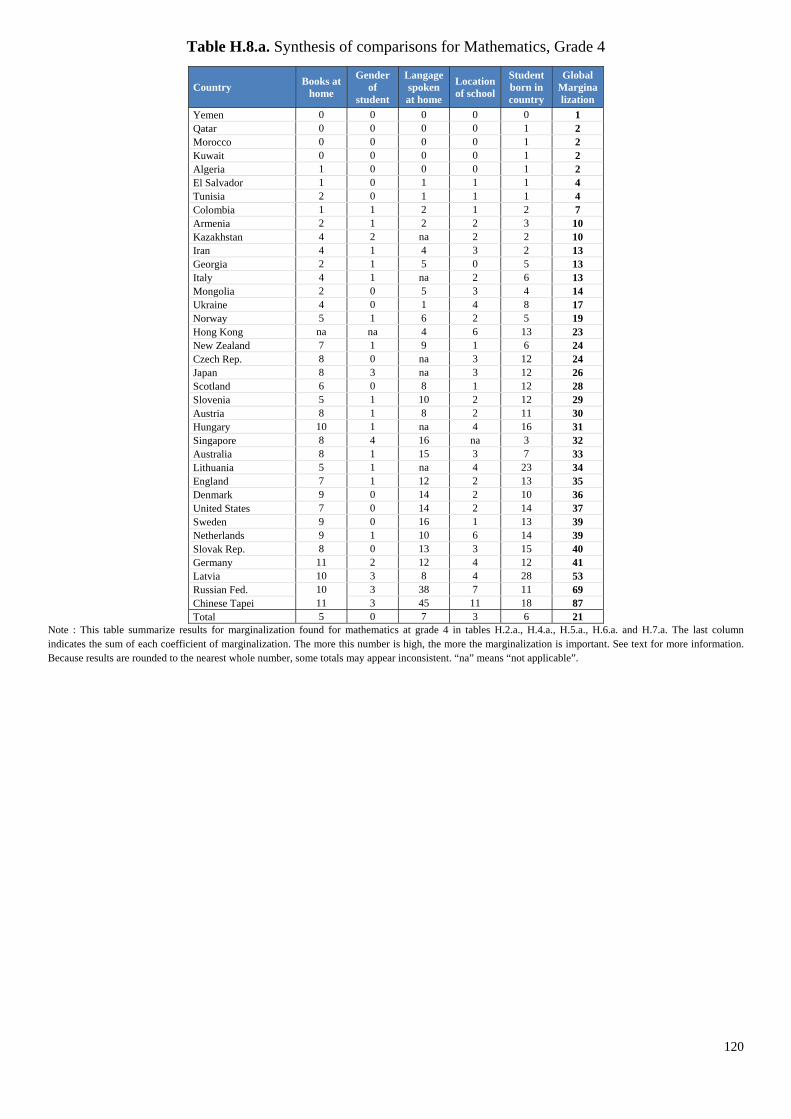
120
Table H.8.a. Synthesis of comparisons for Mathematics, Grade 4
Country Books at home
Gender of
student
Langage spoken at home
Location of school
Student born in country
Global Marginalization
Yemen 0 0 0 0 0 1 Qatar 0 0 0 0 1 2 Morocco 0 0 0 0 1 2 Kuwait 0 0 0 0 1 2 Algeria 1 0 0 0 1 2 El Salvador 1 0 1 1 1 4 Tunisia 2 0 1 1 1 4 Colombia 1 1 2 1 2 7 Armenia 2 1 2 2 3 10 Kazakhstan 4 2 na 2 2 10 Iran 4 1 4 3 2 13 Georgia 2 1 5 0 5 13 Italy 4 1 na 2 6 13 Mongolia 2 0 5 3 4 14 Ukraine 4 0 1 4 8 17 Norway 5 1 6 2 5 19 Hong Kong na na 4 6 13 23 New Zealand 7 1 9 1 6 24 Czech Rep. 8 0 na 3 12 24 Japan 8 3 na 3 12 26 Scotland 6 0 8 1 12 28 Slovenia 5 1 10 2 12 29 Austria 8 1 8 2 11 30 Hungary 10 1 na 4 16 31 Singapore 8 4 16 na 3 32 Australia 8 1 15 3 7 33 Lithuania 5 1 na 4 23 34 England 7 1 12 2 13 35 Denmark 9 0 14 2 10 36 United States 7 0 14 2 14 37 Sweden 9 0 16 1 13 39 Netherlands 9 1 10 6 14 39 Slovak Rep. 8 0 13 3 15 40 Germany 11 2 12 4 12 41 Latvia 10 3 8 4 28 53 Russian Fed. 10 3 38 7 11 69 Chinese Tapei 11 3 45 11 18 87 Total 5 0 7 3 6 21
Note : This table summarize results for marginalization found for mathematics at grade 4 in tables H.2.a., H.4.a., H.5.a., H.6.a. and H.7.a. The last column indicates the sum of each coefficient of marginalization. The more this number is high, the more the marginalization is important. See text for more information. Because results are rounded to the nearest whole number, some totals may appear inconsistent. “na” means “not applicable”.
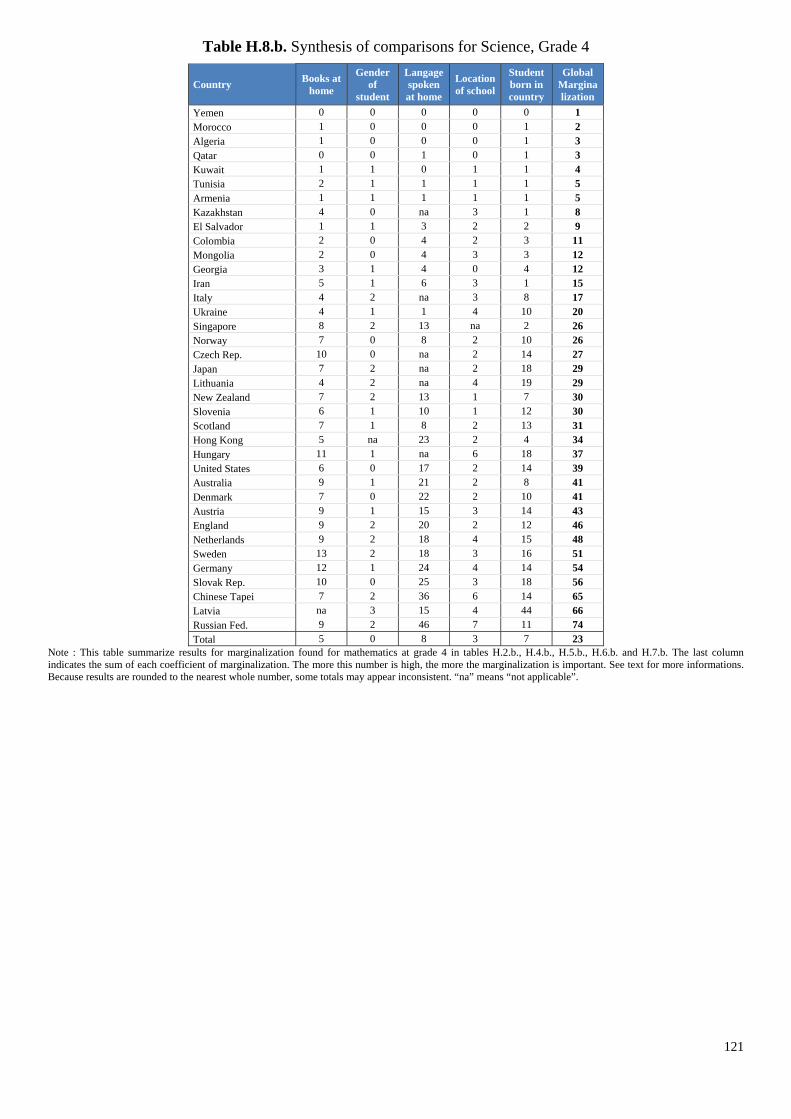
121
Table H.8.b. Synthesis of comparisons for Science, Grade 4
Country Books at home
Gender of
student
Langage spoken at home
Location of school
Student born in country
Global Marginalization
Yemen 0 0 0 0 0 1 Morocco 1 0 0 0 1 2 Algeria 1 0 0 0 1 3 Qatar 0 0 1 0 1 3 Kuwait 1 1 0 1 1 4 Tunisia 2 1 1 1 1 5 Armenia 1 1 1 1 1 5 Kazakhstan 4 0 na 3 1 8 El Salvador 1 1 3 2 2 9 Colombia 2 0 4 2 3 11 Mongolia 2 0 4 3 3 12 Georgia 3 1 4 0 4 12 Iran 5 1 6 3 1 15 Italy 4 2 na 3 8 17 Ukraine 4 1 1 4 10 20 Singapore 8 2 13 na 2 26 Norway 7 0 8 2 10 26 Czech Rep. 10 0 na 2 14 27 Japan 7 2 na 2 18 29 Lithuania 4 2 na 4 19 29 New Zealand 7 2 13 1 7 30 Slovenia 6 1 10 1 12 30 Scotland 7 1 8 2 13 31 Hong Kong 5 na 23 2 4 34 Hungary 11 1 na 6 18 37 United States 6 0 17 2 14 39 Australia 9 1 21 2 8 41 Denmark 7 0 22 2 10 41 Austria 9 1 15 3 14 43 England 9 2 20 2 12 46 Netherlands 9 2 18 4 15 48 Sweden 13 2 18 3 16 51 Germany 12 1 24 4 14 54 Slovak Rep. 10 0 25 3 18 56 Chinese Tapei 7 2 36 6 14 65 Latvia na 3 15 4 44 66 Russian Fed. 9 2 46 7 11 74 Total 5 0 8 3 7 23
Note : This table summarize results for marginalization found for mathematics at grade 4 in tables H.2.b., H.4.b., H.5.b., H.6.b. and H.7.b. The last column indicates the sum of each coefficient of marginalization. The more this number is high, the more the marginalization is important. See text for more informations. Because results are rounded to the nearest whole number, some totals may appear inconsistent. “na” means “not applicable”.
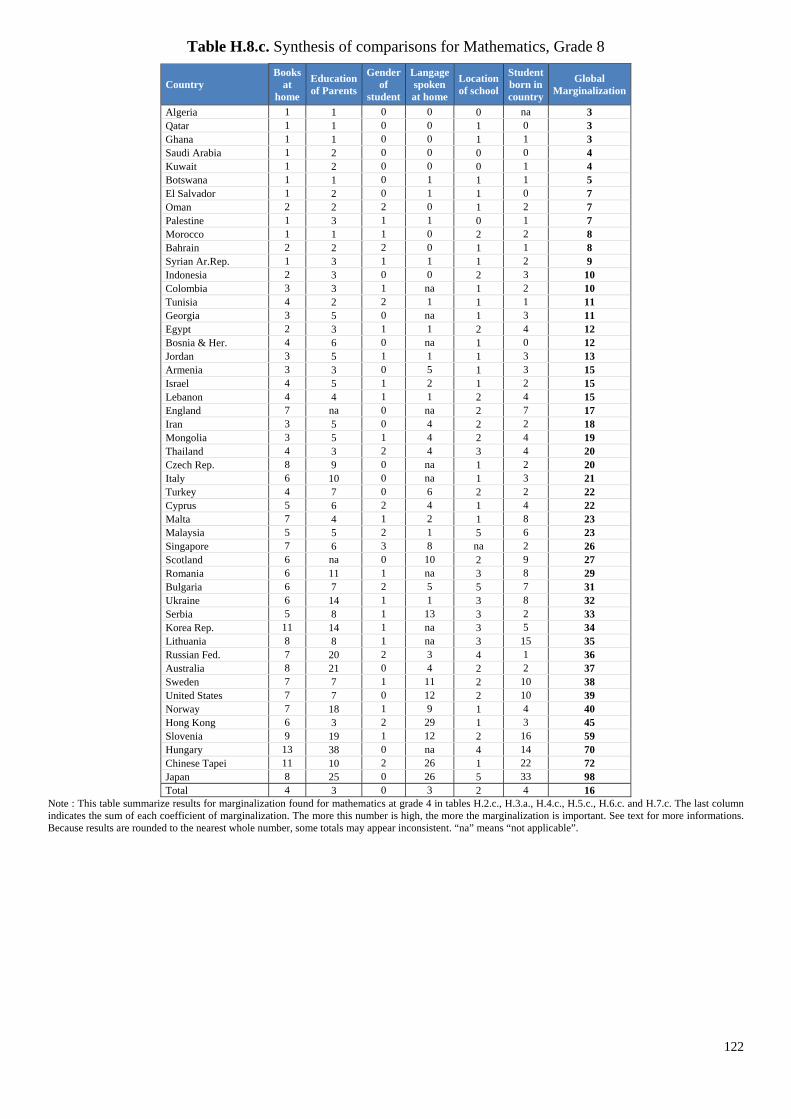
122
Table H.8.c. Synthesis of comparisons for Mathematics, Grade 8
Country Books
at home
Education of Parents
Gender of
student
Langage spoken at home
Location of school
Student born in country
Global Marginalization
Algeria 1 1 0 0 0 na 3 Qatar 1 1 0 0 1 0 3 Ghana 1 1 0 0 1 1 3 Saudi Arabia 1 2 0 0 0 0 4 Kuwait 1 2 0 0 0 1 4 Botswana 1 1 0 1 1 1 5 El Salvador 1 2 0 1 1 0 7 Oman 2 2 2 0 1 2 7 Palestine 1 3 1 1 0 1 7 Morocco 1 1 1 0 2 2 8 Bahrain 2 2 2 0 1 1 8 Syrian Ar.Rep. 1 3 1 1 1 2 9 Indonesia 2 3 0 0 2 3 10 Colombia 3 3 1 na 1 2 10 Tunisia 4 2 2 1 1 1 11 Georgia 3 5 0 na 1 3 11 Egypt 2 3 1 1 2 4 12 Bosnia & Her. 4 6 0 na 1 0 12 Jordan 3 5 1 1 1 3 13 Armenia 3 3 0 5 1 3 15 Israel 4 5 1 2 1 2 15 Lebanon 4 4 1 1 2 4 15 England 7 na 0 na 2 7 17 Iran 3 5 0 4 2 2 18 Mongolia 3 5 1 4 2 4 19 Thailand 4 3 2 4 3 4 20 Czech Rep. 8 9 0 na 1 2 20 Italy 6 10 0 na 1 3 21 Turkey 4 7 0 6 2 2 22 Cyprus 5 6 2 4 1 4 22 Malta 7 4 1 2 1 8 23 Malaysia 5 5 2 1 5 6 23 Singapore 7 6 3 8 na 2 26 Scotland 6 na 0 10 2 9 27 Romania 6 11 1 na 3 8 29 Bulgaria 6 7 2 5 5 7 31 Ukraine 6 14 1 1 3 8 32 Serbia 5 8 1 13 3 2 33 Korea Rep. 11 14 1 na 3 5 34 Lithuania 8 8 1 na 3 15 35 Russian Fed. 7 20 2 3 4 1 36 Australia 8 21 0 4 2 2 37 Sweden 7 7 1 11 2 10 38 United States 7 7 0 12 2 10 39 Norway 7 18 1 9 1 4 40 Hong Kong 6 3 2 29 1 3 45 Slovenia 9 19 1 12 2 16 59 Hungary 13 38 0 na 4 14 70 Chinese Tapei 11 10 2 26 1 22 72 Japan 8 25 0 26 5 33 98 Total 4 3 0 3 2 4 16
Note : This table summarize results for marginalization found for mathematics at grade 4 in tables H.2.c., H.3.a., H.4.c., H.5.c., H.6.c. and H.7.c. The last column indicates the sum of each coefficient of marginalization. The more this number is high, the more the marginalization is important. See text for more informations. Because results are rounded to the nearest whole number, some totals may appear inconsistent. “na” means “not applicable”.

123
Table H.8.a. Synthesis of comparisons for Science, Grade 8
Country Books at home
Education of
Parents
Gender of
student
Langage spoken at home
Location of school
Student born in country
Global Marginalization
Algeria 1 1 0 0 0 na 3 Ghana 1 1 0 1 1 1 4 Botswana 1 1 1 2 1 0 6 Qatar 1 1 1 2 1 0 6 Morocco 1 1 0 1 3 2 8 Palestine 2 3 2 1 0 3 10 Saudi Arabia 2 2 3 0 1 3 10 Armenia 2 3 1 3 1 2 12 Kuwait 2 2 3 1 1 3 12 Bosnia & Her. 4 6 0 na 1 0 12 Egypt 2 3 1 1 2 5 12 Oman 2 2 3 0 1 4 12 El Salvador 3 2 1 3 2 2 12 Indonesia 2 3 0 1 2 5 13 Lebanon 3 4 0 2 2 3 13 Georgia 3 5 1 na 0 4 14 Syrian Ar.Rep. 2 3 1 3 1 5 14 Colombia 4 3 2 na 2 4 15 Tunisia 3 2 2 2 1 4 15 Bahrain 3 2 6 0 1 4 17 Malta 6 4 0 2 1 4 17 Israel 4 5 1 4 1 3 18 Cyprus 5 6 2 4 1 3 19 Jordan 3 5 4 2 0 6 20 Italy 7 10 0 na 1 3 22 England 8 na 0 na 2 13 23 Mongolia 3 5 0 8 2 6 24 Iran 5 5 1 7 4 2 24 Malaysia 5 5 2 3 3 8 25 Singapore 8 6 2 9 na 1 26 Romania 6 11 1 na 3 7 28 Turkey 4 7 1 10 3 3 28 Thailand 4 3 3 7 3 8 28 Serbia 5 8 1 13 3 3 33 Korea Rep. 12 14 1 na 1 5 33 Scotland 7 na 0 15 2 10 34 Lithuania 9 8 0 na 3 15 34 Bulgaria 6 7 2 9 4 7 36 Czech Rep. 15 9 2 na 3 8 36 United States 8 7 1 11 2 10 39 Ukraine 7 14 1 2 3 12 39 Hong Kong 6 3 2 24 2 3 41 Russian Fed. 8 20 1 7 5 1 42 Sweden 9 7 1 12 1 11 42 Australia 11 21 1 11 2 5 51 Norway 9 18 0 16 1 8 53 Chinese Tapei 11 10 2 16 2 27 69 Japan 8 25 0 na 4 35 72 Slovenia 11 19 2 14 3 26 74 Hungary 18 38 3 na 8 20 86 Total 4 3 1 4 2 5 20
Note : This table summarize results for marginalization found for mathematics at grade 4 in tables H.2.d., H.3.b., H.4.d., H.5.d., H.6.d. and H.7.d. The last column indicates the sum of each coefficient of marginalization. The more this number is high, the more the marginalization is important. See text for more informations. Because results are rounded to the nearest whole number, some totals may appear inconsistent. “na” means “not applicable”.
124
ANNEX I
Logistic Regression

125
Table I.1.a. Predicted Probabilities for Logistic Regression, By Location of School and Student’s Birth Country, Mathematics, Grade 4 (Part 1/2)
Student born in country
More than 100,001
15,001 to 100,000 3,001 to 15,000 Less than 3,000
% Below LIB
% Pop
% Below LIB
% Pop
% Below LIB
% Pop
% Below LIB
% Pop
Armenia No 14 13.8 14 7.5 15 10.9 16 6.8 Yes 8 34.2 9 19.9 9 28.6 10 17.2
Australia No 11 8.9 14 5.1 17 3.3 22 1.4 Yes 4 45.1 5 27.0 6 18.0 8 9.9
Austria No 17 7.5 15 1.8 13 6.3 12 3.7 Yes 5 29.7 4 8.9 4 41.0 3 20.4
Chinese Tapei No 1 17.1 1 9.5 2 0.2 3 0.4 Yes 0 70.6 0 28.2 0 0.4 0 0.7
Colombia No 78 16.3 83 7.9 87 2.7 90 1.9 Yes 58 55.6 65 25.4 71 9.1 77 9.9
Czech Rep. No 19 0.6 23 1.8 28 1.4 34 0.4 Yes 6 18.9 7 41.3 9 26.4 11 13.4
Denmark No 5 2.2 6 4.1 6 2.8 6 0.9 Yes 2 18.1 2 35.4 2 29.3 3 11.5
El Salvador No 71 5.5 83 7.3 90 10.6 95 13.0 Yes 51 18.9 66 23.2 79 30.6 88 27.3
England No 17 9.1 15 4.3 13 2.7 11 0.6 Yes 3 42.9 3 33.7 2 18.8 2 4.6
Georgia No 53 7.8 53 4.3 54 2.5 54 2.7 Yes 25 43.3 25 24.6 25 13.6 26 18.6
Germany No 9 2.9 6 4.7 4 2.0 2 0.9 Yes 3 24.8 2 33.1 1 26.9 1 15.1
Hungary No 13 1.4 18 2.0 26 1.6 35 1.2 Yes 3 22.0 4 41.4 7 27.0 10 9.6
Iran No 54 1.0 61 0.3 67 0.4 73 0.2 Yes 35 50.9 41 16.8 48 12.3 55 19.9
Italy No 19 0.9 18 2.4 16 1.7 15 0.1 Yes 8 20.8 7 46.0 7 30.0 6 3.2
Japan No 1 0.6 2 0.2 3 0.0 na na Yes 1 73.0 2 25.1 4 1.9 na na
Kazakhstan No 4 4.1 5 2.4 5 1.7 7 1.0 Yes 3 44.4 4 21.0 4 23.9 5 10.7
Kuwait No 86 9.8 85 17.8 83 28.5 82 9.4 Yes 76 14.6 74 27.7 72 41.5 70 16.2
Latvia No 4 1.1 6 2.7 8 2.1 11 1.1 Yes 1 27.6 1 30.7 1 28.8 2 12.9
Note : This table reports predicted probabilities and proportion of student in each sub-group related to a logistic regression, which includes several independent variables (books at home, gender of student, langage spoken at home, location of school and student’ birth country). The predicted probabilities are computed for the two variables (Location of School and Student’s Birth Country) after having controlled for the other variables (assumed to be on their mean value). Because results are rounded to the nearest whole number, some totals may appear inconsistent. See text for more details.
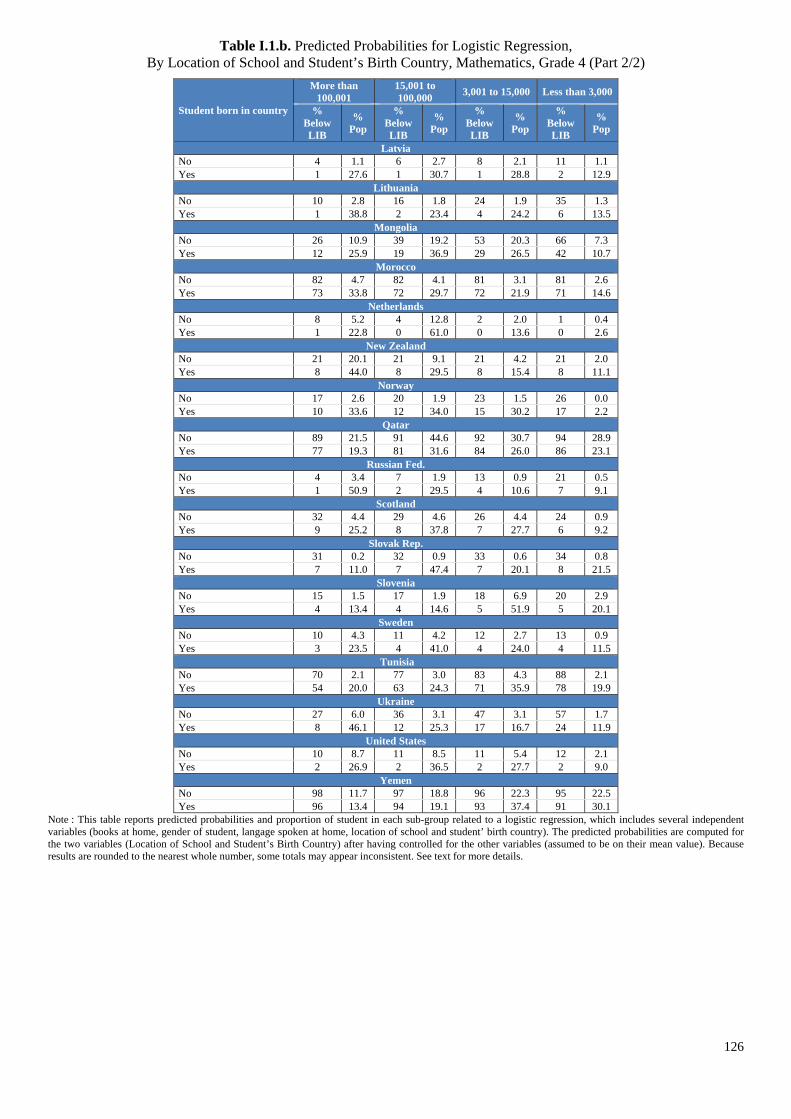
126
Table I.1.b. Predicted Probabilities for Logistic Regression, By Location of School and Student’s Birth Country, Mathematics, Grade 4 (Part 2/2)
Student born in country
More than 100,001
15,001 to 100,000 3,001 to 15,000 Less than 3,000
% Below LIB
% Pop
% Below LIB
% Pop
% Below LIB
% Pop
% Below LIB
% Pop
Latvia No 4 1.1 6 2.7 8 2.1 11 1.1 Yes 1 27.6 1 30.7 1 28.8 2 12.9
Lithuania No 10 2.8 16 1.8 24 1.9 35 1.3 Yes 1 38.8 2 23.4 4 24.2 6 13.5
Mongolia No 26 10.9 39 19.2 53 20.3 66 7.3 Yes 12 25.9 19 36.9 29 26.5 42 10.7
Morocco No 82 4.7 82 4.1 81 3.1 81 2.6 Yes 73 33.8 72 29.7 72 21.9 71 14.6
Netherlands No 8 5.2 4 12.8 2 2.0 1 0.4 Yes 1 22.8 0 61.0 0 13.6 0 2.6
New Zealand No 21 20.1 21 9.1 21 4.2 21 2.0 Yes 8 44.0 8 29.5 8 15.4 8 11.1
Norway No 17 2.6 20 1.9 23 1.5 26 0.0 Yes 10 33.6 12 34.0 15 30.2 17 2.2
Qatar No 89 21.5 91 44.6 92 30.7 94 28.9 Yes 77 19.3 81 31.6 84 26.0 86 23.1
Russian Fed. No 4 3.4 7 1.9 13 0.9 21 0.5 Yes 1 50.9 2 29.5 4 10.6 7 9.1
Scotland No 32 4.4 29 4.6 26 4.4 24 0.9 Yes 9 25.2 8 37.8 7 27.7 6 9.2
Slovak Rep. No 31 0.2 32 0.9 33 0.6 34 0.8 Yes 7 11.0 7 47.4 7 20.1 8 21.5
Slovenia No 15 1.5 17 1.9 18 6.9 20 2.9 Yes 4 13.4 4 14.6 5 51.9 5 20.1
Sweden No 10 4.3 11 4.2 12 2.7 13 0.9 Yes 3 23.5 4 41.0 4 24.0 4 11.5
Tunisia No 70 2.1 77 3.0 83 4.3 88 2.1 Yes 54 20.0 63 24.3 71 35.9 78 19.9
Ukraine No 27 6.0 36 3.1 47 3.1 57 1.7 Yes 8 46.1 12 25.3 17 16.7 24 11.9
United States No 10 8.7 11 8.5 11 5.4 12 2.1 Yes 2 26.9 2 36.5 2 27.7 2 9.0
Yemen No 98 11.7 97 18.8 96 22.3 95 22.5 Yes 96 13.4 94 19.1 93 37.4 91 30.1
Note : This table reports predicted probabilities and proportion of student in each sub-group related to a logistic regression, which includes several independent variables (books at home, gender of student, langage spoken at home, location of school and student’ birth country). The predicted probabilities are computed for the two variables (Location of School and Student’s Birth Country) after having controlled for the other variables (assumed to be on their mean value). Because results are rounded to the nearest whole number, some totals may appear inconsistent. See text for more details.

127
Table I.2.a. Predicted Probabilities for Logistic Regression, By Location of School and Student’s Birth Country, Mathematics, Grade 8 (Part 1/3)
Student born in country
More than 100,001
15,001 to 100,000 3,001 to 15,000 Less than 3,000
% Below LIB
% Pop
% Below LIB
% Pop
% Below LIB
% Pop
% Below LIB
% Pop
Armenia No 13 4.1 13 2.4 12 3.7 11 2.1 Yes 11 36.5 10 19.3 9 28.4 9 15.8
Australia No 7 8.4 9 2.7 11 0.8 13 0.3 Yes 7 51.3 8 30.8 10 11.3 12 6.6
Bahrain No 55 3.5 55 8.1 55 4.1 56 2.8 Yes 48 14.6 49 39.3 49 27.2 49 18.9
Bosnia & Her. No 19 3.5 21 13.1 23 9.5 25 4.6 Yes 18 14.0 20 42.8 21 31.8 23 11.4
Botswana No 53 1.3 62 1.8 70 1.6 78 1.4 Yes 55 11.1 64 31.3 72 33.2 79 24.3
Bulgaria No 29 2.5 35 3.4 41 1.6 47 1.3 Yes 14 41.6 18 41.5 22 8.6 26 8.3
Chinese Tapei No 9 4.1 9 2.5 9 0.1 0 Yes 1 62.8 1 34.5 1 2.8 0
Colombia No 81 2.1 86 1.5 90 0.9 93 0.3 Yes 55 55.8 64 25.9 73 13.2 80 5.1
Cyprus No 30 1.8 32 6.1 33 2.5 35 0.5 Yes 16 17.3 17 39.2 18 37.6 19 5.9
Czech Rep. No 4 0.8 5 1.1 5 0.5 6 0.2 Yes 5 17.4 5 43.0 6 28.2 6 11.4
Egypt No 66 22.8 70 17.3 74 11.9 78 4.4 Yes 32 45.7 37 25.1 42 22.7 47 6.5
El Salvador No 81 1.1 87 1.2 91 1.7 94 1.2 Yes 72 20.7 80 28.4 86 32.7 91 18.2
Georgia No 65 2.2 64 1.9 63 0.9 61 0.8 Yes 41 43.8 40 23.1 39 15.9 37 17.2
Ghana No 94 6.3 95 2.8 96 5.9 97 5.9 Yes 76 28.6 80 13.9 84 27.9 87 29.6
Hong Kong No 5 28.0 3 5.4 0 0.0 0 0.0 Yes 4 87.1 2 12.9 0 0.0 0 0.0
Hungary No 12 0.8 14 1.0 17 0.8 19 0.3 Yes 4 26.5 4 39.2 5 24.5 6 9.7
Indonesia No 69 8.3 75 6.1 80 3.0 84 0.4 Yes 42 42.2 49 45.4 56 11.5 63 0.9
Iran No 56 0.5 62 0.2 68 0.2 73 0.1 Yes 39 56.4 45 13.2 52 15.7 58 14.6
Note : This table reports predicted probabilities and proportion of student in each sub-group related to a logistic regression, which includes several independent variables (books at home, gender of student, langage spoken at home, location of school and student’ birth country and education of parents). The predicted probabilities are computed for the two variables (Location of School and Student’s Birth Country) after having controlled for the other variables (assumed to be on their mean value). Because results are rounded to the nearest whole number, some totals may appear inconsistent. See text for more details.

128
Table I.2.b. Predicted Probabilities for Logistic Regression, By Location of School and Student’s Birth Country, Mathematics, Grade 8 (Part 2/3)
Student born in country
More than 100,001
15,001 to 100,000 3,001 to 15,000 Less than 3,000
% Below LIB
% Pop
% Below LIB
% Pop
% Below LIB
% Pop
% Below LIB
% Pop
Israel No 20 3.9 25 5.0 31 3.7 38 1.0 Yes 14 28.8 18 38.0 23 28.2 29 5.0
Italy No 18 1.4 18 1.9 17 1.7 17 0.2 Yes 12 23.5 12 46.3 12 26.8 12 3.5
Japan No 10 0.7 11 0.2 12 0.0 13 0.0 Yes 2 66.2 2 30.5 2 2.9 2 0.3
Jordan No 48 7.7 52 4.2 57 3.2 62 1.2 Yes 28 40.5 32 26.8 36 25.1 41 7.5
Kuwait No 79 2.5 80 6.4 80 7.9 81 2.3 Yes 70 11.1 71 35.5 71 39.1 72 14.2
Lebanon No 31 4.8 33 12.4 35 5.9 37 2.6 Yes 16 27.8 17 41.3 18 19.8 20 11.1
Lithuania No 17 1.6 22 0.7 27 1.1 34 0.7 Yes 3 36.7 5 23.6 6 25.0 8 14.8
Malaysia No 19 2.6 29 5.0 41 1.6 55 0.4 Yes 7 28.6 12 41.6 18 24.6 28 5.2
Malta No 35 0.0 39 1.5 44 4.7 0 1.1 Yes 11 0.0 13 21.0 15 65.8 0 13.2
Mongolia No 43 2.6 53 4.9 62 5.2 70 2.8 Yes 19 23.8 26 33.2 34 32.2 43 10.8
Morocco No 89 3.1 91 2.4 93 1.3 94 0.1 Yes 54 44.6 60 38.1 66 16.2 71 1.2
Norway No 13 1.9 14 3.6 15 1.5 16 0.0 Yes 9 20.6 10 47.4 11 31.1 12 0.9
Oman No 74 1.4 75 8.4 77 5.1 79 4.2 Yes 54 11.3 56 36.3 59 29.3 61 23.2
Palestine No 75 6.5 75 8.0 75 6.5 76 2.7 Yes 58 34.7 58 33.6 59 21.8 59 10.0
Qatar No 82 4.4 85 9.3 87 15.4 89 5.8 Yes 81 15.8 84 23.1 87 47.0 89 14.1
Romania No 49 1.1 53 0.9 57 0.6 61 0.6 Yes 16 38.1 18 28.4 21 21.3 23 12.3
Russian Fed. No 5 3.7 8 1.8 11 1.1 14 0.9 Yes 4 52.8 6 20.6 9 16.1 12 10.5
Saudi Arabia No 86 10.2 89 3.6 91 4.1 93 2.0 Yes 79 51.7 83 16.7 86 17.2 89 14.3
Note : This table reports predicted probabilities and proportion of student in each sub-group related to a logistic regression, which includes several independent variables (books at home, gender of student, langage spoken at home, location of school and student’ birth country and education of parents). The predicted probabilities are computed for the two variables (Location of School and Student’s Birth Country) after having controlled for the other variables (assumed to be on their mean value). Because results are rounded to the nearest whole number, some totals may appear inconsistent. See text for more details.
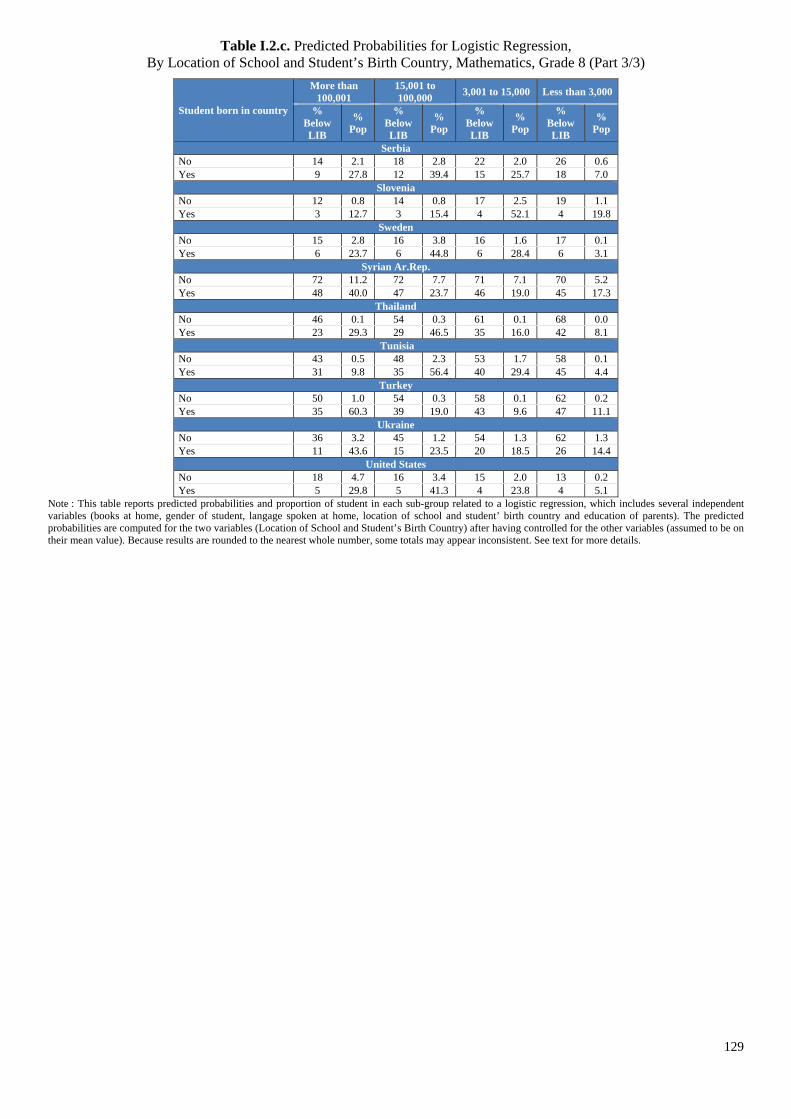
129
Table I.2.c. Predicted Probabilities for Logistic Regression, By Location of School and Student’s Birth Country, Mathematics, Grade 8 (Part 3/3)
Student born in country
More than 100,001
15,001 to 100,000 3,001 to 15,000 Less than 3,000
% Below LIB
% Pop
% Below LIB
% Pop
% Below LIB
% Pop
% Below LIB
% Pop
Serbia No 14 2.1 18 2.8 22 2.0 26 0.6 Yes 9 27.8 12 39.4 15 25.7 18 7.0
Slovenia No 12 0.8 14 0.8 17 2.5 19 1.1 Yes 3 12.7 3 15.4 4 52.1 4 19.8
Sweden No 15 2.8 16 3.8 16 1.6 17 0.1 Yes 6 23.7 6 44.8 6 28.4 6 3.1
Syrian Ar.Rep. No 72 11.2 72 7.7 71 7.1 70 5.2 Yes 48 40.0 47 23.7 46 19.0 45 17.3
Thailand No 46 0.1 54 0.3 61 0.1 68 0.0 Yes 23 29.3 29 46.5 35 16.0 42 8.1
Tunisia No 43 0.5 48 2.3 53 1.7 58 0.1 Yes 31 9.8 35 56.4 40 29.4 45 4.4
Turkey No 50 1.0 54 0.3 58 0.1 62 0.2 Yes 35 60.3 39 19.0 43 9.6 47 11.1
Ukraine No 36 3.2 45 1.2 54 1.3 62 1.3 Yes 11 43.6 15 23.5 20 18.5 26 14.4
United States No 18 4.7 16 3.4 15 2.0 13 0.2 Yes 5 29.8 5 41.3 4 23.8 4 5.1
Note : This table reports predicted probabilities and proportion of student in each sub-group related to a logistic regression, which includes several independent variables (books at home, gender of student, langage spoken at home, location of school and student’ birth country and education of parents). The predicted probabilities are computed for the two variables (Location of School and Student’s Birth Country) after having controlled for the other variables (assumed to be on their mean value). Because results are rounded to the nearest whole number, some totals may appear inconsistent. See text for more details.

130
Table I.3.a. Predicted Probabilities for Logistic Regression, By Education of Parents and Student’s Birth Country, Mathematics, Grade 8 (Part 1/3)
Student born in country of test
University level Secondary Less than secondary Do not know
% Below LIB
% Pop
% Below LIB
% Pop
% Below LIB
% Pop
% Below LIB
% Pop
Armenia No 12 6.3 13 3.1 15 0.6 17 1.0 Yes 9 70.9 11 12.6 12 0.4 13 5.2
Australia No 7 4.8 8 2.2 10 0.2 12 3.6 Yes 6 35.9 7 26.6 9 0.5 11 26.1
Bahrain No 49 6.0 55 6.1 60 0.9 66 2.6 Yes 42 24.5 48 39.2 54 4.8 59 15.8
Bosnia & Her. No 16 8.7 24 13.6 34 0.3 46 0.8 Yes 15 22.4 22 51.2 32 1.2 44 1.8
Botswana No 71 3.1 69 1.4 66 0.4 64 1.0 Yes 73 28.8 70 33.7 68 13.0 65 18.7
Bulgaria No 32 4.2 37 2.7 42 0.2 48 1.0 Yes 16 63.3 19 20.4 22 0.6 27 7.6
Chinese Tapei No 6 1.9 9 3.1 14 0.3 20 0.9 Yes 1 30.6 1 53.0 2 2.6 3 7.6
Colombia No 78 1.0 84 1.8 89 1.3 92 0.4 Yes 51 27.5 61 41.0 70 21.4 78 5.6
Cyprus No 24 5.3 35 3.1 48 0.4 61 1.0 Yes 12 36.1 19 44.3 28 3.9 40 5.9
Czech Rep. No 3 1.0 5 1.3 7 0.0 11 0.2 Yes 4 28.1 6 57.2 8 0.1 12 12.1
Egypt No 65 14.3 71 13.7 76 4.4 81 3.6 Yes 31 29.1 37 22.2 44 7.1 51 5.6
El Salvador No 80 1.4 89 2.7 95 0.6 97 0.3 Yes 71 21.5 83 56.0 91 14.4 95 3.0
Georgia No 60 2.8 65 1.6 70 0.1 75 1.1 Yes 36 51.6 41 27.0 47 0.3 52 15.6
Ghana No 95 6.0 96 7.8 97 2.3 98 1.2 Yes 79 27.1 83 40.5 86 10.2 89 4.9
Hong Kong No 4 5.5 5 14.8 6 1.3 8 3.5 Yes 3 20.0 3 41.9 4 1.5 6 11.5
Hungary No 12 1.1 16 1.4 21 0.2 27 0.1 Yes 3 43.1 5 48.9 6 0.4 9 4.8
Indonesia No 61 1.6 71 7.8 79 3.9 85 1.9 Yes 34 14.1 44 41.0 55 22.7 65 7.1
Iran No 50 0.3 61 0.4 71 0.2 80 0.0 Yes 33 26.7 44 45.0 56 24.7 67 2.6
Note : This table reports predicted probabilities and proportion of student in each sub-group related to a logistic regression, which includes several independent variables (books at home, gender of student, langage spoken at home, location of school and student’ birth country and education of parents). The predicted probabilities are computed for the two variables (Education of Parents and Student’s Birth Country) after having controlled for the other variables (assumed to be on their mean value). Because results are rounded to the nearest whole number, some totals may appear inconsistent. See text for more details.

131
Table I.3.b. Predicted Probabilities for Logistic Regression, By Education of Parents and Student’s Birth Country, Mathematics, Grade 8 (Part 2/3)
Student born in country of test
University level Secondary Less than secondary Do not know
% Below LIB
% Pop
% Below LIB
% Pop
% Below LIB
% Pop
% Below LIB
% Pop
Israel No 22 5.7 26 2.2 29 0.6 33 3.5 Yes 16 43.0 19 22.2 22 2.0 25 20.8
Italy No 12 1.8 18 2.2 26 0.3 37 0.7 Yes 8 25.7 12 58.2 18 2.4 27 8.7
Japan No 8 0.5 10 0.2 13 0.0 16 0.2 Yes 1 51.4 2 27.5 2 0.1 3 20.2
Jordan No 44 7.3 55 3.9 66 1.5 75 1.3 Yes 26 41.9 35 31.9 45 6.4 56 5.7
Kuwait No 74 9.8 84 4.0 91 2.3 95 0.0 Yes 64 50.0 77 21.2 86 12.6 92 0.1
Lebanon No 29 8.7 33 5.4 38 3.3 42 3.2 Yes 15 36.8 17 21.2 20 11.3 24 10.1
Lithuania No 19 1.9 23 0.9 27 0.0 32 1.1 Yes 4 48.6 5 23.7 6 0.3 8 23.4
Malaysia No 23 2.1 30 4.5 37 0.5 46 1.6 Yes 9 27.1 12 48.9 16 6.1 21 9.2
Malta No 32 1.7 37 2.5 43 0.4 49 2.2 Yes 9 20.7 12 44.5 14 2.8 17 25.1
Mongolia No 51 4.8 57 6.6 62 0.6 68 1.5 Yes 25 40.7 29 33.4 35 2.2 40 10.3
Morocco No 86 1.5 89 1.7 92 1.3 94 0.5 Yes 49 13.8 56 23.5 63 27.3 69 6.9
Norway No 11 3.3 13 0.7 16 0.2 18 2.4 Yes 8 43.8 9 7.1 11 0.4 14 42.1
Oman No 72 4.2 75 4.9 78 4.4 81 2.5 Yes 52 15.4 56 30.1 61 26.8 65 11.7
Palestine No 65 9.2 77 7.0 85 1.2 91 1.7 Yes 46 28.5 60 39.3 73 7.1 83 6.0
Qatar No 81 14.4 88 7.7 92 1.4 95 2.4 Yes 81 37.3 88 24.4 92 5.7 95 6.7
Romania No 46 0.9 53 1.3 59 0.1 66 0.8 Yes 14 31.2 18 47.6 22 1.0 27 17.1
Russian Fed. No 7 5.4 8 0.9 11 0.0 13 0.6 Yes 5 71.3 7 13.1 9 0.2 11 8.5
Saudi Arabia No 83 7.0 89 5.8 93 3.0 96 0.9 Yes 75 30.5 83 30.2 89 18.8 93 4.0
Note : This table reports predicted probabilities and proportion of student in each sub-group related to a logistic regression, which includes several independent variables (books at home, gender of student, langage spoken at home, location of school and student’ birth country and education of parents). The predicted probabilities are computed for the two variables (Education of Parents and Student’s Birth Country) after having controlled for the other variables (assumed to be on their mean value). Because results are rounded to the nearest whole number, some totals may appear inconsistent. See text for more details.

132
Table I.3.c. Predicted Probabilities for Logistic Regression, By Education of Parents and Student’s Birth Country, Mathematics, Grade 8 (Part 3/3)
Student born in country of test
University level Secondary Less than secondary Do not know
% Below LIB
% Pop
% Below LIB
% Pop
% Below LIB
% Pop
% Below LIB
% Pop
Serbia No 15 2.3 20 4.2 26 0.0 34 0.4 Yes 10 38.2 13 49.6 18 0.4 24 4.8
Slovenia No 15 2.6 16 1.1 18 0.1 19 1.1 Yes 3 57.0 4 17.0 4 0.4 4 20.7
Sweden No 10 3.1 13 1.1 17 0.3 23 3.1 Yes 3 30.4 5 15.5 7 1.0 9 45.6
Syrian Ar.Rep. No 66 8.9 73 11.2 79 2.6 84 1.2 Yes 40 29.4 48 36.4 57 7.6 65 2.8
Thailand No 48 0.1 52 0.2 57 0.1 61 0.1 Yes 24 20.1 28 40.0 31 22.9 35 16.5
Tunisia No 46 1.6 50 1.9 53 0.4 57 0.4 Yes 33 28.7 37 47.9 40 10.9 44 8.1
Turkey No 35 0.3 52 1.0 68 0.3 81 0.0 Yes 23 12.2 37 69.9 54 14.9 70 1.3
Ukraine No 41 4.4 51 1.3 61 0.0 70 0.9 Yes 13 72.2 18 13.9 25 0.2 33 7.1
United States No 15 3.3 16 3.1 18 0.5 20 2.5 Yes 4 46.9 5 25.9 5 1.9 6 16.0
Note : This table reports predicted probabilities and proportion of student in each sub-group related to a logistic regression, which includes several independent variables (books at home, gender of student, langage spoken at home, location of school and student’ birth country and education of parents). The predicted probabilities are computed for the two variables (Education of Parents and Student’s Birth Country) after having controlled for the other variables (assumed to be on their mean value). Because results are rounded to the nearest whole number, some totals may appear inconsistent. See text for more details.

133
Table I.4.a. Predicted Probabilities for Logistic Regression, By Books at home and Location of School, Mathematics, Grade 4 (Part 1/2)
Books at home More than 100,001 15,001 to 100,000 3,001 to 15,000 Less than 3,000
% Below LIB % Pop % Below LIB % Pop % Below LIB % Pop % Below LIB % Pop
ArmeniaLess than 26 books 11 11.9 11 7.7 12 13.7 12 9.4 26-200 books 9 14.0 10 8.4 10 10.2 11 5.6 More than 200 books 8 8.6 8 3.7 9 4.6 9 2.3
AustraliaLess than 26 books 8 9.1 11 6.3 14 3.5 17 1.9 26-200 books 4 27.0 6 15.7 7 10.7 9 5.7 More than 200 books 2 9.4 3 5.1 4 3.6 5 1.9
Austria Less than 26 books 11 13.3 9 4.0 8 15.2 7 8.0 26-200 books 4 13.5 4 3.9 3 19.7 3 10.3More than 200 books 2 4.4 2 1.1 1 4.8 1 2.0
Chinese TapeiLess than 26 books 0 24.6 0 14.0 1 0.3 1 0.4 26-200 books 0 33.1 0 12.1 0 0.2 0 0.4 More than 200 books 0 11.3 0 3.6 0 0.0 0 0.1
Colombia Less than 26 books 64 36.6 70 17.5 76 6.8 81 7.2 26-200 books 62 16.1 69 6.9 75 1.9 80 1.4 More than 200 books 61 3.1 68 1.5 74 0.5 79 0.5
Czech Rep. Less than 26 books 10 4.1 13 13.0 16 9.3 19 4.8 26-200 books 5 11.2 7 23.7 8 14.7 10 6.9 More than 200 books 3 3.3 3 4.6 4 2.6 5 1.5
Denmark Less than 26 books 5 5.3 5 13.3 6 9.2 6 5.3 26-200 books 2 10.6 2 19.6 2 16.4 2 10.1 More than 200 books 1 2.9 1 3.7 1 4.1 1 1.9
El SalvadorLess than 26 books 58 11.7 72 16.6 83 23.1 91 25.4 26-200 books 54 5.1 69 5.2 81 5.8 89 3.4 More than 200 books 50 1.1 66 0.7 79 1.3 88 0.7
England Less than 26 books 7 13.5 6 10.5 5 4.3 5 0.5 26-200 books 4 22.4 3 17.4 3 10.9 2 3.0 More than 200 books 2 8.6 2 4.7 2 3.3 1 0.9
GeorgiaLess than 26 books 33 13.8 33 8.9 33 5.0 34 8.9 26-200 books 28 19.2 28 10.6 28 6.5 28 7.1 More than 200 books 23 10.4 23 4.9 23 2.1 24 2.0
GermanyLess than 26 books 9 8.4 6 12.7 4 7.7 2 4.2 26-200 books 3 12.7 2 17.5 1 14.7 1 8.4 More than 200 books 1 4.0 0 4.0 0 3.9 0 1.8
Hungary Less than 26 books 8 5.6 12 10.8 18 10.2 25 5.2 26-200 books 3 11.1 4 21.8 6 13.4 9 4.3 More than 200 books 1 5.3 1 8.3 2 3.3 3 0.7
IranLess than 26 books 40 29.7 47 12.3 54 10.8 60 17.926-200 books 28 15.9 33 3.5 40 1.4 47 1.6 More than 200 books 18 5.4 22 1.0 27 0.2 33 0.3
ItalyLess than 26 books 12 8.3 11 20.5 10 14.7 9 1.7 26-200 books 7 9.5 7 19.3 6 12.4 5 1.2 More than 200 books 4 2.8 4 6.2 4 3.1 3 0.3
Japan Less than 26 books 2 29.1 3 11.2 6 1.0 na na 26-200 books 1 38.1 2 12.3 3 0.8 na na More than 200 books 0 5.8 1 1.6 1 0.2 na na
KazakhstanLess than 26 books 4 19.7 5 12.0 6 15.8 7 7.2 26-200 books 2 20.2 3 8.0 4 6.8 4 3.1 More than 200 books 1 4.5 2 1.4 2 0.9 3 0.5
Kuwait Less than 26 books 81 7.9 79 15.3 77 22.0 75 7.0 26-200 books 81 4.9 79 9.0 77 14.1 75 6.2 More than 200 books 80 2.0 79 3.2 77 6.2 75 2.3
Note : This table reports predicted probabilities and proportion of student in each sub-group related to a logistic regression, which includes several independent variables (books at home, gender of student, langage spoken at home, location of school and student’ birth country). The predicted probabilities are computed for the two variables (Books at home and Location of School) after having controlled for the other variables (assumed to be on their mean value). Because results are rounded to the nearest whole number, some totals may appear inconsistent. See text for more details.

134
Table I.4.b. Predicted Probabilities for Logistic Regression, By Books at home and Location of School, Mathematics, Grade 4 (Part 2/2)
Books at home More than 100,001 15,001 to 100,000 3,001 to 15,000 Less than 3,000
% Below LIB % Pop % Below LIB % Pop % Below LIB % Pop % Below LIB % Pop
Latvia Less than 26 books 2 5.5 3 8.3 4 8.3 5 4.3 26-200 books 1 16.3 1 18.7 1 17.2 2 7.5 More than 200 books 0 5.0 0 4.2 0 3.3 0 1.3
Lithuania Less than 26 books 2 14.4 3 12.8 5 12.9 9 8.6 26-200 books 1 20.5 2 9.5 4 10.2 6 4.6 More than 200 books 1 3.6 2 1.1 3 1.2 5 0.6
Mongolia Less than 26 books 17 17.1 26 26.6 38 22.9 52 9.4 26-200 books 15 5.5 23 8.0 35 5.5 48 1.6 More than 200 books 13 0.7 21 1.1 32 1.3 45 0.5
MoroccoLess than 26 books 78 23.4 77 21.8 77 17.7 76 11.626-200 books 65 8.1 64 6.3 64 3.2 63 2.4 More than 200 books 49 2.1 48 1.4 48 0.9 47 1.0
NetherlandsLess than 26 books 2 8.8 1 21.9 1 4.1 0 0.2 26-200 books 1 12.3 1 33.2 0 7.5 0 1.7 More than 200 books 1 2.3 0 6.2 0 1.4 0 0.6
New Zealand Less than 26 books 20 13.5 20 8.5 20 3.3 20 2.4 26-200 books 10 25.6 10 15.9 10 8.6 10 5.7 More than 200 books 5 8.2 5 4.1 5 2.6 5 1.6
NorwayLess than 26 books 17 9.2 20 11.4 24 9.6 27 0.4 26-200 books 10 19.9 11 18.0 14 16.6 16 1.5 More than 200 books 5 5.0 6 4.5 7 3.7 9 0.2
QatarLess than 26 books 85 6.9 87 12.4 89 9.1 91 9.3 26-200 books 84 6.7 87 13.2 89 10.6 91 9.1 More than 200 books 84 4.5 87 8.2 89 5.4 91 4.6
Russian Fed. Less than 26 books 2 11.9 3 7.9 5 4.1 9 4.3 26-200 books 1 29.2 2 16.9 4 5.3 7 3.6 More than 200 books 1 7.5 2 3.2 3 0.9 6 0.6
ScotlandLess than 26 books 18 8.5 16 11.1 14 7.8 13 2.0 26-200 books 10 12.4 9 20.4 8 15.1 7 4.8 More than 200 books 5 5.1 4 5.5 4 5.1 3 2.0
Slovak Rep.Less than 26 books 10 3.0 11 17.3 11 8.0 12 10.6 26-200 books 6 6.6 6 25.7 6 10.4 7 9.5 More than 200 books 3 1.4 4 4.2 4 1.8 4 1.6
Slovenia Less than 26 books 7 3.6 7 5.7 8 20.4 9 8.4 26-200 books 4 7.0 4 7.5 5 27.0 5 10.3More than 200 books 2 2.5 3 1.4 3 4.6 3 1.6
Sweden Less than 26 books 8 6.7 9 9.7 9 5.6 10 2.8 26-200 books 4 12.7 4 23.1 4 13.7 4 6.8 More than 200 books 2 5.4 2 7.6 2 4.6 2 1.5
Tunisia Less than 26 books 61 12.3 69 15.7 77 24.4 83 16.5 26-200 books 45 6.6 55 7.4 64 10.2 72 2.6 More than 200 books 30 0.9 39 1.4 48 1.5 58 0.6
Ukraine Less than 26 books 13 14.3 18 9.5 26 7.7 35 7.0 26-200 books 8 26.1 12 13.3 18 8.2 25 4.5 More than 200 books 6 5.4 8 2.1 12 1.6 18 0.4
United StatesLess than 26 books 4 10.8 4 11.2 4 9.7 4 3.4 26-200 books 2 13.3 2 19.0 2 13.3 3 4.4 More than 200 books 1 4.4 1 5.9 2 3.6 2 1.1
YemenLess than 26 books 97 9.7 96 16.8 94 29.1 93 25.9 26-200 books 97 3.7 96 4.0 94 3.5 93 2.9 More than 200 books 97 0.9 96 0.9 94 1.3 93 1.2
Note : This table reports predicted probabilities and proportion of student in each sub-group related to a logistic regression, which includes several independent variables (books at home, gender of student, langage spoken at home, location of school and student’ birth country). The predicted probabilities are computed for the two variables (Books at home and Location of School) after having controlled for the other variables (assumed to be on their mean value). Because results are rounded to the nearest whole number, some totals may appear inconsistent. See text for more details.
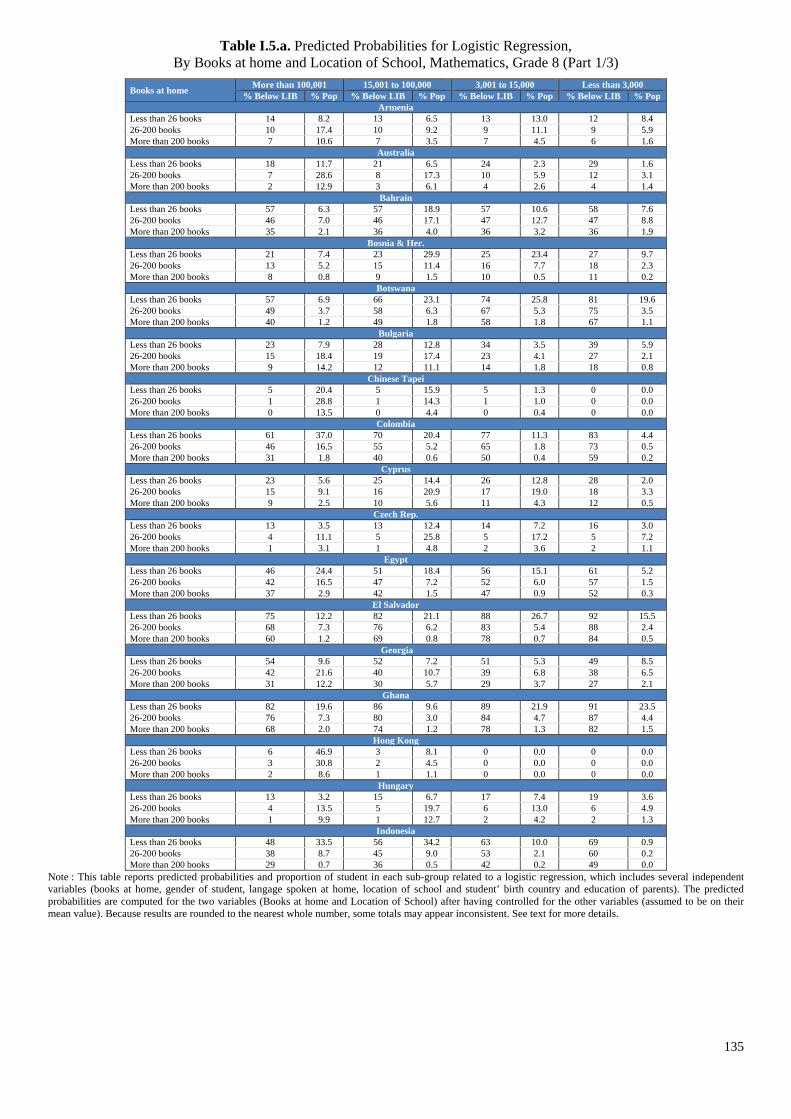
135
Table I.5.a. Predicted Probabilities for Logistic Regression, By Books at home and Location of School, Mathematics, Grade 8 (Part 1/3)
Books at home More than 100,001 15,001 to 100,000 3,001 to 15,000 Less than 3,000 % Below LIB % Pop % Below LIB % Pop % Below LIB % Pop % Below LIB % Pop
ArmeniaLess than 26 books 14 8.2 13 6.5 13 13.0 12 8.4 26-200 books 10 17.4 10 9.2 9 11.1 9 5.9 More than 200 books 7 10.6 7 3.5 7 4.5 6 1.6
Australia Less than 26 books 18 11.7 21 6.5 24 2.3 29 1.6 26-200 books 7 28.6 8 17.3 10 5.9 12 3.1 More than 200 books 2 12.9 3 6.1 4 2.6 4 1.4
BahrainLess than 26 books 57 6.3 57 18.9 57 10.6 58 7.6 26-200 books 46 7.0 46 17.1 47 12.7 47 8.8 More than 200 books 35 2.1 36 4.0 36 3.2 36 1.9
Bosnia & Her.Less than 26 books 21 7.4 23 29.9 25 23.4 27 9.7 26-200 books 13 5.2 15 11.4 16 7.7 18 2.3 More than 200 books 8 0.8 9 1.5 10 0.5 11 0.2
Botswana Less than 26 books 57 6.9 66 23.1 74 25.8 81 19.626-200 books 49 3.7 58 6.3 67 5.3 75 3.5 More than 200 books 40 1.2 49 1.8 58 1.8 67 1.1
BulgariaLess than 26 books 23 7.9 28 12.8 34 3.5 39 5.9 26-200 books 15 18.4 19 17.4 23 4.1 27 2.1 More than 200 books 9 14.2 12 11.1 14 1.8 18 0.8
Chinese Tapei Less than 26 books 5 20.4 5 15.9 5 1.3 0 0.0 26-200 books 1 28.8 1 14.3 1 1.0 0 0.0 More than 200 books 0 13.5 0 4.4 0 0.4 0 0.0
Colombia Less than 26 books 61 37.0 70 20.4 77 11.3 83 4.4 26-200 books 46 16.5 55 5.2 65 1.8 73 0.5 More than 200 books 31 1.8 40 0.6 50 0.4 59 0.2
CyprusLess than 26 books 23 5.6 25 14.4 26 12.8 28 2.0 26-200 books 15 9.1 16 20.9 17 19.0 18 3.3 More than 200 books 9 2.5 10 5.6 11 4.3 12 0.5
Czech Rep.Less than 26 books 13 3.5 13 12.4 14 7.2 16 3.0 26-200 books 4 11.1 5 25.8 5 17.2 5 7.2 More than 200 books 1 3.1 1 4.8 2 3.6 2 1.1
Egypt Less than 26 books 46 24.4 51 18.4 56 15.1 61 5.2 26-200 books 42 16.5 47 7.2 52 6.0 57 1.5 More than 200 books 37 2.9 42 1.5 47 0.9 52 0.3
El Salvador Less than 26 books 75 12.2 82 21.1 88 26.7 92 15.526-200 books 68 7.3 76 6.2 83 5.4 88 2.4 More than 200 books 60 1.2 69 0.8 78 0.7 84 0.5
GeorgiaLess than 26 books 54 9.6 52 7.2 51 5.3 49 8.5 26-200 books 42 21.6 40 10.7 39 6.8 38 6.5 More than 200 books 31 12.2 30 5.7 29 3.7 27 2.1
Ghana Less than 26 books 82 19.6 86 9.6 89 21.9 91 23.526-200 books 76 7.3 80 3.0 84 4.7 87 4.4 More than 200 books 68 2.0 74 1.2 78 1.3 82 1.5
Hong Kong Less than 26 books 6 46.9 3 8.1 0 0.0 0 0.0 26-200 books 3 30.8 2 4.5 0 0.0 0 0.0 More than 200 books 2 8.6 1 1.1 0 0.0 0 0.0
Hungary Less than 26 books 13 3.2 15 6.7 17 7.4 19 3.6 26-200 books 4 13.5 5 19.7 6 13.0 6 4.9 More than 200 books 1 9.9 1 12.7 2 4.2 2 1.3
Indonesia Less than 26 books 48 33.5 56 34.2 63 10.0 69 0.9 26-200 books 38 8.7 45 9.0 53 2.1 60 0.2 More than 200 books 29 0.7 36 0.5 42 0.2 49 0.0
Note : This table reports predicted probabilities and proportion of student in each sub-group related to a logistic regression, which includes several independent variables (books at home, gender of student, langage spoken at home, location of school and student’ birth country and education of parents). The predicted probabilities are computed for the two variables (Books at home and Location of School) after having controlled for the other variables (assumed to be on their mean value). Because results are rounded to the nearest whole number, some totals may appear inconsistent. See text for more details.
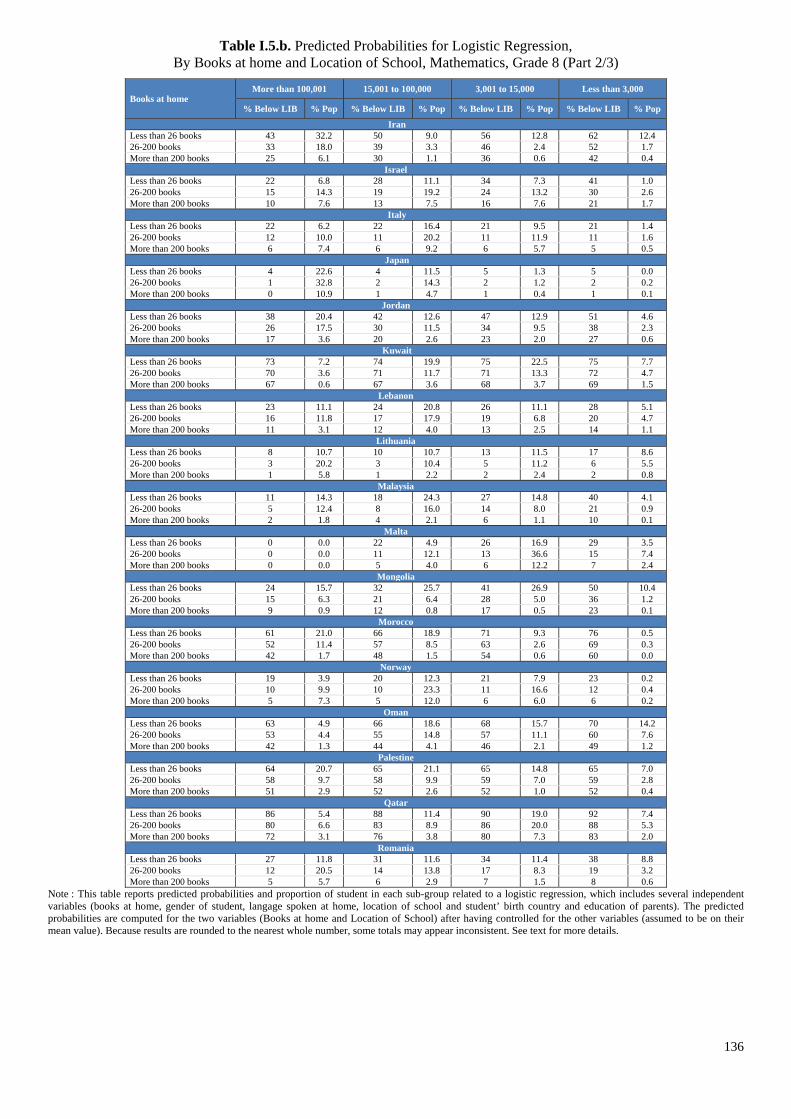
136
Table I.5.b. Predicted Probabilities for Logistic Regression, By Books at home and Location of School, Mathematics, Grade 8 (Part 2/3)
Books at home More than 100,001 15,001 to 100,000 3,001 to 15,000 Less than 3,000
% Below LIB % Pop % Below LIB % Pop % Below LIB % Pop % Below LIB % Pop
IranLess than 26 books 43 32.2 50 9.0 56 12.8 62 12.426-200 books 33 18.0 39 3.3 46 2.4 52 1.7 More than 200 books 25 6.1 30 1.1 36 0.6 42 0.4
Israel Less than 26 books 22 6.8 28 11.1 34 7.3 41 1.0 26-200 books 15 14.3 19 19.2 24 13.2 30 2.6 More than 200 books 10 7.6 13 7.5 16 7.6 21 1.7
Italy Less than 26 books 22 6.2 22 16.4 21 9.5 21 1.4 26-200 books 12 10.0 11 20.2 11 11.9 11 1.6 More than 200 books 6 7.4 6 9.2 6 5.7 5 0.5
JapanLess than 26 books 4 22.6 4 11.5 5 1.3 5 0.0 26-200 books 1 32.8 2 14.3 2 1.2 2 0.2 More than 200 books 0 10.9 1 4.7 1 0.4 1 0.1
JordanLess than 26 books 38 20.4 42 12.6 47 12.9 51 4.6 26-200 books 26 17.5 30 11.5 34 9.5 38 2.3 More than 200 books 17 3.6 20 2.6 23 2.0 27 0.6
Kuwait Less than 26 books 73 7.2 74 19.9 75 22.5 75 7.7 26-200 books 70 3.6 71 11.7 71 13.3 72 4.7 More than 200 books 67 0.6 67 3.6 68 3.7 69 1.5
Lebanon Less than 26 books 23 11.1 24 20.8 26 11.1 28 5.1 26-200 books 16 11.8 17 17.9 19 6.8 20 4.7 More than 200 books 11 3.1 12 4.0 13 2.5 14 1.1
LithuaniaLess than 26 books 8 10.7 10 10.7 13 11.5 17 8.6 26-200 books 3 20.2 3 10.4 5 11.2 6 5.5 More than 200 books 1 5.8 1 2.2 2 2.4 2 0.8
Malaysia Less than 26 books 11 14.3 18 24.3 27 14.8 40 4.1 26-200 books 5 12.4 8 16.0 14 8.0 21 0.9 More than 200 books 2 1.8 4 2.1 6 1.1 10 0.1
MaltaLess than 26 books 0 0.0 22 4.9 26 16.9 29 3.5 26-200 books 0 0.0 11 12.1 13 36.6 15 7.4 More than 200 books 0 0.0 5 4.0 6 12.2 7 2.4
MongoliaLess than 26 books 24 15.7 32 25.7 41 26.9 50 10.4 26-200 books 15 6.3 21 6.4 28 5.0 36 1.2 More than 200 books 9 0.9 12 0.8 17 0.5 23 0.1
Morocco Less than 26 books 61 21.0 66 18.9 71 9.3 76 0.5 26-200 books 52 11.4 57 8.5 63 2.6 69 0.3 More than 200 books 42 1.7 48 1.5 54 0.6 60 0.0
NorwayLess than 26 books 19 3.9 20 12.3 21 7.9 23 0.2 26-200 books 10 9.9 10 23.3 11 16.6 12 0.4 More than 200 books 5 7.3 5 12.0 6 6.0 6 0.2
OmanLess than 26 books 63 4.9 66 18.6 68 15.7 70 14.2 26-200 books 53 4.4 55 14.8 57 11.1 60 7.6 More than 200 books 42 1.3 44 4.1 46 2.1 49 1.2
Palestine Less than 26 books 64 20.7 65 21.1 65 14.8 65 7.0 26-200 books 58 9.7 58 9.9 59 7.0 59 2.8 More than 200 books 51 2.9 52 2.6 52 1.0 52 0.4
Qatar Less than 26 books 86 5.4 88 11.4 90 19.0 92 7.4 26-200 books 80 6.6 83 8.9 86 20.0 88 5.3 More than 200 books 72 3.1 76 3.8 80 7.3 83 2.0
RomaniaLess than 26 books 27 11.8 31 11.6 34 11.4 38 8.8 26-200 books 12 20.5 14 13.8 17 8.3 19 3.2 More than 200 books 5 5.7 6 2.9 7 1.5 8 0.6
Note : This table reports predicted probabilities and proportion of student in each sub-group related to a logistic regression, which includes several independent variables (books at home, gender of student, langage spoken at home, location of school and student’ birth country and education of parents). The predicted probabilities are computed for the two variables (Books at home and Location of School) after having controlled for the other variables (assumed to be on their mean value). Because results are rounded to the nearest whole number, some totals may appear inconsistent. See text for more details.
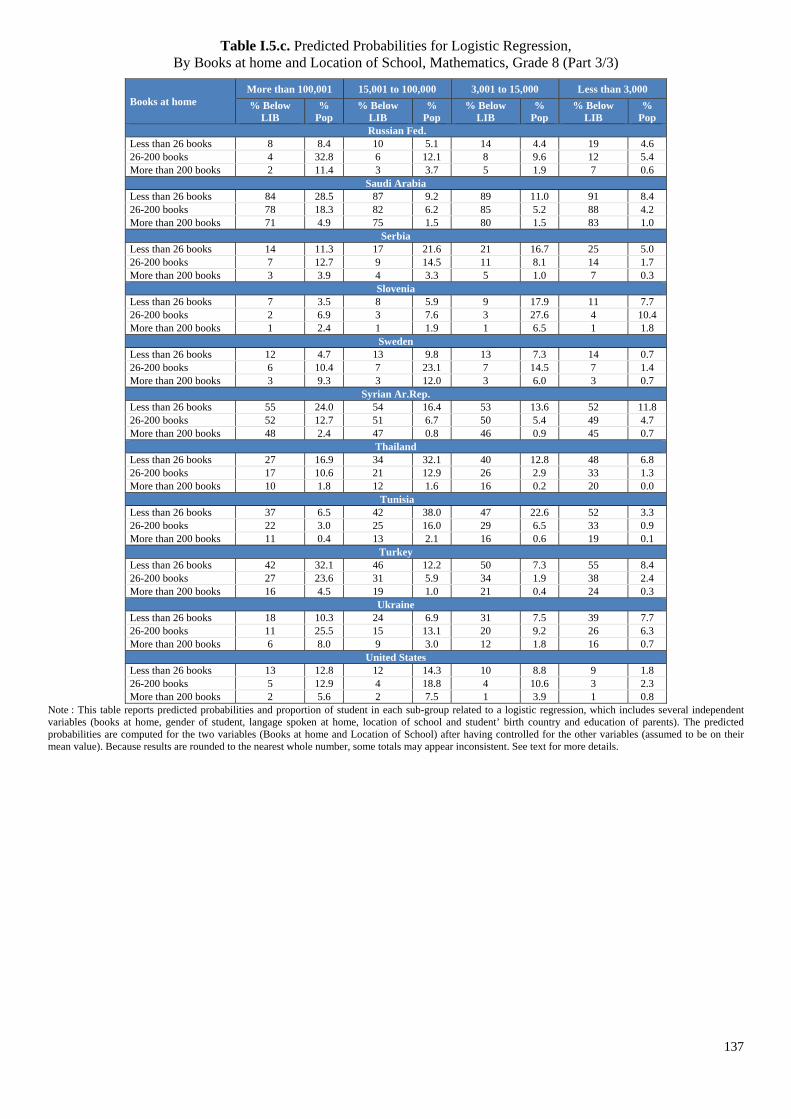
137
Table I.5.c. Predicted Probabilities for Logistic Regression, By Books at home and Location of School, Mathematics, Grade 8 (Part 3/3)
Books at home More than 100,001 15,001 to 100,000 3,001 to 15,000 Less than 3,000 % Below
LIB %
Pop % Below
LIB %
Pop % Below
LIB %
Pop % Below
LIB %
Pop Russian Fed.
Less than 26 books 8 8.4 10 5.1 14 4.4 19 4.6 26-200 books 4 32.8 6 12.1 8 9.6 12 5.4 More than 200 books 2 11.4 3 3.7 5 1.9 7 0.6
Saudi Arabia Less than 26 books 84 28.5 87 9.2 89 11.0 91 8.4 26-200 books 78 18.3 82 6.2 85 5.2 88 4.2 More than 200 books 71 4.9 75 1.5 80 1.5 83 1.0
Serbia Less than 26 books 14 11.3 17 21.6 21 16.7 25 5.0 26-200 books 7 12.7 9 14.5 11 8.1 14 1.7 More than 200 books 3 3.9 4 3.3 5 1.0 7 0.3
Slovenia Less than 26 books 7 3.5 8 5.9 9 17.9 11 7.7 26-200 books 2 6.9 3 7.6 3 27.6 4 10.4 More than 200 books 1 2.4 1 1.9 1 6.5 1 1.8
Sweden Less than 26 books 12 4.7 13 9.8 13 7.3 14 0.7 26-200 books 6 10.4 7 23.1 7 14.5 7 1.4 More than 200 books 3 9.3 3 12.0 3 6.0 3 0.7
Syrian Ar.Rep. Less than 26 books 55 24.0 54 16.4 53 13.6 52 11.8 26-200 books 52 12.7 51 6.7 50 5.4 49 4.7 More than 200 books 48 2.4 47 0.8 46 0.9 45 0.7
Thailand Less than 26 books 27 16.9 34 32.1 40 12.8 48 6.8 26-200 books 17 10.6 21 12.9 26 2.9 33 1.3 More than 200 books 10 1.8 12 1.6 16 0.2 20 0.0
Tunisia Less than 26 books 37 6.5 42 38.0 47 22.6 52 3.3 26-200 books 22 3.0 25 16.0 29 6.5 33 0.9 More than 200 books 11 0.4 13 2.1 16 0.6 19 0.1
Turkey Less than 26 books 42 32.1 46 12.2 50 7.3 55 8.4 26-200 books 27 23.6 31 5.9 34 1.9 38 2.4 More than 200 books 16 4.5 19 1.0 21 0.4 24 0.3
Ukraine Less than 26 books 18 10.3 24 6.9 31 7.5 39 7.7 26-200 books 11 25.5 15 13.1 20 9.2 26 6.3 More than 200 books 6 8.0 9 3.0 12 1.8 16 0.7
United States Less than 26 books 13 12.8 12 14.3 10 8.8 9 1.8 26-200 books 5 12.9 4 18.8 4 10.6 3 2.3 More than 200 books 2 5.6 2 7.5 1 3.9 1 0.8
Note : This table reports predicted probabilities and proportion of student in each sub-group related to a logistic regression, which includes several independent variables (books at home, gender of student, langage spoken at home, location of school and student’ birth country and education of parents). The predicted probabilities are computed for the two variables (Books at home and Location of School) after having controlled for the other variables (assumed to be on their mean value). Because results are rounded to the nearest whole number, some totals may appear inconsistent. See text for more details.
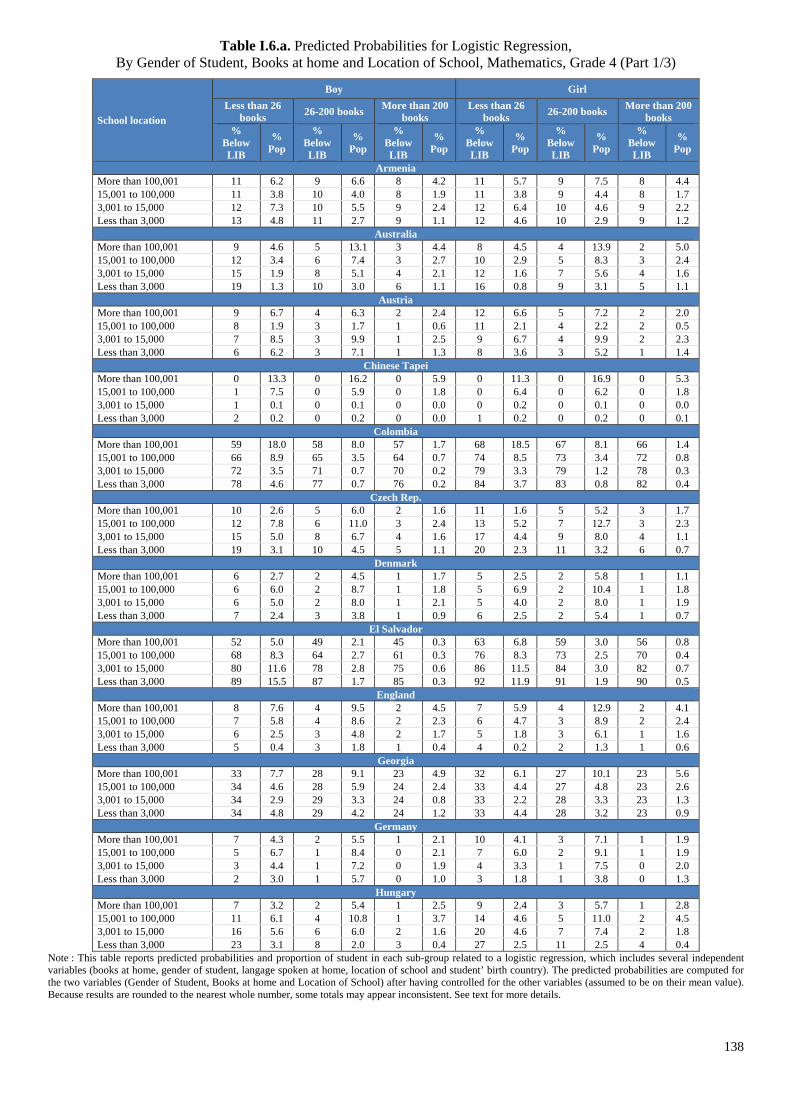
138
Table I.6.a. Predicted Probabilities for Logistic Regression, By Gender of Student, Books at home and Location of School, Mathematics, Grade 4 (Part 1/3)
School location
Boy Girl Less than 26
books 26-200 books More than 200 books
Less than 26 books 26-200 books More than 200
books %
Below LIB
% Pop
% Below LIB
% Pop
% Below LIB
% Pop
% Below LIB
% Pop
% Below LIB
% Pop
% Below LIB
% Pop
Armenia More than 100,001 11 6.2 9 6.6 8 4.2 11 5.7 9 7.5 8 4.4 15,001 to 100,000 11 3.8 10 4.0 8 1.9 11 3.8 9 4.4 8 1.7 3,001 to 15,000 12 7.3 10 5.5 9 2.4 12 6.4 10 4.6 9 2.2 Less than 3,000 13 4.8 11 2.7 9 1.1 12 4.6 10 2.9 9 1.2
Australia More than 100,001 9 4.6 5 13.1 3 4.4 8 4.5 4 13.9 2 5.0 15,001 to 100,000 12 3.4 6 7.4 3 2.7 10 2.9 5 8.3 3 2.4 3,001 to 15,000 15 1.9 8 5.1 4 2.1 12 1.6 7 5.6 4 1.6 Less than 3,000 19 1.3 10 3.0 6 1.1 16 0.8 9 3.1 5 1.1
Austria More than 100,001 9 6.7 4 6.3 2 2.4 12 6.6 5 7.2 2 2.0 15,001 to 100,000 8 1.9 3 1.7 1 0.6 11 2.1 4 2.2 2 0.5 3,001 to 15,000 7 8.5 3 9.9 1 2.5 9 6.7 4 9.9 2 2.3 Less than 3,000 6 6.2 3 7.1 1 1.3 8 3.6 3 5.2 1 1.4
Chinese Tapei More than 100,001 0 13.3 0 16.2 0 5.9 0 11.3 0 16.9 0 5.3 15,001 to 100,000 1 7.5 0 5.9 0 1.8 0 6.4 0 6.2 0 1.8 3,001 to 15,000 1 0.1 0 0.1 0 0.0 0 0.2 0 0.1 0 0.0 Less than 3,000 2 0.2 0 0.2 0 0.0 1 0.2 0 0.2 0 0.1
Colombia More than 100,001 59 18.0 58 8.0 57 1.7 68 18.5 67 8.1 66 1.4 15,001 to 100,000 66 8.9 65 3.5 64 0.7 74 8.5 73 3.4 72 0.8 3,001 to 15,000 72 3.5 71 0.7 70 0.2 79 3.3 79 1.2 78 0.3 Less than 3,000 78 4.6 77 0.7 76 0.2 84 3.7 83 0.8 82 0.4
Czech Rep. More than 100,001 10 2.6 5 6.0 2 1.6 11 1.6 5 5.2 3 1.7 15,001 to 100,000 12 7.8 6 11.0 3 2.4 13 5.2 7 12.7 3 2.3 3,001 to 15,000 15 5.0 8 6.7 4 1.6 17 4.4 9 8.0 4 1.1 Less than 3,000 19 3.1 10 4.5 5 1.1 20 2.3 11 3.2 6 0.7
Denmark More than 100,001 6 2.7 2 4.5 1 1.7 5 2.5 2 5.8 1 1.1 15,001 to 100,000 6 6.0 2 8.7 1 1.8 5 6.9 2 10.4 1 1.8 3,001 to 15,000 6 5.0 2 8.0 1 2.1 5 4.0 2 8.0 1 1.9 Less than 3,000 7 2.4 3 3.8 1 0.9 6 2.5 2 5.4 1 0.7
El Salvador More than 100,001 52 5.0 49 2.1 45 0.3 63 6.8 59 3.0 56 0.8 15,001 to 100,000 68 8.3 64 2.7 61 0.3 76 8.3 73 2.5 70 0.4 3,001 to 15,000 80 11.6 78 2.8 75 0.6 86 11.5 84 3.0 82 0.7 Less than 3,000 89 15.5 87 1.7 85 0.3 92 11.9 91 1.9 90 0.5
England More than 100,001 8 7.6 4 9.5 2 4.5 7 5.9 4 12.9 2 4.1 15,001 to 100,000 7 5.8 4 8.6 2 2.3 6 4.7 3 8.9 2 2.4 3,001 to 15,000 6 2.5 3 4.8 2 1.7 5 1.8 3 6.1 1 1.6 Less than 3,000 5 0.4 3 1.8 1 0.4 4 0.2 2 1.3 1 0.6
Georgia More than 100,001 33 7.7 28 9.1 23 4.9 32 6.1 27 10.1 23 5.6 15,001 to 100,000 34 4.6 28 5.9 24 2.4 33 4.4 27 4.8 23 2.6 3,001 to 15,000 34 2.9 29 3.3 24 0.8 33 2.2 28 3.3 23 1.3 Less than 3,000 34 4.8 29 4.2 24 1.2 33 4.4 28 3.2 23 0.9
Germany More than 100,001 7 4.3 2 5.5 1 2.1 10 4.1 3 7.1 1 1.9 15,001 to 100,000 5 6.7 1 8.4 0 2.1 7 6.0 2 9.1 1 1.9 3,001 to 15,000 3 4.4 1 7.2 0 1.9 4 3.3 1 7.5 0 2.0 Less than 3,000 2 3.0 1 5.7 0 1.0 3 1.8 1 3.8 0 1.3
Hungary More than 100,001 7 3.2 2 5.4 1 2.5 9 2.4 3 5.7 1 2.8 15,001 to 100,000 11 6.1 4 10.8 1 3.7 14 4.6 5 11.0 2 4.5 3,001 to 15,000 16 5.6 6 6.0 2 1.6 20 4.6 7 7.4 2 1.8 Less than 3,000 23 3.1 8 2.0 3 0.4 27 2.5 11 2.5 4 0.4
Note : This table reports predicted probabilities and proportion of student in each sub-group related to a logistic regression, which includes several independent variables (books at home, gender of student, langage spoken at home, location of school and student’ birth country). The predicted probabilities are computed for the two variables (Gender of Student, Books at home and Location of School) after having controlled for the other variables (assumed to be on their mean value). Because results are rounded to the nearest whole number, some totals may appear inconsistent. See text for more details.
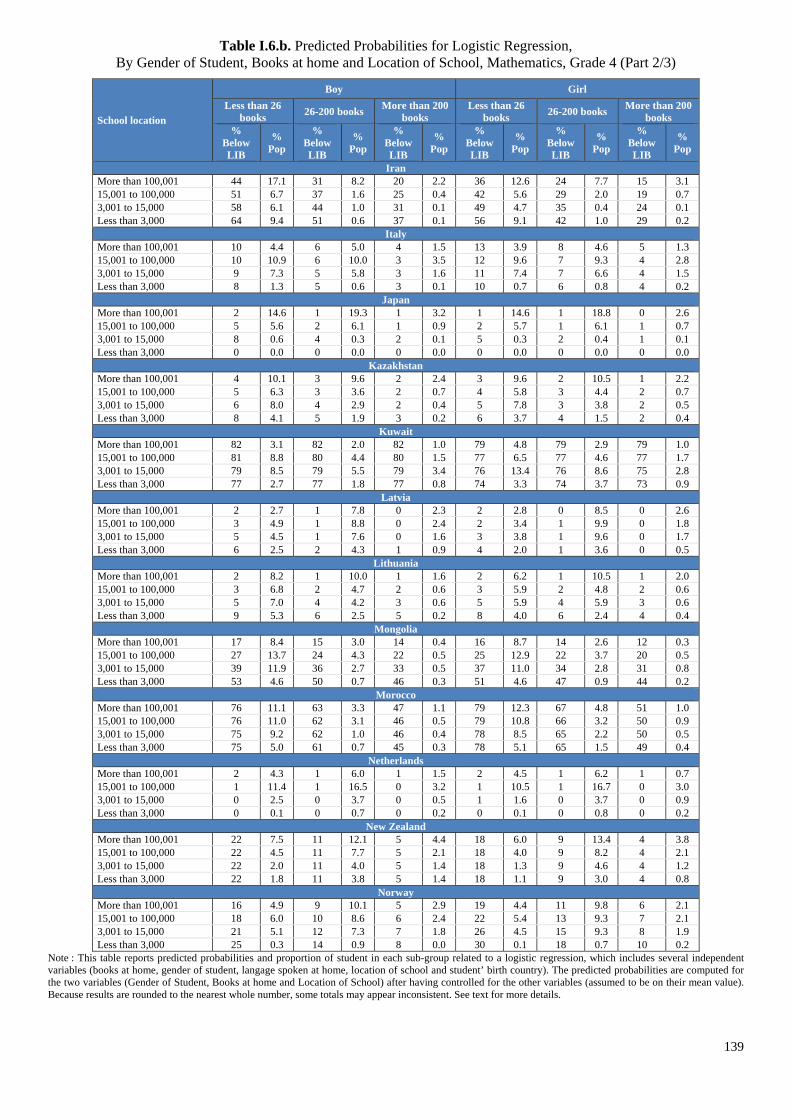
139
Table I.6.b. Predicted Probabilities for Logistic Regression, By Gender of Student, Books at home and Location of School, Mathematics, Grade 4 (Part 2/3)
School location
Boy Girl Less than 26
books 26-200 books More than 200 books
Less than 26 books 26-200 books More than 200
books %
Below LIB
% Pop
% Below LIB
% Pop
% Below LIB
% Pop
% Below LIB
% Pop
% Below LIB
% Pop
% Below LIB
% Pop
Iran More than 100,001 44 17.1 31 8.2 20 2.2 36 12.6 24 7.7 15 3.1 15,001 to 100,000 51 6.7 37 1.6 25 0.4 42 5.6 29 2.0 19 0.7 3,001 to 15,000 58 6.1 44 1.0 31 0.1 49 4.7 35 0.4 24 0.1 Less than 3,000 64 9.4 51 0.6 37 0.1 56 9.1 42 1.0 29 0.2
Italy More than 100,001 10 4.4 6 5.0 4 1.5 13 3.9 8 4.6 5 1.3 15,001 to 100,000 10 10.9 6 10.0 3 3.5 12 9.6 7 9.3 4 2.8 3,001 to 15,000 9 7.3 5 5.8 3 1.6 11 7.4 7 6.6 4 1.5 Less than 3,000 8 1.3 5 0.6 3 0.1 10 0.7 6 0.8 4 0.2
Japan More than 100,001 2 14.6 1 19.3 1 3.2 1 14.6 1 18.8 0 2.6 15,001 to 100,000 5 5.6 2 6.1 1 0.9 2 5.7 1 6.1 1 0.7 3,001 to 15,000 8 0.6 4 0.3 2 0.1 5 0.3 2 0.4 1 0.1 Less than 3,000 0 0.0 0 0.0 0 0.0 0 0.0 0 0.0 0 0.0
Kazakhstan More than 100,001 4 10.1 3 9.6 2 2.4 3 9.6 2 10.5 1 2.2 15,001 to 100,000 5 6.3 3 3.6 2 0.7 4 5.8 3 4.4 2 0.7 3,001 to 15,000 6 8.0 4 2.9 2 0.4 5 7.8 3 3.8 2 0.5 Less than 3,000 8 4.1 5 1.9 3 0.2 6 3.7 4 1.5 2 0.4
Kuwait More than 100,001 82 3.1 82 2.0 82 1.0 79 4.8 79 2.9 79 1.0 15,001 to 100,000 81 8.8 80 4.4 80 1.5 77 6.5 77 4.6 77 1.7 3,001 to 15,000 79 8.5 79 5.5 79 3.4 76 13.4 76 8.6 75 2.8 Less than 3,000 77 2.7 77 1.8 77 0.8 74 3.3 74 3.7 73 0.9
Latvia More than 100,001 2 2.7 1 7.8 0 2.3 2 2.8 0 8.5 0 2.6 15,001 to 100,000 3 4.9 1 8.8 0 2.4 2 3.4 1 9.9 0 1.8 3,001 to 15,000 5 4.5 1 7.6 0 1.6 3 3.8 1 9.6 0 1.7 Less than 3,000 6 2.5 2 4.3 1 0.9 4 2.0 1 3.6 0 0.5
Lithuania More than 100,001 2 8.2 1 10.0 1 1.6 2 6.2 1 10.5 1 2.0 15,001 to 100,000 3 6.8 2 4.7 2 0.6 3 5.9 2 4.8 2 0.6 3,001 to 15,000 5 7.0 4 4.2 3 0.6 5 5.9 4 5.9 3 0.6 Less than 3,000 9 5.3 6 2.5 5 0.2 8 4.0 6 2.4 4 0.4
Mongolia More than 100,001 17 8.4 15 3.0 14 0.4 16 8.7 14 2.6 12 0.3 15,001 to 100,000 27 13.7 24 4.3 22 0.5 25 12.9 22 3.7 20 0.5 3,001 to 15,000 39 11.9 36 2.7 33 0.5 37 11.0 34 2.8 31 0.8 Less than 3,000 53 4.6 50 0.7 46 0.3 51 4.6 47 0.9 44 0.2
Morocco More than 100,001 76 11.1 63 3.3 47 1.1 79 12.3 67 4.8 51 1.0 15,001 to 100,000 76 11.0 62 3.1 46 0.5 79 10.8 66 3.2 50 0.9 3,001 to 15,000 75 9.2 62 1.0 46 0.4 78 8.5 65 2.2 50 0.5 Less than 3,000 75 5.0 61 0.7 45 0.3 78 5.1 65 1.5 49 0.4
Netherlands More than 100,001 2 4.3 1 6.0 1 1.5 2 4.5 1 6.2 1 0.7 15,001 to 100,000 1 11.4 1 16.5 0 3.2 1 10.5 1 16.7 0 3.0 3,001 to 15,000 0 2.5 0 3.7 0 0.5 1 1.6 0 3.7 0 0.9 Less than 3,000 0 0.1 0 0.7 0 0.2 0 0.1 0 0.8 0 0.2
New Zealand More than 100,001 22 7.5 11 12.1 5 4.4 18 6.0 9 13.4 4 3.8 15,001 to 100,000 22 4.5 11 7.7 5 2.1 18 4.0 9 8.2 4 2.1 3,001 to 15,000 22 2.0 11 4.0 5 1.4 18 1.3 9 4.6 4 1.2 Less than 3,000 22 1.8 11 3.8 5 1.4 18 1.1 9 3.0 4 0.8
Norway More than 100,001 16 4.9 9 10.1 5 2.9 19 4.4 11 9.8 6 2.1 15,001 to 100,000 18 6.0 10 8.6 6 2.4 22 5.4 13 9.3 7 2.1 3,001 to 15,000 21 5.1 12 7.3 7 1.8 26 4.5 15 9.3 8 1.9 Less than 3,000 25 0.3 14 0.9 8 0.0 30 0.1 18 0.7 10 0.2
Note : This table reports predicted probabilities and proportion of student in each sub-group related to a logistic regression, which includes several independent variables (books at home, gender of student, langage spoken at home, location of school and student’ birth country). The predicted probabilities are computed for the two variables (Gender of Student, Books at home and Location of School) after having controlled for the other variables (assumed to be on their mean value). Because results are rounded to the nearest whole number, some totals may appear inconsistent. See text for more details.
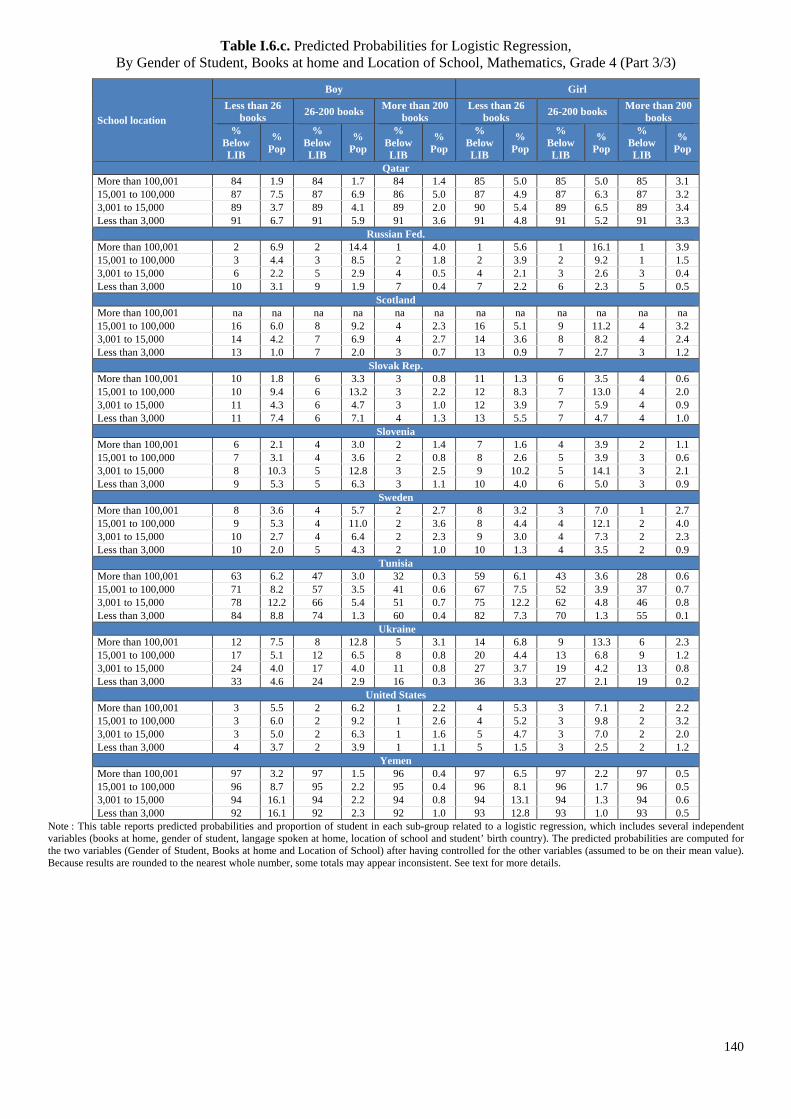
140
Table I.6.c. Predicted Probabilities for Logistic Regression, By Gender of Student, Books at home and Location of School, Mathematics, Grade 4 (Part 3/3)
School location
Boy Girl Less than 26
books 26-200 books More than 200 books
Less than 26 books 26-200 books More than 200
books %
Below LIB
% Pop
% Below LIB
% Pop
% Below LIB
% Pop
% Below LIB
% Pop
% Below LIB
% Pop
% Below LIB
% Pop
Qatar More than 100,001 84 1.9 84 1.7 84 1.4 85 5.0 85 5.0 85 3.1 15,001 to 100,000 87 7.5 87 6.9 86 5.0 87 4.9 87 6.3 87 3.2 3,001 to 15,000 89 3.7 89 4.1 89 2.0 90 5.4 89 6.5 89 3.4 Less than 3,000 91 6.7 91 5.9 91 3.6 91 4.8 91 5.2 91 3.3
Russian Fed. More than 100,001 2 6.9 2 14.4 1 4.0 1 5.6 1 16.1 1 3.9 15,001 to 100,000 3 4.4 3 8.5 2 1.8 2 3.9 2 9.2 1 1.5 3,001 to 15,000 6 2.2 5 2.9 4 0.5 4 2.1 3 2.6 3 0.4 Less than 3,000 10 3.1 9 1.9 7 0.4 7 2.2 6 2.3 5 0.5
Scotland More than 100,001 na na na na na na na na na na na na 15,001 to 100,000 16 6.0 8 9.2 4 2.3 16 5.1 9 11.2 4 3.2 3,001 to 15,000 14 4.2 7 6.9 4 2.7 14 3.6 8 8.2 4 2.4 Less than 3,000 13 1.0 7 2.0 3 0.7 13 0.9 7 2.7 3 1.2
Slovak Rep. More than 100,001 10 1.8 6 3.3 3 0.8 11 1.3 6 3.5 4 0.6 15,001 to 100,000 10 9.4 6 13.2 3 2.2 12 8.3 7 13.0 4 2.0 3,001 to 15,000 11 4.3 6 4.7 3 1.0 12 3.9 7 5.9 4 0.9 Less than 3,000 11 7.4 6 7.1 4 1.3 13 5.5 7 4.7 4 1.0
Slovenia More than 100,001 6 2.1 4 3.0 2 1.4 7 1.6 4 3.9 2 1.1 15,001 to 100,000 7 3.1 4 3.6 2 0.8 8 2.6 5 3.9 3 0.6 3,001 to 15,000 8 10.3 5 12.8 3 2.5 9 10.2 5 14.1 3 2.1 Less than 3,000 9 5.3 5 6.3 3 1.1 10 4.0 6 5.0 3 0.9
Sweden More than 100,001 8 3.6 4 5.7 2 2.7 8 3.2 3 7.0 1 2.7 15,001 to 100,000 9 5.3 4 11.0 2 3.6 8 4.4 4 12.1 2 4.0 3,001 to 15,000 10 2.7 4 6.4 2 2.3 9 3.0 4 7.3 2 2.3 Less than 3,000 10 2.0 5 4.3 2 1.0 10 1.3 4 3.5 2 0.9
Tunisia More than 100,001 63 6.2 47 3.0 32 0.3 59 6.1 43 3.6 28 0.6 15,001 to 100,000 71 8.2 57 3.5 41 0.6 67 7.5 52 3.9 37 0.7 3,001 to 15,000 78 12.2 66 5.4 51 0.7 75 12.2 62 4.8 46 0.8 Less than 3,000 84 8.8 74 1.3 60 0.4 82 7.3 70 1.3 55 0.1
Ukraine More than 100,001 12 7.5 8 12.8 5 3.1 14 6.8 9 13.3 6 2.3 15,001 to 100,000 17 5.1 12 6.5 8 0.8 20 4.4 13 6.8 9 1.2 3,001 to 15,000 24 4.0 17 4.0 11 0.8 27 3.7 19 4.2 13 0.8 Less than 3,000 33 4.6 24 2.9 16 0.3 36 3.3 27 2.1 19 0.2
United States More than 100,001 3 5.5 2 6.2 1 2.2 4 5.3 3 7.1 2 2.2 15,001 to 100,000 3 6.0 2 9.2 1 2.6 4 5.2 3 9.8 2 3.2 3,001 to 15,000 3 5.0 2 6.3 1 1.6 5 4.7 3 7.0 2 2.0 Less than 3,000 4 3.7 2 3.9 1 1.1 5 1.5 3 2.5 2 1.2
Yemen More than 100,001 97 3.2 97 1.5 96 0.4 97 6.5 97 2.2 97 0.5 15,001 to 100,000 96 8.7 95 2.2 95 0.4 96 8.1 96 1.7 96 0.5 3,001 to 15,000 94 16.1 94 2.2 94 0.8 94 13.1 94 1.3 94 0.6 Less than 3,000 92 16.1 92 2.3 92 1.0 93 12.8 93 1.0 93 0.5
Note : This table reports predicted probabilities and proportion of student in each sub-group related to a logistic regression, which includes several independent variables (books at home, gender of student, langage spoken at home, location of school and student’ birth country). The predicted probabilities are computed for the two variables (Gender of Student, Books at home and Location of School) after having controlled for the other variables (assumed to be on their mean value). Because results are rounded to the nearest whole number, some totals may appear inconsistent. See text for more details.
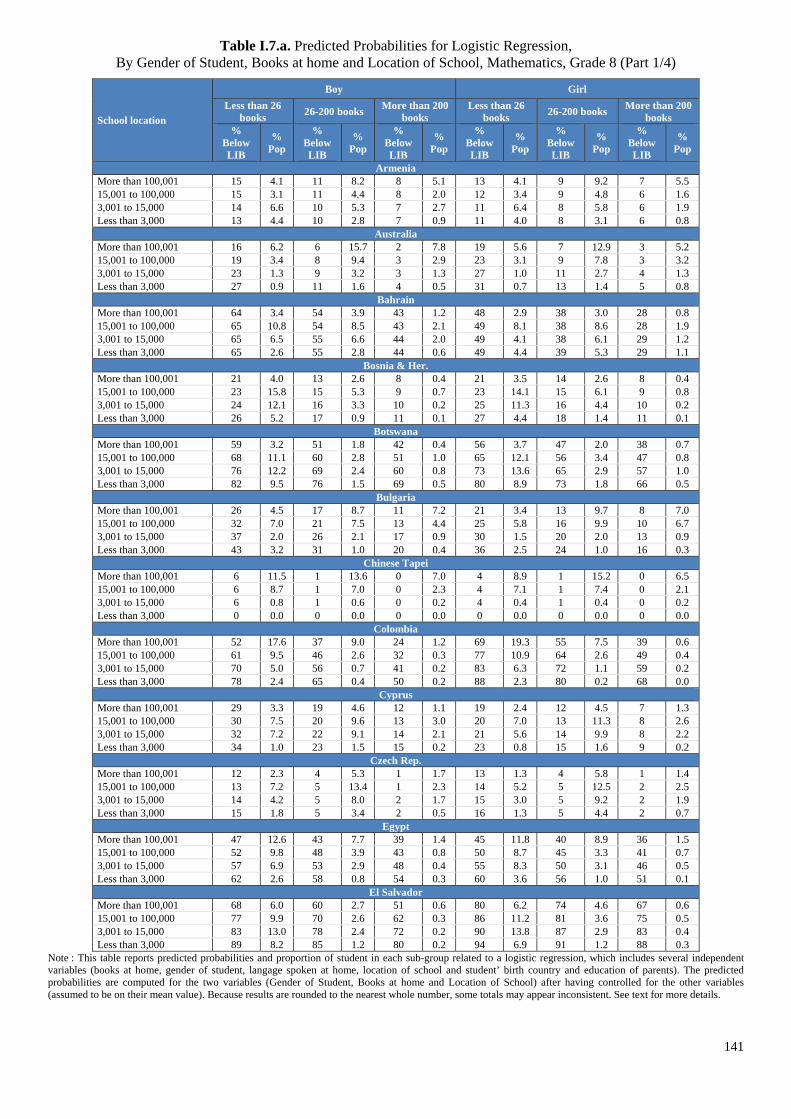
141
Table I.7.a. Predicted Probabilities for Logistic Regression, By Gender of Student, Books at home and Location of School, Mathematics, Grade 8 (Part 1/4)
School location
Boy Girl Less than 26
books 26-200 books More than 200 books
Less than 26 books 26-200 books More than 200
books %
Below LIB
% Pop
% Below LIB
% Pop
% Below LIB
% Pop
% Below LIB
% Pop
% Below LIB
% Pop
% Below LIB
% Pop
Armenia More than 100,001 15 4.1 11 8.2 8 5.1 13 4.1 9 9.2 7 5.5 15,001 to 100,000 15 3.1 11 4.4 8 2.0 12 3.4 9 4.8 6 1.6 3,001 to 15,000 14 6.6 10 5.3 7 2.7 11 6.4 8 5.8 6 1.9 Less than 3,000 13 4.4 10 2.8 7 0.9 11 4.0 8 3.1 6 0.8
Australia More than 100,001 16 6.2 6 15.7 2 7.8 19 5.6 7 12.9 3 5.2 15,001 to 100,000 19 3.4 8 9.4 3 2.9 23 3.1 9 7.8 3 3.2 3,001 to 15,000 23 1.3 9 3.2 3 1.3 27 1.0 11 2.7 4 1.3 Less than 3,000 27 0.9 11 1.6 4 0.5 31 0.7 13 1.4 5 0.8
Bahrain More than 100,001 64 3.4 54 3.9 43 1.2 48 2.9 38 3.0 28 0.8 15,001 to 100,000 65 10.8 54 8.5 43 2.1 49 8.1 38 8.6 28 1.9 3,001 to 15,000 65 6.5 55 6.6 44 2.0 49 4.1 38 6.1 29 1.2 Less than 3,000 65 2.6 55 2.8 44 0.6 49 4.4 39 5.3 29 1.1
Bosnia & Her. More than 100,001 21 4.0 13 2.6 8 0.4 21 3.5 14 2.6 8 0.4 15,001 to 100,000 23 15.8 15 5.3 9 0.7 23 14.1 15 6.1 9 0.8 3,001 to 15,000 24 12.1 16 3.3 10 0.2 25 11.3 16 4.4 10 0.2 Less than 3,000 26 5.2 17 0.9 11 0.1 27 4.4 18 1.4 11 0.1
Botswana More than 100,001 59 3.2 51 1.8 42 0.4 56 3.7 47 2.0 38 0.7 15,001 to 100,000 68 11.1 60 2.8 51 1.0 65 12.1 56 3.4 47 0.8 3,001 to 15,000 76 12.2 69 2.4 60 0.8 73 13.6 65 2.9 57 1.0 Less than 3,000 82 9.5 76 1.5 69 0.5 80 8.9 73 1.8 66 0.5
Bulgaria More than 100,001 26 4.5 17 8.7 11 7.2 21 3.4 13 9.7 8 7.0 15,001 to 100,000 32 7.0 21 7.5 13 4.4 25 5.8 16 9.9 10 6.7 3,001 to 15,000 37 2.0 26 2.1 17 0.9 30 1.5 20 2.0 13 0.9 Less than 3,000 43 3.2 31 1.0 20 0.4 36 2.5 24 1.0 16 0.3
Chinese Tapei More than 100,001 6 11.5 1 13.6 0 7.0 4 8.9 1 15.2 0 6.5 15,001 to 100,000 6 8.7 1 7.0 0 2.3 4 7.1 1 7.4 0 2.1 3,001 to 15,000 6 0.8 1 0.6 0 0.2 4 0.4 1 0.4 0 0.2 Less than 3,000 0 0.0 0 0.0 0 0.0 0 0.0 0 0.0 0 0.0
Colombia More than 100,001 52 17.6 37 9.0 24 1.2 69 19.3 55 7.5 39 0.6 15,001 to 100,000 61 9.5 46 2.6 32 0.3 77 10.9 64 2.6 49 0.4 3,001 to 15,000 70 5.0 56 0.7 41 0.2 83 6.3 72 1.1 59 0.2 Less than 3,000 78 2.4 65 0.4 50 0.2 88 2.3 80 0.2 68 0.0
Cyprus More than 100,001 29 3.3 19 4.6 12 1.1 19 2.4 12 4.5 7 1.3 15,001 to 100,000 30 7.5 20 9.6 13 3.0 20 7.0 13 11.3 8 2.6 3,001 to 15,000 32 7.2 22 9.1 14 2.1 21 5.6 14 9.9 8 2.2 Less than 3,000 34 1.0 23 1.5 15 0.2 23 0.8 15 1.6 9 0.2
Czech Rep. More than 100,001 12 2.3 4 5.3 1 1.7 13 1.3 4 5.8 1 1.4 15,001 to 100,000 13 7.2 5 13.4 1 2.3 14 5.2 5 12.5 2 2.5 3,001 to 15,000 14 4.2 5 8.0 2 1.7 15 3.0 5 9.2 2 1.9 Less than 3,000 15 1.8 5 3.4 2 0.5 16 1.3 5 4.4 2 0.7
Egypt More than 100,001 47 12.6 43 7.7 39 1.4 45 11.8 40 8.9 36 1.5 15,001 to 100,000 52 9.8 48 3.9 43 0.8 50 8.7 45 3.3 41 0.7 3,001 to 15,000 57 6.9 53 2.9 48 0.4 55 8.3 50 3.1 46 0.5 Less than 3,000 62 2.6 58 0.8 54 0.3 60 3.6 56 1.0 51 0.1
El Salvador More than 100,001 68 6.0 60 2.7 51 0.6 80 6.2 74 4.6 67 0.6 15,001 to 100,000 77 9.9 70 2.6 62 0.3 86 11.2 81 3.6 75 0.5 3,001 to 15,000 83 13.0 78 2.4 72 0.2 90 13.8 87 2.9 83 0.4 Less than 3,000 89 8.2 85 1.2 80 0.2 94 6.9 91 1.2 88 0.3
Note : This table reports predicted probabilities and proportion of student in each sub-group related to a logistic regression, which includes several independent variables (books at home, gender of student, langage spoken at home, location of school and student’ birth country and education of parents). The predicted probabilities are computed for the two variables (Gender of Student, Books at home and Location of School) after having controlled for the other variables (assumed to be on their mean value). Because results are rounded to the nearest whole number, some totals may appear inconsistent. See text for more details.
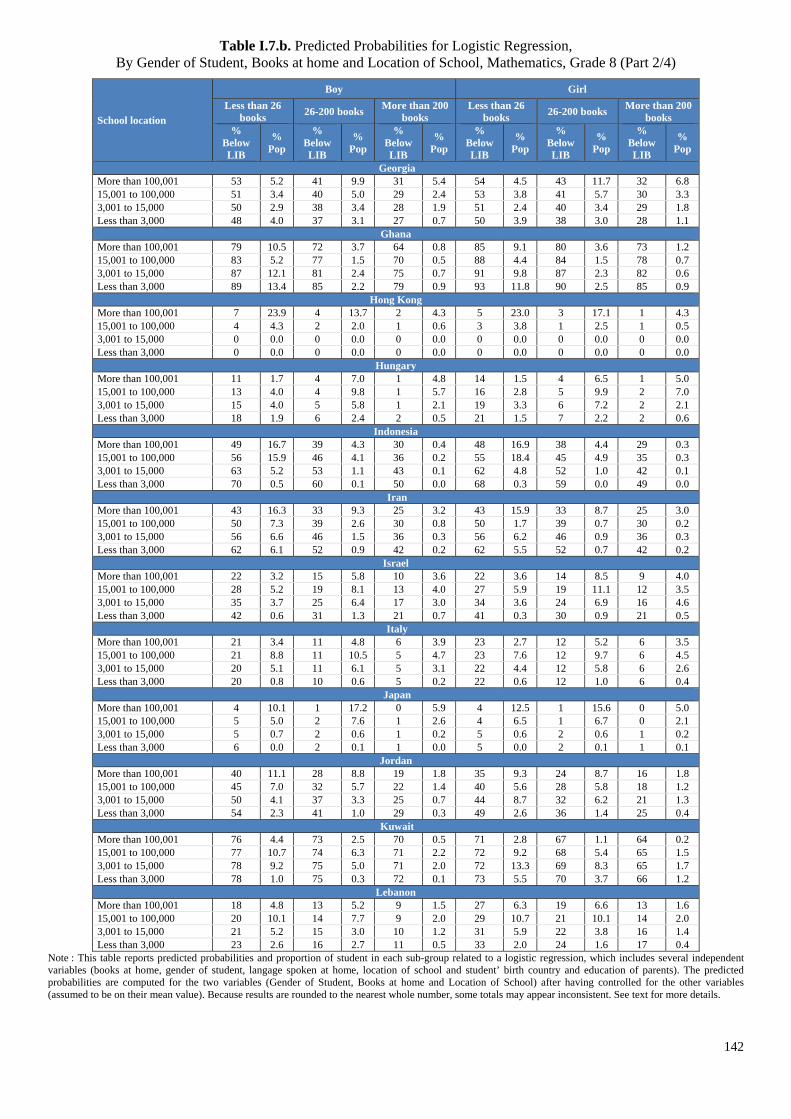
142
Table I.7.b. Predicted Probabilities for Logistic Regression, By Gender of Student, Books at home and Location of School, Mathematics, Grade 8 (Part 2/4)
School location
Boy Girl Less than 26
books 26-200 books More than 200 books
Less than 26 books 26-200 books More than 200
books %
Below LIB
% Pop
% Below LIB
% Pop
% Below LIB
% Pop
% Below LIB
% Pop
% Below LIB
% Pop
% Below LIB
% Pop
Georgia More than 100,001 53 5.2 41 9.9 31 5.4 54 4.5 43 11.7 32 6.8 15,001 to 100,000 51 3.4 40 5.0 29 2.4 53 3.8 41 5.7 30 3.3 3,001 to 15,000 50 2.9 38 3.4 28 1.9 51 2.4 40 3.4 29 1.8 Less than 3,000 48 4.0 37 3.1 27 0.7 50 3.9 38 3.0 28 1.1
Ghana More than 100,001 79 10.5 72 3.7 64 0.8 85 9.1 80 3.6 73 1.2 15,001 to 100,000 83 5.2 77 1.5 70 0.5 88 4.4 84 1.5 78 0.7 3,001 to 15,000 87 12.1 81 2.4 75 0.7 91 9.8 87 2.3 82 0.6 Less than 3,000 89 13.4 85 2.2 79 0.9 93 11.8 90 2.5 85 0.9
Hong Kong More than 100,001 7 23.9 4 13.7 2 4.3 5 23.0 3 17.1 1 4.3 15,001 to 100,000 4 4.3 2 2.0 1 0.6 3 3.8 1 2.5 1 0.5 3,001 to 15,000 0 0.0 0 0.0 0 0.0 0 0.0 0 0.0 0 0.0 Less than 3,000 0 0.0 0 0.0 0 0.0 0 0.0 0 0.0 0 0.0
Hungary More than 100,001 11 1.7 4 7.0 1 4.8 14 1.5 4 6.5 1 5.0 15,001 to 100,000 13 4.0 4 9.8 1 5.7 16 2.8 5 9.9 2 7.0 3,001 to 15,000 15 4.0 5 5.8 1 2.1 19 3.3 6 7.2 2 2.1 Less than 3,000 18 1.9 6 2.4 2 0.5 21 1.5 7 2.2 2 0.6
Indonesia More than 100,001 49 16.7 39 4.3 30 0.4 48 16.9 38 4.4 29 0.3 15,001 to 100,000 56 15.9 46 4.1 36 0.2 55 18.4 45 4.9 35 0.3 3,001 to 15,000 63 5.2 53 1.1 43 0.1 62 4.8 52 1.0 42 0.1 Less than 3,000 70 0.5 60 0.1 50 0.0 68 0.3 59 0.0 49 0.0
Iran More than 100,001 43 16.3 33 9.3 25 3.2 43 15.9 33 8.7 25 3.0 15,001 to 100,000 50 7.3 39 2.6 30 0.8 50 1.7 39 0.7 30 0.2 3,001 to 15,000 56 6.6 46 1.5 36 0.3 56 6.2 46 0.9 36 0.3 Less than 3,000 62 6.1 52 0.9 42 0.2 62 5.5 52 0.7 42 0.2
Israel More than 100,001 22 3.2 15 5.8 10 3.6 22 3.6 14 8.5 9 4.0 15,001 to 100,000 28 5.2 19 8.1 13 4.0 27 5.9 19 11.1 12 3.5 3,001 to 15,000 35 3.7 25 6.4 17 3.0 34 3.6 24 6.9 16 4.6 Less than 3,000 42 0.6 31 1.3 21 0.7 41 0.3 30 0.9 21 0.5
Italy More than 100,001 21 3.4 11 4.8 6 3.9 23 2.7 12 5.2 6 3.5 15,001 to 100,000 21 8.8 11 10.5 5 4.7 23 7.6 12 9.7 6 4.5 3,001 to 15,000 20 5.1 11 6.1 5 3.1 22 4.4 12 5.8 6 2.6 Less than 3,000 20 0.8 10 0.6 5 0.2 22 0.6 12 1.0 6 0.4
Japan More than 100,001 4 10.1 1 17.2 0 5.9 4 12.5 1 15.6 0 5.0 15,001 to 100,000 5 5.0 2 7.6 1 2.6 4 6.5 1 6.7 0 2.1 3,001 to 15,000 5 0.7 2 0.6 1 0.2 5 0.6 2 0.6 1 0.2 Less than 3,000 6 0.0 2 0.1 1 0.0 5 0.0 2 0.1 1 0.1
Jordan More than 100,001 40 11.1 28 8.8 19 1.8 35 9.3 24 8.7 16 1.8 15,001 to 100,000 45 7.0 32 5.7 22 1.4 40 5.6 28 5.8 18 1.2 3,001 to 15,000 50 4.1 37 3.3 25 0.7 44 8.7 32 6.2 21 1.3 Less than 3,000 54 2.3 41 1.0 29 0.3 49 2.6 36 1.4 25 0.4
Kuwait More than 100,001 76 4.4 73 2.5 70 0.5 71 2.8 67 1.1 64 0.2 15,001 to 100,000 77 10.7 74 6.3 71 2.2 72 9.2 68 5.4 65 1.5 3,001 to 15,000 78 9.2 75 5.0 71 2.0 72 13.3 69 8.3 65 1.7 Less than 3,000 78 1.0 75 0.3 72 0.1 73 5.5 70 3.7 66 1.2
Lebanon More than 100,001 18 4.8 13 5.2 9 1.5 27 6.3 19 6.6 13 1.6 15,001 to 100,000 20 10.1 14 7.7 9 2.0 29 10.7 21 10.1 14 2.0 3,001 to 15,000 21 5.2 15 3.0 10 1.2 31 5.9 22 3.8 16 1.4 Less than 3,000 23 2.6 16 2.7 11 0.5 33 2.0 24 1.6 17 0.4
Note : This table reports predicted probabilities and proportion of student in each sub-group related to a logistic regression, which includes several independent variables (books at home, gender of student, langage spoken at home, location of school and student’ birth country and education of parents). The predicted probabilities are computed for the two variables (Gender of Student, Books at home and Location of School) after having controlled for the other variables (assumed to be on their mean value). Because results are rounded to the nearest whole number, some totals may appear inconsistent. See text for more details.
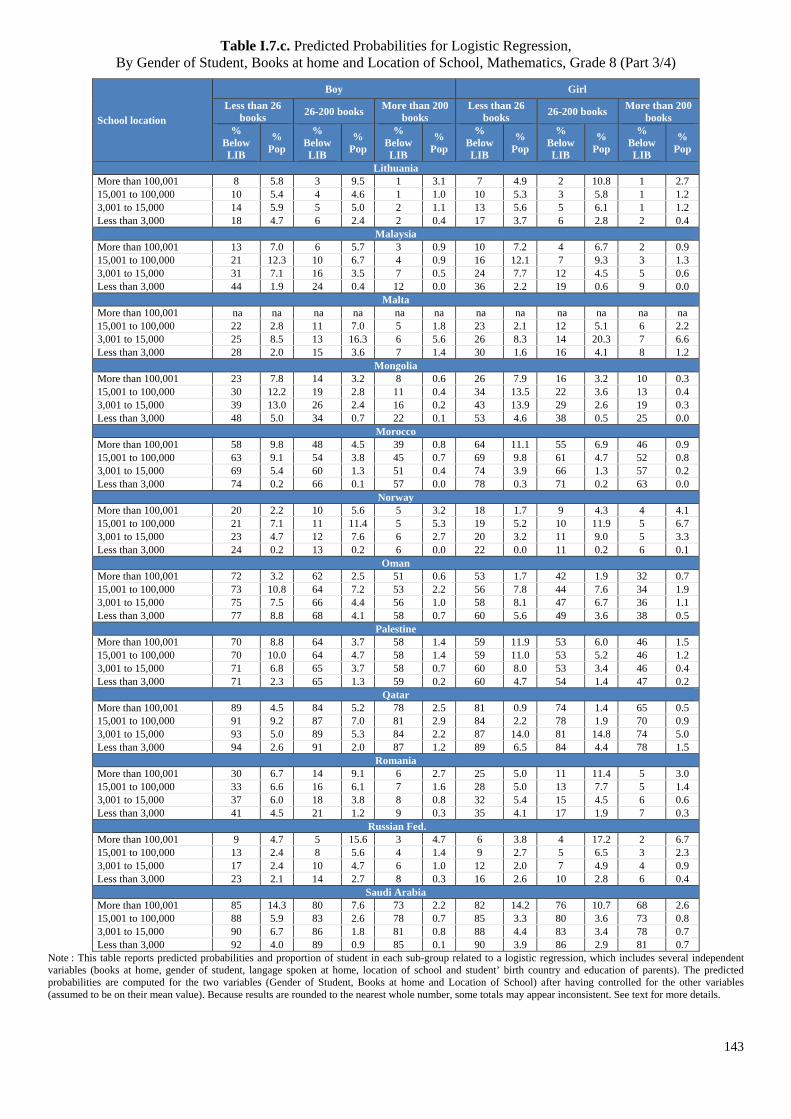
143
Table I.7.c. Predicted Probabilities for Logistic Regression, By Gender of Student, Books at home and Location of School, Mathematics, Grade 8 (Part 3/4)
School location
Boy Girl Less than 26
books 26-200 books More than 200 books
Less than 26 books 26-200 books More than 200
books %
Below LIB
% Pop
% Below LIB
% Pop
% Below LIB
% Pop
% Below LIB
% Pop
% Below LIB
% Pop
% Below LIB
% Pop
Lithuania More than 100,001 8 5.8 3 9.5 1 3.1 7 4.9 2 10.8 1 2.7 15,001 to 100,000 10 5.4 4 4.6 1 1.0 10 5.3 3 5.8 1 1.2 3,001 to 15,000 14 5.9 5 5.0 2 1.1 13 5.6 5 6.1 1 1.2 Less than 3,000 18 4.7 6 2.4 2 0.4 17 3.7 6 2.8 2 0.4
Malaysia More than 100,001 13 7.0 6 5.7 3 0.9 10 7.2 4 6.7 2 0.9 15,001 to 100,000 21 12.3 10 6.7 4 0.9 16 12.1 7 9.3 3 1.3 3,001 to 15,000 31 7.1 16 3.5 7 0.5 24 7.7 12 4.5 5 0.6 Less than 3,000 44 1.9 24 0.4 12 0.0 36 2.2 19 0.6 9 0.0
Malta More than 100,001 na na na na na na na na na na na na 15,001 to 100,000 22 2.8 11 7.0 5 1.8 23 2.1 12 5.1 6 2.2 3,001 to 15,000 25 8.5 13 16.3 6 5.6 26 8.3 14 20.3 7 6.6 Less than 3,000 28 2.0 15 3.6 7 1.4 30 1.6 16 4.1 8 1.2
Mongolia More than 100,001 23 7.8 14 3.2 8 0.6 26 7.9 16 3.2 10 0.3 15,001 to 100,000 30 12.2 19 2.8 11 0.4 34 13.5 22 3.6 13 0.4 3,001 to 15,000 39 13.0 26 2.4 16 0.2 43 13.9 29 2.6 19 0.3 Less than 3,000 48 5.0 34 0.7 22 0.1 53 4.6 38 0.5 25 0.0
Morocco More than 100,001 58 9.8 48 4.5 39 0.8 64 11.1 55 6.9 46 0.9 15,001 to 100,000 63 9.1 54 3.8 45 0.7 69 9.8 61 4.7 52 0.8 3,001 to 15,000 69 5.4 60 1.3 51 0.4 74 3.9 66 1.3 57 0.2 Less than 3,000 74 0.2 66 0.1 57 0.0 78 0.3 71 0.2 63 0.0
Norway More than 100,001 20 2.2 10 5.6 5 3.2 18 1.7 9 4.3 4 4.1 15,001 to 100,000 21 7.1 11 11.4 5 5.3 19 5.2 10 11.9 5 6.7 3,001 to 15,000 23 4.7 12 7.6 6 2.7 20 3.2 11 9.0 5 3.3 Less than 3,000 24 0.2 13 0.2 6 0.0 22 0.0 11 0.2 6 0.1
Oman More than 100,001 72 3.2 62 2.5 51 0.6 53 1.7 42 1.9 32 0.7 15,001 to 100,000 73 10.8 64 7.2 53 2.2 56 7.8 44 7.6 34 1.9 3,001 to 15,000 75 7.5 66 4.4 56 1.0 58 8.1 47 6.7 36 1.1 Less than 3,000 77 8.8 68 4.1 58 0.7 60 5.6 49 3.6 38 0.5
Palestine More than 100,001 70 8.8 64 3.7 58 1.4 59 11.9 53 6.0 46 1.5 15,001 to 100,000 70 10.0 64 4.7 58 1.4 59 11.0 53 5.2 46 1.2 3,001 to 15,000 71 6.8 65 3.7 58 0.7 60 8.0 53 3.4 46 0.4 Less than 3,000 71 2.3 65 1.3 59 0.2 60 4.7 54 1.4 47 0.2
Qatar More than 100,001 89 4.5 84 5.2 78 2.5 81 0.9 74 1.4 65 0.5 15,001 to 100,000 91 9.2 87 7.0 81 2.9 84 2.2 78 1.9 70 0.9 3,001 to 15,000 93 5.0 89 5.3 84 2.2 87 14.0 81 14.8 74 5.0 Less than 3,000 94 2.6 91 2.0 87 1.2 89 6.5 84 4.4 78 1.5
Romania More than 100,001 30 6.7 14 9.1 6 2.7 25 5.0 11 11.4 5 3.0 15,001 to 100,000 33 6.6 16 6.1 7 1.6 28 5.0 13 7.7 5 1.4 3,001 to 15,000 37 6.0 18 3.8 8 0.8 32 5.4 15 4.5 6 0.6 Less than 3,000 41 4.5 21 1.2 9 0.3 35 4.1 17 1.9 7 0.3
Russian Fed. More than 100,001 9 4.7 5 15.6 3 4.7 6 3.8 4 17.2 2 6.7 15,001 to 100,000 13 2.4 8 5.6 4 1.4 9 2.7 5 6.5 3 2.3 3,001 to 15,000 17 2.4 10 4.7 6 1.0 12 2.0 7 4.9 4 0.9 Less than 3,000 23 2.1 14 2.7 8 0.3 16 2.6 10 2.8 6 0.4
Saudi Arabia More than 100,001 85 14.3 80 7.6 73 2.2 82 14.2 76 10.7 68 2.6 15,001 to 100,000 88 5.9 83 2.6 78 0.7 85 3.3 80 3.6 73 0.8 3,001 to 15,000 90 6.7 86 1.8 81 0.8 88 4.4 83 3.4 78 0.7 Less than 3,000 92 4.0 89 0.9 85 0.1 90 3.9 86 2.9 81 0.7
Note : This table reports predicted probabilities and proportion of student in each sub-group related to a logistic regression, which includes several independent variables (books at home, gender of student, langage spoken at home, location of school and student’ birth country and education of parents). The predicted probabilities are computed for the two variables (Gender of Student, Books at home and Location of School) after having controlled for the other variables (assumed to be on their mean value). Because results are rounded to the nearest whole number, some totals may appear inconsistent. See text for more details.
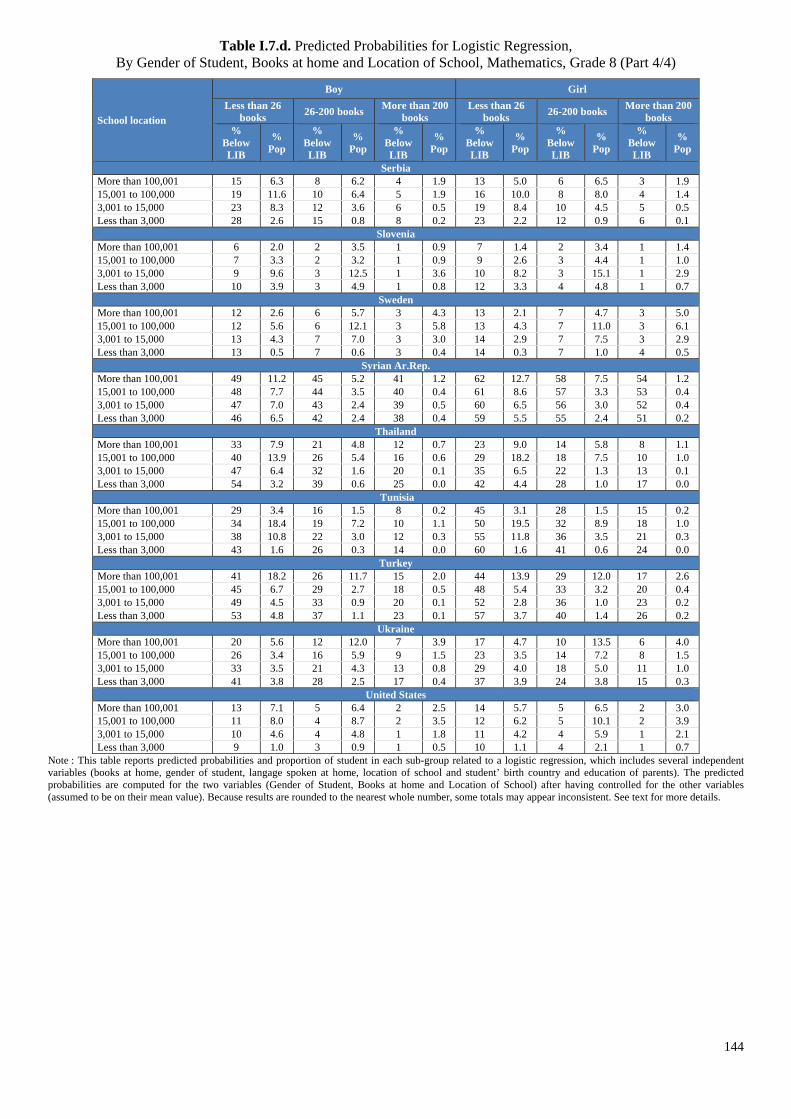
144
Table I.7.d. Predicted Probabilities for Logistic Regression, By Gender of Student, Books at home and Location of School, Mathematics, Grade 8 (Part 4/4)
School location
Boy Girl Less than 26
books 26-200 books More than 200 books
Less than 26 books 26-200 books More than 200
books %
Below LIB
% Pop
% Below LIB
% Pop
% Below LIB
% Pop
% Below LIB
% Pop
% Below LIB
% Pop
% Below LIB
% Pop
Serbia More than 100,001 15 6.3 8 6.2 4 1.9 13 5.0 6 6.5 3 1.9 15,001 to 100,000 19 11.6 10 6.4 5 1.9 16 10.0 8 8.0 4 1.4 3,001 to 15,000 23 8.3 12 3.6 6 0.5 19 8.4 10 4.5 5 0.5 Less than 3,000 28 2.6 15 0.8 8 0.2 23 2.2 12 0.9 6 0.1
Slovenia More than 100,001 6 2.0 2 3.5 1 0.9 7 1.4 2 3.4 1 1.4 15,001 to 100,000 7 3.3 2 3.2 1 0.9 9 2.6 3 4.4 1 1.0 3,001 to 15,000 9 9.6 3 12.5 1 3.6 10 8.2 3 15.1 1 2.9 Less than 3,000 10 3.9 3 4.9 1 0.8 12 3.3 4 4.8 1 0.7
Sweden More than 100,001 12 2.6 6 5.7 3 4.3 13 2.1 7 4.7 3 5.0 15,001 to 100,000 12 5.6 6 12.1 3 5.8 13 4.3 7 11.0 3 6.1 3,001 to 15,000 13 4.3 7 7.0 3 3.0 14 2.9 7 7.5 3 2.9 Less than 3,000 13 0.5 7 0.6 3 0.4 14 0.3 7 1.0 4 0.5
Syrian Ar.Rep. More than 100,001 49 11.2 45 5.2 41 1.2 62 12.7 58 7.5 54 1.2 15,001 to 100,000 48 7.7 44 3.5 40 0.4 61 8.6 57 3.3 53 0.4 3,001 to 15,000 47 7.0 43 2.4 39 0.5 60 6.5 56 3.0 52 0.4 Less than 3,000 46 6.5 42 2.4 38 0.4 59 5.5 55 2.4 51 0.2
Thailand More than 100,001 33 7.9 21 4.8 12 0.7 23 9.0 14 5.8 8 1.1 15,001 to 100,000 40 13.9 26 5.4 16 0.6 29 18.2 18 7.5 10 1.0 3,001 to 15,000 47 6.4 32 1.6 20 0.1 35 6.5 22 1.3 13 0.1 Less than 3,000 54 3.2 39 0.6 25 0.0 42 4.4 28 1.0 17 0.0
Tunisia More than 100,001 29 3.4 16 1.5 8 0.2 45 3.1 28 1.5 15 0.2 15,001 to 100,000 34 18.4 19 7.2 10 1.1 50 19.5 32 8.9 18 1.0 3,001 to 15,000 38 10.8 22 3.0 12 0.3 55 11.8 36 3.5 21 0.3 Less than 3,000 43 1.6 26 0.3 14 0.0 60 1.6 41 0.6 24 0.0
Turkey More than 100,001 41 18.2 26 11.7 15 2.0 44 13.9 29 12.0 17 2.6 15,001 to 100,000 45 6.7 29 2.7 18 0.5 48 5.4 33 3.2 20 0.4 3,001 to 15,000 49 4.5 33 0.9 20 0.1 52 2.8 36 1.0 23 0.2 Less than 3,000 53 4.8 37 1.1 23 0.1 57 3.7 40 1.4 26 0.2
Ukraine More than 100,001 20 5.6 12 12.0 7 3.9 17 4.7 10 13.5 6 4.0 15,001 to 100,000 26 3.4 16 5.9 9 1.5 23 3.5 14 7.2 8 1.5 3,001 to 15,000 33 3.5 21 4.3 13 0.8 29 4.0 18 5.0 11 1.0 Less than 3,000 41 3.8 28 2.5 17 0.4 37 3.9 24 3.8 15 0.3
United States More than 100,001 13 7.1 5 6.4 2 2.5 14 5.7 5 6.5 2 3.0 15,001 to 100,000 11 8.0 4 8.7 2 3.5 12 6.2 5 10.1 2 3.9 3,001 to 15,000 10 4.6 4 4.8 1 1.8 11 4.2 4 5.9 1 2.1 Less than 3,000 9 1.0 3 0.9 1 0.5 10 1.1 4 2.1 1 0.7
Note : This table reports predicted probabilities and proportion of student in each sub-group related to a logistic regression, which includes several independent variables (books at home, gender of student, langage spoken at home, location of school and student’ birth country and education of parents). The predicted probabilities are computed for the two variables (Gender of Student, Books at home and Location of School) after having controlled for the other variables (assumed to be on their mean value). Because results are rounded to the nearest whole number, some totals may appear inconsistent. See text for more details.