an evaluation of the effectiveness of high speed seagull...
TRANSCRIPT

An Evaluation of the Effectiveness of High Speed Seagull
Intersections in the Metropolitan Area of Perth,
Western Australia
Curtin-Monash Accident Research Centre
Faculty of Health Sciences
Curtin University of Technology
Perth WA 6102
Chow K, Meuleners L
August 2016

DOCUMENT RETRIEVAL INFORMATION
Title An Evaluation of the Effectiveness of High Speed Seagull Intersections in the Metropolitan Area of Perth, Western Australia __________________________________________________________________________ Author(s) Chow K, Meuleners L __________________________________________________________________________ Performing Organisation Curtin-Monash Accident Research Centre Faculty of Health Sciences Curtin University of Technology 7 Parker Place, Technology Park Perth WA 6102 Tel: (08) 9266 4636 Fax: (08) 9266 2508 ___________________________________________________________________________ Sponsor Main Roads Western Australia Don Aitken Centre Waterloo Crescent EAST PERTH WA 6004 ___________________________________________________________________________ Abstract Seagull islands are a common “at-grade” treatment for three legged T-intersections used on high traffic volume roads and dual carriageways in countries such as Australia, New Zealand and the United States. The aim of this study is to evaluate the effectiveness of high speed seagull intersections on WA roads located in the metropolitan area. The results found that the treatment has been effective on Marmion Avenue, reducing all reported crashes by 21.4% and casualty crashes by 62.4% for treated sites in the study sample. The treatment could potentially also be effective on roads of similar conditions and characteristics, but there no definitive conclusion for roads with different conditions, pending the availability of more usable data for future study. Results from the analysis will help to provide Western Australian road authorities with more objective information to guide future investment and implementations of seagull intersections at high speed rural settings. _________________________________________________________________________________________ Keywords Seagull intersections, seagull islands, dual carriageway T-intersections, crash frequency, crash severity ___________________________________________________________________________
i
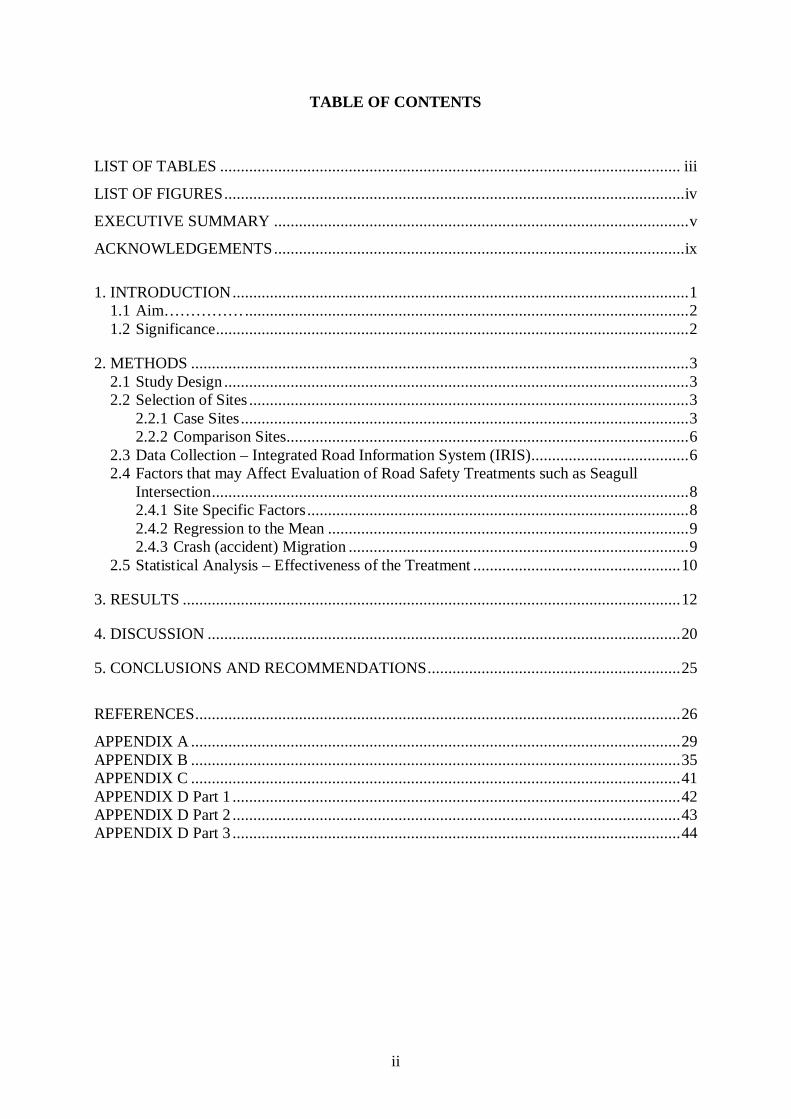
TABLE OF CONTENTS
LIST OF TABLES ............................................................................................................... iii
LIST OF FIGURES ............................................................................................................... iv
EXECUTIVE SUMMARY .................................................................................................... v
ACKNOWLEDGEMENTS ................................................................................................... ix
1. INTRODUCTION .............................................................................................................. 1 1.1 Aim…………… ........................................................................................................... 2 1.2 Significance .................................................................................................................. 2
2. METHODS ........................................................................................................................ 3 2.1 Study Design ................................................................................................................ 3 2.2 Selection of Sites .......................................................................................................... 3
2.2.1 Case Sites ............................................................................................................ 3 2.2.2 Comparison Sites................................................................................................. 6
2.3 Data Collection – Integrated Road Information System (IRIS) ...................................... 6 2.4 Factors that may Affect Evaluation of Road Safety Treatments such as Seagull
Intersection ................................................................................................................... 8 2.4.1 Site Specific Factors ............................................................................................ 8 2.4.2 Regression to the Mean ....................................................................................... 9 2.4.3 Crash (accident) Migration .................................................................................. 9
2.5 Statistical Analysis – Effectiveness of the Treatment .................................................. 10
3. RESULTS ........................................................................................................................ 12
4. DISCUSSION .................................................................................................................. 20
5. CONCLUSIONS AND RECOMMENDATIONS ............................................................. 25
REFERENCES ..................................................................................................................... 26
APPENDIX A ...................................................................................................................... 29 APPENDIX B ...................................................................................................................... 35 APPENDIX C ...................................................................................................................... 41 APPENDIX D Part 1 ............................................................................................................ 42 APPENDIX D Part 2 ............................................................................................................ 43 APPENDIX D Part 3 ............................................................................................................ 44
ii

LIST OF TABLES
Table 3.1 WA High Speed Seagull Intersections and Comparison Sites Sampled for the Study ............................................................................................................. 13
Table 3.2 Seagull Intersection Treatment Effect on Reduction in All Reported Crashes . 15 Table 3.3 Seagull Intersection Treatment Effect on Reduction in Casualty Crashes ....... 18
iii

LIST OF FIGURES
Figure 2.1 A Seagull Intersection on Marmion Avenue ..................................................... 5 Figure 3.1 Seagull Intersection Treatment Effect on Reduction in All Reported Crashes . 16
Figure 3.2 Seagull Intersection Treatment Effect on Reduction in Casualty Crashes ....... 19
iv

EXECUTIVE SUMMARY
This report presents the results of an evaluation of seagull intersection treatments
which were implemented on a high speed metropolitan road (speed limit = 80 km/h)
in Perth, Western Australia (WA). It evaluated the effectiveness of the seagull
intersection treatment in terms of reduction in crash frequency (presented for
casualty crashes and all reported crashes) at the study locations. It is anticipated that
these results will help to provide Main Roads WA and other road safety
organisations with reliable, objective information for enhancing strategies for future
road safety investment.
The findings from the evaluation are summarised below.
Methods
A “before and after” study was undertaken. The sample consisted of 6 treated sites
which were dual carriageway T-intersections on a high speed road (speed limit ≥ 80
km/h). The 6 sites were all located on Marmion Avenue with the seagull intersection
treatment implemented between the years 2002 and 2007, each with a “before”
exposure of 5 years and also an “after” exposure of 5 years.
To test the effectiveness of treated sites, each treated site was matched with a
comparison site with similar speed limit and road characteristics. The 6 comparison
sites were from Wanneroo Road.
Results
The results found that the treatment has been effective overall, reducing all reported
crash frequencies by 21.4% and casualty crash frequencies by 62.4%. The results are
specific to the particular environment and conditions on Marmion Avenue, and might
represent sites on other roads with similar conditions, but possibly not roads of non-
similar characteristics.
v

Seagull Intersection Treatment Effect on Crash Reductions
Limitation of the Study
Limitations to the study included the lack of suitable sites in WA that had usable
“before and after” exposure data to account for design specifications of each seagull
intersection such as angle and median width. The lack of suitable sites also led to the
decision to omit the more complex adjustment for traffic volume that would have
taken into account all interactions between flows from different directions of the thru
and side traffic.
Another limitation was the lack of accurate information regarding the time of
installation of the seagull intersection treatment at each site. It was crucial that
neither the before treatment period nor the after treatment period overlapped the
All Reported Crashes Estimate (β)
Standard Error
Probability 0 < p < 1
Incidence Rate Ratio
IRR
Crash Reduction
(%)6 treated +6 untreated sites (n = 12)
Group0 = untreated site1 = treated site
1.247 0.167 < 0.001 3.478
Time0 = before treatment1 = after treatment
-0.022 0.082 0.788 0.978
Time * Group -0.241 0.095 0.011 0.786 21.4%
Casualty Crashes Estimate (β)
Standard Error
Probability 0 < p < 1
Incidence Rate Ratio
IRR
Crash Reduction
(%)6 treated +6 untreated sites (n = 12)
Group0 = untreated site1 = treated site
1.335 0.355 < 0.001 3.800
Time0 = before treatment1 = after treatment
0.336 0.315 0.285 1.400
Time * Group -0.978 0.380 0.010 0.376 62.4%
vi

construction period, in which case estimates of the treatment effect could result in
bias towards the lesser or greater magnitude compared to the true value.
To help gain a better understanding of the effectiveness of the seagull intersection
treatment on roads with characteristics not similar to Marmion Avenue, further
descriptive statistics and preliminary results (seagull treatment only) from a yet to be
published C-MARC study on all WA State Black Spot treatments 2000-2012
combined (Chow et al. 2016) were also considered (Appendices C and D).
A sample of 17 seagull sites and 12 non-seagull comparison sites on 110 km/h
sections of WA roads were identified by Main Roads WA and considered. A full
“before and after” study was not possible over these sites because of their lack of
“before” exposure so only the distribution of crashes in the “after” period was
examined. For the 110 km/h sections, overall, the seagull sites experience much
higher frequency of all reported crashes per site (average per site: 746 crashes per
million vehicles) than their non-seagull counterparts (average per site: 193 crashes
per million vehicles). However, the proportion of all crashes being Casualty Crashes
were much less at the seagull sites (24%) than the non-seagull ones (41%). But the
proportion of Killed or Seriously Injured (KSI) Crashes appeared to be no different
for the seagull sites (15%) and the non-seagull ones (15%).
Such results appear to suggest a hypothesis that the 110 km/h locations chosen to
receive the seagull treatment could have experienced a higher frequency of all
reported crashes, potentially due to the specific conditions at each location rather the
seagull treatment itself. However, the seagull treatment could have possibly reduced
the severity of most crashes (therefore a smaller proportion of all crashes being
Casualty Crashes). Though the seagull treatment alone might not have been able to
reduce the more extreme of the severities. The definitive confirmation of such a
hypothesis will only be possible should more usable data become available for a
future study.
The yet to be published C-MARC study on all WA State Black Spot treatments
2000-2012 combined (Chow et al. 2016) considered a sample of 41 metropolitan and
5 rural seagull treatment sites with different speed limits, not focusing on the high
vii

speed 110 km/h roads that are of particular interest. The preliminary results suggest
that the 46 sites sampled experienced a slight increase in All Reported Crashes
(1.5%), but no significant change in Casualty Crashes after receiving the seagull
treatment. However, as Chow et al. (2016) acknowledged the steady increase in
traffic volume over the years but made an assumption that it was negligible for the
purpose of modelling due to similar limitations as noted in this standalone study of
the seagull treatment, the results from Chow eta al. (2016) could also be
conservative.
Recommendations and Conclusion
Given some of the difficulties experienced in the current study, it is recommended
that a comprehensive and systematic method of data collection be implemented to
facilitate future evaluations of seagull intersections or other road safety treatments.
Should more case sites with suitable exposure data become available, it is also
recommended that this evaluation be repeated and adjust for traffic flow, as well as
account for design specifications of each seagull intersection such as angle and
median width.
viii

ACKNOWLEDGEMENTS
This report was funded by Main Roads, WA. The authors would like to
acknowledge the contributions of David Moyses, Brendon Wiseman and Tony
Radalj, and to thank Syeda Sultana and Fritha Argus for their time, support and
feedback with various aspects of the data management and analysis related to this
project.
ix

1. INTRODUCTION
A seagull island is defined as “a triangular island used to separate right turning
traffic from through traffic in the same carriageway” (Austroads, 2005). The seagull
layout is a common “at-grade” treatment for three legged T-intersections and is
usually used on high traffic volume roads and dual carriageways (Tang & Levett,
2009). There are many seagull intersection layouts across the road network in
Western Australia and may vary in terms of design layout, road geometry and site
conditions (Harper et al., 2011).
A T-intersection/T-junction which utilises a seagull island is known as a seagull
intersection (Harper et al., 2011). In countries such as the United States, these
intersections are more commonly known as a “continuous green T-intersections”, T-
intersections utilising continuous green through lanes (CGTLs), turbo-T
intersections, or high-T intersections (Jarem, 2004; Reid, 2004; Federal Highway
Administration, 2010).
Seagull islands/intersections are named due to the two right-turn lanes (or the two
left-turn lanes in countries driving on the right) looking similar to the wings of a
seagull when viewed from the sky. These intersections allow both directions of
traffic on a through road to flow with minimal interruptions. The advantage of this
design type over a more traditional T-intersection design is that delay(s) through the
intersection can be reduced – with the flow of traffic on the main road being
maintained (straight both ways as well as into the side road), even at the most basic
implantation. The flow of traffic out of the side road can also be smoothened with
the addition of filter lanes. For example, a left-turn filter lane from the side road into
the main road and another filter lane that merges with the main road traffic after
right-turn from the side road. In theory, the reduction in delay time and smoother
traffic flow through the intersection can lead to reduction in vehicle emissions as
well as other potential economic and social benefits (Litsas, 2002). In terms of road
safety, one advantage of the seagull layout is the separation of conflicting vehicle
paths resulting in a reduction of right angle crashes (Radalj et al., 2006).
1

A previous literature review performed by C-MARC found that earlier international
studies with different methodologies often led to conclusions that contradicted one
another. The literature review found that the more appropriate analytical method to
examine the road safety effectiveness of seagull intersections should be, at the
foremost, of an experimental “before and after” study design; then, if possible,
adjusted for traffic volume as well as accounting for the design specifications of each
seagull intersection such as angle and median width (Chow & Meuleners, 2015).
1.1 Aim
Seagull intersections have varying safety records and have been the object of much
discussion (Harper et al., 2011). The aim of this study is to evaluate the
effectiveness of seagull intersections in terms of the net reduction in crash frequency
at high speed sites treated in the Perth metropolitan area, WA.
1.2 Significance
The results of this study will provide Main Roads WA and other responsible
agencies with reliable and objective information for future investments in seagull
intersections and implementations of such treatments at high speed settings, as well
as assist road authorities to manage future resources so that injury from road trauma
is minimised.
2

2. METHODS
2.1 Study Design
A quasi-experimental, “before” and “after” design was adopted for the study. The
use of comparison sites was incorporated into the study design to determine the
change in crash frequencies at six high speed sites (speed limit ≥ 80 km/h) treated
with the seagull intersection treatment on Marmion Avenue, metropolitan Western
Australia, between the years 2002 and 2007. The study analysed the frequencies of
all reported crashes (including all fatal crashes, hospitalisation crashes, medical
treatment crashes, and property damage only (PDO) crashes) and casualty crashes
(including all fatal crashes, hospitalisation crashes, and medical treatment crashes).
Treatment effect was estimated by comparing all reported crash and casualty crash
frequencies at each treated site to those at an appropriately matched comparison site.
The use of a comparison group provided an adequate measure of the reductions in
crash frequency due to factors other than these treatments over the study period.
2.2 Selection of Sites
2.2.1 Case Sites
A number of seagull intersections implemented on high speed (speed limit ≥ 80
km/h), dual carriageway T-intersections in WA rural regions were identified. In
particular, a list of nine seagull intersections was identified on Forrest Highway, all
on high speed sections of the highway with speed limit of either 100 or 110 km/h.
Additionally, a further 11 seagull intersections were identified on Bussell Highway,
all on sections with a speed limit between 80 km/h and 110 km/h. However, these
seagull intersections had no “before” exposure crash period. A further list of 6
seagull intersections on Marmion Avenue that had “before” and “after” exposure
periods was then identified. While these 6 intersections were not implemented in
rural regions, they all had a high speed limit of 80 km/h and experienced higher daily
traffic then the Forrest Highway and Bussell Highway intersections. It was expected
that any reduction in crashes experienced by the Marmion Avenue intersections
would act as a more conservative indication of the potential reductions at Forrest
Highway and Bussell Highways. The 6 seagull intersections on Marmion Avenue,
treated between the years 2002 and 2007, formed the final sample of case sites for
this study. Figure 2.1 shows the “triangular island” of the seagull intersection
3

treatment on one of the Marmion Avenue sites. See Appendix A for the location and
a picture of each of the six sites.
4
Figure 2.1 A Seagull Intersection on Marmion Avenue
5

2.2.2 Comparison Sites
To test the effectiveness of treated sites, the best method is to have each treated site
matched with a comparison site having similar road characteristics. However, in a
quasi-experimental study design the selection of comparison sites is a balance
between matchings of specific site characteristics in order to control for confounding
influences on crash trends. The basic assumption is that if the characteristics of
matched sites are similar, then their crash rates (adjusted for traffic volume) should
be too. The comparison sites are used to indicate what would have happened at the
treated sites if no treatment was applied.
Six comparison sites were chosen on Wanneroo Road to match the 6 Marmion
Avenue case sites with the seagull intersection treatment. This group of comparison
sites was chosen because they were located on a section of Wanneroo Road that was
“parallel” to the section of Marmion Avenue which contained the 6 case sites, and
that similar traffic characteristics such as flow and volume could be assumed. Both
of these road sections had one end intersecting with Warwick Road and the other end
intersecting with Whitfords Avenue. The pre- and post- exposure periods for the
comparison sites were chosen such that the first comparison site along Wanneroo
Road from the Warwick Road to Whitfords Avenue direction had its exposure
periods matching those of the first case site along Marmion Avenue also from the
Warwick Road to Whitfords Avenue direction. The second comparison site along
Wanneroo Road also had its exposure periods matching those of the second case site
along Marmion Avenue, and so on. See Appendix B for the location and a picture of
each site.
2.3 Data Collection – Integrated Road Information System (IRIS)
The Road Safety Section at Main Roads, WA (MRWA) provided information on
each treated site. Crash data for the before and after installation of treatment was
obtained from the Integrated Road Information System (IRIS) using police reported
data which is maintained by MRWA.
The IRIS database contains detailed information on the characteristics of the vehicles
involved in road crashes, crash circumstances, Police reported injury and road
6

information related to the crash location. Crash data for the evaluation was obtained
up to and including 31st December, 2014.
The definition of a crash used throughout this report is the definition used by the
Road Safety Council in its annual publication “Reported Road Crashes in Western
Australia 2013” (Office of Road Safety, 2014). That is, a crash is “any
unpremeditated incident where in the course of the use of any vehicle on a road that
was not temporarily closed off to the public, a person is injured or property is
damaged. The crash must involve vehicle movement. Does not include collisions
that occur due to a medical condition, deliberate acts (e.g. suicide attempts) or
police chases”.
The severity of a crash is derived from “the most serious injury in a crash”. A fatal
crash is “a road crash in which at least one person was killed immediately or died
within 30 days of the crash, as a result of the crash”. A hospitalisation crash is a
road crash that involved at least one admission to hospital but “no fatalities within 30
days of the crash”. A medical treatment crash (or medical attention crash) is “a road
crash in which the most serious injury resulted in a person requiring medical
treatment, but without being admitted to hospital”. A property damage only (PDO)
crash involved no/unknown injuries only.
For the purpose of this report, casualty crashes include all fatal crashes,
hospitalisation crashes, and medical treatment crashes. All reported crashes include
all fatal crashes, hospitalisation crashes, medical treatment crashes, and PDO
crashes.
In WA, it is mandatory for the driver of a vehicle to report a traffic crash when the
incident occurred on a road or any place commonly used by the public, e.g. carparks;
and
- the incident resulted in bodily harm to any person; or
- the total value of property damaged to all involved parties exceeds $3000; or
- the owner or representative of any damaged property is not present.
7

Critical data retrieved for use in the study were:
- crash date;
- crash severity;
- local government area of crash; and
- specific crash location.
The study adopted an approach that utilised five years of pre-treatment crash data as
well as five years of post-treatment crash data which excluded the construction
period. Crash data which was used in the analysis included all fatal, hospitalisation,
medical treatment and PDO crashes. This was consistent with MRWA’s intention to
ensure application of funds to a wider range of projects at hazardous situations using
different thresholds such as all reported crashes rather than casualty crashes only. A
separate analysis by casualty crashes only was also undertaken.
2.4 Factors that may Affect Evaluation of Road Safety Treatments such as Seagull
Intersection
When estimating the treatment effect, all known factors that have the potential to
affect the evaluation of a road safety treatment should be accounted for. However,
Elvik (1997) found that the more factors that are accounted for, the less effective the
treatment appears to be.
Some of the factors that may affect the evaluation of the effectiveness of the seagull
intersection treatment are described below. These include site-specific factors,
regression to the mean, and crash migration.
2.4.1 Site Specific Factors
Some of the observed change in the number and severity of crashes at a site could be
accounted for by specific events other than the treatment. These specific events
could, for example, include weather conditions and increased publicity about the
safety of the site. Both these may lead to an increase in driver caution which could
lead to a reduction in crashes that has little to do with the treatment at the site. While
this study was unable to assess all such effects, it appeared unlikely that site specific
factors would significantly affect the evaluation of all treated sites in the sample as a
8

whole (Bureau of Transport, 2001). However, any analysis at a particular site could
be affected (Bureau of Transport, 2001).
2.4.2 Regression to the Mean
The high crash rates observed at some sites may possibly be due to chance or a
combination of both chance and the hazardousness of the site. Even if no treatment
is to be carried out, some of these sites will likely have fewer crashes in the
subsequent period because the number of crashes will tend to gravitate to the long-
term mean. Under these conditions, the effect of any treatment is likely to be over-
estimated. Failing to allow for the regression to the mean effect can result in
statistically significant results for treatments that are in fact ineffective.
On the basis of work reported by Nicholson (1986), at least three and preferably five
years of data is the preferred before and after time period to smooth out any random
fluctuations as well as to provide sufficient evidence of any trend or change in an
established pattern of crashes. Five years of pre-treatment crash data as well as five
years of post-treatment crash data were used for all sites evaluated in the study. The
statistical methodology used in this report also recognised the level and distribution
of random variation in the data and provided appropriate confidence intervals and
significance levels.
2.4.3 Crash (accident) Migration
The term crash migration (also referred as accident migration) describes an increase
in crashes at sites in the vicinity of a treated site, away from the treated site to the
surrounding area, following the treatment of that site. Whether crash migration is a
real effect in road safety treatments such as Black Spot treatments or the seagull
intersection treatment remains a controversial topic, which has not been adequately
resolved by road safety experts. Therefore, the analysis has not attempted to deal
with crash migration. For the purpose of this report, the assumption was made that
no treatment could be associated with crash migration resulting from traffic migration
away from the treated site.
For a more in-depth discussion of crash migration see Elvik (1997).
9

2.5 Statistical Analysis – Effectiveness of the Treatment
The frequencies of crashes between “before” and “after” treatment periods were
compared in the analysis. The study used a generalised estimating equation (GEE)
Poisson regression model to evaluate the high speed seagull intersections. The
number of crashes in one year is a discrete “count” variable and assumed to follow a
Poisson distribution. However, the application of standard Poisson regression
analysis was inappropriate due to the longitudinal nature of the observations, while
the GEE was one of the more appropriate methods that could accommodate the
inherent correlation of the longitudinal data. The decision to use the GEE Poisson
model took into account the correlated nature of the repeated measures taken before
and after the seagull intersection treatment.
The correct effect of a treatment could also be estimated by the GEE Poisson
regression model, as robust standard errors were generated to provide valid statistical
inferences. The overall treatment effect was estimated by the model. As the number
of high speed WA sites with the seagull intersection treatment that have appropriate
“before” and “after” exposure periods were limited, the six case sites in this study
were grouped together to attain a higher statistical power, regardless of the design
specifications of each seagull intersection such as angle and median width. Details
about the GEE technique can be found in Dupont (2002) and Twisk (2003).
Each model included an interaction term to examine the effect of the road treatment
post intervention for the treated sites compared to the untreated or “comparison”
sites. This was because the changes in the number of crashes over time were
different between the treated and untreated sites. Therefore, an interaction term
between time (before treatment and after treatment) and group (treated sites and
untreated sites) would account for these changes in the model.
Information on traffic volumes over time at individual treated site would be useful to
determine whether any changes in crash history were due to a treatment at the site or
whether changes in traffic flow gave rise to the observed discrepancies before and
after treatment. While it was possible to obtain estimated figures of annual average
daily traffic (AADT) from MRWA for both the thru road and side road associated
with each treated seagull intersection and have the crash data adjusted for traffic
10

volume, in practice the interactions between flows of (1) both directions of thru
traffic maintaining those same directions, (2) thru traffic of the two directions turning
into side traffic, and (3) side traffic turning into one of the two directions of the thru
traffic, would make for complex adjustment that would only be accurate or of
meaningful value had more sites existed in the study sample. For the purpose of this
analysis it was thus assumed that before and after traffic volumes remained constant.
As traffic volume was known to grow from year to year, this would possibly result in
a more conservative reporting of crash reductions. Sites with zero crashes would
have been excluded from the analysis but there was no such site in the study sample.
The model was fitted to the data using the Stata (Version 12) statistical package.
11
3. RESULTS
This section details the results for all reported crash and casualty crash frequency.
Table 3.1 shows the number of treated case sites, the exposure and number of crashes
before and after treatment, as well as the untreated control sites and their details.
12

Table 3.1 WA High Speed Seagull Intersections and Comparison Sites Sampled for the Study
Case Site Intersection ID
Intersection Description Road No.
Road Name Speed Limit
(km/h)
Exposure "Before" Treatment
(Days)
All Reported Crashes "Before" Treatment
Casualty Crashes "Before" Treatment
Exposure "After"
Treatment (Days)
All Reported Crashes "After"
Treatment
Casualty Crashes "After"
Treatment
1 60423 Marmion Av & Marri Rd H029 Marmion Av 80 1826 21 6 1826 10 12 60424 Marmion Av & Seacrest Dr H029 Marmion Av 80 1826 43 4 1826 31 33 60426 Marmion Av & Harman Rd H029 Marmion Av 80 1826 11 3 1826 14 24 60429 Marmion Av & Warburton Av H029 Marmion Av 80 1826 50 10 1826 38 55 60432 Marmion Av & Giles Av H029 Marmion Av 80 1826 18 9 1826 9 46 60434 Marmion Av & Cook Av H029 Marmion Av 80 1826 17 6 1826 21 5
Comparison Site
Intersection ID
Intersection Description Road No.
Road Name Speed Limit
(km/h)
Exposure "Before"
(Days)
All Reported Crashes in
Period "Before"
Casualty Crashes in
Period "Before"
Exposure "After" (Days)
All Reported Crashes in
Period "After"
Casualty Crashes in
Period "After"
1 14043 Wanneroo Rd & Gorman St H035 Wanneroo Rd 70 1826 4 2 1826 4 22 14042 Wanneroo Rd & Parin Rd H035 Wanneroo Rd 70 1826 15 4 1826 10 33 11967 Wanneroo Rd & Daley St H035 Wanneroo Rd 70 1826 0 0 1826 4 14 14041 Wanneroo Rd & Canham Wy H035 Wanneroo Rd 70 1826 14 2 1826 12 45 11968 Wanneroo Rd & Kingfisher Wy H035 Wanneroo Rd 70 1826 1 0 1826 5 36 14035 Wanneroo Rd & Hocking Rd H035 Wanneroo Rd 70 1826 12 2 1826 10 1
13

All Reported Crashes
Table 3.2 and Figure 3.1 show the effect of the seagull intersection treatment on all
reported crashes (fatal, hospitalisation, medical treatment and PDO crashes). In the
table, β represents the regression coefficient in terms of the log-scale of the outcome
variable so that the reduction rate is given by 1 – eβ. A negative value for β indicates
that all reported crash rate or casualty crash rate decreased following treatment, and
vice versa for a positive value for β. The statistical significance of treatment is given
by p. For example, p < 0.001 means that the probability of obtaining such a result by
chance is less than one in a thousand. The percentage reduction in the number of all
reported crashes and casualty crashes is shown in the last column of the table.
In this analysis, very strong evidence meant that the probability of an event occurring
by chance is less than one in one thousand (p < 0.001); strong evidence meant that
the probability is less than one in one hundred (p < 0.01); moderate evidence meant
that the probability is less than one in fifty (p < 0.02); weak evidence meant that the
probability is less than one in ten (p < 0.1) and not significant was indicated by p ≥
0.1. This was consistent with the criteria adopted by other evaluations of road safety
programs such as the National Black Spot Program evaluation (BITRE, 2012).
Overall, there was a statistically significant 21.4% reduction in all reported crashes
(p = 0.011) for the six seagull intersections compared to the comparison sites post
treatment, indicating that the treatment was successful in reducing the risk of a crash.
14

Table 3.2 Seagull Intersection Treatment Effect on Reduction in All Reported Crashes
All Reported Crashes Estimate (β)
Standard Error
Probability 0 < p < 1
95% C.I. - Lower Bound
95% C.I. - Upper Bound
Incidence Rate Ratio
IRR
Crash Reduction
(%)6 treated +6 untreated sites (n = 12)
Group0 = untreated site1 = treated site
1.247 0.167 < 0.001 0.919 1.574 3.478
Time0 = before treatment1 = after treatment
-0.022 0.082 0.788 -0.182 0.138 0.978
Time * Group -0.241 0.095 0.011 -0.427 -0.055 0.786 21.4%
15

Figure 3.1 Seagull Intersection Treatment Effect on Reduction in All Reported Crashes
020406080
100120140160180
Before After
Num
ber
of A
ll R
epor
ted
Cra
shes
Time Period
Treated Sites Untreated Sites
16

Casualty Crashes
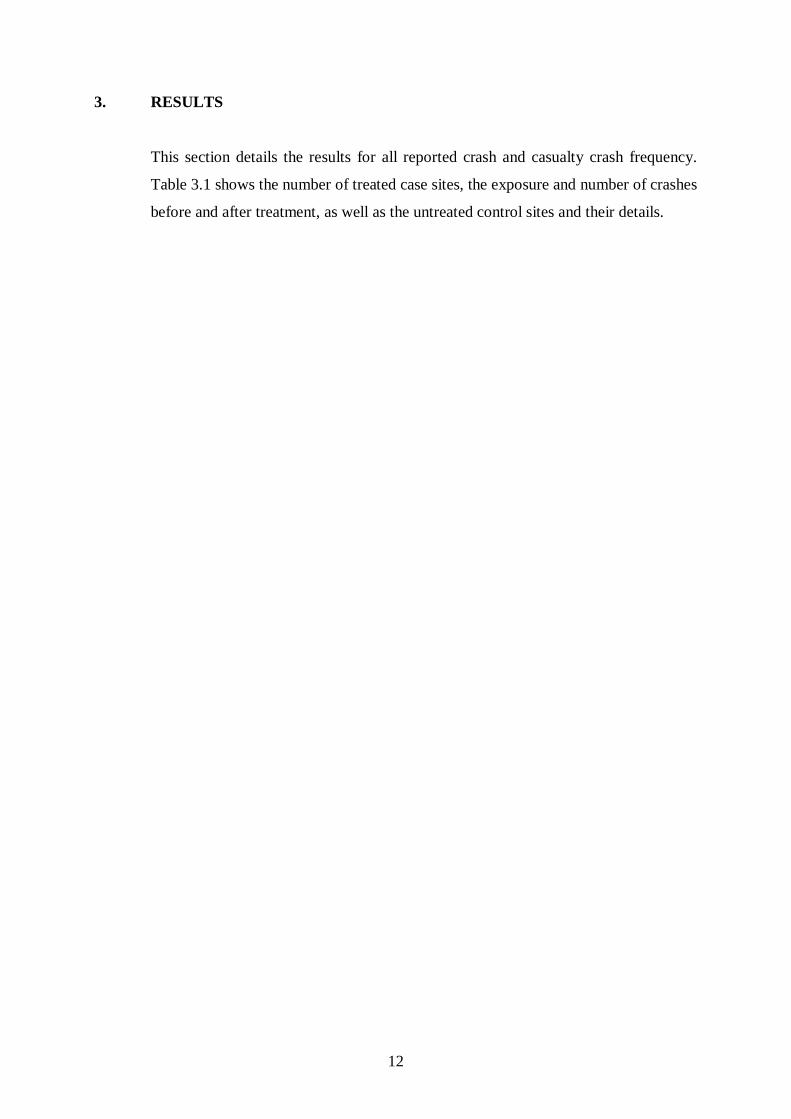
Table 3.3 and Figure 3.2 show the effect of the seagull intersection treatment on
casualty crashes only (fatal, hospitalisation and medical treatment crashes).
Overall, there was a statistically significant 62.4% reduction in casualty crashes (p =
0.010), indicating that the treatment was also highly successful in reducing crash
severity in the event of a crash.
17
Table 3.3 Seagull Intersection Treatment Effect on Reduction in Casualty Crashes
Casualty Crashes Estimate (β)
Standard Error
Probability 0 < p < 1
95% C.I. - Lower Bound
95% C.I. - Upper Bound
Incidence Rate Ratio
IRR
Crash Reduction
(%)6 treated +6 untreated sites (n = 12)
Group0 = untreated site1 = treated site
1.335 0.355 < 0.001 0.638 2.032 3.800
Time0 = before treatment1 = after treatment
0.336 0.315 0.285 -0.280 0.953 1.400
Time * Group -0.978 0.380 0.010 -1.722 -0.234 0.376 62.4%
18

Figure 3.2 Seagull Intersection Treatment Effect on Reduction in Casualty Crashes
0
5
10
15
20
25
30
35
40
Before After
Num
ber
of C
asua
lty C
rash
es
Time Period
Treated Sites Untreated Sites
19

4. DISCUSSION
This report presents the results of the evaluation of the seagull intersection treatment
on a high speed metropolitan road (speed limit = 80 km/h) in Western Australia in
terms of its effectiveness in reducing the frequency for all reported crashes and
casualty crashes. The analysis found the treatment to be effective overall in reducing
the frequency of all reported crashes by 21.4% and casualty crashes by 62.4% for the
treated sites in the study sample. The results are specific to the particular
environment and conditions on Marmion Avenue, and might represent sites on other
roads with similar conditions, but possibly not roads of non-similar characteristics.
A number of decisions were made regarding the analysis. The study examined the
both the effects of the seagull intersection treatment on all severity of crashes
(including PDO) and casualty crashes only. This was in keeping with Main Roads
WA threshold criteria, which allowed for the application of funds to a wider range of
projects based on the total number of crashes at sites which varied between regions
and road types. The alternative to this would be to study treatment effect on only
crash types most likely to be affected by the particular treatment being examined, in
this case angled crashes (or right-angled crashes). However, an evaluation of
specific crash types only may have the potential to miss all possible benefits of a
treatment as well as potential detrimental effects. According to Newstead & Corben
(2001) an evaluation that includes all crash types is more relevant when examining
the effectiveness of road safety treatments which was the aim of the present study.
The results of this new study are largely consistent with results reported in recent
State Black Spot evaluations undertaken in Western Australia. Zhang et al. (2014)
reported a significant 24.1% reduction in all reported crashes (p < 0.001) and also a
54.5% reduction (though not statistically significant) in casualty crashes (p = 0.119)
at 3 sites treated with the seagull intersection treatment under the 2007-2008 WA
State Black Spot Program. Meuleners et al. (2014) examined 2 sites treated under
the 2009-2010 State Black Spot Program and also reported a 35.1% reduction
(though not statistically significant) in all reported crashes (p = 0.463), but no
significant change in casualty crashes (p = 0.289) though this could be due to the
very small sample size. Chow et al. (2015) reported preliminary increases in both all
20

reported crashes and casualty crashes at 2 sites treated under the 2011-2012 State
Black Spot Program but commented that a small sample size and/or inadequate
exposure time post treatment available to that study (21 months) might have
produced the misleading results.
The lack of WA high speed sites with the seagull intersection treatment that had
usable “before and after” exposure data was the main limitation of the study. A
much larger sample would be required to provide the necessary statistical power to
account for design specifications of each seagull intersection such as angle and
median width.
Also, a proper adjustment for traffic volume would only be accurate or of meaningful
value had more sites existed in the study sample. For the purpose of this analysis it
was assumed that the before and after traffic volumes remained constant, which
could have possibly resulted in a more conservative reporting of crash reductions.
Another limitation was the lack of accurate information regarding the time of
installation of the seagull intersection treatment at each site. It was crucial that
neither the before treatment period nor the after treatment period overlapped the
construction period, in which case estimates of the treatment effect could result in
bias towards the lesser or greater magnitude compared to the true value. With the
assistance from MRWA, the MRWA system “Skyview” was utilised to estimate the
latest date before the treatment was installed and the earliest date after the
completion of the treatment, using archived aerial photographs. As the aerial
photography at each site was often taken at an annual basis, a more exact installation
period could not be determined. Instead, a whole year of installation period had to be
assumed for each treatment for the purpose of GEE Poisson modelling.
To help gain a better understanding of the effectiveness of the seagull intersection
treatment on roads with characteristics not similar to Marmion Avenue, further
descriptive statistics are provided in Appendix C, and preliminary results (seagull
treatment only) from a yet to be published C-MARC study on all WA State Black
Spot treatments 2000-2012 combined (Chow et al. 2016) were also extracted and
provided in Appendix D.
21

Appendix C examines the distribution of crashes at different levels of severity at a
number of seagull-treated and non-seagull comparison sites, specifically found on
110 km/h high speed sections of Forrest and Bussell Highways, which are of
particular interest to Main Roads WA. A full “before and after” study was not
possible over these sites, as they were effectively “greenfield” and lack an usable
“before” exposure for analysis. As such, only the distribution of crashes in an “after”
period (5 years, 2010-2014) can be examined, providing an alternative look but one
that would be neither definitive nor conclusive.
Appendix C suggests that the seagull intersections on 110 km/h sections of Forrest
Highway experienced, on average, much higher frequency of all reported crashes per
site (n = 10; average per site: 341 crashes per million vehicles through the thru road
of the intersection) than their non-seagull counterparts (n = 2; average per site: 104
crashes per million vehicles through the thru road of the intersection) in a same 5
year period. However, the proportion of all crashes being Casualty Crashes, were
much less at the seagull sites (23%) than the non-seagull ones (66%). Similarly, the
proportion of the more severe Killed or Seriously Injured (KSI) crashes were also
much less at the seagull sites (10%) than the non-seagull ones (34%). The seagull
sites though, did experience Fatal Crashes (2%) while the non-seagull ones
experienced none in the same 5 year period.
On the 110 km/h sections of Bussell Highway, the seagull intersections also
experienced, on average, much higher frequency of all reported crashes per site (n =
5; average per site: 484 crashes per million vehicles) than their non-seagull
counterparts (n = 7; average per site: 130 crashes per million vehicles) in the same
period. However, there appeared to be no difference in terms of the proportion of all
crashes being Casualty Crashes for the seagull sites (38%) and the non-seagull ones
(38%). The seagull sites experienced KSI Crashes (17%) and Fatal Crashes (7%) but
the non-seagull ones experienced none. Such differences suggest that the conditions
on Bussell Highway could possibly be quite different than Forrest Highway.
Appendix C also considered an overall 17 seagull sites (Bussell Hwy, Forrest Hwy,
& Indian Ocean Dr) and 12 non-seagull comparison sites (Bussell Hwy, Forrest
22
Hwy, & Great Eastern Hwy) on 110 km/h sections of WA roads identified by Main
Roads WA. For the 110 km/h sections, overall, the seagull sites experience much
higher frequency of all reported crashes per site (average per site: 746 crashes per
million vehicles) than their non-seagull counterparts (average per site: 193 crashes
per million vehicles). Overall, the proportion of all crashes being Casualty Crashes
were much less at the seagull sites (24%) than the non-seagull ones (41%).
However, the proportion of KSI Crashes appeared to be no different for the seagull
sites (15%) and the non-seagull ones (15%). The seagull sites experienced the most
severe Fatal Crashes (3%) but the non-seagull ones experienced none.
Such results from Appendix C appear to suggest a hypothesis that the 110 km/h
locations chosen to receive the seagull treatment could have experienced a higher
frequency of all reported crashes, potentially due to the specific conditions at each
location rather the seagull treatment itself. However, the seagull treatment could
have possibly reduced the severity of most crashes (therefore a smaller proportion of
all crashes being Casualty Crashes). Though the seagull treatment alone might not
have been able to reduce the more extreme of the severities. The definitive
confirmation of such a hypothesis is beyond the scope of this report due to the lack
of available data, but nonetheless an interesting hypothesis to be tested should more
usable data become available in future.
Appendix D provides an extract of the preliminary results (seagull treatment only)
from another C-MARC study on all WA State Black Spot treatments 2000-2012
combined (Chow et al. 2016). The Black Spot study also employed a “before and
after” design utilising GEE Poisson modelling that is similar to the study in this
report.
Appendix D (Chow et al. 2016) provided an overall look at seagull treatments
implemented at a sample of 41 metropolitan and 5 rural sites with different speed
limits, not focusing on the high speed 110 km/h roads that are of particular interest.
The preliminary results suggest that the 46 sites sampled experienced a slight
increase in All Reported Crashes (1.5%), but no significant change in Casualty
Crashes after receiving the seagull treatment. However, as Chow et al. (2016)
acknowledged the steady increase in traffic volume over the years but made an
23
assumption that it was negligible for the purpose of modelling due to similar
limitations as noted in this standalone study of the seagull treatment, the results from
Chow eta al. (2016) could also be conservative.
24

5. CONCLUSIONS AND RECOMMENDATIONS
The results found seagull intersection treatment to be effective and producing
positive outcomes for the community in terms of road safety, on Marmion Avenue
and potentially roads of similar conditions and characteristics. The treatment has
reduced all reported crash numbers by 21.4% and casualty crashes by 62.4% for
treated sites in the study sample. After considering additional information as
presented in Appendices C and D, there is, however, no definitive conclusion for the
treatment on roads with different conditions, pending the availability of more usable
data for future study.
Recommendations include:
• Accurate information regarding the time of installation of the seagull intersection
treatment at each site needs to be properly maintained and documented for any
future evaluation to ensure the validity of the results. It is crucial that neither the
before treatment period nor the after treatment period overlaps the construction
period, in which case estimates of the treatment effect could result in bias
towards the lesser or greater magnitude compared to the true value. Given some
of the difficulties experienced in the current study, it is recommended that a
comprehensive and systematic method of data collection be implemented to
facilitate future evaluations of seagull intersections or other road safety
treatments.
• It is also recommended that this evaluation be repeated when more case sites with
usable “before and after” exposure data become available.
• Should more case sites with suitable exposure data become available, future
evaluations should also adjust for traffic flow and account for design
specifications of each seagull intersection such as angle and median width.
25

REFERENCES
Austroads (2005). Guide to traffic engineering practice – part 5: intersections at
grade, Sydney.
Bureau of Infrastructure, Transport and Regional Economics (BITRE). (2012).
Evaluation of the National Black Spot Program Volume 1 BITRE Report 126,
Canberra ACT.
Bureau of Transport (2001). “The Black Spot Program 1996-2002: An Evaluation of
the First Three Years, Report No. 104, Commonwealth of Australia.
Chow K, Meuleners L, Hendrie D. (2015). A Preliminary Evaluation of the
Effectiveness and Cost-Effectiveness of the State Black Spot Program in Western
Australia, 2011-2012. Curtin-Monash Accident Research Centre.
Chow K & Meuleners L. (2015). A Literature Review of the Road Safety
Performance of Seagull Intersections in Australian and International Evaluations.
Curtin-Monash Accident Research Centre.
Chow K, Meuleners L, Wong A. (2016). An evaluation of the effectiveness and cost-
effectiveness of the State Black Spot Program in Western Australia, 2000-2012.
Curtin-Monash Accident Research Centre. (Draft only – yet to be published.)
Dupont WD. (2002). Statistical Modeling for Biomedical Researchers: a Simple
Introduction to the Analysis of Complex Data. Cambridge University Press,
Cambridge.
Elvik R. (1997). Evaluations of road accident blackspot treatment: A case of the iron
law of evaluation studies? Accident, Analysis and Prevention, 29: 191-199.
Federal Highway Administration (2010). Alternative Intersections/Interchanges:
Informational Report (AIIR), Publication Number: FHWA-HRT-09-060, April 2010.
26

Harper, J., Smart, W., de Roos, M. (2011). Seagull intersection layout. Island Point
Road – a case study, Roads and Traffic Authority of New South Wales.
Jarem, E.S. (2004). Safety and operational characteristics of continuous green
through lanes at signalized intersections in Florida, presented at ITE Annual Meeting
and Exhibit, Orlando, FL, August 2004.
Litsas, S., Rakha, H. (2012). Evaluation of Continuous Green T-Intersections on
Isolated Under-Saturated Four-Lane Highways, Transportation Research Board 2013
Annual Meeting.
Meuleners L, Zhang M, Hendrie D. (2014). An Evaluation of the Effectiveness and
Cost-Effectiveness of the State Black Spot Program in Western Australia, 2009-
2010. Curtin-Monash Accident Research Centre.
Newstead S. & Corben B. (2001). Evaluation of the 1992-1996 Transport Accident
Commission Funded Accident Blackspot Treatment Program in Victoria, Accident
Research Centre, Monash University, Report No.182.
Nicholson A.J. (1986). Estimation of the Underlying True Accident rate: A New
Procedure, 13th ARRB-5th REAA Combined Conference, Volume 13, Part 9, Safety,
August.
Office of Road Safety (2014). Reported road crashes in Western Australia 2013,
http://www.ors.wa.gov.au/Stats/Annual/annual-crash-statistics-2013.aspx
Radalj, T., Reveley, R., Sultana, S., Johnston, D. (2006). Seagull island evaluation,
Main Roads Western Australia.
Reid, J. (July 2004). Unconventional arterial intersection design, management and
operations strategies, Parsons Brinckerhoff.
Tang, J., Levett, S. (2009). Safety performance of T-junctions on high speed rural
roads: stage 1 – seagull T-junctions, 2009 Australasian Road Safety Research,
27

Policing and Education Conference, 10 – 13 November 2009, Sydney, New South
Wales.
Twisk J. (2003). Applied Longitudinal Data Analysis for Epidemiology: A Practical
Guide. Cambridge University Press: Cambridge.
Zhang M, Meuleners L, Hendrie D. (2014). An Evaluation of the Effectiveness and
Cost-Effectiveness of the State Black Spot Program in Western Australia: 2007-
2008. Curtin-Monash Accident Research Centre.
28

APPENDIX A – Treated Case Sites Utilised for the Study
Case Site Treatment Year
Period of Exposure "Before" Treatment
Period of Exposure "After"
Treatment
Intersection ID
Intersection Description Road No.
Road Name Straight Line Kilometres -
SLK (km)
Latitude Longitude Speed Limit
(km/h)
Exposure "Before" Treatment
(Days)
All Reported Crashes "Before" Treatment
Casualty Crashes "Before" Treatment
Exposure "After"
Treatment (Days)
All Reported Crashes "After"
Treatment
Casualty Crashes "After"
Treatment
1 2003 1998-2002 2004-2008 60423 Marmion Av & Marri Rd H029 Marmion Av 5 -31.83181 115.76384 80 1826 21 6 1826 10 1
29

Case Site Treatment Year
Period of Exposure "Before" Treatment
Period of Exposure "After"
Treatment
Intersection ID
Intersection Description Road No.
Road Name Straight Line Kilometres -
SLK (km)
Latitude Longitude Speed Limit
(km/h)
Exposure "Before" Treatment
(Days)
All Reported Crashes "Before" Treatment
Casualty Crashes "Before" Treatment
Exposure "After"
Treatment (Days)
All Reported Crashes "After"
Treatment
Casualty Crashes "After"
Treatment
2 2007 2002-2006 2008-2012 60424 Marmion Av & Seacrest Dr H029 Marmion Av 5.52 -31.82731 115.76224 80 1826 43 4 1826 31 3
30

Case Site Treatment Year
Period of Exposure "Before" Treatment
Period of Exposure "After"
Treatment
Intersection ID
Intersection Description Road No.
Road Name Straight Line Kilometres -
SLK (km)
Latitude Longitude Speed Limit
(km/h)
Exposure "Before" Treatment
(Days)
All Reported Crashes "Before" Treatment
Casualty Crashes "Before" Treatment
Exposure "After"
Treatment (Days)
All Reported Crashes "After"
Treatment
Casualty Crashes "After"
Treatment
3 2007 2002-2006 2008-2012 60426 Marmion Av & Harman Rd H029 Marmion Av 6.1 -31.82219 115.76109 80 1826 11 3 1826 14 2
31
Case Site Treatment Year
Period of Exposure "Before" Treatment
Period of Exposure "After"
Treatment
Intersection ID
Intersection Description Road No.
Road Name Straight Line Kilometres -
SLK (km)
Latitude Longitude Speed Limit
(km/h)
Exposure "Before" Treatment
(Days)
All Reported Crashes "Before" Treatment
Casualty Crashes "Before" Treatment
Exposure "After"
Treatment (Days)
All Reported Crashes "After"
Treatment
Casualty Crashes "After"
Treatment
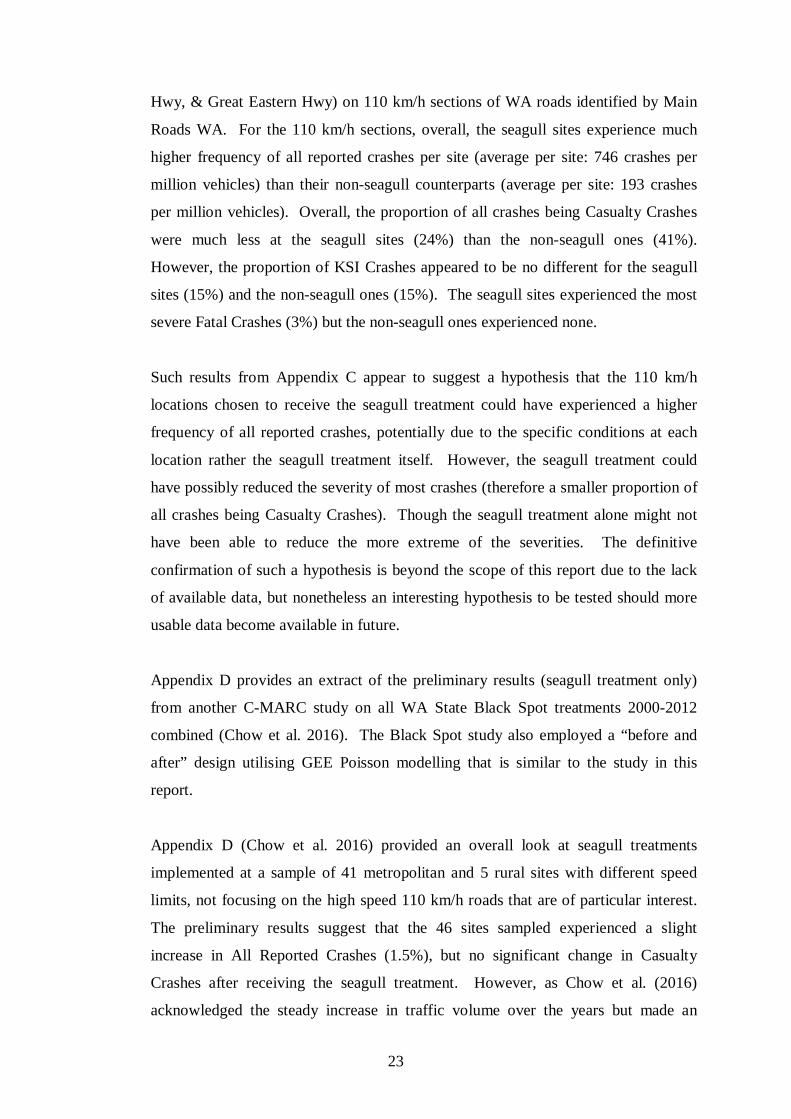
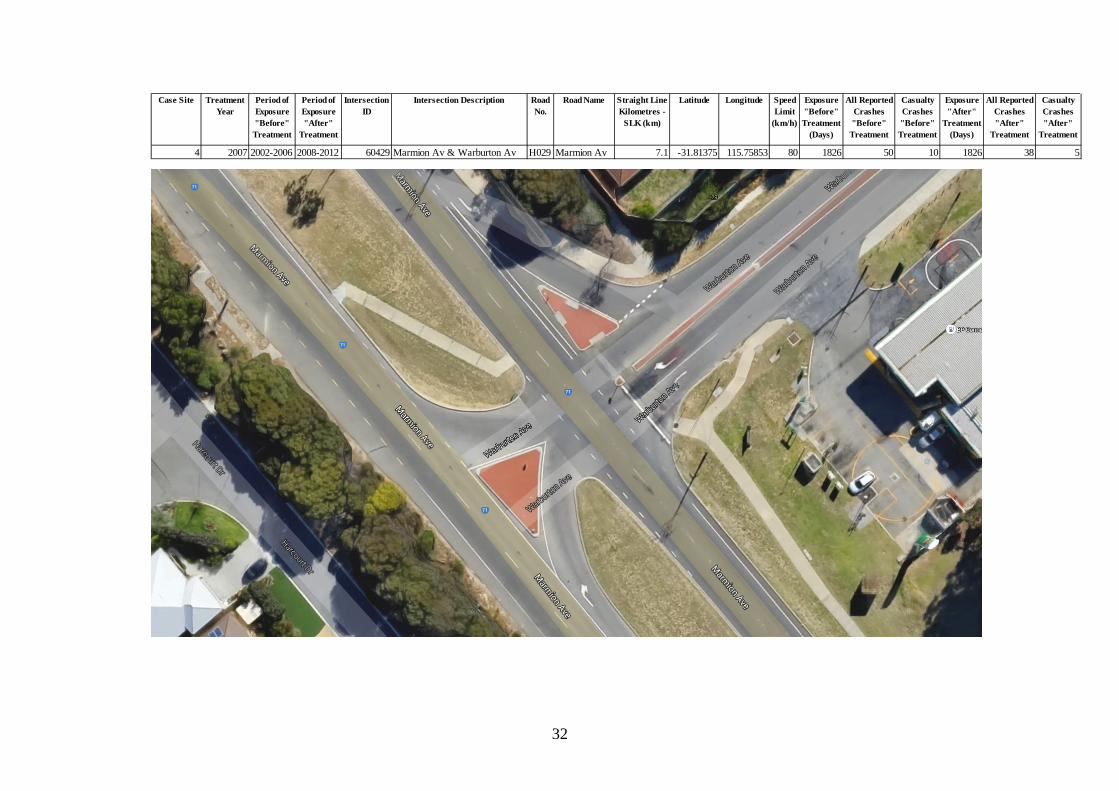
4 2007 2002-2006 2008-2012 60429 Marmion Av & Warburton Av H029 Marmion Av 7.1 -31.81375 115.75853 80 1826 50 10 1826 38 5
32

Case Site Treatment Year
Period of Exposure "Before" Treatment
Period of Exposure "After"
Treatment
Intersection ID
Intersection Description Road No.
Road Name Straight Line Kilometres -
SLK (km)
Latitude Longitude Speed Limit
(km/h)
Exposure "Before" Treatment
(Days)
All Reported Crashes "Before" Treatment
Casualty Crashes "Before" Treatment
Exposure "After"
Treatment (Days)
All Reported Crashes "After"
Treatment
Casualty Crashes "After"
Treatment
5 2002 1997-2001 2003-2007 60432 Marmion Av & Giles Av H029 Marmion Av 8.05 -31.80599 115.75603 80 1826 18 9 1826 9 4
33

Case Site Treatment Year
Period of Exposure "Before" Treatment
Period of Exposure "After"
Treatment
Intersection ID
Intersection Description Road No.
Road Name Straight Line Kilometres -
SLK (km)
Latitude Longitude Speed Limit
(km/h)
Exposure "Before" Treatment
(Days)
All Reported Crashes "Before" Treatment
Casualty Crashes "Before" Treatment
Exposure "After"
Treatment (Days)
All Reported Crashes "After"
Treatment
Casualty Crashes "After"
Treatment
6 2007 2002-2006 2008-2012 60434 Marmion Av & Cook Av H029 Marmion Av 8.62 -31.80114 115.75481 80 1826 17 6 1826 21 5
34
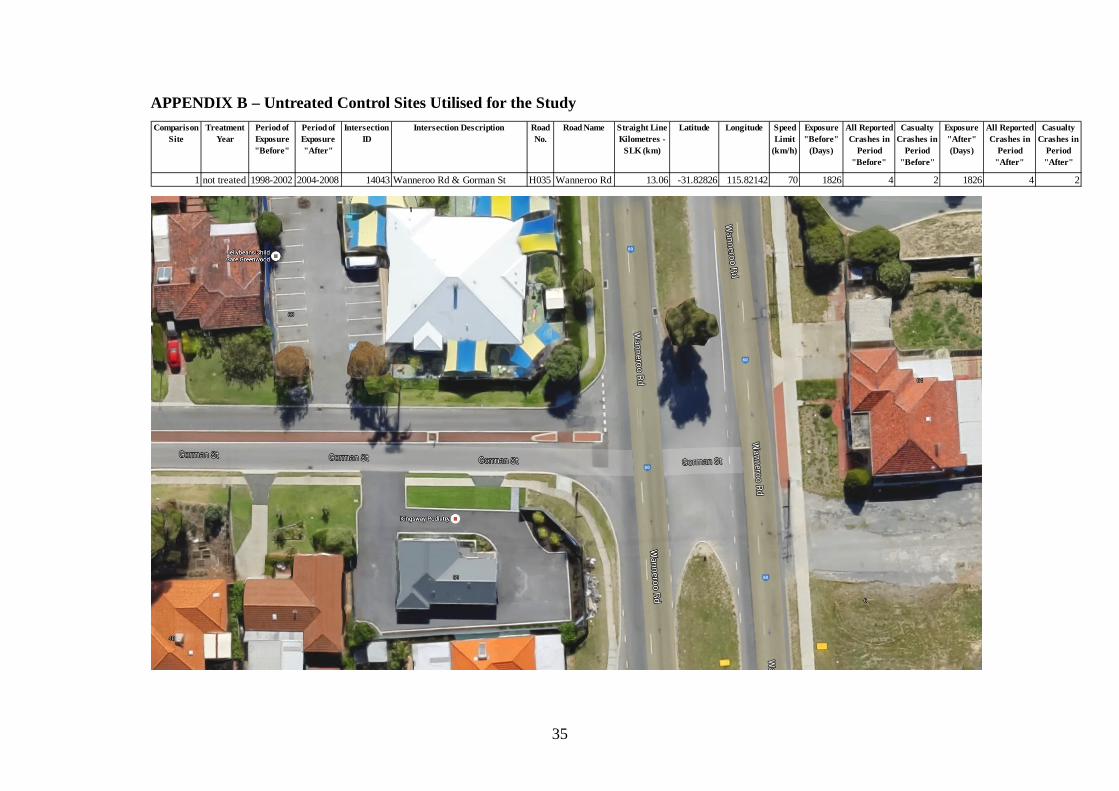
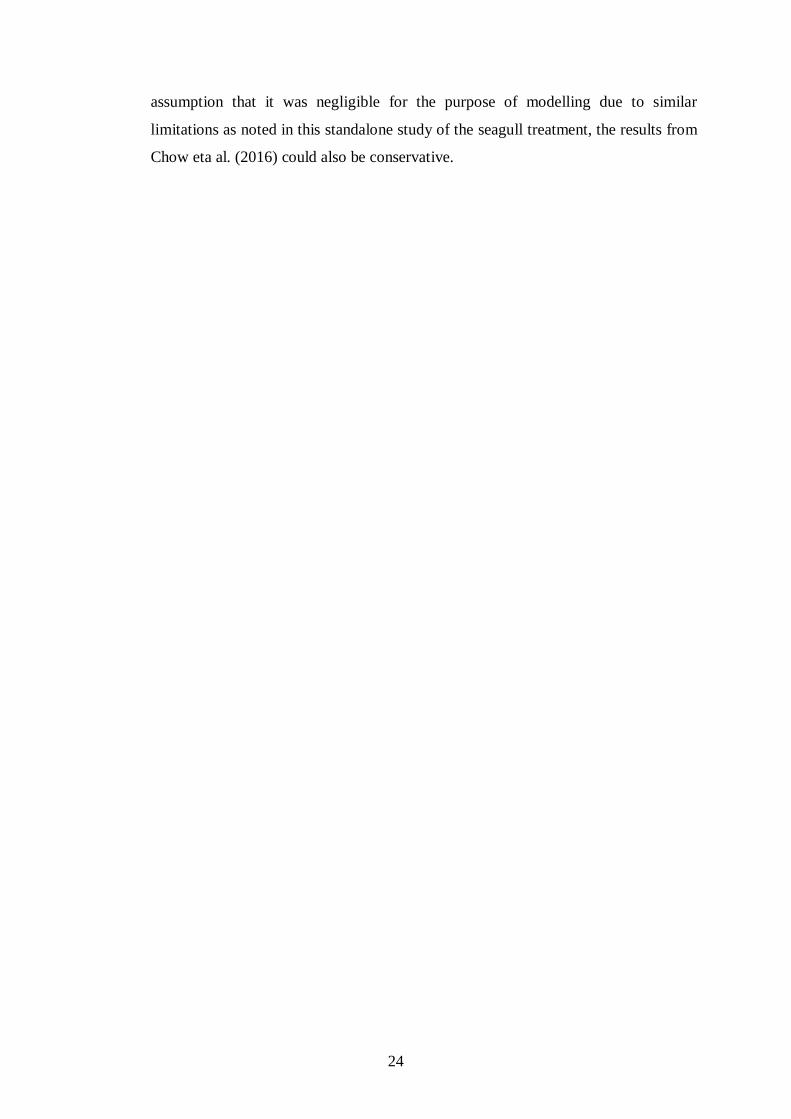
APPENDIX B – Untreated Control Sites Utilised for the Study
Comparison Site
Treatment Year
Period of Exposure "Before"
Period of Exposure "After"
Intersection ID
Intersection Description Road No.
Road Name Straight Line Kilometres -
SLK (km)
Latitude Longitude Speed Limit
(km/h)
Exposure "Before"
(Days)
All Reported Crashes in
Period "Before"
Casualty Crashes in
Period "Before"
Exposure "After" (Days)
All Reported Crashes in
Period "After"
Casualty Crashes in
Period "After"
1 not treated 1998-2002 2004-2008 14043 Wanneroo Rd & Gorman St H035 Wanneroo Rd 13.06 -31.82826 115.82142 70 1826 4 2 1826 4 2
35

Comparison Site
Treatment Year
Period of Exposure "Before"
Period of Exposure "After"
Intersection ID
Intersection Description Road No.
Road Name Straight Line Kilometres -
SLK (km)
Latitude Longitude Speed Limit
(km/h)
Exposure "Before"
(Days)
All Reported Crashes in
Period "Before"
Casualty Crashes in
Period "Before"
Exposure "After" (Days)
All Reported Crashes in
Period "After"
Casualty Crashes in
Period "After"
2 not treated 2002-2006 2008-2012 14042 Wanneroo Rd & Parin Rd H035 Wanneroo Rd 13.32 -31.82594 115.82124 70 1826 15 4 1826 10 3
36

Comparison Site
Treatment Year
Period of Exposure "Before"
Period of Exposure "After"
Intersection ID
Intersection Description Road No.
Road Name Straight Line Kilometres -
SLK (km)
Latitude Longitude Speed Limit
(km/h)
Exposure "Before"
(Days)
All Reported Crashes in
Period "Before"
Casualty Crashes in
Period "Before"
Exposure "After" (Days)
All Reported Crashes in
Period "After"
Casualty Crashes in
Period "After"
3 not treated 2002-2006 2008-2012 11967 Wanneroo Rd & Daley St H035 Wanneroo Rd 13.52 -31.82422 115.8211 70 1826 0 0 1826 4 1
37

Comparison Site
Treatment Year
Period of Exposure "Before"
Period of Exposure "After"
Intersection ID
Intersection Description Road No.
Road Name Straight Line Kilometres -
SLK (km)
Latitude Longitude Speed Limit
(km/h)
Exposure "Before"
(Days)
All Reported Crashes in
Period "Before"
Casualty Crashes in
Period "Before"
Exposure "After" (Days)
All Reported Crashes in
Period "After"
Casualty Crashes in
Period "After"
4 not treated 2002-2006 2008-2012 14041 Wanneroo Rd & Canham Wy H035 Wanneroo Rd 13.73 -31.82226 115.82094 70 1826 14 2 1826 12 4
38

Comparison Site
Treatment Year
Period of Exposure "Before"
Period of Exposure "After"
Intersection ID
Intersection Description Road No.
Road Name Straight Line Kilometres -
SLK (km)
Latitude Longitude Speed Limit
(km/h)
Exposure "Before"
(Days)
All Reported Crashes in
Period "Before"
Casualty Crashes in
Period "Before"
Exposure "After" (Days)
All Reported Crashes in
Period "After"
Casualty Crashes in
Period "After"
5 not treated 1997-2001 2003-2007 11968 Wanneroo Rd & Kingfisher Wy H035 Wanneroo Rd 15.5 -31.80624 115.81972 70 1826 1 0 1826 5 3
39

Comparison Site
Treatment Year
Period of Exposure "Before"
Period of Exposure "After"
Intersection ID
Intersection Description Road No.
Road Name Straight Line Kilometres -
SLK (km)
Latitude Longitude Speed Limit
(km/h)
Exposure "Before"
(Days)
All Reported Crashes in
Period "Before"
Casualty Crashes in
Period "Before"
Exposure "After" (Days)
All Reported Crashes in
Period "After"
Casualty Crashes in
Period "After"
6 not treated 2002-2006 2008-2012 14035 Wanneroo Rd & Hocking Rd H035 Wanneroo Rd 16.04 -31.80168 115.81767 70 1826 12 2 1826 10 1
40

APPENDIX C – Distribution of Crash Frequencies and Severities at Non-signalised Dual-carriageway T-intersections at High
Speed Locations on Selected WA Roads of Interest, 2010-2014
* Adjusted Number of Crashes = Crashes per Million Vehicles(Thru Road Section of Site) = 𝑁𝑁𝑁𝑁𝑁𝑁𝑁𝑁𝑁𝑁𝑁𝑁 𝑜𝑜𝑜𝑜 𝐶𝐶𝑁𝑁𝐶𝐶𝐶𝐶ℎ𝑁𝑁𝐶𝐶 ×1,000,000
𝐴𝐴𝐴𝐴𝐴𝐴𝐴𝐴(𝑇𝑇ℎ𝑟𝑟𝑟𝑟 𝑅𝑅𝑅𝑅𝑅𝑅𝑅𝑅 𝑆𝑆𝑆𝑆𝑆𝑆𝑆𝑆𝑆𝑆𝑅𝑅𝑆𝑆 𝑅𝑅𝑆𝑆 𝑆𝑆𝑆𝑆𝑆𝑆𝑆𝑆)
Fatal Crashes = road crashes in which at least one person was killed immediately or died within 30 days of the crash, as a result of the crash (Severity 1) Killed or Seriously Injured (KSI) Crashes = Fatal Crashes + Hospitalisation Crashes (Severities 1 + 2) Casualty Crashes = KSI Crashes + Medical Treatment/Attention Crashes (Severities 1 + 2 + 3) All Reported Crashes (All Severities) = Casualty Crashes + Property Damage Only (PDO) Crashes (Severities 1 + 2 + 3 + 4 + 5)
Thru Road Type ofNon-signalisedDual-carriagewayT-intersection
Number of T-intersections Sampled
Traffic Volume of Section of Thru Road atT-intersection:Annual Average Daily Traffic(AADT)2010-2014 Fa
tal
KSI
Cas
ualty
All
Seve
ritie
s
Fata
l
KSI
Cas
ualty
All
Seve
ritie
s
Fata
l
KSI
Cas
ualty
All
Seve
ritie
s
Fata
l
KSI
Cas
ualty
All
Seve
ritie
s
Fata
l
KSI
Cas
ualty
All
Seve
ritie
s
Fata
l
KSI
Cas
ualty
All
Seve
ritie
s
Non-seagull 2 14536 0 35 69 104 0% 34% 66% 100% 0 0 0 0 0 0 0 0Seagull 10 16761 5 35 78 341 2% 10% 23% 100% 5 25 31 97 5% 25% 32% 100% 0 0 0 42 0% 0% 0% 100%
Non-seagull 7 14124 0 0 49 130 0% 0% 38% 100% 0 0 49 69 0% 0% 71% 100% 0 0 10 20 0% 0% 50% 100%Seagull 5 11913 33 84 184 484 7% 17% 38% 100% 16 33 83 233 7% 14% 36% 100% 17 34 101 185 9% 18% 54% 100%
Non-seagull 17 30350 0 23 95 293 0% 8% 32% 100% 0 6 31 85 0% 7% 36% 100% 0 10 31 60 0% 16% 52% 100%Seagull 9 30804 0 48 174 729 0% 7% 24% 100% 0 11 65 272 0% 4% 24% 100% 0 26 69 200 0% 13% 35% 100%
Non-seagull 12 13518 0 29 79 193 0% 15% 41% 100% 0 16 52 79 0% 20% 66% 100% 0 0 6 19 0% 0% 31% 100%Seagull 17 14318 21 113 176 746 3% 15% 24% 100% 12 62 90 215 6% 29% 42% 100% 9 14 34 185 5% 8% 18% 100%
Non-seagull 7 14947 0 54 98 397 0% 14% 25% 100% 0 40 44 92 0% 44% 48% 100% 0 13 31 42 0% 32% 73% 100%Seagull 7 20534 9 168 245 909 1% 18% 27% 100% 9 134 161 308 3% 44% 52% 100% 0 28 48 275 0% 10% 18% 100%
Non-seagull 8 17518 0 35 128 362 0% 10% 35% 100% 0 35 77 157 0% 22% 49% 100% 0 0 35 52 0% 0% 67% 100%Seagull 11 14238 0 57 80 486 0% 12% 16% 100% 0 0 0 81 0% 0% 0% 100% 0 38 51 108 0% 35% 47% 100%
Non-seagull 73 24416 2 27 70 313 1% 9% 22% 100% 2 12 32 118 1% 11% 27% 100% 1 7 15 50 1% 14% 29% 100%Seagull 25 26297 0 60 162 611 0% 10% 27% 100% 0 27 82 264 0% 10% 31% 100% 0 22 43 123 0% 18% 35% 100%
80 km/h Sections of WA Roads with Dual-carriageway
110 km/h Sections ofForrest Hwy
110 km/h Sections ofBussell Hwy
80 km/h Sections ofMarmion Ave
110 km/h Sections of WA Roads with Dual-carriageway
100 km/h Sections of WA Roads with Dual-carriageway
90 km/h Sections of WA Roads with Dual-carriageway
Adjusted* Crashes per T-intersection, as a
Percentage of Crashes of All Severities
All Reported Crashes(Adjusted* to Traffic Volume of Section of Thru
Road at T-intersection)
Right-angle Crashes(Adjusted* to Traffic Volume of Section of Thru
Road at T-intersection)
Right-thru / Thru-right Crashes(Adjusted* to Traffic Volume of Section of Thru
Road at T-intersection)
Adjusted* Number of Crashes (Averaged over Number of T-
intersections Sampled)
Adjusted* Crashes per T-intersection, as a
Percentage of Crashes of All Severities
Adjusted* Number of Crashes (Averaged over Number of T-
intersections Sampled)
Adjusted* Crashes per T-intersection, as a
Percentage of Crashes of All Severities
Adjusted* Number of Crashes (Averaged over Number of T-
intersections Sampled)
41

APPENDIX D Part 1 – Preliminary Statistics on Individual Seagull Treatment
from C-MARC Study on All WA State Black Spot Treatments 2000-2012
Combined (Chow et al. 2016)
Before After Before After Before After
2000 to 2002 049 Metro MR2 Seagull in median 1826 1826 12 32 0 82000 to 2002 051 Metro MR2 Seagull in median 1826 1826 6 8 2 32000 to 2002 056 Metro MR2 Seagull in median 1826 1826 8 2 4 12000 to 2002 069 Metro MR2 Seagull in median 1826 1826 17 14 5 52000 to 2002 086 Metro MR2 Seagull in median 1826 1826 31 24 10 62000 to 2002 087 Metro MR2 Seagull in median 1826 1826 17 10 5 42000 to 2002 094 Metro MR2 Seagull in median 1826 1826 78 80 24 162000 to 2002 095 Metro MR2 Seagull in median 1826 1826 30 28 9 62000 to 2002 096 Metro MR2 Seagull in median 1826 1826 29 26 9 92000 to 2002 097 Metro MR2 Seagull in median 1826 1826 7 13 2 22000 to 2002 098 Metro MR2 Seagull in median 1826 1826 7 9 1 32000 to 2002 099 Metro MR2 Seagull in median 1826 1826 5 3 3 02000 to 2002 102 Metro MR2 Seagull in median 1826 1826 16 34 4 142000 to 2002 103 Metro MR2 Seagull in median 1826 1826 12 13 2 32000 to 2002 107 Metro MR2 Seagull in median 1826 1826 13 15 3 02000 to 2002 108 Metro MR2 Seagull in median 1826 1826 7 20 0 62000 to 2002 116 Metro MR2 Seagull in median 1826 1826 19 30 8 92000 to 2002 118 Metro MR2 Seagull in median 1826 1826 32 34 8 12
2003 to 2004 045 Metro MR2 Seagull in median 1826 1752 15 14 5 22003 to 2004 069 Metro MR2 Seagull in median 1826 1325 22 9 4 32003 to 2004 073 Metro MR2 Seagull in median 1826 1660 42 46 6 102003 to 2004 074 Metro MR2 Seagull in median 1826 1706 22 14 10 72003 to 2004 087 Rural MR2 Seagull in median 1826 1615 3 1 2 02003 to 2004 096 Rural MR2 Seagull in median 1826 1256 10 4 4 12003 to 2004 111 Rural MR2 Seagull in median 1826 1340 7 3 4 12003 to 2004 112 Rural MR2 Seagull in median 1826 1418 8 13 0 42003 to 2004 202 Metro MR2 Seagull in median 1826 1218 19 4 4 02003 to 2004 228 Metro MR2 Seagull in median 1826 1286 13 1 7 02003 to 2004 262 Metro MR2 Seagull in median 1826 1399 10 3 2 02003 to 2004 282 Metro MR2 Seagull in median 1826 1355 14 13 5 5
2005 to 2006 046 Metro MR2 Seagull in median 1826 1826 22 32 11 102005 to 2006 047 Metro MR2 Seagull in median 1826 1826 12 2 2 12005 to 2006 176 Metro MR2 Seagull in median 1826 1826 7 2 2 02005 to 2006 283 Metro MR2 Seagull in median 1826 1826 13 14 2 52005 to 2006 317 Metro MR2 Seagull in median 1826 1826 12 6 2 32005 to 2006 335 Metro MR2 Seagull in median 1826 1826 30 21 5 42005 to 2006 339 Metro MR2 Seagull in median 1826 1826 18 11 4 2
2007 to 2008 S045 Metro MR2 Seagull in median 1826 1583 5 9 0 42007 to 2008 S047 Metro MR2 Seagull in median 1826 1826 12 4 3 32007 to 2008 S096 Metro MR2 Seagull in median 1826 1826 9 8 2 22007 to 2008 S097 Metro MR2 Seagull in median 1826 1826 9 5 4 02007 to 2008 S164 Metro MR2 Seagull in median 1826 1826 40 31 5 3
2009 to 2010 S374 Metro MR2 Seagull in median 1826 1681 8 4 1 22009 to 2010 S405 Metro MR2 Seagull in median 1826 1706 7 5 1 0
2011 to 2012 S601 Rural MR2 Seagull in median 1826 549 1 0 0 02011 to 2012 S689 Metro MR2 Seagull in median 1826 699 357 245 78 57
Program Region Treatment Type
Site No.
Description Exposure (days) All Reported Crashes (Severity = 1, 2, 3, 4, 5)
Casualty Crashes (Severity = 1, 2, 3)
42
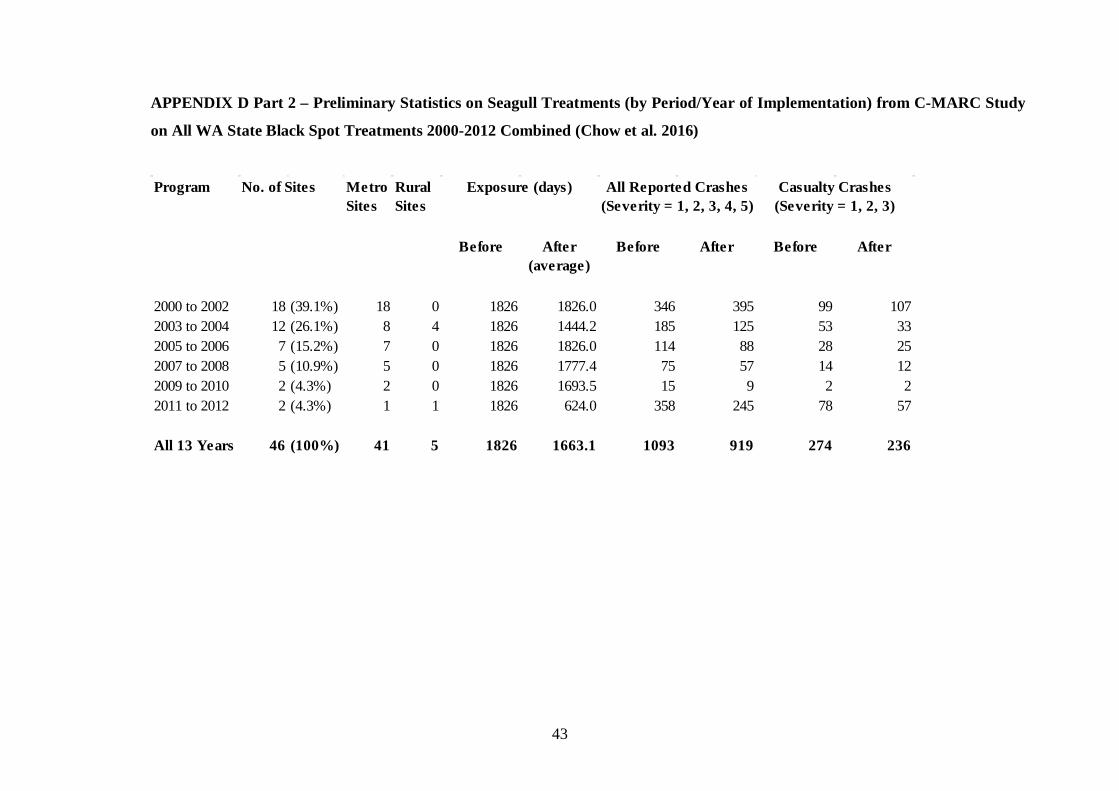
APPENDIX D Part 2 – Preliminary Statistics on Seagull Treatments (by Period/Year of Implementation) from C-MARC Study
on All WA State Black Spot Treatments 2000-2012 Combined (Chow et al. 2016)
Before After (average)
Before After Before After
2000 to 2002 18 (39.1%) 18 0 1826 1826.0 346 395 99 1072003 to 2004 12 (26.1%) 8 4 1826 1444.2 185 125 53 332005 to 2006 7 (15.2%) 7 0 1826 1826.0 114 88 28 252007 to 2008 5 (10.9%) 5 0 1826 1777.4 75 57 14 122009 to 2010 2 (4.3%) 2 0 1826 1693.5 15 9 2 22011 to 2012 2 (4.3%) 1 1 1826 624.0 358 245 78 57
All 13 Years 46 (100%) 41 5 1826 1663.1 1093 919 274 236
Rural Sites
Exposure (days) All Reported Crashes (Severity = 1, 2, 3, 4, 5)
Casualty Crashes (Severity = 1, 2, 3)
Program No. of Sites Metro Sites
43

APPENDIX D Part 3 – Preliminary Results (GEE Poisson “Before and After” Study Design) on Seagull Treatments (All Years
Combined) from C-MARC Study on All WA State Black Spot Treatments 2000-2012 Combined (Chow et al. 2016)
* Increase/reduction in crashes per million vehicles is not statistically significant (p-value > 0.05). + Negative reduction indicates an increase.
Metro Sites
Rural Sites
Exposure Before (days)
Mean Exposure
After (days)
Crashes Before
Crashes After
Estimate (β)
Standard Error
Probability 0 < p < 1
95% C.I. - Lower Bound
95% C.I. - Upper Bound
Incidence Rate Ratio IRR
Crash Reduction
(%)
All Reported Crashesat sites treated with MR2 Seagull Intersectionin 2000 - 2012 WA State Black Spot Programs
41 5 1826 1663.1 1093 919 0.014 0.007 0.047 0.000 0.029 1.015 -1.5% +
Casualty Crashesat sites treated with MR2 Seagull Intersectionin 2000 - 2012 WA State Black Spot Programs
41 5 1826 1663.1 274 236 0.034 0.022 0.123 -0.009 0.078 1.035 -3.5% +*
44