an evolutionary technology having a revolutionary impact · this report defines benefits as...
TRANSCRIPT

Current Retail Checkout Technology: Part III: Comparing Checkout Station Costs and Performance
An Evolutionary technology
having a Revolutionary impact

Comparing Checkout Station Costs and Performance
Kay Seljeseth
CEO, PeoplePos December 2013
Abstract:
The past 20 years has seen a series of technologies and approaches to
retail checkout. The goal: gain competitive advantage by strengthening
business fundamentals and improving the customer experience.
Part III compares the performance and benefits of cashier-based, self-assisted and hybrid
checkout stations, the latest generation of retail payment technology.
This paper helps retail executives, operations managers and store managers:
Identify benefits most relevant to retailers and customers.
Identify units of measurement relevant to each benefit.
Compare performance of each checkout technology in terms of benefits and costs.
Use basic performance and cost metrics to evaluate current and emerging checkout
technology in their own business.

Comparing Checkout Station Costs and Performance
This white paper is published by PeoplePos (UK) Ltd.
© PeoplePos Ltd. 2013. All rights reserved.
No part of this publication may be reproduced, copied or transmitted
in any form or by any means, or stored in a retrieval system of any
nature, without the prior permission of PeoplePos Ltd.
An application for permission to reproduce all or part of the copyright
material shall be made to PeoplePos Ltd using the contact address
stated on the website: www.hybridcheckout.com.
Although the greatest care has been taken in the preparation and
compilation of this white paper, no liability or responsibility of any
kind (to the extent permitted by law), including responsibility for
negligence is accepted by PeoplePos Ltd, its servants, partners,
resellers or agents.
For more information about PeoplePos and its products, please send mail
to [email protected] or go to www.hybridcheckout.com.

Comparing Checkout Station Costs and Performance
Current Retail Checkout Technology: Part III Page 1
Current Retail Checkout Technologies
Part I: Stakeholder Pains, Concerns and Priorities
Part II: Comparing Checkout Station Design and Capabilities
Part III: Comparing Checkout Station Costs and Performance
Technology that Enables Competitive Advantage
The retail grocery business has always operated in
a ferociously competitive environment. With
typically slim margins, retailers are likely to
seek any possible advantage to reduce labor,
capital and operations costs.
The past 20 years has seen a series of
technologies and approaches to retail
checkout. Its goal: Getting competitive
advantage by strengthening business
fundamentals and improving the customer experience.
Business results and customer acceptance of the self-assist checkout approach have been mixed. The promise of
hefty ROI has not been met.
Anecdotal, often conflicting reports have been a big factor in descriptions of checkout technology performance.
Clearly defined metrics can provide a bit of clarity. That’s what this paper is about—clarity. Different types of
checkout technology provide different benefits and require different resources, as measured in time, money,
training and floor space.
This paper compares the performance and benefits of cashier-based, self-assisted and hybrid checkout stations,
the latest generation of retail payment technologies.
This is the third in a three-part series of white papers that focus on current retail checkout technology and the
benefits they provide to store retailers and customers. This paper helps retail executives, operations managers
and store managers:
Identify benefits most relevant to retailers and customers.
Identify units of measurement relevant to each benefit.
Compare performance of each checkout technology in terms of benefits and costs.
Use basic metrics to evaluate current or proposed checkout technology in their own business.
This paper presents information gathered from academic research papers, trade press articles and surveys of
retail store employees and customers.

Comparing Checkout Station Costs and Performance
Current Retail Checkout Technology: Part III Page 2
Checkout Technology Costs, Benefits and Business Value
Ultimately, checkout technology must be judged on two aspects of performance—business fundamentals and
customer satisfaction. This paper uses basic concepts of financial performance to organize research results
gathered in this project.
Business Goals and Technology Performance Retailers want a simple answer to an important question: Can any checkout technology improve revenues, cut
costs or provide operational flexibility, support a business’ bottom line and promote customer loyalty? The
answer is yes.
Which store-wide business goals can checkout technologies help achieve? A successful checkout solution must help achieve specific business goals. Critical success factors enable
businesses to connect business-wide goals to technology performance. This report starts with three business
goals:
Increase revenue
Reduce or avoid costs
Improve customer satisfaction and loyalty
Usually, performance and time criteria (“improve in-store revenue by 15 percent during the next fiscal year”) are
part of these goals. These business-specific qualifiers are out of the scope of this report. But can any of the retail
checkout technologies described in Part II enable these goals? There’s no way to know until you choose how to
measure performance. For that, you need indicators.
How can we measure checkout technology performance?
Each successful business case must identify and measure specific types of performance that will support business
goals. Key performance indicators connect the goals and technology performance. Selected KPIs used in this
report include:
Average scanning time per item
Various average costs per 100 items scanned
Maximum throughput (items per square foot of floor space per hour)
More efficient use of labor and technology resources (measured as improved performance or lower cost or
other resources per unit time, floor space or other resource)
Self-assist checkout units per checkout assistant
These indicators measure system capabilities, process efficiency, labor time and effort, and many other functional
aspects of retail checkout. The units of measurement of these indicators are parameters in Appendix A,
“Checkout Technology Cost Analysis Model” in this report.

Comparing Checkout Station Costs and Performance
Current Retail Checkout Technology: Part III Page 3
Checkout Technology Benefits and Costs This report defines benefits as measurable results that promote business goals and indicate process
improvements. So, in this report, benefits are:
Limited to that which can be measured. This report links intangibles such as general customer satisfaction
to achieving specific performance-related improvements in the checkout process. Customer surveys identify
these process improvements as important to customers.
Enabled by more than technology. Process improvements are enabled by the design and capabilities of the
technology and the capabilities and attitudes of human operators.
Often presented as equivalents (percent or per 100 items scanned) to offset different scales of store
operation.
But what benefits (process improvements) do customers and retailers expect from checkout technologies?
Although they value different aspects of the checkout process, there’s an interesting area of overlap in their
expectations.
Which aspects of the purchase experience do customers value the most?
Survey results summarized in Part I of our white paper series show that customers want a retail checkout
experience to include:
Speed, the promise of a faster checkout and less time spent waiting in queues. Customer perception of rapid
checkout may differ from actual system performance. However one defines rapid checkout, this indicator
can be measured as seconds per wait or seconds per item scanned.
Simplicity, a simple, no-hassle process that enables customers to master the entire checkout process. This
can be judged by observing the time and effort customers need to learn the self-assisted checkout process.
Reliability, the consistent performance of computerized checkout process and devices. There are no
standard units of measurement for this important indicator. Reliability will vary a lot by the specific store
and management environment. So, the best metric is customer feedback, which provides direct customer
evidence of the user experience.
Positive surprise, an overall experience summarized by, “My, that was easy!”
This mix of hard- and easy-to-measure indicators shows up again on the retailer’s wish list of checkout technology
capabilities.
Which types of evidence are most persuasive to retailers?
Not surprisingly, retailers look to computerized checkout solutions as a means to improve business fundamentals
of their store. They look for:
Additional revenue
Lower costs (costs reduced or avoided)
Greater operational flexibility
Retailers also want checkout solutions that can help improve their overall competitive advantage. This
combination of operational efficiency and customer loyalty includes some hard-to-measure elements.

Comparing Checkout Station Costs and Performance
Current Retail Checkout Technology: Part III Page 4
Surveys of grocery customers indicate that listening to customer preferences and treating customers respectfully
in the checkout process are important indicators of good customer service. As the performance comparisons will
show, different checkout technologies offer different ways to meet these expectations.
Specific Costs and the Big Picture
There are two ways to identify and measure relevant checkout-related costs: transaction cost snapshots and
project-or life cycle-related costs. Checkout technology is computer technology inserted into a retail checkout
station. It’s useful to use total cost of ownership, a life-cycle cost analysis method used in the software business,
to compare cost profiles of different checkout te3chnologies.
The comparisons described later in this paper include design, transaction, process, system and labor costs.
Appendix B, “How to Use the Cost Analysis Tool,” includes all of these performance and cost indicators. This
appendix provides a step-by-step guide and a per-transaction approach to using cost data to evaluate checkout
technology options.
Comparing Checkout Station Costs and Performance
Current Retail Checkout Technology: Part III Page 5
Benefit and Cost Comparisons
This section provides direct design, process and cost comparisons of self-assisted, cashier-assisted and hybrid
checkout technologies.
Retail Checkout Technology Benefits This report defines benefits in terms of performance, the ability of a checkout process to provide maximum
throughout and customer satisfaction with minimum total resource requirements. The research on which this
paper is based includes survey and modeling evidence that answers important resource- and capabilities-related
questions.
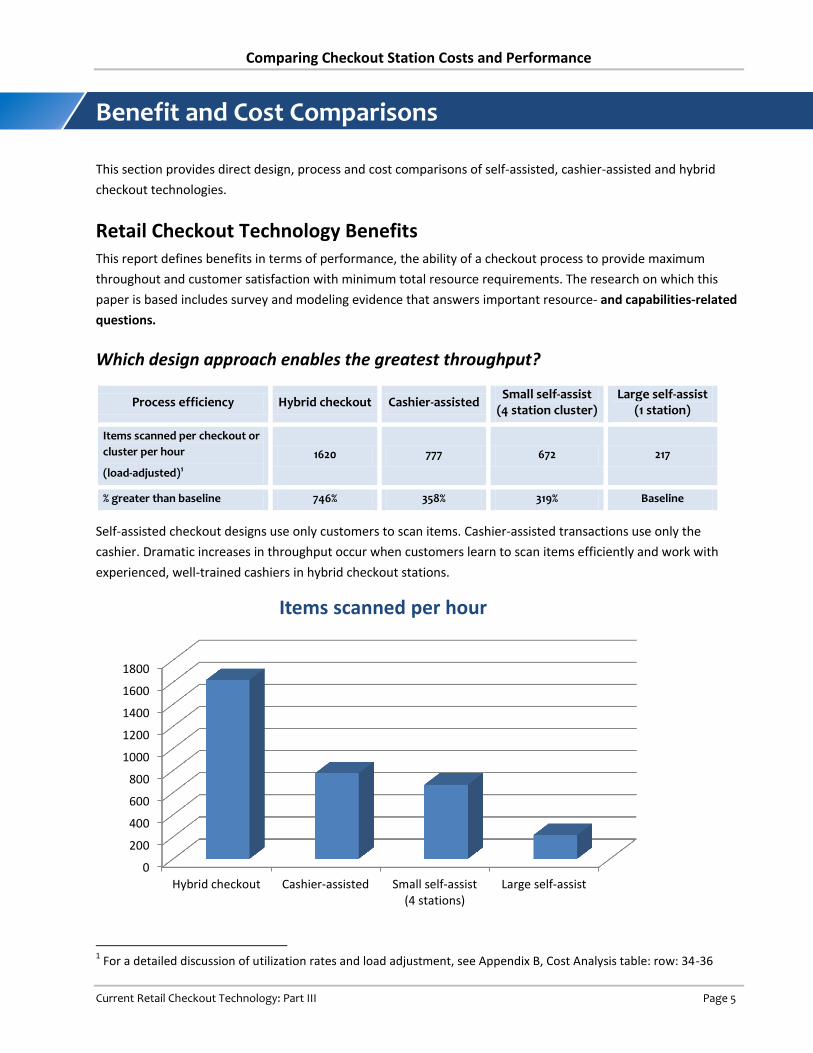
Which design approach enables the greatest throughput?
Self-assisted checkout designs use only customers to scan items. Cashier-assisted transactions use only the
cashier. Dramatic increases in throughput occur when customers learn to scan items efficiently and work with
experienced, well-trained cashiers in hybrid checkout stations.
1 For a detailed discussion of utilization rates and load adjustment, see Appendix B, Cost Analysis table: row: 34-36
0
200
400
600
800
1000
1200
1400
1600
1800
Hybrid checkout Cashier-assisted Small self-assist(4 stations)
Large self-assist
Items scanned per hour
Process efficiency Hybrid checkout Cashier-assisted Small self-assist
(4 station cluster) Large self-assist
(1 station)
Items scanned per checkout or
cluster per hour
(load-adjusted)1
1620 777 672 217
% greater than baseline 746% 358% 319% Baseline

Comparing Checkout Station Costs and Performance
Current Retail Checkout Technology: Part III Page 6
Which checkout station design requires the least floor space?
Design efficiency Large self-assist
(1 station) Cashier-assisted Hybrid checkout
Small self-assist (4 station cluster)
Floor space (square meters
per station) 5.1 9.7 12.5 12.8
% less space than baseline 60% 24% 2% Baseline
These results assume that the less floor space required to generate store revenue, the better. The larger footprint
of the cashier operated and hybrid checkout station is no surprise. Both models must make room for both the
cashier and the customer and require larger loading and packing areas, which enable higher overall throughput.
Using self-assist checkout stations in stores where the checkout volume is moderate and floor space is very
limited might be a sensible option.
0
2
4
6
8
10
12
14
Large self-assist Cashier-assisted Hybrid checkout Small self-assist(4 stations)
Floor Space (square meters per station)
Comparing Checkout Station Costs and Performance
Current Retail Checkout Technology: Part III Page 7
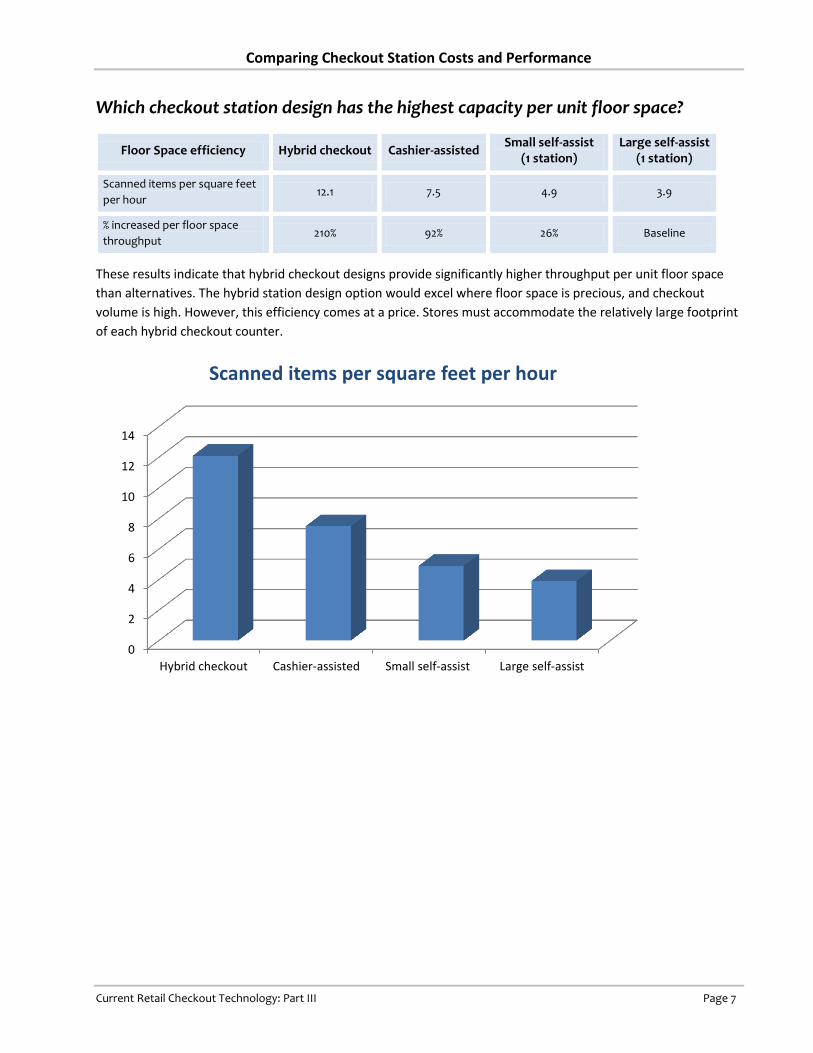
Which checkout station design has the highest capacity per unit floor space?
Floor Space efficiency Hybrid checkout Cashier-assisted Small self-assist
(1 station) Large self-assist
(1 station)
Scanned items per square feet
per hour 12.1 7.5 4.9 3.9
% increased per floor space
throughput 210% 92% 26% Baseline
These results indicate that hybrid checkout designs provide significantly higher throughput per unit floor space
than alternatives. The hybrid station design option would excel where floor space is precious, and checkout
volume is high. However, this efficiency comes at a price. Stores must accommodate the relatively large footprint
of each hybrid checkout counter.
0
2
4
6
8
10
12
14
Hybrid checkout Cashier-assisted Small self-assist Large self-assist
Scanned items per square feet per hour
Comparing Checkout Station Costs and Performance
Current Retail Checkout Technology: Part III Page 8
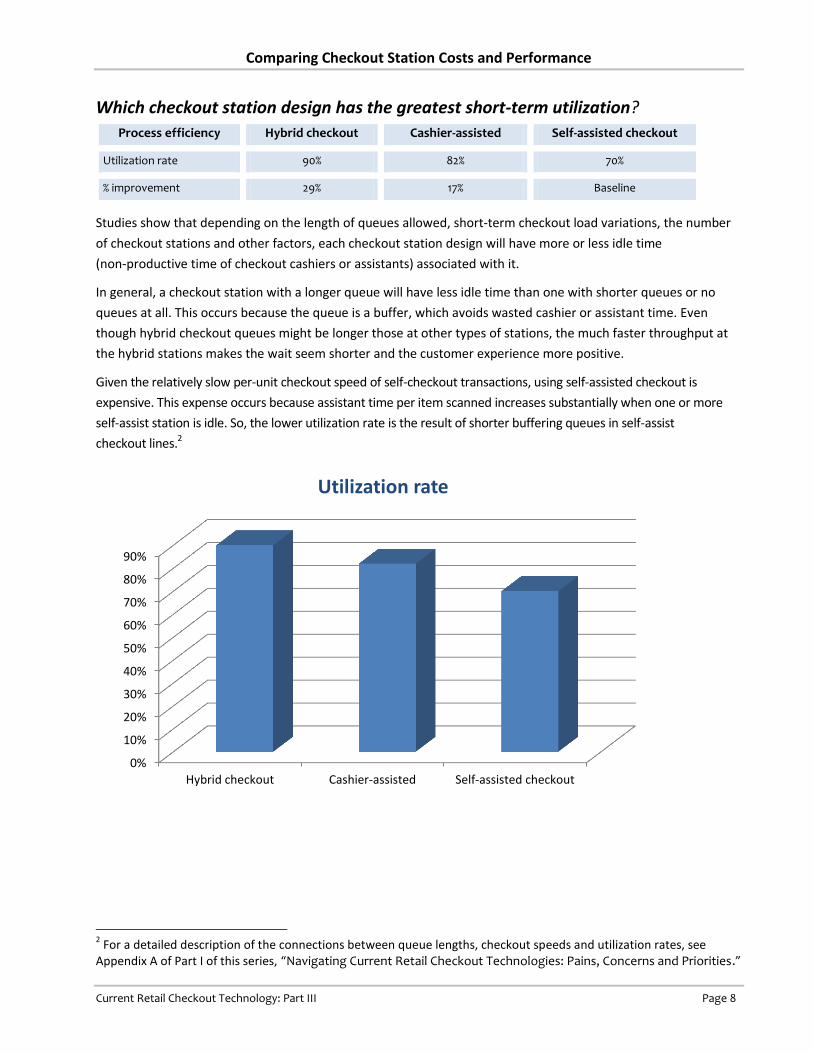
Which checkout station design has the greatest short-term utilization?
Process efficiency Hybrid checkout Cashier-assisted Self-assisted checkout
Utilization rate 90% 82% 70%
% improvement 29% 17% Baseline
Studies show that depending on the length of queues allowed, short-term checkout load variations, the number
of checkout stations and other factors, each checkout station design will have more or less idle time
(non-productive time of checkout cashiers or assistants) associated with it.
In general, a checkout station with a longer queue will have less idle time than one with shorter queues or no
queues at all. This occurs because the queue is a buffer, which avoids wasted cashier or assistant time. Even
though hybrid checkout queues might be longer those at other types of stations, the much faster throughput at
the hybrid stations makes the wait seem shorter and the customer experience more positive.
Given the relatively slow per-unit checkout speed of self-checkout transactions, using self-assisted checkout is
expensive. This expense occurs because assistant time per item scanned increases substantially when one or more
self-assist station is idle. So, the lower utilization rate is the result of shorter buffering queues in self-assist
checkout lines.2
2 For a detailed description of the connections between queue lengths, checkout speeds and utilization rates, see
Appendix A of Part I of this series, “Navigating Current Retail Checkout Technologies: Pains, Concerns and Priorities.”
0%
10%
20%
30%
40%
50%
60%
70%
80%
90%
Hybrid checkout Cashier-assisted Self-assisted checkout
Utilization rate
Comparing Checkout Station Costs and Performance
Current Retail Checkout Technology: Part III Page 9
Cost Comparisons Although ideal cost structures are not the same for all store managers or owners, several important patterns
emerge from data analysis. Each of these patterns addresses specific operational and process efficiency concerns.
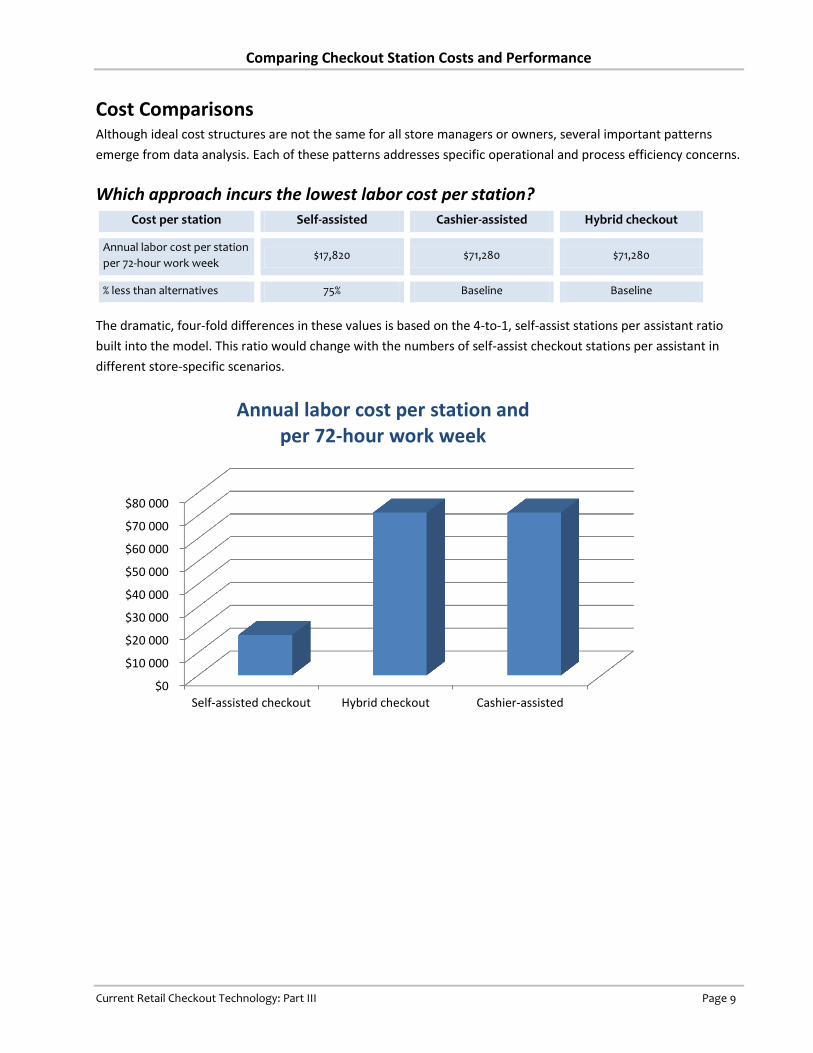
Which approach incurs the lowest labor cost per station?
Cost per station Self-assisted Cashier-assisted Hybrid checkout
Annual labor cost per station
per 72-hour work week $17,820 $71,280 $71,280
% less than alternatives 75% Baseline Baseline
The dramatic, four-fold differences in these values is based on the 4-to-1, self-assist stations per assistant ratio
built into the model. This ratio would change with the numbers of self-assist checkout stations per assistant in
different store-specific scenarios.
$0
$10 000
$20 000
$30 000
$40 000
$50 000
$60 000
$70 000
$80 000
Self-assisted checkout Hybrid checkout Cashier-assisted
Annual labor cost per station and per 72-hour work week

Comparing Checkout Station Costs and Performance
Current Retail Checkout Technology: Part III Page 10
Which approach incurs the lowest labor cost per items scanned?
Transaction cost Hybrid checkout Large self-assist
(1 station) Cashier-assisted
Small self-assist
(4 station cluster)
Annual labor cost per station
per 72-hour work week per
100 items scanned
$1.18 $2.19 $2.45 $2.83
% reduced labor cost 58% 23% 13% Baseline
This labor cost indicator reflects labor costs needed to scan 100 items and contribute to the store’s total annual
revenue. The almost eight-fold increase in throughput capabilities of the hybrid station easily exceeds the
four-fold labor costs of hybrid and cashier-assisted station designs.
$0,00
$0,50
$1,00
$1,50
$2,00
$2,50
$3,00
Hybrid checkout Large self-assist Cashier-assisted Small self-assist(4 stations)
Annual labor cost per station per 72-hour work week per 100 items scanned
Comparing Checkout Station Costs and Performance
Current Retail Checkout Technology: Part III Page 11
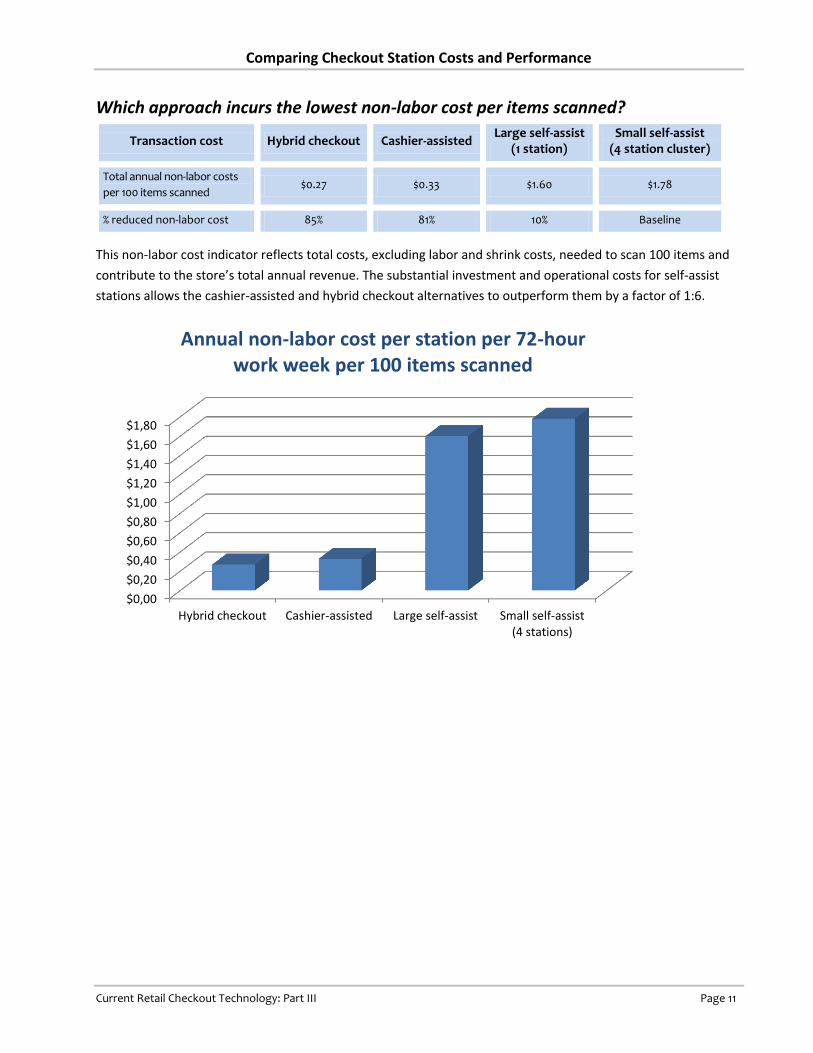
Which approach incurs the lowest non-labor cost per items scanned?
Transaction cost Hybrid checkout Cashier-assisted Large self-assist
(1 station) Small self-assist
(4 station cluster)
Total annual non-labor costs
per 100 items scanned $0.27 $0.33 $1.60 $1.78
% reduced non-labor cost 85% 81% 10% Baseline
This non-labor cost indicator reflects total costs, excluding labor and shrink costs, needed to scan 100 items and
contribute to the store’s total annual revenue. The substantial investment and operational costs for self-assist
stations allows the cashier-assisted and hybrid checkout alternatives to outperform them by a factor of 1:6.
$0,00
$0,20
$0,40
$0,60
$0,80
$1,00
$1,20
$1,40
$1,60
$1,80
Hybrid checkout Cashier-assisted Large self-assist Small self-assist(4 stations)
Annual non-labor cost per station per 72-hour work week per 100 items scanned

Comparing Checkout Station Costs and Performance
Current Retail Checkout Technology: Part III Page 12
Which station design has the lowest annual electricity costs?
System cost Large self-assist
(1 station) Cashier-assisted Hybrid checkout
Small self-assist (4 station cluster)
Electricity cost per year and
per checkout station (4x) $260 $265 $320 $920
% reduced electricity cost 72% 71% 65% Baseline
Even with additional costs of electronic devices for a second operator (the customer), hybrid checkout stations
offer electricity cost advantages. Self-assist checkout stations require computer and peripheral devices in larger
numbers to enable specific checkout capacity. These requirements result in increased power consumption.
$0
$100
$200
$300
$400
$500
$600
$700
$800
$900
$1 000
Large self-assist Cashier-assisted Hybrid checkout Small self-assist(4 stations)
Electricity cost per year and per checkout station (4x)

Comparing Checkout Station Costs and Performance
Current Retail Checkout Technology: Part III Page 13
Which type of station design has the lowest annual equipment costs?
System cost Cashier-assisted Large self-assist
(1 station) Hybrid checkout
Small self-assist (4 station cluster)
Annual equipment cost per
station (Amortized from
purchase value and includes
equipment operation costs)
$9,639 $13,003 $16,397 $44,788
% higher cost Baseline 35% 70% 365%
The cashier-assisted checkout design offers the lowest cost per station of the alternatives. It is a viable option for
stores with a low number of items scanned per unit of time requirement. It also is a good choice for stores that
want more efficient operations but cannot directly reduce labor costs. From the equipment cost perspective,
installing self-assist stations is relatively expensive and may be considered a high-risk move. Most but not all of
the costs highlighted in Appendix A, “Checkout Technology Cost Analysis Model,” also appear in this section.
Please check Appendix A, for complete cost information.
$0
$10 000
$20 000
$30 000
$40 000
$50 000
Cashier-assisted Large self-assist Hybrid checkout Small self-assist(4 stations)
Annual equipment cost per station (includes equipment operation costs)

Comparing Checkout Station Costs and Performance
Current Retail Checkout Technology: Part III Page 14
Checkout Technology Total Cost of Ownership The TCO accounting method is a helpful way to discover what a business’ investment really buys. In the case of
retail checkout technology, TCO provides retailers with two very different stories.
On a per-station basis, cashier-assisted and hybrid checkout alternatives are almost three times as expensive as
self-assist station designs. But from the standpoint of process efficiency (as measured by throughput), self-assist
checkout is 3.5 times as expensive as the hybrid checkout stations.
$0,00
$1,00
$2,00
$3,00
$4,00
$5,00
$6,00
$7,00
Hybrid checkout Cashier-assisted Large self-assist Small self-assist(4 stations)
Total Cost per 100 items scanned
Annual costs Small self-assist
(4-station cluster) Large self-assist
(1 station) Cashier-assisted
Hybrid checkout
TCO per station $116,068 $30,823 $80,919 $87,677
TCO per 100 items scanned $6.50 $5.68 $2.94 $1.60
TCO as % of per-item price 2.89% 2.52% 1.31% 0.71%

Comparing Checkout Station Costs and Performance
Current Retail Checkout Technology: Part III Page 15
Conclusions and Recommendations
Surveys, mathematical modeling and direct measurements made in retail grocery stores provided the source
materials for this study and its two companion white papers. The data and the accompanying analysis provide
these conclusions:
Hybrid checkout design is overall best performer. Hybrid checkout stations outperform self-assist checkout
alternatives in most areas. In fact, there appears to be no cost-related argument for using self-checkout
rather than hybrid checkout in any scenario discovered during this study. Readers are encouraged to use the
cost analysis tool in Appendix A of this report to challenge this claim.
Hybrid checkout saves stores money. When compared to a cashier-assisted checkout line, a hybrid checkout
line typically reduces the total checkout costs by 40 to 50 percent.
Self-assist checkout is least efficient, profitable. Hybrid and cashier-assisted checkout solutions out-perform
their self-assisted alternatives in terms of throughput and profitability.
Self-assist checkout more costly. When used as an alternative to cashier-assisted and hybrid checkout
solutions, self-assist checkout increases total cost by 200 to 400 percent.
Use self-assist checkout to improve customer service. Self-checkout stations should be considered a service
option for specific customer groups and shopping patterns. This claim is supported by many retailers in
surveys and interviews.
Cashier-assisted checkout is still best option for some. Regardless of a store’s checkout efficiency, small
stores with limited checkout volume and a small staff might benefit from using one or two cashier-assist
checkout stations.
Unmanned self-assist stations help cut costs. Still, using an unmanned self-assist checkout station incurs
total costs about twice those of a hybrid checkout station.
Investment and equipment are biggest self-assist costs. The fundamental cost challenge of self-assist
checkout stations lies in its high investment and equipment operations costs. Also, the less effective self-
assist checkout process makes the self-assist checkout concept less competitive. Improving self-assist
checkouts to become cost competitive appears to be very difficult.
Cost analysis tool enables store-specific evidence. Readers considering acquiring hybrid checkout solutions
should consider using the cost analysis tool described in Appendices A and B of this report to gauge its
relevance and potential effectiveness in their own operations.

Comparing Checkout Station Costs and Performance
Current Retail Checkout Technology: Part III Page 16
Cost Comparison chart
The below chart shows the cost per 100 items scanned for the different type of checkouts. The lines are jagged
because adding new checkout stations (or four station SCO clusters) will increase the cost per item scanned until
the stations are fully utilized. Each step upwards in cost represents an added checkout station.
NOTE: The “SCO (Large)” line (red) is based on using four station clusters serviced by one assistant.

Comparing Checkout Station Costs and Performance
Current Retail Checkout Technology: Part III Page 17
Cashier/Assistant and Checkout Station count
The below chart shows the number of cashiers/assistants required to serve a number of items to be scanned per
hour for each checkout type.
NOTE: The “SCO (Large)” line (blue) is based on having a four station cluster serviced by one assistant.

Comparing Checkout Station Costs and Performance
Current Retail Checkout Technology: Part III Page 18
Appendix A: Checkout Technology Cost Analysis Tool
This appendix provides the data and mathematical model on which the content of this paper is based. The white
fields with a thin border in the table “Cost Element per unit / figure” are value input fields, which may be changed
to adjust the cost analysis that reflects specific store and business environments. Use this tool to measure the
relevance and effectiveness that different checkout station designs might have in your business.
NOTE: White fields in the following table are parameter input fields. Change the value in these fields to control the cost
analysis results.

Comparing Checkout Station Costs and Performance
Current Retail Checkout Technology: Part III Page 19
# Cost element per unit / figure Small SCO Large SCO CCO HCO
6 Floor space - Length / Width (cm) 200 320 420 500
7 Floor space - Depth (incl. Customer space / cm) 160 160 230 250
8 Area square meters 3,2 5,1 9,7 12,5
9 Area square feets 34,4 55,0 103,8 134,4
10 Floor space cost per year $516 $826 $1 558 $2 016
11 Electricity cost per year and per area occupied $138 $220 $415 $538
12 Electricity cost per year and per checkout unit $230 $260 $265 $320
14 Purchase Counter/Station (Base unit / Peripherals / IT) $12 000 $16 000 $8 000 $14 000
15 Purchase Card Payment terminal $2 000 $2 000 $1 000 $1 000
16 Purchase Cash Management unit $8 000 $8 000 $5 000 $8 000
17 Installation cost $2 000 $2 500 $2 000 $2 500
18 Cost per unit $24 000 $28 500 $16 000 $25 500
19 Annual cost (interest and depreciation) $6 313 $7 497 $2 901 $4 624
21 Annual cost software / license / other $1 000 $1 000 $1 000 $5 000
22 Annual cost cash management $2 000 $2 000 $2 500 $2 500
23 Annual cost cleaning, maintenance and service $1 000 $1 200 $1 000 $1 400
25 Annual non-labor cost per checkout $11 197 $13 003 $9 639 $16 397
27 Average time per sale completed (seconds) 120 290 95 50
28 Avg. time per item registered/scanned (seconds) 15,0 11,6 3,8 2,0
30 Maximum items scanned per year 898 560 1 161 931 3 546 947 6 739 200
31 Maximum items scanned per hour 240 310 947 1 800
32 Maximum items scanned per square feet / hour 7,0 5,6 9,1 13,4
34 Load adjusted items scanned per year 628 992 813 352 2 908 497 6 065 280
35 Load adjusted items scanned per hour 168 217 777 1 620
36 Load adjusted items scanned per square feet / hour 4,9 3,9 7,5 12,1
38 Non-labor cost per 100 scanned items (Max util.) $1,25 $1,12 $0,27 $0,24
39 Non-labor cost per 100 scanned items (Utilization adj.) $1,78 $1,60 $0,33 $0,27
41 Shrink/loss cost per 100 scanned items $1,89 $1,89 $0,16 $0,16
43 Annual labor cost per full day working hours $71 280 $71 280 $71 280 $71 280
44 Checkout units per employee 4,0 4,0 1,0 1,0
46 Annual labor cost per checkout $17 820 $17 820 $71 280 $71 280
48 Labor cost per 100 scanned items (max utilization) $1,98 $1,53 $2,01 $1,06
49 Labor cost per 100 scanned items (load adjusted) $2,83 $2,19 $2,45 $1,18
51 Annual cost per checkout unit $29 017 $30 823 $80 919 $87 677
53 Total cost per 100 scanned items (max utilization) $5,12 $4,54 $2,44 $1,46
54 Total cost in percent of item price (max util.) 2,28 % 2,02 % 1,08 % 0,65 %
56 Total cost per 100 scanned items $6,50 $5,68 $2,94 $1,60
57 Total cost in percent of item price 2,89 % 2,52 % 1,31 % 0,71 %
58 Additional cost in percent 305,68 % 254,30 % 83,38 % 0,00 %
60 Cost reduction average US Supermarket $0 $59 534 $257 579 $354 192
61 Increase in Profit - percent 0,00 % 0,37 % 1,58 % 2,18 %
Comparing Checkout Station Costs and Performance
Current Retail Checkout Technology: Part III Page 20
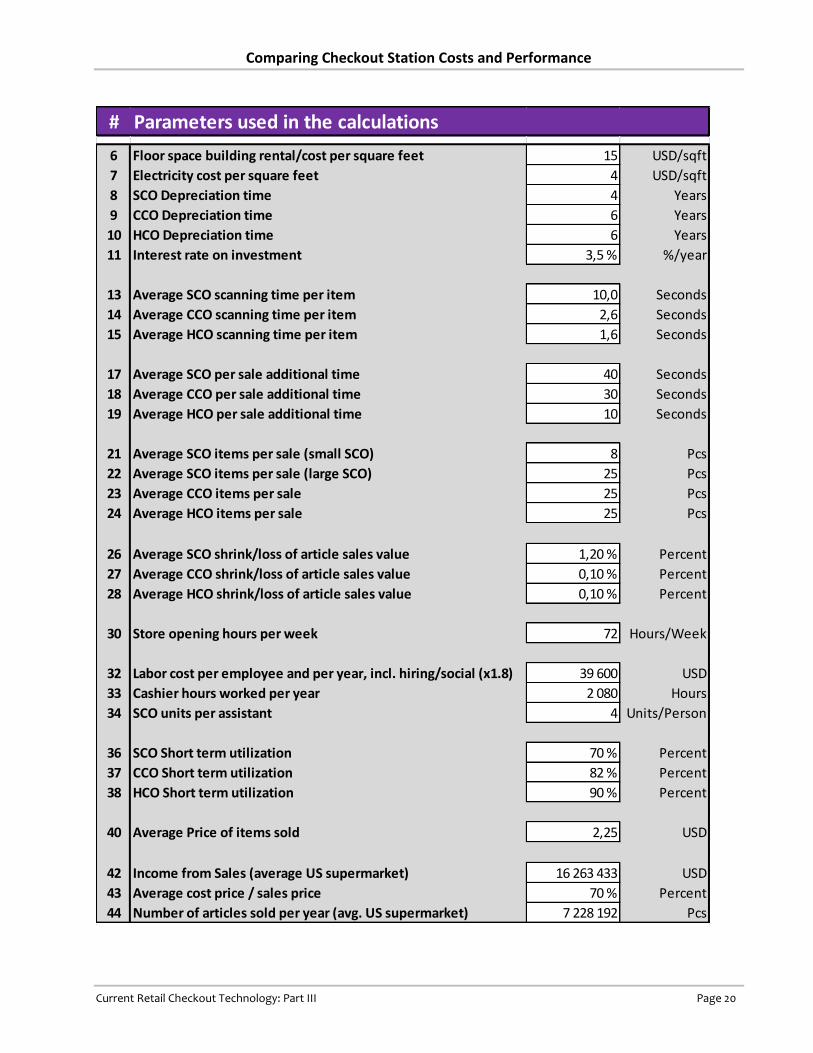
# Parameters used in the calculations
6 Floor space building rental/cost per square feet 15 USD/sqft
7 Electricity cost per square feet 4 USD/sqft
8 SCO Depreciation time 4 Years
9 CCO Depreciation time 6 Years
10 HCO Depreciation time 6 Years
11 Interest rate on investment 3,5 % %/year
13 Average SCO scanning time per item 10,0 Seconds
14 Average CCO scanning time per item 2,6 Seconds
15 Average HCO scanning time per item 1,6 Seconds
17 Average SCO per sale additional time 40 Seconds
18 Average CCO per sale additional time 30 Seconds
19 Average HCO per sale additional time 10 Seconds
21 Average SCO items per sale (small SCO) 8 Pcs
22 Average SCO items per sale (large SCO) 25 Pcs
23 Average CCO items per sale 25 Pcs
24 Average HCO items per sale 25 Pcs
26 Average SCO shrink/loss of article sales value 1,20 % Percent
27 Average CCO shrink/loss of article sales value 0,10 % Percent
28 Average HCO shrink/loss of article sales value 0,10 % Percent
30 Store opening hours per week 72 Hours/Week
32 Labor cost per employee and per year, incl. hiring/social (x1.8) 39 600 USD
33 Cashier hours worked per year 2 080 Hours
34 SCO units per assistant 4 Units/Person
36 SCO Short term utilization 70 % Percent
37 CCO Short term utilization 82 % Percent
38 HCO Short term utilization 90 % Percent
40 Average Price of items sold 2,25 USD
42 Income from Sales (average US supermarket) 16 263 433 USD
43 Average cost price / sales price 70 % Percent
44 Number of articles sold per year (avg. US supermarket) 7 228 192 Pcs

Comparing Checkout Station Costs and Performance
Current Retail Checkout Technology: Part III Page 21
Appendix B: How to Use the Cost Analysis Tool The information in this report and its companion white papers is designed to inform and help you make informed
choices of modern checkout solutions. Appendix A provides a copy of the tool that provides data on which this study is
based. This appendix explains each part of the tool and how to put its information and analytical methods to work in
your retail operations.
The cost analysis tool is a Microsoft® Excel worksheet provided in Appendix A. It is designed for your use. If you cannot
access or operate it, contact PeoplePos, Limited at www.hybridcheckout.com or [email protected] for a new
copy.
Cost Analysis (Columns B through G)
Row # Description
6-10 Annual floor space costs
1. In Rows 6 and 7, specify the Length and Width values in centimeters for the area of each checkout station type.
Set the values based on actual floor space occupied, available layout information or best estimates. Be sure to include
additional areas that are needed to operate and use each type of checkout station in the store. This might include
space for:
Customer queuing
Customer loading
Customer scanning
Customer packing
Payment stations
Required aisle areas
Work space for assistants and cashier
Gates
Free-space
2. Set the parameter, Floor space building rental/cost per square foot. The values in Rows 8 and 9 are the calculated area occupied by each of the checkout stations in square feet and square meters, respectively.
The value in Row 10 is the calculated floor space cost per checkout station per year.
11 Annual electricity costs per area occupied
1. Set the parameter, Electricity cost per square feet.
The value in Row 11 is the annual electricity cost per area occupied per station.
12 Annual electricity cost per checkout station
Use this space to enter precise electricity cost values, based on actual power consumption for each type of checkout
station.
1. In Row 12, set the parameter, Electricity costs per year per checkout unit.
Electricity costs for each type of checkout station might vary a lot.
2. Add values that reflect each type of station in the store to give a more accurate comparison.
The actual power consumption per station can be obtained from the manufacturer.
Suggested values: Small self-assist: $230, Large self-assist: $260, Cashier-assisted: $265 and Hybrid: $320.
These values are based on the following factors: $0.12 per kWh, powered-on duration: 100 hours per week, power
consumption per unit: 365 to 510 watts.

Comparing Checkout Station Costs and Performance
Current Retail Checkout Technology: Part III Page 22
14-19 Annual interest and depreciation costs
1. Set the parameters: (Type) Depreciation time and interest rate on investment.
The purchase cost is depreciated over the expected useful life of the checkout stations. The life expectancy may
vary between the checkout station designs.
2. Specify the average purchase value and installation costs of the main checkout station.
Also add value and costs of attached card payment terminals and cash management units.
Ensure that all the purchase and installation costs are included.
Add any “other” costs to the main unit in Row 14 or installation costs in Row 17.
Keep in mind that payment units in self-assist stations might be more costly than those in cashier-
operated units.
Signature devices, gates or security installations might also be required for each payment type.
Suggested values: Use the cost analysis tool defaults
The cost per unit in Row 18 is the total purchase and installation cost, which is derived from data in Rows 14 to 17.
The value, Annual cost (...) in Row 19 is the annually amortized cost of the total purchase and installation costs.
21-23 Annual costs
1. Set the parameter, Annual cost …
Add annual software, IT services, license, maintenance, cleaning, unit operation/SLA contract cost or best
estimates for the operation of each checkout design in Rows 21 to 23.
Include all costs related to checkout station operations.
Exclude any labor-related costs of cashiers and assistants. These costs are included separately below.
25 Annual non-labor costs per checkout station
The tool calculates this value, which includes annual equipment and operational costs per station as specified above.
Exclude cashier and self-assist checkout assistant labor costs.
27 Average time per sale completed (seconds)
1. Set the parameter, Average (type) scanning time per item.
2. Set the parameter, Average (type) per sale additional time.
3. Set the parameter, Average (type) items per sale.
This value indicates the time in seconds spent completing each sale at each type of checkout station, regardless of
the basket size.
28 Average time per item registered/scanned (seconds)
The model calculates this value, which is based on the total time each sale requires and the average basket size. The
value is calculated for each type of the checkout station.
The value indicates the maximum throughput that each checkout station design might achieve. The result has a major
effect on the totals in the cost-analysis model, as it’s closely related to the per-transaction cost for each checkout
type. In general, shorter times indicate lower costs.
30-32 Maximum items scanned per year / hour / area
The model calculates the annual value, which shows the theoretical maximum of items that can be processed through
each type of checkout station during operating hours.
The per-year value is then converted to per-hour and per-square-foot values
The values in this section cannot be achieved in real life. They should not be used for capacity planning.

Comparing Checkout Station Costs and Performance
Current Retail Checkout Technology: Part III Page 23
34-36 Load-adjusted items scanned per year / hour / area
1. Set the parameters (type) Short-term utilization.
2. The model calculates the per-year value (Row 34), which indicates the annual maximum throughput. The per-
year value is converted to per-hour (Row 35) and per-square-foot (Row 36) values. When throughput per station,
throughput per hour or limited available floor space to enable given levels of checkout capacity are a concern,
these values may be used for peak-capacity planning.
3. A checkout line or group of checkout units will have a utilization level that indicates to which extent the cashier or
assistant is actually busy scanning items and completing sales. If the cashier is not busy working we have “spare”
time. If this spare time can be used for other tasks in the store, the time may not be considered lost. This kind of
time then becomes “flexible time” and is typically varying from loads during parts of the day where the number of
visitors is mostly changing in a predictable manner.
4. Spare time may also occur when the cashier or assistant is waiting for shorter time spans in the checkout or SCO
area. This time may not be used for other tasks and is “lost time” as being non-productive in general. This lost time
increases the transaction cost in the checkout line/area substantially.
5. Depending on the length of queues allowed, short term checkout load variations and other factors and number of
checkouts each checkout station type will have more or less “lost time” associated with it. In general a checkout line
with a longer queue will have less lost time than a checkout with no or shorter queues because the queue is a buffer
to avoid wasting cashier/assistant time.
6. We know from queue theory that a SCO checkout with no queue or a very short queue will get a lower utilization
than for example HCO checkouts that due to an increased checkout speed may operate with longer queues without
impacting the customer experience.
7. An example: Using an assistant servicing only one or two customers during major parts of the day in a self-service
area with four or six stations and a comparable slow per unit checkout speed is expensive as the time spent by the
assistant per item registered is increased substantially when one or more SCO station is idle. The lowered utilization
is a result of the requirement to have less buffering queues in the SCO checkout line.
8. The value “per year” (row 34) is calculated and indicates the maximum throughput on an annual basis.
9. The above “per year” value is then split into a “per hour” (row 35) and per “square feet” value (row 36).
The above values may be used for peak capacity planning when throughput per station and per hour or limited
available floor space to allow a certain checkout capacity is a concern.
38-39 Non-labor costs per 100 scanned items (max / load)
These values are total calculated, non-labor-related costs per 100 items scanned.
The cost value (max util.) per 100 items scanned value in Row 38 is based on the theoretical maximum number of
items that can be scanned.
The cost value (Utilization adj.) per 100 items scanned value in Row 39 is based on the load-adjusted number of
items that can be scanned.
Use the cost value as described here primarily for cost comparisons. Actual non-labor cost per 100 scanned items will
be somewhat higher because the checkout stations have idle periods throughout the day. This downtime will increase
the actual cost per transaction.

Comparing Checkout Station Costs and Performance
Current Retail Checkout Technology: Part III Page 24
41 Shrink/loss cost per 100 scanned items
1. Set the parameter, Average (type) shrink/loss of article sales value.
Setting this value helps to calculate the actual cost of shrink for each type of checkout station.
The amount of goods lost to theft, registration errors and other related causes varies by checkout approach,
control measures and store policies.
The tool calculates the value of shrink/loss costs per 100 scanned items from these parameters for each type of
checkout station:
Average price of items sold
Average cost price /sales price
Average (type) shrink/loss of article sales value.
2. Set the parameter, Average cost price / sales price.
If the loss value equals the sales value of the lost items, set the value to 100 percent. If store managers assume
that any shrink will incur lost sales, this approach might be relevant.
43 Annual labor cost per full day working hours
1. Set the parameter, Labor cost per employee and per year …
This value is the cost of staffing a checkout station or self-checkout area during store operating hours throughout a
full year. This calculation usually involves more than one employee per day. Indirect labor costs (the value of which
might be higher than average employee salary) must be added.
For more information, refer to the parameter, Labor cost per employee and per year.
44 Checkout units per employee
1. Set the parameter, SCO units per assistant.
The parameter value appears on Row 44.
46 Annual labor cost per checkout
The model calculates this value by dividing the annual labor cost (Row 43) by checkout units per employee (Row 44).
48-49 Labor cost per 100 scanned items (max/load)
These values show the calculated total, annual labor-related costs per 100 items scanned.
The value (Max util.) per 100 items scanned in Row 48 is based on labor costs divided by the theoretical maximum
number of items that can be scanned.
The value, (Load adj.) per 100 items scanned, in Row 39 is based on labor costs divided by the load-adjusted number
of items that can be scanned.
51 Annual cost per checkout station
The tool calculates the total cost per station for each type of checkout station design.
53 Total cost per 100 scanned items (max utilization)
This value is the total cost of scanning 100 items. It assumes the theoretical maximum of utilization and operations.
54 Total cost in percent of item price (max util.)
This value is the cost (in percent) of the item price set in the parameter, Average price of items sold. It assumes the
theoretical maximum of utilization and operations.
56 Total cost per 100 scanned items
This value reflects all the cost elements described above and provides the total cost of scanning 100 items. This
calculation is based on the per-transaction portion of the tool’s cost-analysis model.

Comparing Checkout Station Costs and Performance
Current Retail Checkout Technology: Part III Page 25
57 Total cost in percent of item price
This value is the cost shown in Row 56 converted to a percentage of the price set in the parameter, Average price of
items sold.
58 Additional cost in percent
The model calculates the values in this row for different types of checkout station. The values are the cost increases
created by using each type of checkout station. Costs are set at zero percent for the baseline station, which is the
station or checkout area with the lowest cost.
60 Cost reduction average US Supermarket
1. Set the parameter, Income from Sales (average US supermarket).
The model calculates this value as a cost saving. In this calculation, baseline costs (set at zero dollars) reflect the
most costly checkout type. The difference in cost savings between each checkout type indicates the potential
savings from using each type of checkout station.
61 Increase in Profit – percent
The model calculates percent profit by using the cost savings in Row 60 and the parameter, Income from Sales
(average US supermarket). The calculation assumes that all potential savings convert to profit. Stores might want to
use staff, equipment and operational savings in other areas. This will affect the actual net profit increase indicated.
Parameters (Column: “I” to “L”)
Row # Description
6 Floor space building rental/cost per square foot
You can derive this value from the building cost and running expenses or the average rental rates of the store
premises. You can also set this value as an alternative usage cost. In this case, set the value of the area as if the space
could be used for shelf space or another income-generating purpose.
Suggested value: $15 per square foot per year
7 Electricity cost per square foot
1. If electricity costs are measured as an average building value per square foot, specify it directly.
2. If a more precise value is known, change the costs to reflect the energy requirements of the checkout area rather
than a building-wide average.
3. Excluding checkout station power consumption. This value might be specified directly in Row 12.
Suggested value: $4 per square foot per year

Comparing Checkout Station Costs and Performance
Current Retail Checkout Technology: Part III Page 26
8-10 (Type) Depreciation time
A checkout solution that uses complex technology or is process- sensitive carries greater risk of becoming obsolete.
These solutions would have a reduced life expectancy.
Suggested values: 4 years for self-assist checkout stations; 6 years for cashier-assisted or hybrid checkout stations
11 Interest rate on investment
Your business is likely to expect a return on its technology investments. This value can vary a lot depending on your
business and the type of investment. Whatever ROI is appropriate for your business, set the value in Row 11.
Suggested value: 3,5%
13-15 Average (type) scanning time per item
Adding loading and packing times if these tasks are part of the item registration process.
These parameters specify the average time needed to scan each item that is part of a sale. The time should include
only the loading, payment and packing times that directly influence the time required to scan or register each item.
Pauses and time spent handling the items during the registration process can increase average scanning times a lot.
Fruit needing to be weighed, manual entry of an item, and waiting for assistance can increase the registration time
substantially. These times should be included.
Suggested values (per item): SCO: 10 seconds, CCO: 2,6 seconds and HCO: 1,6 seconds
17-19
Average (type) per sale additional time
Adding extra time spent loading, packing and paying for items or other similar tasks as needed.
These parameters specify how much time customers spend before scanning or registration starts and after it ends. If
loading, payment, packing or other similar tasks prevent the next customer from using the station as checkout
becomes busy, add the appropriate time.
In self-assist checkout stations, customers typically spend time positioning the basket or trolley, start using the
computer screen, selecting a language and possibly unloading the items onto a counter. After scanning or registering
items, customers select a payment method, make the payment, add a signature and complete any remaining packing
and package handling tasks. Use this parameter to add the total time for these tasks.
In cashier-assisted checkout stations, if the customer preloads items onto the counter, registration can start as soon
as the previous customer has completed their payment. After scanning the items, the cashier and customer complete
the payment process. In some checkout station designs, packing items can also add time. Use this parameter to add
the total time for these tasks.
In hybrid checkout stations, the scanning and registration process might occur while the previous customer
completes their payment. Typically, a hybrid checkout counter will be busy only for a short time while each payment
is made. The next customer might start scanning items, while the previous customer completes their payment.
Although the additional time spent per sale might vary a lot, it is likely to be much shorter than additional times in
cashier-based and self-assist alternatives.
Include the time spent preventing other customers from scanning their items. Exclude any time directly related to
scanning items.
Suggested values: SCO: 40 seconds, CCO: 30 seconds and HCO: 10 seconds
21-24 Average (type) items per sale
Specifying the number of items in an average-sized basket for each type of station.
Typically, a small SCO station will have a substantially smaller item count than that of other checkout types.
Suggested values: SCO (small): 8 pcs, SCO (large): 25 pcs, CCO: 25 pcs and HCO: 25 pcs
26-28 Average (type) shrink/loss of article sales value
Setting actual or likely theft percentages for each type of checkout station.
Suggested values: SCO: 1.20%, CCO: 0.10% and HCO: 0.10%

Comparing Checkout Station Costs and Performance
Current Retail Checkout Technology: Part III Page 27
30 Store operating hours per week
Be sure to set the average number of hours the store is open each week.
32 Labor cost per employee per year, incl. hiring/social (x1.8)
This value is the total annual cost of hiring an employee.
Remember to include hiring and social costs as applicable.
You may omit or reduce this value from cashier-assisted or self-assist checkout scenarios that use assistants. Set this
parameter to zero or reduce it as desired. Reduced labor cost scenarios might apply to small stores, which (for
example) might require two employees present at all times.
Suggested values: $39600 ($22,000 plus an 80-percent markup of wages for social and other employee-related costs).
33 Cashier hours worked per year
This value is the average number of hours a full-time employee would work each year.
Suggested value: 2080
34 Self-checkout stations per assistant
This value indicates the average number of self-assist checkout stations each assistant will support.
Suggested value: 4 checkout stations
36-38 (Type) Short term utilization
These values set utilization rates for each type of checkout station.
See Rows 34 through 36 in the cost-analysis description above for an explanation on how to set these values.
Suggested values: SCO: 70%, CCO: 82% and HCO: 90%
40 Price of average item sold
This value is the average price of items sold at a single store or chain of stores.
Suggested value: $2.25
42 Income from Sales (average US supermarket)
Setting this parameter enables key metrics such as average cost savings to be calculated for a store or a chain.
Suggested value: $16,263,433 (Average US supermarket income for 2012)3
43 Average cost price / sales price savings
See Row 41 in the cost analysis description above for an explanation on how to set this parameter.
44 Number of articles sold per year (avg. US supermarket)
Setting this parameter enables key metrics such as average cost to be calculated for a store or a chain.
Suggested value: 7,228,192 (Calculated average for a US Supermarket for 2012)
3 FMI: http://www.fmi.org/research-resources/supermarket-facts