an examination of the 16pf global factors as predictors of
TRANSCRIPT

An Examination of the 16PF Global Factors as Predictors of the Scale of Accurate
Personality Prediction (SAPP)
By
Maria Christina Mandina
Bachelor of Science
Psychology
University of North Florida
2013
Master of Science
Clinical Psychology
Florida Institute of Technology
2015
A Doctoral Research Project submitted to the
School of Psychology at
Florida Institute of Technology
In partial fulfillment of the requirements
For the degree of
Doctorate
In
Clinical Psychology
Melbourne, Florida
March, 2017

© Copyright 2017 Maria Christina Mandina
All Rights Reserved
The author grants permission to make single copies _______________

We the undersigned committee hereby approve the attached doctoral level project
An Examination of the 16PF Global Factors as Predictors of the Scale of Accurate
Personality Prediction (SAPP)
By
Maria Christina Mandina
_______________________________ ________________________
Philip D. Farber, Ph.D. Richard T. Elmore, Jr., Ph.D.
Associate Professor Associate Professor
College of Psychology and Liberal Arts College of Psychology and Liberal Arts
Committee Chair Committee Member
_______________________________ _______________________________
John Frongillo, Ph.D. Mary Beth Kenkel, Ph.D.
Assistant Professor Professor, Dean
School of Arts and Communication College of Psychology and Liberal Arts
Committee Member

iii
Abstract
TITLE: An Examination of the 16PF Global Factors as Predictors of the Scale of
Accurate Personality Prediction (SAPP)
AUTHOR: Maria Christina Mandina, M.S.
MAJOR ADVISOR: Philip D. Farber, Ph.D.
The Scale of Accurate Personality Prediction (SAPP), first developed by Miller
(2000), was designed to measure one’s self-knowledge regarding their personality traits.
The SAPP was derived from the Sixteen Personality Factor Questionnaire (16PF) by
means of comparing the differences between a respondent’s predicted and obtained
scores on the 16PF. Numerous studies to date have examined both the reliability and
validity of the SAPP. A recent study looked at the predictability of the SAPP score
utilizing the 16 obtained primary scales of the 16PF (Mazur, 2015) so as to be able to
derive a SAPP score directly from the obtained 16PF results. The purpose of this current
study was to further examine the potential derivation of the SAPP score by examining
which 16PF global factors would best predict an individual’s SAPP scores. Much like the
Mazur (2015) study, the current study also utilized a series of multiple regression
analyses to determine which global factors on the 16PF best predict the SAPP score,
using the current database of over 600 respondents.
With the present results, along with those obtained by Mazur (2015), as
guidelines, the next regression study will then combine all of the 21 16PF scales to
determine the most accurate combination to predict one’s SAPP score. This will then

iv
eliminate the need to have one predict one’s scores to yield the SAPP score, thus making
it possible to add it to the most recently derived 16 PF specialty scales.

v
Table of Contents
Abstract…………………………………………………………………………………...iii
List of Tables …………………………………………………………………………….vi
Acknowledgments ……………………………………………………………………....vii
Literature Review …………………………………………………………………………1
Statement of Purpose ……………………………………………………………………17
Method …………………………………………………………………………………..19
Results …………………………………………………………………………………...23
Discussion ……………………………………………………………………………….27
References ……………………………………………………………………………….29
Tables ……………………………………………………………………………………33
Appendix ...………………………………………………………………………………45

vi
List of Tables
Table 1: Summary of Demographic Statistics (Total Sample)
Table 2: Summary of Demographic Statistics (Half Sample 1 Evens Database)
Table 3: Summary of Demographic Statistics (Half Sample 1 Odds Database)
Table 4: Pearson Chi-Square Analysis
Table 5: General Multiple Regression Analysis: Half Sample Even
Table 6: General Multiple Regression Analysis: Half Sample Odd
Table 7: Forward Multiple Regression Analysis: Half Sample Odd
Table 8: Backward Multiple Regression Analysis: Half Sample Even
Table 9: Backward Multiple Regression Analysis: Half Sample Odd
Table 10: General Multiple Regression Analysis: Total Sample
Table 11: Forward Multiple Regression Analysis: Total Sample
Table 12: Backward Multiple Regression Analysis: Total Sample

vii
Acknowledgments
I would like to express the upmost gratitude to everyone who supported me in completing
this study. First, I want to thank Dr. Philip Farber for his endless support, guidance, and
humor that not only aided me through this process, but throughout the entire doctoral
program. I also want to thank Dr. Elmore and Dr. Frongillo for taking the time to serve
on the committee and offer their support and feedback. To my parents, Leo and Maria,
thank you for your endless support and love you have blessed me with throughout my life
and throughout my time in the doctoral program. Without you and the sacrifices you have
made, I would not be where I am now and for that I am truly thankful. I also want to
thank Maria, my sister and my best friend, who is always there for me, offering her love
and support. To my fiancé, Robert, I would like to express my endless love and
appreciation for your unconditional love, support, and humor that inspired me every day
and helped me begin and finish this journey. To my friends in the doctoral program, a
sincere thank you for the incredible support and amazing memories we shared together
that helped me get through the most difficult times. Lastly, I want to thank God for all the
blessings he has given me, especially these individuals I mentioned, whom I will always
be grateful for.

1
An Examination of the 16PF Global Factors as Predictors of the Scale of Accurate
Personality Prediction (SAPP)
Literature Review
The concept of the self and self-knowledge has been of interest among
philosophers, writers, laypeople, and psychologists for centuries. To know oneself was a
fundamental virtue for the ancient Greeks, as it was considered essential to flourish and
obtain wisdom. The idea of self-knowledge as an essential component for a meaningful
life has been preserved in the present-day Western world. Self-knowledge is thought to
be the foundation for important decisions concerning one’s future, based on the
knowledge of one’s qualities, values, interests, and personality. However, the meaning of
self-knowledge is not well understood due to the complexity of the two constructs
comprising it; namely, the “self”, and “knowledge” (Hart & Matsuba, 2012). A brief
look at these two constructs would be instructive at this point.
The Self
Although many definitions and conceptualizations have been offered, there is no
consensual framework for the various different facets of the self (Pervin & John, 1999).
For William James (1890/1998, p. 291), the self evolves from consciousness: “a man’s
self is the sum total of all that he can call his” (as cited in Hart & Matsuba, 2012, p.291).
Hart and Matsuba (2012), refer to the self as “a loose connection of experiences,
memories, propositions, and theories” (p.8). Leary and Tangney (2003) conceptualized
the self as a psychological apparatus that permits for self-reflection, affects conscious
experiences, determines all perceptions, beliefs, and feelings about oneself, and permits
individuals to control their own behavior and abilities to think about themselves.
2
Furthermore, Leary and Tangney (2003) identified five distinct ways in which behavioral
and social scientists have utilized the word self: 1) the self as the total person, 2) the self
as personality, 3) the self as the executive agent, 4) the self as beliefs about oneself, and
5) the self as the experiencing subject. The self as the total person simply refers to just the
person, him or herself. The self as personality refers to all or part of an individual’s
personality. Tesser (2002, p.185) has suggested that the self is “a collection of abilities,
temperament, goals, values, and preferences that distinguish one individual from
another…” (as cited in Leary & Tagney, 2003, p. 6-7). The self as the executive agent
refers to the decision making process that regulates one’s behavior (Leary & Tangney,
2003). The last two components of the self, the self as beliefs about oneself, and the self
as the experiencing subject, are generally considered the most common components of
any definition of self. Pervin and John (1999) have suggested that all definitions have at
least two underlying phenomena of the self: 1) stable mental representations and 2)an
ongoing sense of self-awareness. The stable mental representations correspond to the
self-as-object perception, or the self as “Me”, and refers to perceptions, thoughts, and
feelings about oneself. This is congruent with #4 (i.e., the self as “Me”) above. The
ongoing sense of awareness corresponds to the self-as-perceiver, or the self as “I” (see #5
above), and is responsible for moment-to-moment self-awareness, or the inner
psychological entity that is the center of a person’s experience (Pervin & John, 1999;
Leary & Tangney, 2003).

3
Knowledge
An extensive look into the meaning of “knowledge” would be well beyond the
focus of the present work. Suffice it to say that no true consensus has emerged across the
multitude of philosophical, epistemological, and lexical tomes as to what constitutes
knowledge. For the present purposes, perhaps the works of Scheffler (1983) and Steup
(2008) may best summarize the conditions necessary to assert a certain level of
knowledge. These authors have suggested three conditions as prerequisites to affirming
that an individual holds knowledge: 1) the knowledge must be true, 2) the knowledge
must be justified, and 3) the knowledge requires beliefs in a proposition (Scheffler, 1983;
Steup, 2008, as cited in Hart and Matsuba, 2012).
Self-Knowledge
Acquiring knowledge about the self is difficult due to the various complex facets
of the self. There are various theories and components of the self that influence the
capacity of self-knowledge. As William James (James, 1890/1998, p.291) noted, in order
for there to be a “self,” there must exist the capacity for reflection, the individual the must
determine the aspects that compose the self, and the “self” must include the elements of
self-identification. There are two significant key components in the development of self-
knowledge: representations and personal memories. Personal memories are considered
key constituents of the sense of self. Representations and generalizations of the self, such
as self-appearance, capabilities, and psychological characteristics, also contribute to the
development of self-knowledge.

4
The origins of self-knowledge can be conceptualized by three main
developmental theories: neo-psychoanalytical, cognitive-developmental, and social
attunement (Hart & Matsuba, 2012). The neo-psychoanalytical theories, proposed by
Ausubel (1949), suggest that emotions and individual needs govern psychological
functioning and provide the basis for the development of self-knowledge. The cognitive
developmental theory, based on Baldwin (1906), suggested that the self develops
predominately due to social imitation. Baldwin postulated that individuals require
imitation for survival skills, and that through imitation, the individual’s self develops and
is influenced by unities between representations of self, and which then reveal the
importance and desire in the experience of the self. Lastly, social attunement theory,
which has its roots in the work of George H. Mead (1934), suggests knowledge is
obtained by making inferences of what others believe of the self, which is related to self-
reflection, and then leads to the idea of self-consciousness. More contemporary theories
propose that self-knowledge is dependent upon a variety of perceptual, cognitive,
biological, and social processes that interact as individuals develop through their
environment. Consequently, traditional and contemporary theories should all be taken
into account when conceptualizing the development of self-knowledge. Decisions
regarding careers and relationships can be influenced by the level of self-knowledge one
possess, including awareness of talents, qualities, traits, and personality (Hart & Matsuba,
2012). It is the area of personality that has the most relevance for this present study.

5
Personality
The study and understanding of personality is not only critical within the field of
psychology, but also various across other disciplines, which look to evaluate individuals.
The study of personality focuses on differences in the way individuals think about
themselves and the world around them, process internal and external information, and
behave in response to that information. These differences are what define personality
itself. The complexity of the various aspects of personality makes it difficult to define it
precisely. Cattell (1950) defined personality as “that which permits a prediction of what a
person will do in a given situation” (p.2) as cited in Ellis, Abrams, & Abrams, 2009,
p.231). Feshbach & Weiner (1982) describe personality are referring to: “relatively
enduring behavior patterns and traits that distinguish people, groups, and cultures; the
overall organization and structure of these enduring behavior patterns and traits; and the
interactions among these patterns as well as the interactions with the fluctuations in an
individual’s internal state and the changing external stimulus situation” (p.12).
Throughout the various disciplines that study personality, personality theories
have been developed to explain how and why the differences among individuals exist,
and to conceptualize and understand individual differences of human behavior, the
development of personality over time, and the possible origins and influencing factors in
the wide array of psychological disorders. In order to best understand the similarities and
differences that exist across the many psychological theories of personality, these theories
have often been divided into the following broad domains: psychodynamic, humanistic,
behavioral, social learning, and trait theories.

6
Psychodynamic Theory
Psychodynamic theory, or psychoanalytical theory, as it is often called, is based
on the main premise that self-regulating and independent unconscious processes make up
the essence of personality, and operate through mental structures that are in continual
conflict (Ellis, Abrams, & Abrams, 2009). Sigmund Freud is considered the father of
psychoanalysis, and his psychoanalytic model provided the principal framework for the
plethora of subsequent analytic theories that followed. The two central concepts of
Freud’s original theory are 1) homeostasis, the tendency toward the preservation of a
relatively stable environment, and 2) hedonism, which asserts that pleasure and happiness
are the predominant goals in life. Freud believed that personality consists of three
systems: the id, the ego, and the super ego. The id is reflected in all the uncontrolled
drives or impulses of the individual, which are most often associated with basic
biological processes. The ego attempts to organize and mediate between the id and the
reality of risks posed by the id’s impulses. The super ego is the internalized social
component, ingrained in what the person imagines to be the expectations of authority.
Quite often the id’s desires and impulses are in direct conflict with the demands offered
by the superego, and thus it is the function of the ego to remedy these conflicts so as to
allow for the healthiest and functional development of the individual. Freud considered
human personality to be predominately characterized by these three components
(Feschbach & Weiner, 1982).

7
Humanistic Theory
The humanistic theory of personality states that individuals are basically good and
strive toward maximum personal development or self-actualization. Carl Rogers is
considered one of the significant figures within the humanistic movement within
psychology. He initially viewed the self as the personal identity portion of the
phenomenal filed, representing all of the individual’s experiences. Later on in his career,
Rogers concluded that the self is comprised of conscious sensations, perceptions, and the
awareness that guides the self-descriptions of “I” or “me.” Rogers believed individual
development is determined by alterations in the organization of the phenomenal field
brought about by the perceptual field. He believed that through interactions with the
environment, one can develop a self-concept, or the organized set of characteristics that
the individual recognizes as belonging to him or her. By the interactions of the
environment, an individual develops the awareness of whom he or she is, or self-
knowledge. Each individual creates a unique reality based on the interactions of the
environment with his or her phenomenal field, or the person’s reality. (Ellis, Abrams, &
Abrams, 2009).
Behavioral Theory
The behavioral theory of personality is based on the idea that personality is the
observable result of reinforcement (Ellis, Abrams, & Abrams, 2009). John Watson is
considered the founder of behaviorism. The purpose of his theory was to predict and
control behavior. He proposed that all knowledge depends on external stimuli and all
behavior is predetermined by external circumstances regardless of other factors, such as

8
biology or genetics (Feschbach & Weiner, 1982). Watson viewed human personality as
lacking any preexisting traits or hypothetical structures. He explained that personality is
formed in the individual as distinctive stimuli are attached to emotions through classical
conditioning (Ellis, Abrams, & Abrams, 2009).
B.F. Skinner, one of the most prominent radical behaviorists, agreed with the
work of Watson, and became the principal leader of the behaviorist theory. Skinner
viewed personality as simply the composite learned responses within a specific
individual. To him, the concept of personality, along with personality theories, required
inferring the existence of traits, temperaments, and cognitive styles, and these inferences,
consequently, make an individual more inexplicable than understandable. He believed
that all theories of human behavior are the result of failure to determine behavioral
predecessors and relevant reinforcement contingencies, leading to unnecessary complex
explanations of the individual. He believed that personality was not constant, but unstable
across situations depending upon presenting stimuli and varying types and degrees of
reinforcers (Ellis, Abrams, & Abrams, 2009).
Social Learning Theory
Social Learning theory is based on the foundation that personality develops out of
directly reinforced, observed, or socially encouraged behaviors (Ellis, Abrams, &
Abrams, 2009). Albert Bandura is the most notable figure of the social learning theory.
He believed that individuals are the products of learning processes and have the
capability of internalizing various behaviors. For the development of personality,
Bandura highlighted the importance of cognition, rather than biological factors. He
9
believed that an individual’s subjective perceptions of events are what impact the
individual, not the external event alone. His conceptualization of personality greatly
emphasized the contingent consequences of a behavior. Internal mediating processes,
such as attention, covert rehearsal of instructions, self-criticism, and self-reinforcement
also play a significant role in social learning. With regard to social development, Bandura
believed that certain learning mechanisms, such as observational learning, play a very
significant role in human learning. Personality characteristics are therefore acquired by
imitating or copying the behavior of the models one observes (Feschbach & Weiner,
1982).
Trait Theories
Trait theory is based on the premise that differences among people can be reduced
to a limited number of distinct behavioral styles or traits. Personality, then, is composed
of several discrete, stable, and enduring characteristics. Definitions of traits tend to have
the same elements in common: traits are stable within a given individual, traits vary
among individuals, traits can be measured, and traits are responsible for closely related
behaviors. Compared to most of the other theories outlined, trait theory is perhaps the
most directly based on and corroborated by research data and can be operationally
defined and investigated through the use of scientific methodologies. The analysis of
traits can differentiate personalities. Raymond Cattell believed that traits could be
statistically measured by observing one’s behavior as well as the behaviors of others. In
turn, these measurements then permit the prediction of behavior (Ellis, Abrams, &
Abrams, 2009). Trait theory also offers methods for the measurement of the components
10
of personality, and in particular for the possible measurement of one of these
components, which happens to be the focus of this research project; namely, personality
self-knowledge.
Personality Self-Knowledge
Personality self-knowledge (PSK) can be simply conceptualized as the degree of
agreement between individuals’ self-views of their personality, and their “real”
personality. More specifically, Vazire & Carlson (2010, p. 133) define personality as
“accurate explicit self-perceptions of how one regularly thinks, feels, and behaves, and
awareness of how those patterns are interpreted by others” (Vazire & Carlson, 2010, as
cited in Back & Vazire, 2012). Therefore, Vazire and Carlson conclude that PSK can be
measured as correlations of explicit self-reports of personality, behaviors, and
reputations.
Various domains of self-knowledge can be extracted from the meaning of
personality self-knowledge. First, individuals process information about themselves and
their environment in both explicit and implicit manners, a notion referred to as the
explicit-implicit consistency. It reveals the degree in which an individual’s conscious
self-descriptions are in line with one’s implicit self-related representations. Second, the
degree to which one’s explicit personality self-views converge with actual behavior, or
behavioral prediction, is often considered a requirement for the validation of any
personality measure. A third domain consists of how well an individual’s explicit
personality self-views converge with others’ perceptions of one’s personality, or self-
other agreement. Lastly, PSK can be studied by inquiring about the degree of how well
11
the individual knows how others view his or her personality, or meta-accuracy. Overall,
individuals can be considered to have adequate self-knowledge if their self-concept is
reflected by their implicit self, typical behavior, and their reputation versus one who lacks
these characteristics (Back & Vazire, 2012).
Measurements of Self Knowledge
Self-knowledge has been considered a likely aid in psychological and mental
health functioning and important effects of self-knowledge are evident in various human
endeavors. Unfortunately, there has been an insufficient amount of research in efforts to
explore the accuracy of self-knowledge (Feshbach & Weiner, 1982). Despite ongoing
interest in the accuracy of self-knowledge, there has been limited research directly
addressing this topic. Several factors may be responsible for this, such as the difficulty of
arriving at a consensual and simple definition of self-knowledge, or the difficulty to
accurately conceptualize the richness and individuality of an individual’s real personality.
As a result, the empirical measurement of real personality self-knowledge has proven to
be a difficult task. Back and Vasire (2012) concluded that assessing personality self-
knowledge likely requires a combination of measurements from numerous areas, such as
self-reports, knowledgeable other reports, and observed behavior (Back & Vazire, 2012).
Of the limited amount of research in this area, there exist just a few assessments
that attempt to measure similar constructs. The Integrative Self-Knowledge Scale (ISKS)
developed by Ghorbani, Watson, and Hargis in 2008 is intended to measure “a
temporally integrated understanding of processes within the self” (p. 395). This
integrative scale was created by using an “adaptive capacity to integrate past and present

12
self-experience to obtain desired outcomes in the future” (p. 407). The following
questionnaires were given to participants: the Experiential Knowledge Scale, the
Reflective Knowledge Scale, Brown and Ryan’s (2003) Mindfulness Scale, and 30
potential statements of integrative self- knowledge. Thirty statements were derived from
the researchers’ definition of integrative self-knowledge, “adaptive and empowering
attempt of the self to understand its experience across time to achieve desired outcomes”
(p. 397). Next, 12 items were selected for the inclusion on the ISKS scale based on a
three-factor model: reflective self-knowledge, experiential self-knowledge, and
mindfulness. Analyses on the data collected found a three-factor model of integrative
self-knowledge that seems to load equally upon the individual factors. Convergent
validity revealed the presence of higher integrative self-knowledge was associated with
greater experiential self- knowledge, reflective self-knowledge, and mindfulness
(Ghorbani, Watson, & Hargis, 2008). Another scale intended to measure self-knowledge
is the Scale of Accurate Personality Prediction (SAPP). It is this scale that is the focus of
the present research project.
Scale of Accurate Personality Prediction (SAPP)
Miller (2000) developed the Scale of Accurate Personality Prediction (SAPP) in
an effort to measure an individual’s self-knowledge. The SAPP scale intends to measure
the extent of an individual’s self-knowledge by comparing obtained scores on an
objective personality measure of personality with the corresponding predicted scores on
that same measure. The SAPP scale was generated from the Sixteen Personality Factor
(16PF) Questionnaire, a comprehensive and widely used objective personality measure.

13
The 16PF was created by Raymond Cattell and released in 1949. Since the first
release in 1949, there have been four major revisions. The main goals of the latest
revision were to update, refine item content, and collect a larger, newer normative
sample. The current edition is comprised of the original 16 personality factors that Cattell
believed represented the most predominant universal aspects of personality. The 16
factors, measured in bipolar standardized ten (sten) scores, are as follows: Warmth (A),
Reasoning (B), Emotional Stability (C), Dominance (E), Liveliness (F), Rule-
Consciousness (G), Social Boldness (H), Sensitivity (I), Vigilance (L), Abstractedness
(M), Privateness (N), Apprehension (O), Openness to Change (Q1), Reliance (Q2),
Perfectionism (Q3), and Tension (Q4). When these 16 primary factors were further
analyzed, five more secondary emerged and have been referred to as the Global Factors.
These Global Factors are as follows: Extraversion (EX), Anxiety (AX), Tough-
Mindedness (TM), Independence (IN), and Self-Control (SC). Since its release in 1949,
the fifth edition contains the original 16 factors that Cattell identified (16PF Manual).
New to the Fifth Edition, the Impression Management (IM) Index replaced the “Faking
Good” and “Faking Bad” scales from the Fourth Edition. New indices include the
Acquiescence (ACQ) index and the Infrequency (INF) index (Cattell & Mead, 2008).
See Appendix A for a copy of the 16PF, Fifth Edition’s Individual Record Form.
Cattell’s hierarchical organization is constructed on the notion that all traits are
intercorrelated in reality and could thus be factor-analyzed to create the secondary level
global traits. These results therefore governed the meanings of the primary and global
factors. The global traits define a higher, more theoretical view of personality, providing

14
the broad framework for understanding the meaning and purpose of the primary traits.
The primary traits provide more thorough information about the richness and uniqueness
of the individual. Combined, they deliver a comprehensive, in-depth understanding of the
individual’s entire personality (Cattell & Mead, 2008).
The 21 scales are presented as sten, or standard ten, scores with both high and low
scores possessing significance. Sten scores are based on a 10-point scale with a mean of
5.5 and a standard deviation of 2. Scores further from the mean are interpreted as more
extreme. Stens from 4 to 7 are considered within the average range, stens of 8 to 10 are
within the high range, and stens of 1 to 3 within the low range (16PF Manual). The
profile sheet (Appendix A) displays all 21 scales on the bipolar 1 to 10 continuum. The
profile sheet includes adjectives for each of the 21 factors describing the extreme scores.
Miller’s (2000) development of the SAPP required participants to complete the
16PF- Fifth Edition and then rate themselves on each of the 21 personality factors of the
16PF using a blank profile sheet. The absolute differences between the participants’
obtained scores (OS) and self-predicted scores (PS) on all 21 factors were then summed
to create the SAPP score. SAPP scores can range from 0 to 189 and the maximum
difference between a participant’s OS and PS is nine points for any of the 21 factors. In
this initial study (Miller, 2000), the SAPP scores ranged from 18 to 79 with a mean of
42.07 and a standard deviation of 11.74 (Miller, 2000). Low SAPP scores are believed to
indicate high levels of self-prediction, and thus high self-knowledge. Similarly, high
scores should be indicative of lower levels of self-knowledge.

15
Reliability of the SAPP
With regard to reliability, validity and generalization of the SAPP scale,
subsequent studies have attempted to establish the SAPP as a viable measure of self-
knowledge (Hood, 2001; Anderson, 2002; Winter, 2002; Glywasky, 2003; Layton, 2005;
Hickey, 2005; Afanador, 2006; Grossenbacher; Wolf, 2006; Blankemeier, 2007;
Rodriguez, 2007; Silva, 2011; Hirsch 2012; Elghossain 2012; Sverdlova 2013; and
McElligott, 2014).
With respect to test-retest reliability, Silva (2011) attempted to research the test-
retest reliability of the SAPP with an interval of two weeks between the testing. The
results revealed a significant, yet relatively low, correlation between the two derived
SAPP scores (r2= .397, p< .05). Hirsch (2012) replicated Silva’s research and found a
significant moderate correlation between the two SAPP scores (r2= .566, p<.01).
Sverdlova ( 2013) investigated the SAPP’s test-retest reliability using a four-week
interval between testing conditions. Results revealed a significant correlation between the
two SAPP scores (r2= .466, p< .05). Another test-retest reliability study (Elgohassain,
2012) used a six-week interval between testing and found a significant correlation
between the two SAPP scores (r2= .722, p</01). While the latter correlations are still
somewhat lower than desired, when the two week test – retest data of the 16 primary
scales are considered, which have a range of reliabilities from .69 to .87 (Conn & Rieke,
1994), the SAPP reliability numbers appear quite acceptable. The major limitation
throughout all of these studies is their relative small sample sizes.

16
Validity of the SAPP
Validity refers to a test's ability to measure what it is supposed to measure.
Construct validity refers to how well a test measures the construct that it was designed to
measure. Convergent validity reflects the degree to which two measures that are
considered to be measuring a similar construct will correlate positively with each other.
Divergent validity reflects the degree of nonsignificant correlation for two measures not
considered to be measuring a similar construct. With regard to the validity of the SAPP,
the question is whether or not the SAPP is actually measuring a person’s self-knowledge.
To investigate the validity, the SAPP has been compared with other established measures
that may be have been thought to measure something akin to self-knowledge. Hood
(2001) attempted to establish convergent validity of the SAPP with the Private Self-
Consciousness factor in the Self-Consciousness Scale, which measures an individual’s
level of focus on feelings and inner thoughts (Hood, 2001). Hood hypothesized this self-
awareness may be component of self-knowledge; however, no significant results were
found. Nonetheless, divergent validity between the SAPP and the Tennessee Self
Concept Scale was found, suggesting the SAPP score does not correlate with self-esteem.
In 2003 the study was replicated with a larger sample size. Glywasky (2003) did not find
significant results despite the increase in sample size. Additionally, no significant
correlations were found between the SAPP and the private self-conscious factor of the
Private Self-Consciousness Scale or between the SAPP and the Tennessee Self- Concept
Scale. In 2002, Anderson attempted to establish convergent validity of the SAPP with the
Self-Monitoring Scale, which measures an individual’s willingness or ability to adjust
17
their behaviors in social situations, but again results did not yield significance. In all of
the above construct validation efforts, it was suggested, as an argument for the emergence
of the non-significant correlations, that the validation measures used (i.e., the Private
Self-Consciousness Scale, and the Self-Monitoring Scale) are both measures of the self as
“I”, while the SAPP is more based on the self as ‘”Me”.
Another attempt to establish construct validity utilized a priori groups. Winter
(2002) hypothesized that graduate students in clinical psychology should potentially have
higher levels of self-knowledge than a group of engineering graduate students. No
significant difference, however, was found. In 2006, Grossenbacher attempted to
replicate Winter’s study with an increased sample size. This study yielded significant
differences in the hypothesized direction, establishing some initial construct validity to
the measure.
Layton (2005) and Hickey (2005) tried to establish the validity of the SAPP by
using the degree of agreement between an individual self-predicted 16PF scores and
those made by family members and friends of the individual, respectively. It was
hypothesized that the higher agreement of an individual’s predicted scores with the
family/friends predicted scores of the individual, the lower (and thus better self-
knowledge) the SAPP score would be. A concordance measure was created to measure
the amount of agreement between one’s self-prediction and those made by family
members or friends. The SAPP score was then correlated with this concordance measure
to test the hypothesis. Layton (2005), who utilized close friends of the targeted subjects,
did not obtain results in the hypothesized direction. Hickey (2005) used the family

18
members of the targeted subjects, and her correlation between her subjects’ concordance
measure and SAPP scores just failed to reach levels of statistical significance. Wolf
(2006) attempted to replicate Layton’s study and with a larger sample and did find a
significant correlation between the concordance measure and her subjects’ SAPP score,
lending some construct validation of the SAPP. In a similar manner, Blankemeier (2007)
replicated Hickey’s work with a larger sample, and in doing so also obtained significant
results, again lending some support to the construct validation of the SAPP.
Generalizability and Predictability of the SAPP
A study by Rodriguez (2001) examining the generalizability of the SAPP and the
Hispanic/Latino population found significant results and concluded that the SAPP can be
generalized to the Hispanic/Latino population. Similarly, Zeng (2015) examined the
generalizability to the SAPP and the Asian population and found that the SAPP can be
generalized to the Asian population.
McElligott (2015) utilized a combined database of 609 respondents to develop
sten score equivalents for the respective calculated SAPP scores. Utilizing the two
methods for calculating the sten scores, she found strong correlations between the two
obtained sten scores. McElligott also linearly inverted all the database’s SAPP scores, so
that a high SAPP score would now reflect a high level of self-knowledge, and a low
SAPP score, a low level of self-knowledge.
Mazur (2013) sought to further investigate Miller’s (2000) findings by utilizing a
series of regression analyses to determine which primary factors on the 16PF would best
predicted the SAPP score. This line of research is most important, as it would hopefully

19
allow for the derivation of the SAPP score simply by utilizing a combination of the
primary and secondary 16PF factor scores. This would then supplant the need to have
individuals predict their own scores to calculate their SAPP score. Rather, the SAPP
score would be derived from the indicated combination of the most SAPP-predicable
primary and secondary scales. Mazur’s using the primary scales showed the overall
predictive model was significant and indicated that the factors of Emotional Stability
(Factor C+), Sensitivity (Factor I-), Suspiciousness (Factor L-), and Tension (Factor Q4-)
were significantly predictors of the SAPP scores. The best primary scale predictor of the
SAPP score was low scores on the Suspiciousness primary scale. What needs to next
occur is to examine the overall SAPP predictability of the five secondary factors
Statement of Purpose for the Present Study
Theories of self and self-knowledge have been of interest for centuries. However, there
has been a lack of research aimed at discovering the correlation between personality
domains and the accuracy of self-report of one’s own traits. The purpose of this current
study was to follow up on Mazur’s 2013 findings, which identified the specific
combination of 16PF factors that would best predict individuals’ SAPP scores.
Specifically, this study examined the 16PF global factors as predictors of the Scale of
Accurate Personality Prediction.
Method
Subjects
Since Miller’s 2000 study, 645 respondents’ data have been added in the SAPP
database. The current study utilized the existing data from the database. Subjects include

20
college students, individuals from the community, and other professionals.
Measures
1. The Sixteen Personality Factor Questionnaire- Fifth Edition (16PF- 5th edition)
The 16PF is a comprehensive self-report objective personality measure developed
by Dr. Raymond Cattell in 1946 in efforts to investigate universal aspects of
personality. It is comprised of 185 multiple choice questions, each containing three
answer choices, including true, false, or unsure. Completion of the 16PF takes an
average of 35 to 50 minutes. Individuals are encouraged to answer all questions
honestly and attempt to answer with a true or false choice, if possible. Scoring of the
19PF results in 24 scores, which consist of sixteen personality factor scores, five
global factor scores, and three validity scores (Impression Management (IM) scale,
Acquiescence (ACQ) scale, and Infrequency (INF) scale. The fifth edition was
published in 1994 and the normative sample was comprised of 2,500 individuals form
the United States who were selected in accordance with 1990 U.S. Census data with
regards to age, gender, education, and race. It was updated in 2002 with new norms
based on the 2000 U.S. Census with a sample size of 10,261 individuals.
Psychometric properties of the 16PF have been shown to have both strong criterion
and construct validity.
2. The Sixteen Personality Factor Questionnaire- Fifth Edition Profile Sheet
The 16PF-5th edition profile sheet provides sixteen primary factors and five global
factors (See Appendix ?). Each factor scale ranges on a continuum from one to
21
ten.
3. Calculation of the SAPP
Miller (2000) sought to create an overall measure of self-prediction of personality
traits using the 16PF Fifth Edition and along with Philip Farber, PhD, developed
the SAPP. The objective was to assess the accuracy of individuals in
predicting/describing their personality and to identify traits that are related to an
individual’s ability to accurately predict his or her own personality characteristics.
A predicted score (PS) and an obtained score (OS) were calculated for each of the
sixteen primary factors and the five global factors. Each factor is specified by its
given 16PF letter (e.g. PSA and OSA for Factor A). These scores contributed to
the SAPP, which consists of totaling the amount of absolute difference scores
from the sixteen primary factors and five global factors. The absolute difference
was obtained by subtracting the predicted score from the obtained score for each
factor. Lower scores reflect a greater ability in self-prediction, while higher scores
reflect a reduced ability in self-prediction. The lowest possible score on the SAPP
is a 0 (optimal accuracy), while the highest possible score is a 189 (poor
predictive ability). Most recently, these SAPP scores have been inverted to have
high scores reflect a higher ability to accurate self-prediction, and lower scores
reflecting less accurate self-prediction.
Procedure
Participants were initially administered the 16PF. After administration, they were
provided with a blank 16PF scoring sheet and were asked to rate themselves on each of

22
the 16 personality factors and each of the 5 global factors. These scores were then
compared to the obtained 16PF scores.
Analysis
As Miller’s 2000 study originally developed the formula to calculate one’s SAPP
score, it provided the basis for analysis of this study. The current study examined
demographics of the current database, including gender, age, ethnicity, marital status,
employment, and geographic region. Using the already established SAPP database of 645
participants, a series of regression analyses were conducted to determine which global
factors of the 16PF best predict an individual’s SAPP score. To ensure adequate
reliability, the database was split in two halves and equivalent regression analyses were
then performed on each sample. Regression analyses were then calculated for the total
sample.
Hypotheses
First, it is hypothesized that results of this study will find the global factor, Tough
Mindedness, to be a significant predictor of the SAPP score, similar to the findings of
Miller’s (2000) study. Second, it is hypothesized that the global factor, High
Anxiety/Low Anxiety, will also be a significant predictor of the SAPP score, based on
Mazur’s (2015) study which found significance in the primary factors, Suspiciousness,
Tension, and Emotional Stability, which all load on the global factor High Anxiety/Low
Anxiety, in predicting SAPP scores.

23
Results
The current study utilized a database of 645 participants. Participants completed
the 16PF and then predicted their scores on the 16PF. A SAPP score was calculated using
participants’ obtained and predicted scores.
Demographic Results
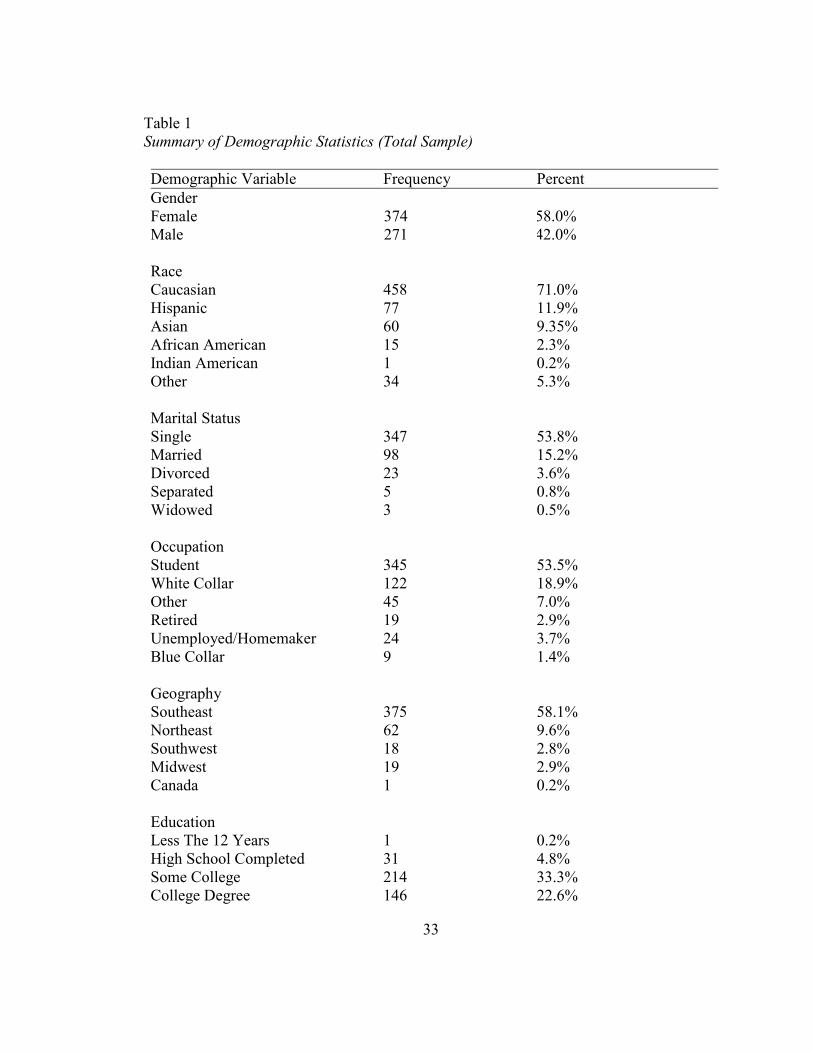
Table 1 represents the participant demographics of the current study. The age of
participants ranged from 16 to 81 years old with a mean age of 28.59 and standard
deviation of 12.37. In regard to gender, 58.0% % were female and 42.0% were male. In
regard to marital status, 53.8% were single, 15.2% were married, 3.6% were divorced,
0.8% were separated, and 0.5% were widowed. In regard to ethnicity, the sample was
comprised of 71.0% Caucasian, 11.9% Hispanic, 9.35% Asian, 2.3% African American,
0.2% Indian American, and 5.3% Other. In regard to occupation, the sample was
comprised of 53.5% Student, 18.9% white-collared jobs, 3.7% unemployed/homemakers,
1.4% blue-collar jobs, and 7.0% other. Geographically, 58.1% of the participants were
from the Southeast region, 9.6% were from the Northeast region, 2.9% were from the
Midwest, 2.8% were from the Southwest, and 0.2% were from Canada. The mean
education for the sample was 16.075 years (range= 11-23) with a standard deviation of
2.18.
Split Half Multiple Regression Analysis
The database was split into two samples by odd and even numbers. Each sample
then underwent regression analyses and the results were compared as a form of
reliability. For each half sample, a general multiple regression, forward regression, and

24
backward regression were all performed to assess the predictability of the global factors
on a participant’s SAPP score.
A Pearson Chi-Square was conducted on the demographic variables to evaluate
whether there were significant differences between the demographics of each half sample
(Half Sample 1 and Half Sample 2). As shown in Table 4, results revealed no significant
differences between the two half samples with: Ethnicity χ2(5,645)=1.28, p=.94,
Occupation χ2(5,564)=2.73, p=.74, Marital Status χ2(4,476)=0.88, p=.93, or Geography
χ2(4,475)=1.05, p=.90.
A general multiple regression analysis was conducted on each half sample to
assess the predictability of the five global factors on a participant’s SAPP score. The
results yielded the following: For Half Sample Even, as seen in Table 5, a general
multiple regression was conducted and a significant regression equation was found,
F(5,314)= 3.65, p <.01), with an R2 of .055. That is, only 5.5% of the variance of the
SAPP score can be accounted for by the scores of the five global factors. It was found
that the Independence global score (β= 1.60, p<.01), and the Tough Mindedness global
score (β= 1.19, p<.05), and the Extraversion global score (β= -.924, p<.05) significantly
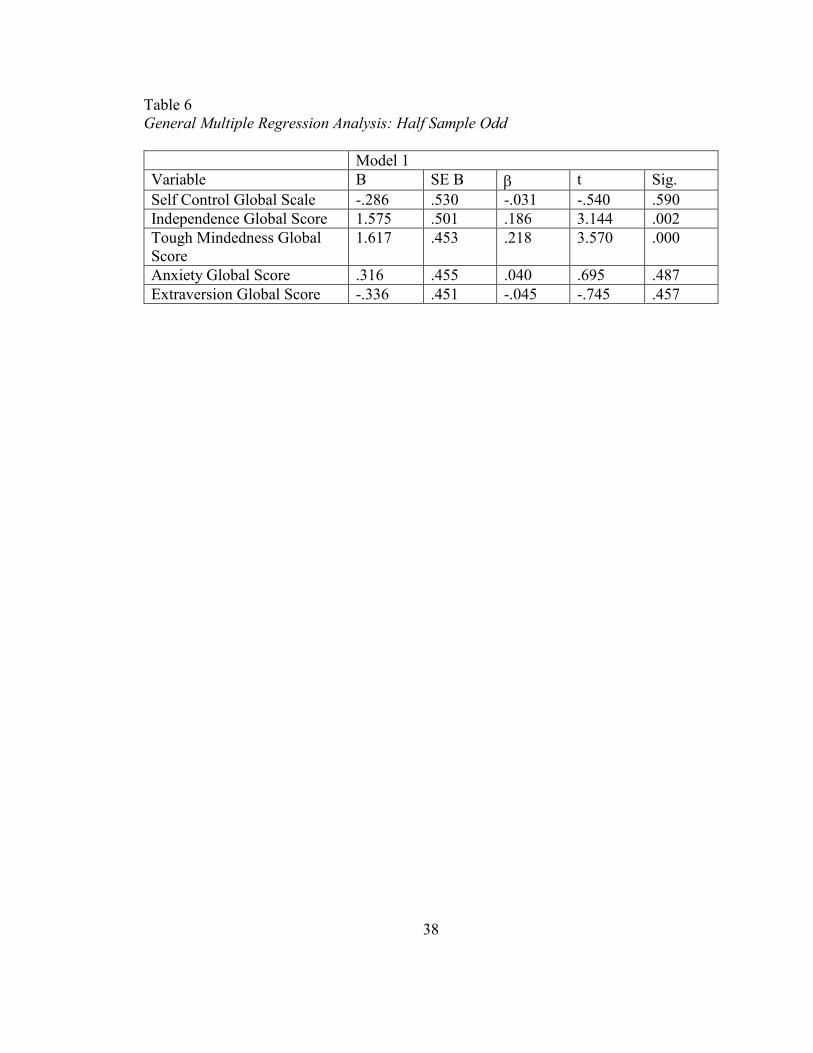
predicted individuals’ SAPP scores. For the Half Sample Odd, a general multiple
regression was conducted and a significant regression equation was also found, F(5,317)=
3.86, p <.01, with an R2 of .057, indicating that only 5.7% of the variance of the SAPP
score can be accounted for by the scores of the five global factors. It was found that the
Independence global score (β= 1.58, p<.01) and the Tough Mindedness global score (β=
1.62, p<.01) significantly predicted individuals’ SAPP scores (see Table 6).

25
A forward multiple regression was conducted next; however, the analyses was
unable to perform with the Half Sample Even. As seen in Table 7, with the Half Sample
Odd, in Model 1, the Tough Mindedness global score was entered into the equation and
was significantly related to the SAPP score (F(1, 321)= 8.31, p<.01), with an R2 of .022,
indicating that only 2.2% of the variance of the SAPP score can be accounted by for the
Tough Mindedness global score. In Model 2, the Independence global score was entered
and revealed significant results, F(2, 320)= 8.78, p<.01), with an R2 of .052, indicating
that only 5.2% of the variance of the SAPP score can be accounted by for the
Independence global score.
A backward multiple regression was conducted on both halves of the data. The
results of Half Sample Even, indicated that all the global factors accounted for 5.5% of
the variance. In Model 1, all variables were entered and revealed significant results,
F(5,314)=3.65, p<.01). It was found that the Independence global score (β= 1.60, p<.01),
the Tough Mindedness global score (β= 1.19, p<.05), and the Extraversion global score
(β= -.967, p<.05) significantly predicted individuals’ SAPP scores. In Model 2, Anxiety
global score was removed, revealing significant results, F(4,315)= 4.55, p<.01), with an
R2 of .055. Within this model, it was found that the Independence global score (β= 1.60,
p<.01), the Tough Mindedness global score (β= 1.18, p<.05), and the Extraversion global
score (β= -.967, p<.05) significantly predicted individuals’ SAPP scores (see Table 8). A
backwards multiple regression on Half Sample Odd generated several significant models.
In Model 1, all variables were entered and revealed significant results, F(5,317)=3.86,
p<.01), with an R2 of only .057. It was found that the Independence global score (β=
26
1.58, p<.01) and the Tough Mindedness global score (β= 1.62, p<.01) significantly
predicted individuals’ SAPP scores. In Model 2, Self Control global score was removed,
demonstrating significant results, F(4,318)= 4.76, p<.01), with an R2 of only .057.
Similarly, within this model, it was found that the Independence global score (β= 1.59,
p<.01) and the Tough Mindedness global score (β= 1.56, p<.01) significantly predicted
individuals’ SAPP scores. In Model 3, the Anxiety global score was removed,
demonstrating significant results, F(3,319)=6.2, p<.01, with an R2 of only .055. Within
this model, it was found that the Independence global score (β= 1.58, p<.01) and the
Tough Mindedness global score (β= 1.49, p<.01) significantly predicted individuals’
SAPP scores. In Model 4, the Extraversion global score was removed and revealed
significant results, F(2,320)= 8.78, p<.01, with an R2 of only 0.52. Again, within this
model, it was found that the Independence global score (β= 1.45, p<.01) and the Tough
Mindedness global score (β= 1.55, p<.01) significantly predicted individuals’ SAPP
scores (see Table 9).
Total Sample Regression Analyses
A series of multiple regression was conducted on the entire sample to evaluate the
predictability of the global factors on the SAPP score. A general multiple regression
analysis was conducted and the overall model was significant, as seen in Table 10,
F(5,637)= 7.10, p<.01 and accounting for 5.3% of the variance. It was found that the
Independence global score (β= 1.58, p<.01) and the Tough Mindedness global score (β=
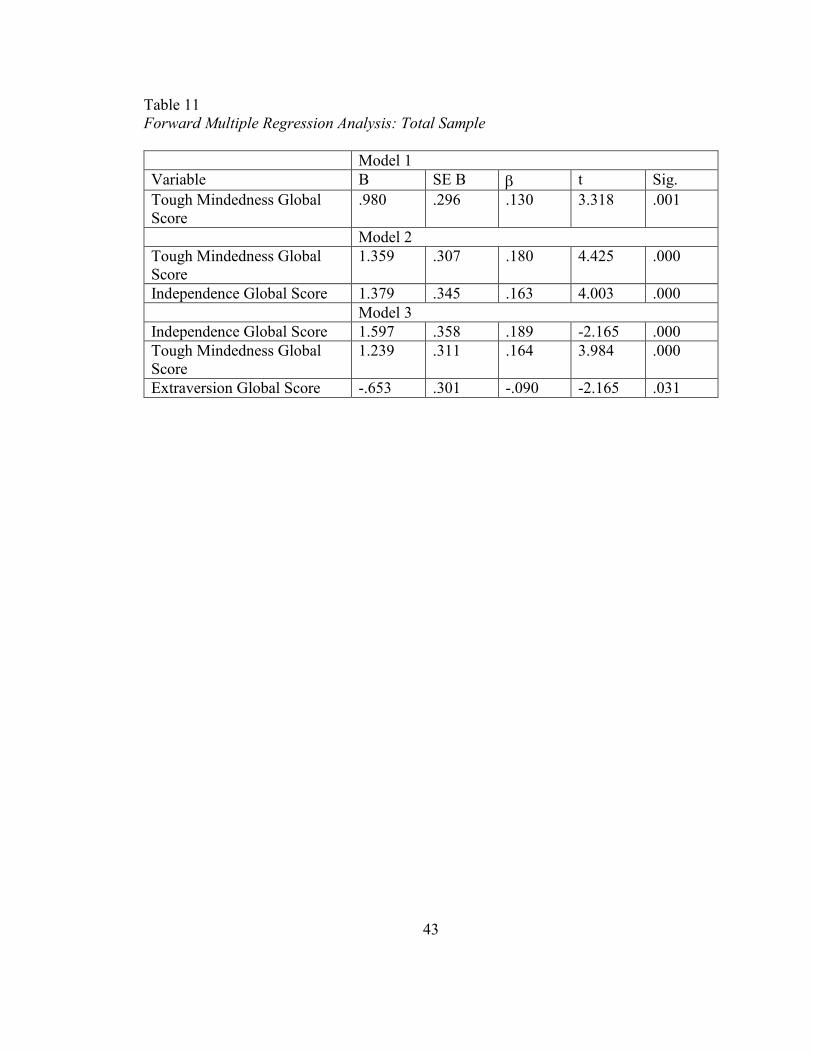
1.43, p<.01) significantly predicted individuals’ SAPP scores. A forward regression
generated significant results in across all Models as seen in Table 11. In Model 1, the

27
Tough Mindedness global score entered and the model was significant, F(1,641)= 11.01,
p<.01, with an R2 of only .017. In Model 2, the Independence score was added to the
Model and generated significant results, F(2,640)= 13.64, p<.01, with an R2 of only .041.
In Model 3, the Extraversion score was added to the Model, and also revealed significant
results, F(3,639)=10.71, p<.01, with an R2 of only .048. All global scores entered into
these Models were found to be significant predictors of individuals’ SAPP scores. The
backwards regression analysis revealed significant results in Model 1, as seen in Table
12, where all variables were entered, F(5, 637)= 7.10, p<.01, with an R2 of only .053. It
was found that the Independence global score (β= 1.58, p<.01) and the Tough
Mindedness global score (β= 1.43, p<.01) significantly predicted individuals’ SAPP
scores. In Model 2, the Anxiety global score was removed and revealed significant
results, F(4,638)= 8.77, p<.01, with an R2 of only .052. Similarly, it was found that the
Independence global score (β= 1.58, p<.01), the Tough Mindedness global score (β=
1.41, p<.01), and the Extraversion global score (β= -.66, p<.05) significantly predicted
individuals’ SAPP scores.
In summary, the most consistent and significant global factors that best predicted
one’s SAPP score included the Independence global score, the Tough Mindedness global
score, and the Extraversion global score.
Discussion
A series of multiple regression analyses were conducted on the half samples and
the entire sample to assess the predictability of the five global factors on individual’s
SAPP scores. In summary, the most significant predictors of an individuals’ SAPP scores

28
included the Independence global score, the Tough Mindedness global score, and with
some variability, the Extraversion global score.
The first hypothesis of the current study, that the global factor, Tough
Mindedness, would be a significant predictor of the SAPP score, was supported in this
study. That is, knowledge of this factor allowed for better prediction of one’s SAPP
score. With regard to the second hypothesis of the current study, that the global factor,
High Anxiety/Low Anxiety would also be a significant predictor of the SAPP score, was
not supported in this study.
Due to some variability in the results, future studies could include samples that
more closely approximate population demographics. For example, the current sample
consists of significantly more college-aged, Caucasian individuals than what would be
found in the general population.
The goal of this current study was to help develop the most accurate formula to
predict one’s SAPP score, based solely on the obtained 16PF global factors. Combining
these results with those from Mazur’s (2015) findings, which utilized the primary factors
as predictors, may well offer the best SAPP predictive formula. The next indicated study,
therefore, would be to replicate the above findings with the 21 total 16PF factors. Such
an effort is now underway. The value of having the most accurate 16PF-base specialty
scale of one’s self knowledge lies within its potential usefulness for research and clinical
purposes.

29
References
Afandor (2006). Expert validation of the Scale of Accurate Personality Prediction (SAPP)
(Unpublished master’s thesis). Florida Institute of Technology, Melbourne,
Florida.
Anderson (2002). A validation study of the Scale of Accurate Personality Prediction
using the Self-Monitoring Scale (Unpublished master’s thesis). Florida Institute of
Technology, Melbourne, Florida.
Back, M.D., & Vazire, S. (2012). Knowing our personality. In S. Vazire & T.D. Wilson
(Eds.), Handbook of self-knowledge. New York, NY: The Guilford Press.
Baldwin, J.M. (1906). Social and ethical interpretations in mental development (4th ed.).
New York: Macmillan.
Blankemeier, C.E. (2007). A validation of the Scale of Accurate Personality Prediction
using self versus family member comparison (Unpublished master’s thesis.
Florida Institute of Technology, Melbourne, Florida.
Cattell, H. & Mead, A. (2008). The sixteen personality factor questionnaire (16pf). In G.
J. Boyle G. Matthews & D. H. Saklofske The SAGE handbook of personality
theory and assessment: Volume 2 — Personality measurement and testing (pp.
135-159). London: SAGE Publications Ltd. doi: 10.4135/9781849200479.n7
Elgohossoian, R. (2012). Examining the test-retest reliability of the Scale of Accurate
Personality Prediction (Unpublished doctoral dissertation). Florida Institute of
Technology, Melbourne, Florida.

30
Ellis, A., Abrams, M., & Abrams, L. (2009). Personality theories: Critical perspectives.
Los Angeles: SAGE Publications.
Feshbach, S., & Weiner, B. (1982). Personality. Lexington, MA: D.C. Heath and
Company.
Ghorbani, N., Watson, P. J., & Hargis, M. B. (2008). Integrative self-knowledge scale:
Correlations and incremental validity of a cross-cultural measure developed in
Iran and the United States. The Journal of Psychology, 142(4), 395-412.
Hart, D., & Matsuba, M. K. (2012). The development of self-knowledge. In S. Vazire &
T. D. Wilson (Eds.), Handbook of self-knowledge. New York, NY: The Guilford
Press.
Hickey, J. (2005). A validation of the Scale of Accurate Personality Prediction using self
versus family comparisons (Unpublished master’s thesis). Florida Institute of
technology, Melbourne, Florida.
Hirsch, S. (2012). Test-retest reliability of the Scale of Accurate Personality Prediction
(Unpublished doctoral dissertation). Florida Institute of Technology, Melbourne,
Florida.
Hood, C.A. (2001). A measure of the accuracy of self-predicted personality traits
(Unpublished master’s thesis). Florida Institute of technology, Melbourne,
Florida.
James. W. (1998). Principles of psychology. Chicago: University of Chicago Press:
(Original work published 1890)

31
Layton, E.E. (2005). A validation of the Scale of Accurate Personality Prediction using
self versus other comparisons (Unpublished master’s thesis). Florida Institute of
technology, Melbourne, Florida.
Leary, M. R., & Tangney, J. P. (2003). Handbook of self and identity. New York, NY:
The Guilford Press.
Miller, K.L. (2000). A measure of the accuracy of self-predicted personality
traits. (Unpublished master's thesis), Florida Institute of Technology.
Rodriquez, M . (2011). Scale of Accurate Personality Prediction: A generalizability study
to the Hispanic population (Unpublished doctoral dissertation). Florida Institute of
technology, Melbourne, Florida.
Silva, M. (2011). Test re-test reliability of the Scale of Accurate Personality Prediction
(Unpublished doctoral dissertation). Florida Institute of Technology, Melbourne,
Florida.
Sverdlova, M (2013). Test-retest reliability of the Scale of Accurate Personality
Prediction (Unpublished doctoral dissertation). Florida Institute of Technology,
Melbourne, Florida.
Tesser, A. (2002). Constructing a niche for the self: A biosocial, PDP approach to
understanding lives. Self and Identity, 1, 185-190.
Vazire, S., & Carlson, E.N. (2010). Self-knowledge of personality: Do people know
themselves? Social and Personality Psychology Compass, 4, 605-620.
Vogt, D. S., & Colvin, C. R. (2005). Assessment of accurate self-knowledge. Journal of
Personality Assessment, 84(3), 239-251.

32
Winter, S.N. (2002). A measure of construct validity of the Scale of Accurate Personality
Prediction (Unpublished master’s thesis). Florida Institute of Technology,
Melbourne, Florida.
Wolf (2006). A re-validation of the Scale of Accurate Personality Prediction using self
versus peer comparisons (Unpublished master’s thesis). Florida Institute of
Technology, Melbourne, Florida.
33
Table 1
Summary of Demographic Statistics (Total Sample)
Demographic Variable Frequency Percent
Gender
Female 374 58.0%
Male 271 42.0%
Race
Caucasian 458 71.0%
Hispanic 77 11.9%
Asian 60 9.35%
African American 15 2.3%
Indian American 1 0.2%
Other 34 5.3%
Marital Status
Single 347 53.8%
Married 98 15.2%
Divorced 23 3.6%
Separated 5 0.8%
Widowed 3 0.5%
Occupation
Student 345 53.5%
White Collar 122 18.9%
Other 45 7.0%
Retired 19 2.9%
Unemployed/Homemaker 24 3.7%
Blue Collar 9 1.4%
Geography
Southeast 375 58.1%
Northeast 62 9.6%
Southwest 18 2.8%
Midwest 19 2.9%
Canada 1 0.2%
Education
Less The 12 Years 1 0.2%
High School Completed 31 4.8%
Some College 214 33.3%
College Degree 146 22.6%

34
Graduate Of Professional Training 253 39.2%
Table 2
Summary of Demographic Statistics (Half Sample 1 Evens Database)
Demographic Variable Frequency Percent
Gender
Female 178 55.1%
Male 145 44.9%
Race
Caucasian 227 70.3%
Hispanic 40 12.4%
Asian 31 9.6%
African American 8 2.5%
Other 17 5.3%
Marital Status
Single 170 71.4%
Married 51 21.4%
Divorced 12 5.0%
Separated 3 1.3%
Widowed 2 0.8%
Occupation
Student 168 59.6%
White Collar 64 22.7%
Other 25 8.9%
Retired 8 2.8%
Unemployed/Homemaker 11 3.9%
Blue Collar 6 2.1%
Geography
Southeast 188 79.0%
Northeast 31 13.0%
Southwest 9 3.8%
Midwest 9 3.9%
Canada 1 0.4%
Education
Less The 12 Years 1 0.3%
High School Completed 14 4.3%
Some College 111 34.3%
College Degree 86 26.6%
Graduate Of Professional Training 110 33.9%

35
Table 3
Summary of Demographic Statistics (Half Sample 2 Odds Database)
Demographic Variable Frequency Percent
Gender
Female 196 60.9%
Male 126 39.1%
Race
Caucasian 231 71.7%
Hispanic 37 11.5%
Asian 29 9.0%
African American 7 2.2%
Other 17 5.3%
Indian American 1 0.3%
Marital Status
Single 177 74.4%
Married 47 19.7%
Divorced 11 4.6%
Separated 2 0.8%
Widowed 1 0.4%
Occupation
Student 177 62.8%
White Collar 58 20.6%
Other 20 7.1%
Retired 11 3.9%
Unemployed/Homemaker 13 4.6%
Blue Collar 3 1.1%
Geography
Southeast 187 78.9%
Northeast 31 13.1%
Southwest 9 3.8%
Midwest 10 4.2%
Education
High School Completed 17 5.3%
Some College 102 31.7%
College Degree 84 26.0%
Graduate Of Professional Training 119 36.8%

36
Table 4
Pearson Chi-Square Analysis
Demographic Variable χ2 p
Race 1.28 .94
Marital Status 0.88 .93
Occupation 2.73 .74
Geography 1.05 .90

37
Table 5
General Multiple Regression Analysis: Half Sample Even
Model 1
Variable B SE B t Sig.
Self Control Global Scale -.957 .515 -.109 -1.858 .064
Independence Global Score 1.596 .516 .188 3.093 .002
Tough Mindedness Global
Score
1.187 .483 .154 2.455 .015
Anxiety Global Score .116 .439 .016 .264 .792
Extraversion Global Score -.924 .456 -.132 -2.024 .044
38
Table 6
General Multiple Regression Analysis: Half Sample Odd
Model 1
Variable B SE B t Sig.
Self Control Global Scale -.286 .530 -.031 -.540 .590
Independence Global Score 1.575 .501 .186 3.144 .002
Tough Mindedness Global
Score
1.617 .453 .218 3.570 .000
Anxiety Global Score .316 .455 .040 .695 .487
Extraversion Global Score -.336 .451 -.045 -.745 .457

39
Table 7
Forward Multiple Regression Analysis: Half Sample Odd
Model 1
Variable B SE B t Sig.
Tough Mindedness Global
Score
1.178 .409 .159 2.883 .004
Model 2
Independence Global Score 1.450 .482 .171 3.006 .003
Tough Mindedness Global
Score
1.551 .422 .209 3.675 .000

40
Table 8
Backward Multiple Regression Analysis: Half Sample Even
Model 1
Variable B SE B t Sig.
Self Control Global Scale -.957 .515 -.109 -1.858 .064
Independence Global Score 1.596 .516 .188 3.093 .002
Tough Mindedness Global
Score
1.177 .481 .153 2.445 .015
Extraversion Global Score -.967 .425 -.138 -2.274 .024
Model 2
Self Control Global Scale -.613 .368 -.068 -1.668 .096
Independence Global Score 1.573 .358 .186 4.397 .000
Tough Mindedness Global
Score
1.434 .329 .190 4.364 .000
Anxiety Global Score .215 .314 .028 .685 .494
Extraversion Global Score -.591 .319 -.082 -1.855 .064

41
Table 9
Backward Multiple Regression Analysis: Half Sample Odd
Model 1
Variable B SE B t Sig.
Self Control Global Scale -.286 .530 -.031 -.540 .590
Independence Global Score 1.575 .501 .186 3.144 .002
Tough Mindedness Global
Score
1.617 .453 .218 3.570 .000
Anxiety Global Score .316 .455 .040 .695 .487
Extraversion Global Score -.336 .451 -.045 -.745 .457
Model 2
Independence Global Score 1.586 .500 .187 3.172 .002
Tough Mindedness Global
Score
1.545 .432 .208 3.573 .000
Anxiety Global Score .325 .454 .041 .716 .474
Extraversion Global Score -.337 .450 -.045 -.749 .454
Model 3
Independence Global Score 1.581 .500 .187 3.164 .002
Tough Mindedness Global
Score
1.493 .426 .201 3.505 .001
Extraversion Global Score -.432 .430 -.058 -1.006 .315
Model 4
Independence Global Score 1.450 .482 .171 3.006 .003
Tough Mindedness Global
Score
1.551 .422 .209 3.675 .000

42
Table 10
General Multiple Regression Analysis: Total Sample
Model 1
Variable B SE B t Sig.
Self Control Global Scale -.613 .368 -.068 -1.668 .096
Independence Global Score 1.573 .358 .186 4.397 .000
Tough Mindedness Global
Score
1.434 .329 .190 4.364 .000
Anxiety Global Score .215 .314 .028 .685 .494
Extraversion Global Score -.591 .319 -.082 -1.855 .064
43
Table 11
Forward Multiple Regression Analysis: Total Sample
Model 1
Variable B SE B t Sig.
Tough Mindedness Global
Score
.980 .296 .130 3.318 .001
Model 2
Tough Mindedness Global
Score
1.359 .307 .180 4.425 .000
Independence Global Score 1.379 .345 .163 4.003 .000
Model 3
Independence Global Score 1.597 .358 .189 -2.165 .000
Tough Mindedness Global
Score
1.239 .311 .164 3.984 .000
Extraversion Global Score -.653 .301 -.090 -2.165 .031

44
Table 12
Backward Multiple Regression Analysis: Total Sample
Model 1
Variable B SE B t Sig.
Self Control Global Scale -.613 .368 -.068 -1.668 .096
Independence Global Score 1.573 .358 .186 4.397 .000
Tough Mindedness Global
Score
1.434 .329 .190 4.364 .000
Anxiety Global Score .215 .314 .028 .685 .494
Extraversion Global Score -.591 .319 -.082 -1.855 .064
Model 2
Self Control Global Scale -.612 .367 -.069 -1.669 .092
Independence Global Score 1.578 .358 .186 4.414 .000
Tough Mindedness Global
Score
1.408 .326 .187 4.316 .000
Extraversion Global Score -.663 .301 -.092 -2.202 .028

45
Appendix
16PF Profile Sheet
PRIMARY FACTORS
Factor Left Meaning Standard Ten Scores (STEN) Right Meaning
A: Warm Reserved,
Impersonal,
Distant
1 2 3 4 5 6 7 8 9 10 Warm,
Outgoing,
Attentive to Others
B: Reasoning
Concrete
1 2 3 4 5 6 7 8 9 10
Abstract
C: Emotional Stability
Reactive,
Emotionally
Chargeable
1 2 3 4 5 6 7 8 9 10
Emotionally Stable,
Adaptive,
Mature
E: Dominance
Deferential,
Cooperative,
Avoids Conflict
1 2 3 4 5 6 7 8 9 10
Dominant,
Forceful,
Assertive
F: Liveliness
Serious,
Restrained,
Careful
1 2 3 4 5 6 7 8 9 10
Lively,
Animated,
Spontaneous
G: Rule-Consciousness
Expedient,
Non-Conforming
1 2 3 4 5 6 7 8 9 10
Rule-Conscious,
Dutiful
H: Social Boldness
Shy, Threat-
Sensitive, Timid
1 2 3 4 5 6 7 8 9 10
Socially Bold,
Venturesome,
Thick-Skinned
I: Sensitivity
Utilitarian,
Objective,
Unsentimental
1 2 3 4 5 6 7 8 9 10
Sensitive, Aesthetic,
Sentimental
L: Vigilance
Trusting,
Unsuspecting,
Accepting
1 2 3 4 5 6 7 8 9 10
Vigilant,
Suspicious,
Skeptical, Wary
M: Abstractedness
Grounded,
Practical, Solution-
Oriented
1 2 3 4 5 6 7 8 9 10
Abstracted,
Imaginative, Idea-
Oriented
N: Privateness
Forthright,
Genuine, Artless
1 2 3 4 5 6 7 8 9 10
Private, Discreet,
Non-Disclosing
O: Apprehension
Self-Assured,
Unworried,
Complacent
1 2 3 4 5 6 7 8 9 10
Apprehensive, Self-
Doubting, Worried

46
Q1: Openness to
Change
Traditional,
Attached to
Familiar
1 2 3 4 5 6 7 8 9 10 Open to Change,
Experimenting
Q2: Self-Reliance
Group- Oriented,
Affiliative
1 2 3 4 5 6 7 8 9 10
Self-Reliant,
Solitary,
Individualistic
Q3: Perfectionism
Tolerated Disorder,
Unexacting
1 2 3 4 5 6 7 8 9 10
Perfectionistic,
Organized, Self-
Disciplined
Q4: Tension
Relaxed, Placid,
Patient
1 2 3 4 5 6 7 8 9 10
Tense, High Energy,
Driven
GLOBAL FACTORS
Factor Left Meaning Standard Ten Scores (STEN) Right Meaning
EX: Extraversion Introverted, Socially
Inhibited
1 2 3 4 5 6 7 8 9 10 Extraverted,
Socially
Participating
AX: Anxiety
Low Anxiety,
Unperturbed
1 2 3 4 5 6 7 8 9 10
High Anxiety,
Perturbable
TM: Tough Minded
Receptive, Open-
Minded, Intuitive
1 2 3 4 5 6 7 8 9 10
Tough Minded,
Resolute,
Unempathetic
IN: Independence
Accommodating,
Agreeable, Selfless
1 2 3 4 5 6 7 8 9 10
Independent,
Persuasive, Willful
SC: Self-Control
Unrestrained,
Follows Urges
1 2 3 4 5 6 7 8 9 10
Self-Controlled,
Inhibits Urges