an examination of time use patterns influence on academic
TRANSCRIPT

University of Central Florida University of Central Florida
STARS STARS
Electronic Theses and Dissertations, 2004-2019
2007
An Examination Of Time Use Patterns Influence On Academic An Examination Of Time Use Patterns Influence On Academic
Achievement Among African American And Hispanic Male High Achievement Among African American And Hispanic Male High
School Stude School Stude
Keith Riley University of Central Florida
Part of the Curriculum and Instruction Commons
Find similar works at: https://stars.library.ucf.edu/etd
University of Central Florida Libraries http://library.ucf.edu
This Doctoral Dissertation (Open Access) is brought to you for free and open access by STARS. It has been accepted
for inclusion in Electronic Theses and Dissertations, 2004-2019 by an authorized administrator of STARS. For more
information, please contact [email protected].
STARS Citation STARS Citation Riley, Keith, "An Examination Of Time Use Patterns Influence On Academic Achievement Among African American And Hispanic Male High School Stude" (2007). Electronic Theses and Dissertations, 2004-2019. 3317. https://stars.library.ucf.edu/etd/3317

AN EXAMINATION OF TIME USE PATTERNS INFLUENCE ON ACADEMIC
ACHIEVEMENT AMONG AFRICAN AMERICAN AND HISPANIC MALE
HIGH SCHOOL STUDENT ATHLETES
by
KEITH D. RILEY
B.S. University of Central Florida, 2000
M.A. University of Central Florida, 2002
A dissertation submitted in partial fulfillment of the requirements
for the degree of Doctor of Education in Curriculum and Instruction
in the College of Education
at the University of Central Florida
Orlando, Florida
Spring Term
2007
Major Professor: Larry Holt

ii
© 2007 Keith D. Riley
iii
ABSTRACT
The purpose of this investigation is to contribute to the body of knowledge in the area of
effective time management skills among African American and Hispanic male student
athletes and their academic achievement utilizing the Educational Longitudinal Study of
2002 (ELS: 2002) Base year thru the First follow-up database. The researcher has
assessed indicators (socioeconomic status, time use patterns, sports participation, and
race) within the construct of academic achievement among African American and
Hispanic male high school student athletes. Their contribution to the main effects
revealed that statistically significant differences exist between the non-sports participant
and sports participant groups. After controlling for time spent completing mathematics
homework and socioeconomic status, the findings revealed that time spent completing
math homework was significantly related to academic achievement for African American
and Hispanic male student athletes. Time spent watching television was not significantly
related to academic achievement for African American and Hispanic male student
athletes. For the variable time spent playing on the computer game, the analysis indicated
that the detrimental effect of time spent playing video/computer games was the same for
African American and Hispanic male student athletes. Finally, it is noteworthy that
effective use of time (i.e., playing video games less) and sports participation positively
influences academic achievement of African American and Hispanic males high school
student athletes. Strategies were uncovered for possible future research among African
American and Hispanic male student athletes to increase academic achievement levels.

iv
Wonderful Women
You listened to my words while talkin‟, sippin‟ tea, laughin‟ on the front porch.
When we sneaked into your room, You always knew that we were there.
Your presence is near.
You birth me, promised me, scold me and taught me how to be.
You inspired, guided, graded and displayed patience with me.
Your strength is incomparable.
You trust and believe in me. You use little words to empower me.
Your unwavering stance completes me.
You are in awe of me. You learn from me, challenged me and love me.
Your smiles are contagious to me. You wonderful women mean the world to me!
This dissertation is dedicated to my daughters – Kianna, Kei, Kiah, Kaena – and all those
who have supported my educational growth over the years. Without you, I would not
have had the inner strength to persevere through this academic journey.

v
ACKNOWLEDGMENTS
First, I give thanks to God for allowing me to accomplish all things through him. I wish
to thank the members of my committee who shared their time and knowledge with me
continuously throughout my doctoral studies. Their gentle but firm guidance is been
greatly appreciated. Dr. Larry Holt‟s, my committee co-chairperson, encouragement and
confidence in my abilities has empowered me to accomplish my goals. Dr. Witta‟s, my
committee co-chairperson, resolve and assistance is greatly valued. The calm reassurance
from Dr. Carolyn Walker-Hopp and her incredible insight during the writing process was
priceless and always gratefully received. Dr. Rebecca Hines invaluable suggestions that
helped improve my performance and ultimately, my success. Dr. Fritz Polite‟s
enthusiasm and passion is contagious and it fueled my zeal to finish. Dr. Vincent
Mumford has been instrumental as a mentor and with the pep talks throughout this
journey. To my Holmes Scholars and Curriculum and Instruction program cohort
members, you all have enhance this journey, thanks for making a difference in my life.
To Jawanna Owens, thanks for your well thought-out assistance and words of
encouragement. Finally, words alone cannot express the gratitude that I owe to my wife,
Hiromi Riley, for your love, encouragement, and support.

vi
TABLE OF CONTENTS
LIST OF FIGURES ........................................................................................................... ix
LIST OF TABLES .............................................................................................................. x
LIST OF ACRONYMS/ABBREVIATIONS .................................................................... xi
CHAPTER ONE: INTRODUCTION ................................................................................. 1
Statement of the Problem ............................................................................................... 3
Purpose of the Research .................................................................................................. 4
Relevance of Study ......................................................................................................... 5
Research Questions ......................................................................................................... 5
Conceptual / Theoretical Framework.............................................................................. 8
Limitations ...................................................................................................................... 9
Assumptions .................................................................................................................... 9
Definition of Terms....................................................................................................... 10
Overview ....................................................................................................................... 11
CHAPTER TWO: LITERATURE REVIEW ................................................................... 12
Introduction ................................................................................................................... 12
Extracurricular Activity Participation ........................................................................... 13
Extracurricular Activities in Middle and High School Athletics .................................. 16
Extracurricular Activities in College ............................................................................ 18
Other Activities ............................................................................................................. 19
Gender and Extracurricular Activities .......................................................................... 21
Ethnicity and Extracurricular Activities ....................................................................... 23

vii
The 1970 Adolescent Compared to Today's Adolescent .............................................. 27
Time Management ........................................................................................................ 34
CHAPTER THREE: METHODOLOGY ......................................................................... 39
Introduction ................................................................................................................... 39
Research Design............................................................................................................ 40
Sample........................................................................................................................... 42
Assessment Battery ....................................................................................................... 42
Mathematics Achievement ........................................................................................... 42
Socio-Economic Status (SES) ...................................................................................... 43
Race .............................................................................................................................. 43
Sports Participation and time use ................................................................................. 44
Data Processing and Analysis ....................................................................................... 46
Data Processing ............................................................................................................ 46
Within-Subjects Factors ............................................................................................... 46
Between-Subjects Factors ............................................................................................ 47
Data Analysis ............................................................................................................... 47
CHAPTER FOUR: FINDINGS ........................................................................................ 52
Introduction ................................................................................................................... 52
Descriptive Statistics ..................................................................................................... 52
Inferential Statistics ...................................................................................................... 57
Research Question 1 ..................................................................................................... 69
Research Question 2 ..................................................................................................... 71
Research Question 3 ..................................................................................................... 71

viii
CHAPTER FIVE: SUMMARY ........................................................................................ 74
Summary of Findings .................................................................................................... 74
Discussion ..................................................................................................................... 76
Recommendations for Future Research ........................................................................ 82
Conclusion .................................................................................................................... 83
APPENDIX A: IRB APPROVAL LETTER .................................................................... 86
APPENDIX B: DESCRIPTIVES AND CORRELATIONS TABLES ............................ 88
APPENDIX C: WITHIN-SUBJECTS CONTRASTS...................................................... 90
APPENDIX D: BETWEEN-SUBJECTS EFFECTS ....................................................... 92
APPENDIX E: ESTIMATED MARGINAL MEANS ..................................................... 94
LIST OF REFERENCES ................................................................................................ 101

ix
LIST OF FIGURES
Table 1: Variables and Repeated-Measures Analysis of Covariance Description ........... 51
Table 2: Descriptive Statistics for Categorical Variables ................................................. 53
Table 3: Descriptive Statistics for Continuous Variables ................................................. 54
Table 4: Correlations between Mathematics IRT Scores and Other Study Variables ...... 57
Table 5: Results of the Repeated-Measures Factorial Analysis of Covariance ................ 62
Table 6: Results of the Repeated-Measures Factorial Analysis of Covariance .............. 66

x
LIST OF TABLES
Figure 1: Time and Time Spent Playing Video Interaction ............................................. 67
Figure 2: Sports Participation and Time Spent Watching TV/DVDs Interaction ........... 69

xi
LIST OF ACRONYMS/ABBREVIATIONS
CATI Computer-assisted telephone interviewing
CHAMPS Challenging Athletes‟ Minds for Personal Success
ELS: 2002 Educational Longitudinal Study of 2002 base year through
the first follow-up
EAP Extracurricular Activity Participation
Math IRT Mathematics Item Response Theory
NCAA National Collegiate Athletic Association
NCES National Center for Education Statistics
NFHS National Federation of State High School Associations
NCLB “No Child Left Behind” Act
TEAP Total Extracurricular Activity Participation

1
CHAPTER ONE: INTRODUCTION
Interscholastic sport programs are a major feature of American high schools and yet, the
educational consequences are not fully known or understood. On one hand, supporters of
interscholastic sport programs argue that participation improves grades, keeps students in
school, and raises their educational expectations. School-sanctioned extracurricular
activities play an important role in the lives of students, parents, and school personnel as
well as a great deal of time and money are devoted to these activities. On the other hand,
others make the case that sports deflect time and energy away from the classroom.
Whether interscholastic sport programs support or interfere with the educational mission
of American high schools continues to be a point of serious debate.
The last three decades have witnessed a strong interest by a growing number of
researchers who investigated the social and educational consequences of the
interscholastic athletic experience. Beginning with James S. Coleman‟s (1961) influential
work, researchers have been especially inquisitive about the psychosocial correlates of
high school athletic participation. "Athlete" versus "non athlete" studies now number in
the hundreds. Researchers have a variety of variables that can be explored.
Research variables studied have included, high school athletic participation on grades,
choice of high school program, social values, popularity, peers' educational plans, global
and academic self-esteem, parents' and teachers' academic encouragement.

2
Other variables studied include competitive orientation, educational aspirations,
delinquent behavior, application and acceptance to college, academic progress in college,
graduation rates, occupational aspirations, status, earnings expectations and adult
earnings.
While the sheer quantity of student athletes‟ research is impressive, Coakley (1978)
revealed that the quality of sports participation research has drawn criticism. Stevenson
(1975) reviewed the research published through the mid-1970s and concluded that ". . . to
date, there is no valid evidence that participation in sport causes any verifiable
socialization effects. The stated educational legitimization of physical education and of
athletics must, therefore, remain in the realm of belief and should not be treated as fact"
(p. 299).
Greendorfer (1987) looked at the same literature and concluded that methodological
flaws in design, misinterpretation of correlational findings for cause-and-effect
relationships, inherent weaknesses of cross-sectional research designs, failure to control
for intelligence and social class, and the inability to explain the mechanisms through
which sport participation operates to bring about positive (or negative) changes renders
many of these studies suspect. Despite a host of positive outcomes attributed to sports
participation, Greendorfer wondered whether the direct, independent effects of athletic
participation can explain any of the psychosocial benefits attributed to sport.

3
Unfortunately, the great majority of the "sport participation effects" studies have focused
on white males and, to a much lesser extent, on white females (McPherson, 1980;
Melnick, Sabo, & Vanfossen, 1992). Only a few of studies have examined the effects of
high school athletic participation on black youth (i.e. Jordan, 1999), most of them
focusing on males and not a single study has looked at the impact of sport participation
on Hispanic youth. In a nation in which it is predicted that one of every three people is or
will be a member of a racial or ethnic minority, such a glaring omission begs for
correction.
Statement of the Problem
Many high school student athletes are required to deal with more responsibilities without
the skills necessary to balance daily events successfully. Some critics believe that
participation in extracurricular activities detracts from academic performance. Coleman
suggested a direct relationship of conflict between athletics and academics. His “zero-
sum theory” predicted that sports participation detracts from academic study time
resulting in low achievement. Others believe the opposite. According to Misra and
McKean (2000), the effective use of time lowers student athletes stress level, which in
turn may increase academic performance.

4
Purpose of the Research
The purpose of this study is to examine how time use patterns and sports participation
impact academic success of African American and Hispanic male student athletes.
Participation in high school interscholastic sports programs has shown to correlate with
the improvement of academic performance (Fejgin, 1994; Marsh, 1993; Snyder &
Spreitzer, 1992). However, Coleman‟s (1961) zero-sum model advocates that students
who put their energy into sports are less likely to pursue academic objectives. In theory,
he believes that youth do not have time or energy to achieve excellence and satisfaction
in both roles. The aim of this research is to disentangle how student athletes can perform
at a high academic level and balance the time commitment that is required to participate
in various sports.
In the 1998 National Educational Longitudinal Study, Jordan (1999) found a positive
relationship between black students‟ varsity sports participation and chronological
academic performance. Marsh‟s (1992) evaluation of total extracurricular activity
participation (TEAP) during the last two years of high school (based on the nationally
representative High School and Beyond data) found that, after controlling background
variables and sophomore outcomes, extracurricular activity participation had small but
statistically significant and positive relationships with 17 of 22 seniors.

5
The postsecondary outcomes included e.g., social and academic self-concept, educational
aspirations, coursework selection, homework, absenteeism, academic achievement, and
subsequent college attendance. Time use patterns of adolescents are mentioned with little
or no importance within the literature. More research concerning factors of time use may
reveal some interesting trends about academic achievement, time use patterns and sports
participation.
Relevance of Study
Currently, few studies explore time management factors e.g., (Schreiber & Chambers,
2002), which are associated with the academic success of African American and Hispanic
male high school student athletes. The design of this study will determine how effective
use of time and sports participation factors influence academic performance among
African American and Hispanic male high school student athletes. Due to the dearth of
literature about time use patterns among this population, specific strategies concerning
the effective use of time remains hidden.
Research Questions
The research questions for this study are:
1. What are the effects of Hispanic and African American male student athletes‟
time use patterns on their academic achievement, controlling for socio-economic
status and time spent completing mathematics homework?

6
There were three sub-questions:
1a. What are the effects of Hispanic and African American male student athletes‟
time spent in extracurricular activities on their mathematics achievement,
controlling for socio-economic status and time spent completing mathematics
homework?
1b. What are the effects of Hispanic and African American male student athletes‟
time spent watching TV/DVDs on their mathematics achievement, controlling for
socio-economic status and time spent completing mathematics homework?
1c. What are the effects of Hispanic and African American male student athletes‟
time spent playing video/computer games on their mathematics achievement,
controlling for socio-economic status and time spent completing mathematics
homework?
The second research question is:
2. What are the effects of Hispanic and African American male student athletes‟
sports participation on their academic achievement, controlling for socio-
economic status and time spent completing mathematics homework?
The third research question is:
3. Is there a difference between Hispanic and African American male students‟
mathematics achievement based on sports participation and time use, controlling
for socio-economic status and time spent completing mathematics homework?
7
There were four sub-questions for the third research question, each related to the
interaction between race and sports participation or race and the three time use variables:
3a. Is the effect of sports participation on mathematics achievement the same for
Hispanic and African American male student athletes, controlling for socio-
economic status and time spent completing mathematics homework?
3b. Is the effect of time spent on extracurricular activities on mathematics
achievement the same for Hispanic and African American male student athletes,
controlling for socio-economic status and time spent completing mathematics
homework?
3c. Is the effect of time spent watching TV/DVDs on mathematics achievement
the same for Hispanic and African American male student athletes, controlling for
socio-economic status and time spent completing mathematics homework?
3d. Is the effect of time spent playing video/computer games on mathematics
achievement the same for Hispanic and African American male student athletes,
controlling for socio-economic status and time spent completing mathematics
homework?

8
Conceptual / Theoretical Framework
Due to high stakes testing, schools are demanding student to achieve at a predetermine
level. In addition to the schools demands, student athletes must meet the physical, mental
and time requirements of their chosen sport. According to Coleman‟s theory (1961), these
demands facilitate less emphasis on academic requirements. Within prior literature,
Larson and Verma (1999) disputed the potential developmental benefits of extracurricular
activities due to overestimating results. These premises compelled the researcher to
desegregate nationally representative data on how effective use of time manipulates
academic success among high school student athletes.
Britton and Tesser (1991) described a simple theoretical model of time management
practices intended to maximize intellectual productivity. Their model specifies several
time management components: choosing goals and sub goals, prioritizing the goals,
generating tasks and subtasks from the goals, prioritizing the tasks, listing the tasks on a
“to-do” list, scheduling the tasks, and then completing the tasks. They predicted that
students with well-developed time management practices would accomplish more
intellectually and therefore would achieve academically. The goal is to provide student
athletes with strategies on how to perform at academically high levels before, during and
after sports participation by effectively utilizing a set of skills, tools and/or system to
accomplish their academic, professional and lifetime goals.
9
Limitations
1. The study is limited to the Educational Longitudinal Study of 2002 (ELS: 2002)
data set.
2. The range of this evaluation is narrow.
3. Pre-existing groups of only African American and Hispanic males (i.e. Sports
participants and non sports participants had already self-selected their group
membership by participating or not participating in sports)
4. The accuracy of students‟ survey response is limiting.
5. Mathematics is the only assessment measure utilized in this study.
Assumptions
1. Students are matched from within the target population.
2. Instruction concerning time management within the high school curriculum is
nonexistent.
3. Student athletes learn various skills from their sport but fail to transfer those skills
to the classroom setting.
4. Statistical methods assume that variables have normal distributions.
5. Repeated measurements taken over a period of time help reduce some of the
internal validity problems.
6. The Educational Longitudinal Study 2002 statistical data and original research
design is valid and reliable.
10
Definition of Terms
For clarity of understanding, the researcher will define the subsequent terms as follows:
Academic Achievement: measured by earning a passing standardized math test score.
Black or African American: a person having origins in any of the Black racial groups of
Africa.
Hispanic or Latino: a person of Cuban, Mexican, Puerto Rican, South or Central
American, or other Spanish culture or origin, regardless of race.
Non-athletes: students were defined as sports non-participants if they did not participate
in any sports or they indicated that their school did not offer sports.
Over sampling: deliberately sampling a portion of the population at a higher rate than the
remainder of the population. For example, in ELS: 2002, private schools have been over
sampled and Asians have been over sampled.
Point biserial correlation: a measure of association between a continuous variable and a
binary variable. It is constrained to be between -1 and +1.
Student athlete: students are considered as a sports participant if they indicated that they
participated in at least one sport at the intramural or interscholastic level.
Time use: concerns how time is allocated across a number of activities (such as time
spent at home, at work, shopping, socializing with friends, etc.)
Time Management: is a set of skills, tools, and various methods that work in tandem to
help you get more value out of your time with the aim of improving intellectually,
physically, and emotionally. It covers events from daily tasks to long term goals.
Zero-Sum Model: a model, which indicates that more of one variable results in less of
another. For example, more time involved in athletic participation leads to less time spent
on academics.
11
Overview
The purpose of this research is to contribute to the body of knowledge in the area of
effective time management among African American and Hispanic male student athletes
with regard to their academic achievement. The study is organized as follows: this
chapter is followed by a review of the existing literature on interscholastic sports
participation, time management skills and academic success. The literature review
discuss previous research concerning college sports, middle and high school athletics,
gender, other activities, students‟ social/ethnic background, time use of 1970‟s youth as a
comparison to today‟s adolescents, time management and stress. A few theories (i.e., zero
sum theory and developmental theory) which have research implications on sports
participation and academics are mentioned. They provide the theoretical base for this
dissertation. Based on the literature review, Chapter 3 describes the investigation process
of important variables that influence academic success among high school athletes. This
includes descriptions of research design, assessment battery, and the appropriate
statistical procedure for testing the hypotheses. Data analysis results are presented in
Chapter 4, in which each research hypotheses are scrutinized. In Chapter 5, research
findings, implications as well as recommendations are offered which will be an addition
to the debate.
12
CHAPTER TWO: LITERATURE REVIEW
Introduction
The purpose of this section is to review and synthesize what is known about time
management skills of adolescents and how sports participation influence academic
achievement of African American and Hispanic male high school student athletes. There
has been considerable debate regarding the advantages and disadvantages of participation
in athletics, particularly with regard to the relationship between athletic success and
academic achievement. Researchers (Fejgin, 1994; Marsh, 1993; Snyder & Spreitzer,
1992) have made a case, which establishes the benefit of sports programs at the high
school level.
However, locating research or information pertaining to the time management skills of
student athletes was a difficult task. The research parameters of this review were broken
down into a variety of methods. First, a search was conducted on student athletics and
academics and how those interacted with one another. Second, the researcher investigated
other activities in which may cause schedule conflicts on a daily basis for student
athletes. Third, a search was performed on the time management skills (or lack thereof)
of students in general.
The student athlete is representative of the typical student, not the NBA All-Star or NFL
Pro Bowler. The explanation of data simply reflects on the pros and cons of sport as a
high school activity.

13
Factors of collegiate sports, middle and high school athletics, gender, other activities (i.e.,
intramural sports, homework, hanging out with friends and etc.), students‟ social/ethnic
background, time use of 1970‟s youth as a comparison to today‟s adolescents and stress
are discussed. The following section will discuss peer-reviewed research concerning the
relationship between interscholastic sports participation and time use patterns as it relates
to academic achievement of high school student athletes.
Extracurricular Activity Participation
The comprehensive, developmental model for school counseling has recently been
described by Gysbers and Henderson (2000) and promoted by other researchers (Borders
& Drury, 1992; Gysbers, Hughey, Starr, & Lapan, 1992). This model fosters the
development of student competency in broad areas of lifelong learning, personal
effectiveness, and life roles. Extracurricular activity participation (EAP) is one way to
promote learning and development in some of these areas. Unfortunately, extracurricular
activity participation can be perceived as interfering with academic success. Students or
their parents often use academic pressures as a reason to avoid extracurricular activity
participation. Extracurricular activity participation has been shown to be a positive factor
in the overall development of adolescents (Holland & Andre, 1987; Taylor & Chiogioji,
1987).

14
In addition, Extracurricular activity participation has been associated with positive
student outcomes including higher career aspirations (Marsh, 1992; Otto & Alwin, 1977;
Picou, 1978; Spady, 1970), better school attendance (Jable, 1986; Laughlin, 1978),
improved social standing among peers (Caulfield, 1980; Spady, 1970), and reduced
delinquency (Landers & Landers, 1978). Furthermore, researchers saw beneficial
consequences of extracurricular activity participation in lower dropout rates and less
involvement with drugs. Student achievement in extracurricular activities was identified
as the variable most predictive of success in later life (Joekel, 1985).
Additional support for extracurricular activity participation comes from self-complexity
within the research. Linville (1987) demonstrated that diversity in abilities and group
membership may serve as a buffer against stress. Extracurricular activity participation
enables students to master new skills and explore different roles outside the classroom
setting. Another assertion of the inherent value in self-complexity and diversity is the
advice that "No life component should contribute more than one-third to self-esteem"
(McCarthy & McCarthy, 1992, p 9). Thus, it seems that healthy human development is
balanced across many domains. This balance is the goal of comprehensive,
developmental school counseling programs.
The relationship between academic performance and interscholastic athletics has been of
particular interest to investigators. Eidsmoe (1964) found that athletes had a higher grade
point average (GPA) than the overall class average. Edwards (1967) and Schafer and
Armer (1968) compared athletes with non-athletes.

15
Their findings showed athletes to have slightly higher grade point averages than did non-
athletes. Harvancik and Golsan (1986) also found a small positive correlation between
high school grade point average and extracurricular activity participation. Another small
but statistically significant relationship between academic achievement and
extracurricular activity participation was found by Marsh (1992). Laughlin (1978) took a
somewhat different approach by comparing the academic performance of high school
wrestlers both in-season and out-of-season. Grade point averages were better during the
wrestling season than when these athletes were not participating in the sport.
Extracurricular activity participation research on athletes has not been without its critics.
Holland and Andre (1987) identified many weaknesses in their review of extracurricular
activity participation studies. They warned of the potential bias of self-selection on
results and enumerated several confounding variables that might interact with
extracurricular activity participation and various outcome measures. These confounding
variables include family socioeconomic status, size of the school, extent of student
participation, student ability, degree of participant success in the activity, student self-
esteem, and the influences of significant others.
In past extracurricular activity participation research, there have been some omissions.
Otto and Alwin (1977) reported that little evidence exists on the effects of non-athletic
activities. Other common omissions in the extracurricular activity participation research
include the absence of information on such factors as race, type of activity, age, length of
student involvement, and social and political context (Taylor & Chiogioji, 1987).

16
According to Dickman and Lammel (2000), there is an increase effort by school
administrators to assure genuine academic achievement of high school student athletes.
Extracurricular Activities in Middle and High School Athletics
Although the research in this area is sparse, it appears that there are differences in
participation in extracurricular activities related to the grade level of the student. For
example, Posner and Vandell (1999) recommended that how students utilize their time
after school changes as grade level increases. Specifically, they found that the amount of
time spent in unstructured activities decreased by one half from third to fifth grade.
Extracurricular activity participation rates of student do not solely depend on the structure
of the school the students attend or the students‟ grade level. For example, participation
rates for students in the same grade are higher when those students are not the youngest
students in the school (Blyth, Simmons, & Bush, 1978; Gifford & Dean, 1990). In other
words, sixth graders in a K–6 school are likely to have higher extracurricular
participation rates than sixth graders in a middle school (6–8) where they are the
youngest students (Blyth, Simmons, & Bush, 1978). This pattern also applies to ninth
graders (Gifford & Dean, 1990).
By far, high school students represent the largest group whose extracurricular activities
are studied intensively, and the focus is on their athletic participation. Holland and Andre
(1987) conducted a comprehensive review of the literature examining the relationship
between participation in extracurricular activities and academic achievement.

17
They found discrepancies among male student athletes and non athletes concerning the
accuracy of GPAs. Further within the literature review, lower scores on standardized
achievement test scores (e.g., SAT) among male student athletes revealed that
extracurricular involvement in sports accounted for lower test scores than non-athletes.
However, no significant differences were found between female student athletes and non-
athletes.
In a recent study, Silliker and Quirk (1997) examined high school students‟
extracurricular involvement and academic performance. This partnership studied 123
high school students who participated in interscholastic soccer during the first quarter of
the school year and were not involved in any other major extracurricular activity during
the second quarter. The results indicated that, during the soccer season (the first quarter);
soccer players had higher GPAs than out of season (the second quarter). Attendance
during the season was better. However, off-season attendance results were not
statistically significant.
Broh (2002) also scrutinized the relationships between athletics and student outcomes.
She analyzed data on students from the National Educational Longitudinal Study of 1988
(NELS-88), including the first and second follow-up see (Haggerty, Dugoni, Reed,
Cederlund, & Taylor, 1996). Results of her analysis divulged that participating in
interscholastic sports was related to improved mathematics grades, English grades, and
mathematics test scores, even after controlling for the selection of higher performing
students.

18
Extracurricular Activities in College
Hood, Craig, and Ferguson (1992) examined the effect of nonacademic activities such as
work, watching television, and socializing on the academic achievement of freshman
athletes and non-athletes at the University of Iowa. In this study, each athlete was
matched with a non-athlete who was similar on variables such as gender, ethnicity,
SAT/ACT scores, resident and nonresident status. The researchers also compared the
matched groups to a group of randomly selected students from the university, for a total
sample size of 2,856. They found that athletes achieved similar grades to non-athletes
with similar backgrounds and abilities, with the athletes and non-athletes performing at a
level slightly below that of the random sample of university students.
Terenzini, Pascarella, and Blimling (1996) reviewed the literature examining the effects
of college students‟ out of - class experiences on academic, intellectual, and cognitive
outcomes. They found that student athletes achieved at about the same level as non-
athletes when pre-college achievement and aptitude were taken into account. They also
found that level of participation in athletics had a negative relationship to scores obtained
on standardized graduate admissions tests.
In studying extracurricular activity involvement, Terenzini and colleagues found “little
consistent evidence suggesting that extracurricular involvement per se has a direct impact
on students‟ academic or intellectual development” (p. 155). The studies by Terenzini et
al. (1996) and Hood et al. (1992) suggest that, overall, extracurricular activities do not
have major positive or negative effects on student achievement at the college level.

19
Other Activities
Some researchers have ventured beyond athletics to other extracurricular activities.
Marsh (1992) conducted one of the first large-scale studies on extracurricular activities
using the High School and Beyond database. He examined the relationship between the
number of total extracurricular activity participation (TEAP) and a variety of outcome
variables in a weighted sample of more than 4,000 students. Controlling for background
variables and sophomore outcomes, Marsh reported that, in senior year, total
extracurricular activity participation was positively associated with “social self-concept,
academic self-concept, taking advanced courses, time spent on homework, postsecondary
education aspirations, GPA, parental involvement, [and lower] absenteeism” (p. 557) for
students across a variety of backgrounds. Marsh noted that the only meaningful effect
sizes were for the relationships with academic and social self concept, but argued that
participation in extracurricular activities was important because it can lead to “increased
commitment to school and school values, which leads indirectly to increased academic
success” (p. 560).
Walker and Stott (2000) are less optimistic, finding that a parallel can be drawn between
pressures to perform in sports and pressures on schools to perform. In developing this
analogy, the authors hold that schools, like athletes, have been exposed to the temptation
of artificially inflating performance levels. The application of such strategies, although
sometimes successful in the short term, has led to a number of unpleasant side effects and
enduring little change within classrooms. This has given rise in some areas to negative
feelings about the future of education.

20
Eccles and Barber (1999) looked at the risks and benefits of five different types of
activities: prosocial activities, team sports, school involvement, performing arts, and
academic clubs. They analyzed data on 1,259 students who participated in the Michigan
Study of Adolescent Life Transitions from 1983, when they were in the sixth grade,
through 1997. Academic achievement was measured using 10th- and 12th-grade GPA
and subscale scores from the Differential Aptitude Test. The results of the longitudinal
regression analysis showed that participation in any of the five types of activities studied
resulted in a better-than-predicted 12th-grade GPA. They also found that students who
participated in sports, performing arts, and school involvement activities reported liking
school more over the years studied. These findings were consistent with Marsh‟s (1992),
hypothesis about the effect of extracurricular activities on students‟ commitment to
school.
Broh (2002) also reported that the differential effects of extracurricular activities were not
limited to interscholastic and intramural sports. She found that participation in music
groups was positively related to both math and English grades and math test scores;
participation on student council was positively related to both sets of grades; and
participation in yearbook was positively related to English grades alone. However,
cheerleading was not related to either grades or test scores, and participation in vocational
clubs had a small, but significant negative relationship to math and English grades and
reading test scores.
21
Participation in interscholastic sports was also related to increased self-esteem, a more
internalized locus of control, spending more time on homework, and increased contact
among parents, students, and teachers. However, participation in intramural sports, as
opposed to interscholastic sports, was negatively related to math and English grades and
test scores.
Gender and Extracurricular Activities
Research has found consistent gender differences in preferences for participation in
extracurricular activities e.g., (Fejgin, 1994). Evans, Schweingruber, and Stevenson
(2002) examined students‟ interests in large samples of 11th graders in the United States
(N = 1,052), Taiwan (N = 1,475), and Japan (N = 1,119). They uncovered that boys
preferred sports and girls preferred music and art, preferences that may well be related to
differences in the competence of beliefs in those areas that students have from as early as
first grade (Fredricks & Eccles, 2002).
Similarly, in a study using telephone interviews with 194 low-income White and African
American students in grades 3–5, Posner and Vandell (1999) found that females
participated in academic activities and socialized at higher rates than males, whereas
males participated in coached sports at a rate seven times greater than females.
According to McNeal‟s study (1999), males‟ higher participation rates in sports have also
been uncovered after controlling for variables like socioeconomic status and ethnicity.

22
As for black female athletes, the picture is far different. With the exception of
competitive orientation (Wells & Picou, 1980), the research findings are either mixed or
negative. For example, mixed effects have been reported for encouragement to attend
college from parents, teachers, and peers (Hanks, 1979; Wells & Picou, 1980),
educational aspirations (Hanks, 1979; Picou & Hwang, 1982; Wells & Picou, 1980), and
number of years of postsecondary education (Hanks, 1979; Picou, McCarter, & Howell,
1985). Negative findings have been reported for educational attainment, occupational
status, and adult earnings (Picou, McCarter, & Howell, 1985).
In the Worrell and Bucknavage study, females reported significantly higher participation
rates in music, dance, drama/acting, and debate. Sports participation by females has a
number of favorable outcomes that likely contribute, however indirectly, to improved
academic performance. Zill, Nord and Loomis(1995) found that female athletes were
substantially less likely to become pregnant, drop out of school or consume tobacco
products. (The last is a marker for poor academic performance.)
In a study of a representative sample of 6th, 8th, and 10th graders in Iceland (N = 3,270),
Vilhjalmsson and Kristjansdottir (2003) found that the gender difference in athletics was
related to males‟ higher rates of participation in organized sports clubs. Worrell and
Bucknavage (2004) reported similar findings in a study of 1,300 students attending
prestige secondary schools in Trinidad. They observed that males participated at greater
levels in all of the major sporting activities in school, with significant differences in
soccer, cricket, and table tennis.
23
Ethnicity and Extracurricular Activities
Studies that have examined the effects of high school athletic participation on black male
youth present a confusing mélange of contrasting findings. Sports participation seems to
have a positive effect on educational aspirations (Braddock, 1981; Hanks, 1979; Picou,
1978; Picou & Hwang, 1982; Wells & Picou, 1980), competitive orientation (Wells &
Picou, 1980), self-esteem (Braddock, 1981; Hanks, 1979), college enrollment (Braddock,
1981), college graduation (Braddock, 1981), and adult earnings (Picou, McCarter, &
Howell, 1985).
Sports participation has mixed effects on grades (Braddock, 1981; Picou, 1978; Wells &
Picou, 1980), encouragement to attend college from parents, teachers, and peers (Hanks,
1979; Picou, 1978; Wells & Picou, 1980), number of years of postsecondary education
(Braddock, 1981; Hanks, 1979; Picou, McCarter, & Howell, 1985), and no effect on
membership in leading crowds (Wells & Picou, 1980), choice of high school program
(Braddock, 1981), peers' educational plans (Picou, 1978), and occupational status (Picou,
McCarter, & Howell, 1985).
The impact of high school athletic participation on Hispanic youth, male or female, has
never been directly studied. Consequently, no findings, let alone conclusions, are
available at the present time. Despite the fact that thousands of black and Hispanic youth
participate daily in interscholastic athletic programs, little is known about the social and
educational consequences of their participation.

24
To further complicate matters, there is evidence to support the belief that adolescents'
values and social roles are predominantly shaped by the communities in which they live
and the adults in their lives. Taylor (1999) points to popular misperceptions among many
black youths (e.g., “Although far more African Americans are physicians than NBA
players, pervasive mass-media images say otherwise”).
Several studies have examined ethnic minority students‟ participation in extracurricular
activities. In one study, Lisella and Serwatka (1996) looked at the relationship between
extracurricular participation and academic achievement in minority students attending
urban schools. Participants consisted of 766 eighth-grade students of African American,
Hispanic, or American Indian descent attending poor inner-city schools who had been
included in NELS-88.
The pattern of extracurricular involvement for minorities was similar to that of the
general student body and was also similar to the pattern for their White peers attending
the same inner-city schools. Lisella and Serwatka did find that male minority students
who participated in extracurricular activities had significantly lower academic
achievement than nonparticipating males, but this pattern did not apply to minority
female students.
Other researchers have utilized the NELS-88 data to examine extracurricular participation
and academic achievement in minority students. Schreiber and Chambers (2002) looked
at data from a stratified sample of 8,305 8th- and 10th-grade minority students included
in NELS-88.

25
Extracurricular activities were categorized as (a) in-school/academic/ organized, (b) in-
school/nonacademic/organized, (c) out-of school/nonacademic/ organized, (d) out-of
school/nonacademic/ non-organized, and (e) out of-school/ academic/non-organized.
Results indicated that, in general, in-school, academic, and organized activities predicted
academic achievement, but the effects were different across school years, academic
content areas, and ethnic groups.
For example, in eighth grade, in-school/ academic/organized activities were positively
related to mathematics and science achievement for Asian/Pacific Islanders; to
mathematics, reading, science, and geography/ history for White students; and to
geography/history for Latinos, but were not related to any subject area for African
Americans. Also, in eighth grade, out-of school/ academic/non-organized activities were
related to mathematics and reading achievement for African Americans; mathematics,
reading, and science for Asian Americans; and all four subject areas for Caucasians and
Latinos.
In another study using NELS-88 data, Gerber (1996) looked at eighth-grade African
American and White students who were attending public schools and reported a positive
association between participation and academic achievement; however, the relationship
was stronger for White than for African American students. More relevant to the present
study, Gerber compared the participation rates of the African American and White
students and found that, in general, African American students reported greater
participation than White students did. However, there were differences when individual
activities were examined.

26
White students reported higher participation in band/orchestra, dance, and religious
organizations, whereas African American students reported higher participation in
yearbook and computer clubs. McNeal (1998) also used the NELS-88 data, but
statistically controlled for socioeconomic status and gender when looking at the
participation rates of ethnic minorities. The results of this analysis were consistent with
Gerber‟s and showed that differences in extracurricular participation rates favored racial
and ethnic minority students.
In a recent study, Brown and Evans (2002) compared the participation rates of 1,739
students in grades 7–12. Students from several ethnic groups, including African
American (17%), Asian American (15%), European American (22%), Hispanic American
(18%), and mixed ethnicity (22%), were asked if they participated in sports activities,
fine arts activities, in-school activities, or out-of-school activities. The results highlighted
significant differences among ethnic groups for all activities except sports. For example,
African Americans and European Americans reported significantly higher participation
than Hispanic Americans in fine arts, and Asian Americans were less involved in out-of-
school activities than European Americans.
Studies on the extracurricular participation rates of different ethnic groups yield a
complex pattern of findings with no clear trends. The studies suggest that rates of
participation and the relationship of extracurricular activities to academic achievement in
ethnic minority groups differ by gender, age, and ethnicity, and are as complicated as the
patterns reported for participation in sports activities in other studies e.g., (Broh, 2002).

27
The 1970 Adolescent Compared to Today's Adolescent
Today‟s adolescent perceived themselves as having less time to play outside and to be
socially active than the adolescents of the past. Do they have more pressures placed on
them or are they just different? Major changes have occurred in U.S. society, in
American family life, and in the nation‟s schools during the last three decades.
These include:
Demographic changes, such as the growing racial and ethnic diversity of the
youth population, declines in average family size, and a shrinking of the
adolescent and young adult segments of the population, relative to other
segments, as a result of the „birth dearth‟ of the 1970s (Aguinaga, 1994);
Family life changes, such as increases in divorce, unmarried child bearing, and
maternal employment (Fox, Connolly, & Snyder, 2005).
The proportion of Blacks completing college increased between 1975 and 2000
The rate for Hispanics has fluctuated between 1975 and 2000 without a
statistically significant pattern of increase (Knapp et al., 2005);
Economic changes, such as stagnant or declining wage rates, especially for young
workers with limited skills, a smaller payoff for having a high school diploma and
a bigger payoff for a college degree, greater income inequality, and increases in
child poverty (Zill & Nord, 1994);

28
Cultural changes from 1978, such as the feminist movement, and a shift in the
traits that parents value in their children, with parents nowadays placing more
emphasis on independence and autonomy, whereas parents in the past placed
more emphasis on conformity (Alwin, 1988; Zill, Booth, & Dunn, 1996).
Educational changes, such as the „back to basics‟ movement, increases in the
expectations of both parents and youth themselves as to how far they will go in
school. At ages 9,13,17, the average scores for Black students were higher in
2004 than in 1973; Hispanic students‟ average scores in mathematics were higher
in 2004 than in 1973; the differences in average scores for White and Black
students decreased between the first (1973) and the most recent (2004)
assessments in mathematics, although White students continued to outperform
Black students in 2004 (Wirt et al., 2004).
A greater percentage of adolescents in 1999 than in 1978 had access to a
computer to learn mathematics, studied mathematics through computer
instruction, and used a computer to solve mathematics problems (Knapp et al.,
2005).

29
A number of these developments might be expected to have impacts on the daily lives
and time-use patterns of U.S. adolescents. The problem is that different developments
seem to have varying or even conflicting implications for youthful time use, and there is
no grand theory that would enable one to combine the disparate influences into one
integrated hypothesis about how adolescent activity patterns have evolved (Zill & Nord,
1994). There are, however, two contrasting hypotheses that seem to emerge from some of
the educational developments enumerated above.
One is that today‟s high school students should be spending more time studying, doing
homework and participating in academic clubs, than participating in other activities
(Coleman, 1961). The reasons for predicting the higher educational aspirations of
today‟s youth (and their parents) are as follows: more students are enrolled in college-
preparatory programs and taking challenging course like algebra (Knapp et al., 2005),
schools require pupils to demonstrate at least minimal competence in core academic
subjects before they are promoted or graduate from high school.
On the other hand, there are reasons to question the argument that time in academic
pursuits is increasing. Between 1994 and 2004, the total college enrollment rates of 18- to
24-year-olds have increased by 30 percent. During the same time period, the number of
men enrolled rose 16 percent, while the number of women enrolled increased by 25
percent (Lemke & Gonzales, 2006).

30
However, thousands of students that graduate from high school each year are
academically unprepared for college. The consequence is that it is relatively easy for a
high school graduate to get into some colleges nowadays; demonstrated high
achievement is not a prerequisite (though it still at the most prestigious and selective
universities).
Indeed, many colleges now give remedial courses to freshmen, teaching skills that were
once thought to be mandatory for high school graduates. As a result, approximately Forty
percent of freshmen at two-year institutions and twelve to twenty-four of freshmen at
two-year colleges take at least one remedial reading, writing, or mathematics course
(Parsad and Lewis , 2003). The difficult challenge for students is becoming prepared
academically for college coursework.
At the secondary level there has also been grade inflation in American high schools, with
many more students getting A‟s and B‟s than did so in the past (Suggs, 2004). With the
expectation that nearly everyone should complete high school, school administrators are
reluctant to fail students. One result is that students in many high schools can get away
with not doing all their homework.
Further, with more adolescents in single-parent homes were less likely to participate in
either sports or other activities, parental supervision of their adolescent‟s homework
completion may be less extensive than it was in the past (Baum, 1998).
31
Thus, the contrasting hypothesis is that the average amount of time high school students
spend doing homework and studying has not increased, even if teachers are assigning
more homework now.
Today‟s adolescents 53.5 percent of students enrolled in high schools participate in
athletics (National Federation of State High School, 2006). The financial support for high
school athletics and activities has been declining due to a relatively narrow vision of what
„the basics‟ of education should be. On the other hand, there is survey evidence from the
Educational Longitudinal Study of 2002 that a variety of extracurricular activities
remains available to almost all students in public high schools in the United States. Also,
participation in music/performing arts showed a significant increase in popularity
between 1990 and 2001 (Ingels et al., 2005a).
Comparison of student time use reports from the 1990s with parallel reports from the
mid-1970s show more constancy than change. The changes that have occurred are most
likely to be in a negative rather than a positive direction as far as intellectual effort and
constructive use of time are concerned. In 1990, for example, 10th
grade students in the
National Educational Longitudinal Study were asked to estimate the total number of
hours per week they spent doing homework outside of school.

32
The average (median) 10th
grade student in 1990 reported spending about three hours per
week doing homework for all subjects. The percentage reporting some homework time,
but less than five hours per week declined slightly, from 63 percent to 59 percent, while
the percentage reporting ten or more hours of homework per week increased, but just
barely, from 11 percent to 14 percent.
Forty-six percent of 12th
grade students in 1976 reported spending five or more hours per
week on homework, and so did 46 percent of 12th
grade students in 1992. On the other
hand, 39 percent of 12th
grade students in 1976 reported reading six or more books during
the year that were not assigned by teachers, whereas only 26 percent of 12th
grade
students reported doing this much voluntary reading in 1992.
Areas in which significant change in time use did occur between 1976 and 1992 included
the following:
Reading of books, magazines, or newspapers, where the number of 12th
grade
students who read daily declined from 59 percent to 47 percent;
Working around the house, yard, garden, or car, where the number who did
household chores daily declined from 41 percent to 29 percent, while the number
doing chores at least once a week fell from 78 percent to 68 percent;
Attending religious services, where the number going at least once a week
declined from 41 percent to 32 percent.

33
Two leisure-time activities that have become more frequent are going to parties and
creative writing: the percentage of 12th
grade students who report partying with friends at
least once a week increased from 31 percent in 1972 to 38 percent in 1992. The
proportion, doing some creative writing once a week or more often, climbed from 15
percent in 1976 to 22 percent in 1992. Apart from the modest increase in creative writing,
there was one other small sign of growth in academically-oriented activity. The
proportions of 10th grade students participating in academic clubs at school were
increased by a fifth, from 26 percent to 31 percent, between 1980 and 1990.
The increase was observed when reports of participation in specific types of
extracurricular activities in the National Educational Longitudinal Study survey of 10th
grade students were compared with responses to similar questions in the High School and
beyond base year survey of 10th
grade students. On the other hand, the same comparison
showed that participation in band, orchestra, or chorus was down by nearly a third, from
31 percent in 1980 to 22 percent in 1990. In addition, involvement in traditional hobby
clubs, such as photography or chess, was down by two-thirds, from 21 percent in 1980 to
7 percent in 1990 (National Center for Education Statistics, 1994).
The reasons for these declines are not altogether clear. Many people believe that fewer
high schools are offering organized music, art, drama, and hobby activities because of
budget cutbacks and policies that downplay the arts in favor of science, math and other
„core‟ subjects. As noted early, however, it has been indicated that such programs remain
available in most public high schools (Ingels, et al., 2005a).

34
The growth of personal computers in schools may have been partly responsible for the
decline in traditional hobby clubs. Levels of participation in school-sponsored athletic
teams were comparable to those reported by 10th
grade students a decade earlier.
Participation in cheerleading and drill teams was down by a third over the decade,
however.
Time Management
Stuart (1985) hypothesized that athletes face special circumstances, by noting that
practice and performance time reduces the time and energy for academics, and
consequently, this can lead to lower scores not only in classrooms but also on
standardized tests. It is because of the lower scores, Stuart asserts, that some athletes may
have to work harder to succeed academically. In addition to having the challenge of
scheduling conflicts between class and competition, their behavior is scrutinized both on
and off the field, as athletes have a higher social profile. Due to the fact that students only
spend a few hours a day in classes, some colleges require or give students the option to
attend study skills and time management workshops (Axelrod-Contrada, 1998).
In an investigation conducted by Misra and Mckean (2000) time management and
commitments provide some good insight of college student‟s stress level when it comes
to time management (or lack thereof). Misra and Mckean (2000) analyzed academic
stress, anxiety, time management and leisure satisfaction among 249 university
undergraduates and found that females had more effective time management skills than
did males.

35
Females also experienced higher academic stress and anxiety. Another finding revealed
that males benefited more from leisure activities than their female counterparts did.
The multivariate analysis results uncovered the factors of anxiety, time management and
leisure satisfaction as predictors of academic stress. The researchers concluded that
strong time management skills seemed to lower academic stress in this particular study.
Because of this result, it was stressed that perhaps faculty members and counselors could
be of enormous benefit in this regard by emphasizing participation in time management
seminars in attempts to improve academic success and well-being of students (Misra &
McKean, 2000).
The next study unveiled other concerns, especially as it pertained to time management
among Canadian collegiate – an experience that, according to the researchers, is similar
to U.S. collegiate in Division 1 colleges. They pointed out that, despite the fact that
student athletes benefited from an immediate social circle, subsequent social actions were
restricted almost entirely to teammates and other athletes. The researchers also
acknowledged that more would have to be done to determine the overall impact of
socialization on the future of these athletes (Miller and Kerr, 2002).
A group of researchers have pointed out that other experts also discussed the question of
college graduation based on athletic prowess (Peltier, et al., 1999). The Knight
Foundation Commission, for example, pointed out that admission and graduation
statistics for athletes was far different from those for non-athletic students.

36
The commission revealed, also that in a typical Division 1 college setting, only 33
percent of male basketball players and 37.5 percent of football players graduated within
five years. In other words, it was found that “the majority of athletes entering basketball
and football programs at Division 1 schools were unlikely to turn their aspirations of
graduation into reality” (Peltier, et al., 1999, p. 234). Again, this is because of the time
spent in big-time sports programs – during in-season times, students can expect to spend
50 to 60 hours a week (especially if travel time is included) and 18 hours a week during
off season.
The researchers, therefore, questioned the assumption of the athletic scholarships, the
ones in which the “high school sport pay-offs” support the belief that athletes can use
sports abilities to get a college education (Peltier, et al., 1999). Peltier et al noted that
based on the results of the high school athletes and their college experiences, the validity
of such claims need to be questioned – while high school sports might help open
collegiate doors to athletes, “it does little to guarantee that they will walk out of those
doors four, five or six years later with a degree” (Peltier, et al., 1999).
For one thing, if they do not have the academic skills in high school, they are not going to
gain them in college. In many high schools, athletes do receive the preferential treatment
– while one doesn‟t see too many athletes going to “basket weaving 101” any more,
sometimes teachers might look the other way when it comes to grading athlete papers.

37
Furthermore, when a high school student‟s aspiration only surrounds going to the pros,
and the chances are few that he will get into the pros, it makes it that much more difficult
to justify. But the concern is also that athletes who have solid education credentials while
in high school might find collegiate sports monopolizing their time and commitment in
this regard (Peltier, et al., 1999).
At present, the National Collegiate Athletic Association (NCAA) (Ward, 1999)
Challenging Athletes‟ Minds for Personal Success Life Skills Program (CHAMPS)
stresses many of the developmental necessities of college student-athletes. This program
is a chief contributor to the emerging body of literature on their special counseling
necessities (Ward, 1999). The Challenging Athletes‟ Minds for Personal Success Life
Skills Program (CHAMPS) is planned out to offer student athletes with academics and
experiences that (a) maximize their collegiate experiences, (b) eases victorious
changeovers to professional careers, and (c) backs up students' important shares to their
society.
The Challenging Athletes‟ Minds for Personal Success Life Skills Program (CHAMPS)
is founded on the assumption that student-athletes have a hard time getting into campus-
wide student events, programming, and experiences. The program offers athletics
departments with resources and counseling to help them aid student athletes to get
involved more fully in the collegiate experience (Ward, 1999).

38
Of course, the irony in such suggestions is that attending time management seminars
means more time taken out of an already burgeoning academic career. When you add the
stress of a huge collegiate sports program (such as those outlined in the Division 1
schools), this means more time must be taken in an attempt to try to learn to manage time
so that a student athlete can play sports and achieve high academic standards.
This literature review provides a synthesis on extracurricular activity participation,
middle and high school athletics, collegiate extracurricular activities, other activities,
gender, ethnicity, comparing the 1970 youth to today's youth, and time management to
investigate the questions of this study. In sum, the finding that today‟s adolescents are
spending less time in non-academic extracurricular activities, such as band, orchestra,
drama and art or hobby clubs, may be a response to the increased emphasis on „back to
basics‟ education movement. However, it hardly seems like a positive development of the
whole youth, except from a very narrow view of what constitutes appropriate use of
adolescents‟ time. The next section will reveal the constructs of this investigation.

39
CHAPTER THREE: METHODOLOGY
Introduction
The primary purpose of this study was to gain a deeper understanding of the effects of
time use and sports participation on academic achievement among African American and
Hispanic male high school student athletes. The data from this study is obtained from a
large data set compiled after the first follow-up phase of the Education Longitudinal
Study of 2002 (ELS: 2002) base-year to first follow-up longitudinal data file. The ELS:
2002 study is a nationally representative longitudinal study conducted by the National
Center of Education Statistics (NCES), and presents a profile of American high school
sophomores in 2002.
A central construct to this study is the measurement of student achievement in
mathematics that relates to student background variables and educational processes. The
ELS: 2002 provides information on education related behaviors, high school and
transition. Moreover, it provides an abundance of information on their behaviors,
tendencies, values and attitudes about their educational experiences. The in-depth
information makes the ELS: 2002 data an ideal source for this research. The current
chapter begins with a presentation of the research design for this study. Next, the sample
to be explored and the assessment battery are described. The data processing and data
analysis plan are then described, and the chapter ends with a summary.

40
Research Design
The researcher utilized secondary data analysis in this study. The research methodology
attempts to determine the differences in groups or individuals over time. In the current
study, the researcher used variables from the ELS: 2002 to define the groups and
conditions that are being compared. The dependent variable is academic achievement as
measured by Mathematics Item Response Theory (Math IRT) -estimated number right-
scores at the base year and follow-up assessments, this strategy is commonly referred to
as a repeated measures or within-subjects design. The ELS: 2002 data allows for the
empirical analyses of a nationally representative sample of student athletes‟ navigation
through the educational system.
In estimating a student‟s math ability, each test question was assigned a level of
difficulty. Item Response Theory accounts for the level of difficulty, discriminating
ability, and a guessing factor. The item and ability parameters were estimated on a
common scale, which uses patterns of correct, incorrect, and omitted answers to obtain
ability estimates that are comparable across different test forms. Item Response Theory
procedures utilized the pattern of responses to estimate the probability of correct
responses for all test questions. As a result, Item Response Theory scoring makes it
possible to compare scores obtained from test forms of different difficulty.
41
The common items present in overlapping forms and in overlapping administrations
(10th grade and 12th grade) allow test scores to be placed on the same scale. In the first
follow-up survey, Item Response Theory procedures were used to assess longitudinal
gains in achievement over time by using 85 common items present in both the 10th- and
12th-grade assessments (Ingels, et al., 2005).
The aim of the current study was to examine changes in academic achievement over
time, and using this method allows each student to act as his own control according to
(Ingels, et al., 2005). For the sports participation and time use variables, the follow-up
assessments were used for the following reasons. First, sports participation was assessed
directly only at follow-up. For the remaining time use variables, assessments were
conducted at both the base year and first follow-up assessments. However, only the
follow-up assessments were used because in this way the independent variables (sports
participation, extracurricular activities, etc.) cover the same period (the time between the
base year and follow-up assessments) as the dependent measure (mathematics
achievement).
Using the base year assessments of the independent variables would mean that a student
could have participated in sports (or spent time in extracurricular activities) prior to the
base year mathematics assessment (and therefore would indicate this participation), but
stopped participating during the time between the base year and follow-up assessments.
However, using only the follow-up assessments ensures that the same time period is
relevant for both the independent and dependent measures.
42
Sample
The base year and first follow-up student participants (N = 16,252) for the full-scale ELS:
2002 consisted of spring-term 10th graders in 2002 and spring-term 12th
grader in 2004
(excluding foreign exchange students) enrolled in schools in the school target population
(Ingels et al, 2005). African American and Hispanic students are the subset within the
data that will be examine for this study (N = 2,292). The time use measurement within
the data is socialization, study time, and extracurricular activity participation.
The study began in 2002 with a goal to evaluate 10th
graders and to follow them through
transition periods at 2-year intervals using the same math assessment according to ELS:
2002. Although the base-year study comprised surveys of parents, teachers, school
administrators, and library media specialists, as well as the cohort of high school
sophomores, to remain concise, this report draws primarily on data from students who
were originally sampled which is the primary unit of analysis for the study. The over
sampling procedures of Asians and Hispanics implemented was to ensure that each of the
subpopulations had a minimum sample size of 1,356 ( Ingels et al., 2005b).
Assessment Battery
Mathematics Achievement
The researcher examined data taken from assessment of students (achievement tests in
mathematics) and surveys (base year and first follow-up) that were completed by the
students.

43
The base-year (2002) student assessments measured achievement in both reading and
mathematics but, for the purposes of this examination only student assessments in
mathematics were utilized because reading achievement was not assessed at first follow-
up. The first follow-up study reassessed mathematics achievement in 2004, using the
same assessment procedures and therefore achievement scores recorded in the base year
and first follow-up assessments can be compared as related to sports participation and
time use.
Socio-Economic Status (SES)
The assessment of SES variables was calculated by ELS: 2002. This continuous measure
of SES is based on five equally weighted standardized components: father‟s/guardian‟s
education, mother‟s/guardian‟s education, family income, father‟s/guardian‟s
occupation/prestige score from, and mother‟s/guardian‟s occupation/prestige score.
Race
The race variables for base year and first follow-up student questionnaires and includes
(a) American Indian or Alaska native, (b) Asian or Pacific Islander, including Native
Hawaiian, (c) Black including African-American, (d) Hispanic or Latino, (e) more than
one race or Multi-racial, and (f) White. Only data from African Americans and Hispanics
was included in the current study. The two Hispanic categories (i.e. values of „4‟ and „5‟
above) were combined into one category. For this analysis, the new race variable was
coded as „0‟ for African Americans and „1‟ for Hispanics.

44
Sports Participation and time use
The follow-up questionnaire contained responses the students gave with respect to school
experiences and activities, how they spent their time, plans and expectations for the
future, work after high school work experiences, and information pertaining to their
community, family, and friends. For sports participation, the three response categories
were: (a) did not participate, (b) participated, and (c) participated as an officer, leader, or
captain. These responses were recoded into the following categories: 0 = did not
participate, 1 = participated or participated as an officer, leader, or captain. The four areas
of time use that were included in the current study are extracurricular activities,
mathematics homework, watching TV or videos, and playing video/computer games.
Extracurricular activities. For extracurricular activities, students were asked “In a typical
week, how many total hours do you spend on all school-sponsored extracurricular
activities (sports clubs or other activities)?” The eight response categories were: (a) none,
(b) less than one hour per week, (c) 1-4 hours per week, (d) 5-9 hours per week, (e) 10-14
hours per week, (f) 15-19 hours per week, (g) 20-24 hours per week, and (h) 25 hours or
more per week. These responses were recoded into the following categories for analysis:
0 = four hours per week or less, and 1= more than 4 hours per week.

45
Mathematics homework. For mathematics homework, students were asked to state the
number of hours that they spent doing mathematics homework per week, and selected
from the following categories: (a) not taking math, (b) none, (c) less than 1 hour/week,
(d) 1-3 hours/week, (e) 4-6 hours per week, (f) 7-9 hours per week, (g) 10-12 hours/week,
(h) 13-15 hours/week, and (i) over 15 hours/week. These responses were recoded for
analysis into the following variable: 0 = none or less than 1 hour/week and 1 = more than
1 hour/week.
Watching TV/videos/DVDs. For time spent watching TV/videos, and DVDs, the
following responses options were provided for respondents to indicate the number of
hours per day: (a) don‟t watch TV/videos/DVDs on weekdays, (b) less than 1 hour a day,
(c) 1 hour or more but less than 2 hours, (d) 2 hours or more but less than 3 hours, (e) 3
hours or more but less than 5 hours, and (f) 5 hours or more a day. For analysis, these
responses were grouped into the following category: 0 = less than 3 hours and 1 = 3 hours
or more.
Playing video/computer games. For the amount of time spent playing video or computer
games per day, the following response categories were offered: (a) don‟t play
video/computer games, (b) less than 1 hour a day, (c) 1 hour or more but less than 2
hours, (d) 2 hours or more but less than 3 hours, (e) 3 hours or more but less than 5 hours,
and (f) 5 hours or more a day. The following variable was created for analysis: 0 = none
or less than 1 hour, 1 = more than 1 hour.

46
Data Processing and Analysis
Data Processing
The researcher used a repeated measures design based on Maxwell and Delaney (2004)
description to obtain the comparison data from the ELS: 2002 sample. The goal was to
measure trends in sports participation and time use with academic success among
African-American and Hispanic students. The plan of this study was to measure the
groups at the 10th
grade year and the 12th
grade year. The researcher used the Statistical
Package for the Social Sciences software (SPSS - Version 14.0 for Windows) for data
analysis. The repeated measures analysis tested for mean differences between the groups
in our research study. To support the research hypothesis the repeated measures will test
for mean differences based on sports participation and the four time use variables as well
as race (African American versus Hispanic). Socio-economic status was used as a
covariate. In addition, all two-way interactions between the sports participation, time use,
and race variables were examined.
Within-Subjects Factors
The variables Math IRT-estimated number right- scores were taken directly from ELS:
2002 and represented mathematics achievement for the base year and first follow-up
studies. The variables are represented in our analysis as the dependent variable and a
within-subjects factor (base year and first follow-up).
47
Between-Subjects Factors
The researcher created five new dichotomous variables (described above in the
Assessment Battery section) to define sports participation and the four time use variables.
Race is also included as a between-subjects factor, and the covariate variable socio-
economic status is also a between-subjects variable.
Data Analysis
Initially, descriptive statistics will be provided for all study variables. This will include
frequencies and percentages for categorical variables and means, standard deviations, and
ranges for all continuous variables. The correlations between the Math IRT-estimated
number right- scores and the other study variables will also be computed. Inferential
analyses were then performed to address the research questions of the current study.
The first research question presented in Chapter 1 was:
1. What are the effects of Hispanic and African American male student athletes‟
time use patterns on their academic achievement, controlling for socio-
economic status and time spent completing mathematics homework?
There were three sub-questions:
1a. What are the effects of Hispanic and African American male student athletes‟
time spent in extracurricular activities on their mathematics achievement,
controlling for socio-economic status and time spent completing mathematics
homework?

48
1b. What are the effects of Hispanic and African American male student athletes‟
time spent watching TV/DVDs on their mathematics achievement, controlling
for socio-economic status and time spent completing mathematics homework?
1c. What are the effects of Hispanic and African American male student athletes‟
time spent playing video/computer games on their mathematics achievement,
controlling for socio-economic status and time spent completing mathematics
homework?
The second research question is:
2. What are the effects of Hispanic and African American male student athletes‟
sports participation on their academic achievement, controlling for socio-
economic status and time spent completing mathematics homework?
The third research question is:
3. Is there a difference between Hispanic and African American male students‟
mathematics achievement based on sports participation and time use,
controlling for socio-economic status and time spent completing mathematics
homework?
There were four sub-questions for the third research question, each related to the
interaction between race and sports participation or race and the three time use variables:
49
3a. Is the effect of sports participation on mathematics achievement the same for
Hispanic and African American male student athletes, controlling for socio-
economic status and time spent completing mathematics homework?
3b. Is the effect of time spent on extracurricular activities on mathematics
achievement the same for Hispanic and African American male student
athletes, controlling for socio-economic status and time spent completing
mathematics homework?
3c. Is the effect of time spent watching TV/DVDs on mathematics achievement
the same for Hispanic and African American male student athletes, controlling
for socio-economic status and time spent completing mathematics homework?
3d. Is the effect of time spent playing video/computer games on mathematics
achievement the same for Hispanic and African American male student
athletes, controlling for socio-economic status and time spent completing
mathematics homework?
To address these three research questions, a repeated-measures factorial analysis of
covariance was performed. Table 1 shows the variables and statistical methods to be
employed to address the research questions. Two-tailed tests and an alpha level of .05
will be used for all inferential analyses.

50
The covariates will be SES and time spent on math homework, and the independent
variables will be race (African American versus Hispanic), time spent on extracurricular
activities, time spent watching TV/DVDs, time spent playing video/computer games, and
sports participation. All main effects and two-way interactions between the independent
variables will be included in the model. Statistically significant interactions will be
followed up with simple effects tests. For example, if the race by time spent playing
video/computer games interaction is statistically significant, a follow-up analysis will be
performed examining the effect of time spent playing video/computer games on
mathematics achievement separately for African Americans and Hispanics.

51
Table 1: Variables and Repeated-Measures Analysis of Covariance Description
Variable Description Role
Mathematics
Achievement
Mathematics IRT –estimated number right–
scores for base year (2002) and follow-up
(2004) assessments.
Dependent
Variable
Socio-economic
status index
Follow-up (2004) assessment of socio-
economic status based on parents‟/guardians
education, income, and occupational prestige
scores.
Covariate
Time spent on
mathematics
homework
Follow-up assessment indicator of time spent on
mathematics homework (0 = none or less than 1
hour/week and 1 = more than 1 hour/week).
Covariate
Race Recoded race variable from follow-up (2004)
assessment (0 = African American and 1 =
Hispanics).
Independent
Variable
Sports
Participation
Recoded sports participation variable from
follow-up (2004) assessment (0 = did not
participate, 1 = participated or participated as an
officer, leader, or captain).
Independent
Variable
Extracurricular
Activities
Recoded time spent in extracurricular activities
from follow-up (2004) assessment (0 = four
hours per week or less, 1 = more than 4 hours
per week).
Independent
Variable
TV/DVDs Recoded time spent watching TV/DVDs per day
from follow-up (2004) assessment (0 = less than
3 hours and 1 = 3 hours or more).
Independent
Variable
Video Games Recoded time spent playing video or computer
games from follow-up (2004) assessment (0 =
none or less than 1 hour, 1=more than 1 hour).
Independent
Variable

52
CHAPTER FOUR: FINDINGS
Introduction
The current chapter presents the results of the analyses described in Chapter Three.
Initially, descriptive statistics will be provided for all study variables, including
frequencies and percentages for categorical variables (race, sports participation, time
spent on mathematics homework, time spent in extracurricular activities, time spent
watching TV/DVDs, and time spent playing video games) and means, standard
deviations, and ranges for all continuous variables (SES and Math IRT-estimated number
right- scores). Results are presented of the inferential analyses that were performed to
address the research questions of the current study.
Descriptive Statistics
The final sample consisted of 2,292 male high school students (after removing those who
were not African American and not Hispanic and those who did not have scores on than
one of the key study variables). Table 1 presents descriptive statistics for the categorical
variables for these 2,292 male high school students. Overall, 47.1% of the sample was
African American and 52.9% was Hispanic. Most (65.5%) of the respondents did not
participate in sports. Nearly three-quarters of the sample (80.9%) spent less than 1 hour
per week on homework. Most of the sample (68.6%) spent 4 hours per week or less on
extracurricular activities. In terms of time spent watching TV or DVDs, most of the
sample (62.1%) spent less than three hours per day on these activities. Finally,
respondents were more likely to spent less than 1 hour per day playing video games
(61%) that they were to spent 1 hour per day or more (39%).

53
Table 2: Descriptive Statistics for Categorical Variables
Frequency Percentage
Race
African American 1079 47.1
Hispanic 1213 52.9
Sports Participation
No 1501 65.5
Yes 791 34.5
Time Spent on Homework
Less than 1 hour per week 1854 80.9
1 hour or more per week 438 19.1
Time Spent on Extracurricular Activities
4 hours or less per week 1573 68.6
5 hours per week or more 719 31.4
Time Spent Watching TV/DVDs
Less than 3 hours per day 1423 62.1
3 hours or more per day 869 37.9
Time Spent Playing Video Games
Less than 1 hour per day 1398 61.0
1 hour per day or more 894 39.0

54
Descriptive statistics for the continuous measures are shown in Table 3. Socio-economic
status scores ranged from -1.97 to +1.79, with a mean of -.28 (SD = .71). Math IRT-
estimated number right- scores for the base year scores ranged from -8.00 to 81.32 with a
mean of 35.13 (SD = 14.11). For the first follow-up Math IRT-estimated number right-
scores ranged from -8.00 to 80.53 with a mean of 30.61 (SD = 24.45).
Table 3: Descriptive Statistics for Continuous Variables
Minimum Maximum Mean SD
Socio-economic Status
Composite
-1.97 1.79 -.28 .71
Base Year Mathematics
Composite
-8.00 81.32 35.13 14.10
Follow-up Mathematics
Composite
-8.00 80.53 30.61 24.44

55
Bivariate Correlations
The correlations between the Math IRT-estimated number right- scores and the other
study variables are shown in Table 4. For the correlations where the two variables are
continuous (i.e. the correlations between SES and the Math IRT-estimated number right-
scores), these are Pearson correlation coefficients, while for the correlations between a
dichotomous variables and a continuous variable (i.e. all other correlations in the table),
these are point biserial correlations. Socio-economic status correlated positively with
both base year mathematics composites (r =.28, p <.001) and first follow-up Math IRT-
estimated number right- scores (r =.23, p <.001), indicating that those with higher SES
scores also tended to have higher Math IRT-estimated number right- scores.
Race was negatively correlated with for the base year Math IRT-estimated number right-
scores (r =.036, p >.051) and was positively correlated for the follow-up Math IRT-
estimated number right- scores (r =.049, p <.05). Sports participation was also positively
correlated with both the base year (r =.15, p <.001) and the first follow-up (r =.33, p
<.001) Math IRT-estimated number right- scores, indicating that those who participated
in sports tended to have higher Math IRT-estimated number right- scores. As would be
expected, time spent doing homework was positively correlated with both base year (r
=.22, p <.001) and first follow-up (r =.33, p <.001) Math IRT-estimated number right-
scores, indicating that those who spent more time on homework tended to have higher
Math IRT-estimated number right- scores.

56
Time spent on extracurricular activities was also positively correlated with the base year
(r =.19, p <.001) and first follow-up (r =.34, p <.001) Math IRT-estimated number right-
scores, indicating that those who spent more time in extracurricular activities tended to
have higher Math IRT-estimated number right- scores. Time spent watching TV and
DVDs was not significantly correlated to base year Math IRT-estimated number right-
scores (r =.007, p >.05) and was not linearly related to first follow-up Math IRT-
estimated number right- scores (r =.06, p <.05), indicating that those who spent more
time watching TV and DVDs tended to have lower Math IRT-estimated number right-
scores.
Finally, time spent playing video games was not significantly correlated to base year
Math IRT-estimated number right- scores (r =.008, p >.05), but was not linearly related
with first follow-up Math IRT-estimated number right- scores (r =.111, p <.05),
indicating that those who spent more time playing video games had lower scores on the
Math IRT-estimated number right- scores at the first follow-up assessment but not at the
base year assessment.

57
Table 4: Correlations between Mathematics IRT Scores and Other Study Variables
Base Year Mathematics
Composite
Follow-up Mathematics
Composite
Socio-economic status composite .280*** .233***
Race .036 .049*
Sports Participation .146*** .329***
Time Spent Doing Homework .220*** .333***
Time Spent on Extracurricular
Activities
.191*** .347***
Time Spent Watching TV/DVDs .007 .064**
Time Spent Playing Video Games .008 .110***
Note: *p<.05, **p<.01, ***p<.001
Inferential Statistics
The results of the repeated-measures factorial analysis of covariance was performed to
address the three research questions of the current study are presented. The analysis
revealed several within-subjects effects, which are displayed in the Table 5. The main
effect for time was statistically significant, F (1, 2274) = 4.20, p < .05. This indicates that
the mean Math IRT-estimated number right- scores at the base year assessment (M =
35.76, SE =.37) was significantly lower than the mean Math IRT-estimated number right-
scores at the first follow-up assessment (M = 36.15, SE =.58).

58
The time by time spent completing homework interaction was statistically significant F
(1, 2274) = 74.89, p < .001, with larger gains for those who spent more time on
homework. The time by time spent on extracurricular activities interaction was
statistically significant F (1, 2274) = 33.24, p < .001, with those who did not spend time
on extracurricular activities having lower Math IRT-estimated number right- scores at the
first follow up than the base year assessment (M = 34.25, SE = .46 versus M = 31.53, SE
= .72, respectively) while those who did spend time on extracurricular activities Math
IRT-estimated number right- scores increased (M = 37.28, SE = .57 at base year and M =
40.76, SE = .89 at first follow up).
The time by time spent playing video games interaction was statistically significant F (1,
2274) = 3.90, p < .05. Examining the means indicated that those who did not engage in
gaming had Math IRT-estimated number right- scores that went down from the base year
(M = 36.18, SE = .48) to follow up (M = 35.63, SE = .75) assessments, while those who
did engage in gaming had Math IRT-estimated number right- scores that went up from
base year (M = 35.35, SE = .50) to first follow up (M = 36.66, SE = .78). The time by
sports participation interaction was statistically significant F (1, 2274) = 20.58, p < .001.
Examination of the means indicated that those who did not participate in sports had Math
IRT-estimated number right- scores that were higher at the base year (M = 35.53, SE =
.51) than at the first follow up (M = 33.47, SE = .81) while those that did participate in
sports had Math IRT-estimated number right- scores than were higher at the first follow
up (M = 38.82, SE = .81) than at the base year (M = 36.00, SE = .52).

59
The time by sports participation by time spent on extracurricular activities interaction was
statistically significant F (1, 2274) = 38.72, p < .001. Among those who did not
participate in sports, those who did not participate in extracurricular activities had higher
Math IRT-estimated number right- scores at the base year (M = 34.53, SE = .40) than the
first follow up (M = 36.11, SE = .64) while those who participated in extracurricular
activities had higher Math IRT-estimated number right- scores at the first follow up (M =
40.84, SE = 1.48) than at the base year (M = 36.53, SE = .94). Among those who did
participate in sports, both those who did and did not participate in extracurricular
activities had higher Math IRT-estimated number right- scores at the first follow up (M =
36.96, SE = .81 at first follow up compared to M = 33.97, SE = .81 at the base year for
those who did not participate in extracurricular activities and M = 40.68, SE = .96 at the
first follow up compared to M = 38.03, SE = .61 at base year for those who did
participate in extracurricular activities).
The time by sports participation by time spent playing video games interaction was
statistically significant F (1, 2274) = 5.65, p < .05. Among those who did not engage in
gaming, mathematics achievement went down from base year (M = 36.18, SE = .48) to
follow up (M = 35.63, SE = .75), while for those who did engage in gaming, Math IRT-
estimated number right- scores went up from base year (M = 35.34, SE = .50) to first
follow up (M = 36.67, SE = .78). The time by time spent on extracurricular activities by
time spent playing video games interaction statistically significant F (1, 2274) = 4.19, p <
.05.

60
Among those who did not participate in gaming, those who did not participate in
extracurricular activities had higher scores at the base year (M = 33.97, SE = .63) than
the first follow up (M = 29.21, SE = 1.00) while those who participated in extracurricular
activities had higher Math IRT-estimated number right- scores at the first follow up (M =
42.06, SE = 1.15) than at the base year (M = 38.40, SE = .73). Among those who did
participate in gaming, those who also participated in extracurricular activities had higher
Math IRT-estimated number right- scores at the first follow up (M = 39.47, SE = 1.29)
than at base year (M = 36.16, SE = .82), while those who did not also participate in
extracurricular activities has lower Math IRT-estimated number right- scores at first
follow up (M = 33.86, SE = .98) than at the base year (M = 34.53, SE = .63 at the first
follow up compared to 38.03, SE = .61 at base year for those who did participate in
extracurricular activities).
The time by time spent on watching TV/DVDs by time spent playing video games
interaction was also statistically significant F (1, 2274) = 8.14, p < .05. Among those
who did not participate in gaming, those who did not watch TV or DVDs had higher
Math IRT-estimated number right- scores at the base year (M = 35.62, SE = .50) than the
first follow up (M = 33.49, SE = .79), while those who did watch TV or DVDs had
higher Math IRT-estimated number right- scores at the first follow up (M = 37.78, SE =
1.18) than at the base year (M = 36.74, SE = .75).

61
Among those who did participate in gaming, both those who did and did not watch TV or
DVDs had higher Math IRT-estimated number right- scores at the first follow up (M =
38.09, SE = 1.10 at first follow up compared to M = 35.77, SE = .70 at the base year for
those who did not watch TV or DVDs and M = 35.23, SE = 1.03 at the follow up
compared to 34.92, SE = .65 at base year for those who did watch TV of DVDs).

62
Table 5: Results of the Repeated-Measures Factorial Analysis of Covariance
Sum of
Squares df
Mean
Squares F P
Partial
η2 Source
Within Subjects Effects
Time 799.508 1 799.508 4.184 .041 .002
Time by SES 112.573 1 112.573 .589 .443 .000
Time by Homework 14303.712 1 14303.712 74.859 .000 .032
Time by Race 1220.974 1 1220.974 6.390 .012 .003
Time by Extracurricular 6355.043 1 6355.043 33.259 .000 .014
Time by Video Games 735.008 1 735.008 3.847 .050 .002
Time by Sports Participation 3938.880 1 3938.880 20.614 .000 .009
Time by Sports Participation
by Extracurricular
7406.020 1 7406.020 38.760 .000 .017
Time by Sports Participation
by TV/DVDs
1335.469 1 1335.469 6.989 .008 .003
Time by Sports Participation
by Video Games
1072.933 1 1072.933 5.615 .018 .002
Time by Extracurricular by
Video Games
796.819 1 796.819 4.170 .041 .002
Time by TV/DVDs by Video
Games
1566.166 1 1566.166 8.187 .004 .004 Error (Time) 434504.716 2274 191.075
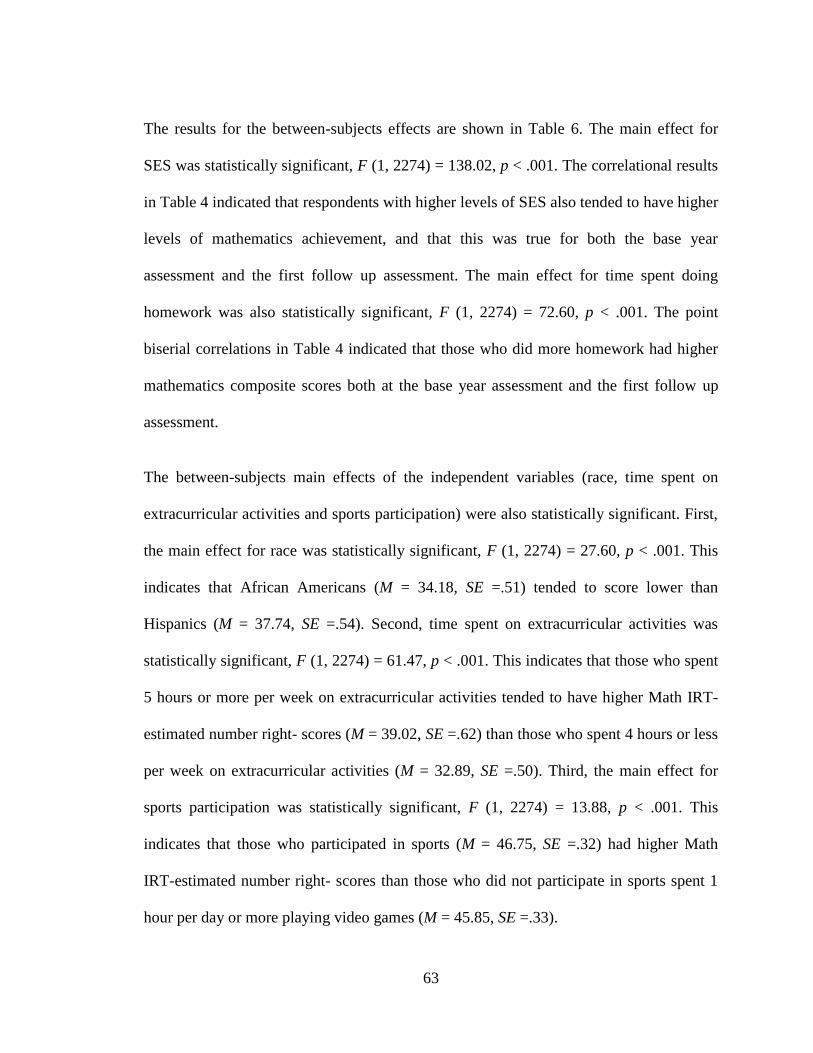
63
The results for the between-subjects effects are shown in Table 6. The main effect for
SES was statistically significant, F (1, 2274) = 138.02, p < .001. The correlational results
in Table 4 indicated that respondents with higher levels of SES also tended to have higher
levels of mathematics achievement, and that this was true for both the base year
assessment and the first follow up assessment. The main effect for time spent doing
homework was also statistically significant, F (1, 2274) = 72.60, p < .001. The point
biserial correlations in Table 4 indicated that those who did more homework had higher
mathematics composite scores both at the base year assessment and the first follow up
assessment.
The between-subjects main effects of the independent variables (race, time spent on
extracurricular activities and sports participation) were also statistically significant. First,
the main effect for race was statistically significant, F (1, 2274) = 27.60, p < .001. This
indicates that African Americans (M = 34.18, SE =.51) tended to score lower than
Hispanics (M = 37.74, SE =.54). Second, time spent on extracurricular activities was
statistically significant, F (1, 2274) = 61.47, p < .001. This indicates that those who spent
5 hours or more per week on extracurricular activities tended to have higher Math IRT-
estimated number right- scores (M = 39.02, SE =.62) than those who spent 4 hours or less
per week on extracurricular activities (M = 32.89, SE =.50). Third, the main effect for
sports participation was statistically significant, F (1, 2274) = 13.88, p < .001. This
indicates that those who participated in sports (M = 46.75, SE =.32) had higher Math
IRT-estimated number right- scores than those who did not participate in sports spent 1
hour per day or more playing video games (M = 45.85, SE =.33).

64
The interaction between sports participation and time spent on extracurricular activities
was statistically significant F (1, 2274) = 8.506, p < .05. There was a larger difference
between those who participated in extracurricular activities and those who didn‟t among
those who did not participate in sports (M = 30.32, SE = .44 if they did not participate in
extracurricular activities and M = 38.68, SE = 1.02 if they did participate in
extracurricular activities) compared to those who did participate in sports (M = 35.46, SE
= .88 if they did not participate in extracurricular activities compared to M = 39.34, SE =
.67 if they did participate in extracurricular activities).
The interaction between sports participation and time spent watching TV/DVDs was
statistically significant, F (1, 2274) = 9.917, p < .05. For those who did not participate in
sports, there was a positive effect of watching TV or DVDs (M = 35.96, SE = .78 if they
did watch TV or DVDs compared to 33.04, SE = .70 if they did not), while for those who
did participate in sports, there was a negative effect of watching TV or DVDs (M =
38.45, SE = .73 if they did not watch TV or DVDs compared to 36.38, SE = .86 if they
did). The interaction between sports participation and time spent playing video games
was statistically significant F (1, 2274) = 7.818, p < .05. For those who did not
participate in sports, there was a positive effect of gaming (M = 33.36, SE = .69 if they
did not participate in gaming versus 35.64, SE = .79 if they did), while for those who did
participate in sports, there was a negative effect of gaming (M = 38.45, SE = .79 if they
did not engage in gaming but 36.37, SE = .77 if they did).

65
The interaction between time spent on extracurricular activities and time spent playing
video games was statistically significant F (1, 2274) = 10.13, p < .05. For those who did
not engage in extracurricular activities, there was a positive effect of gaming (M = 31.59,
SE = .69 if they did not engage in gaming and M = 34.19, SE = .68 if they did not), while
for those who did engage in extracurricular activities, there was a negative effect of
gaming (M = 40.23, SE = .80 if they did not engaging gaming but M = 37.81, SE = .89 if
they did).
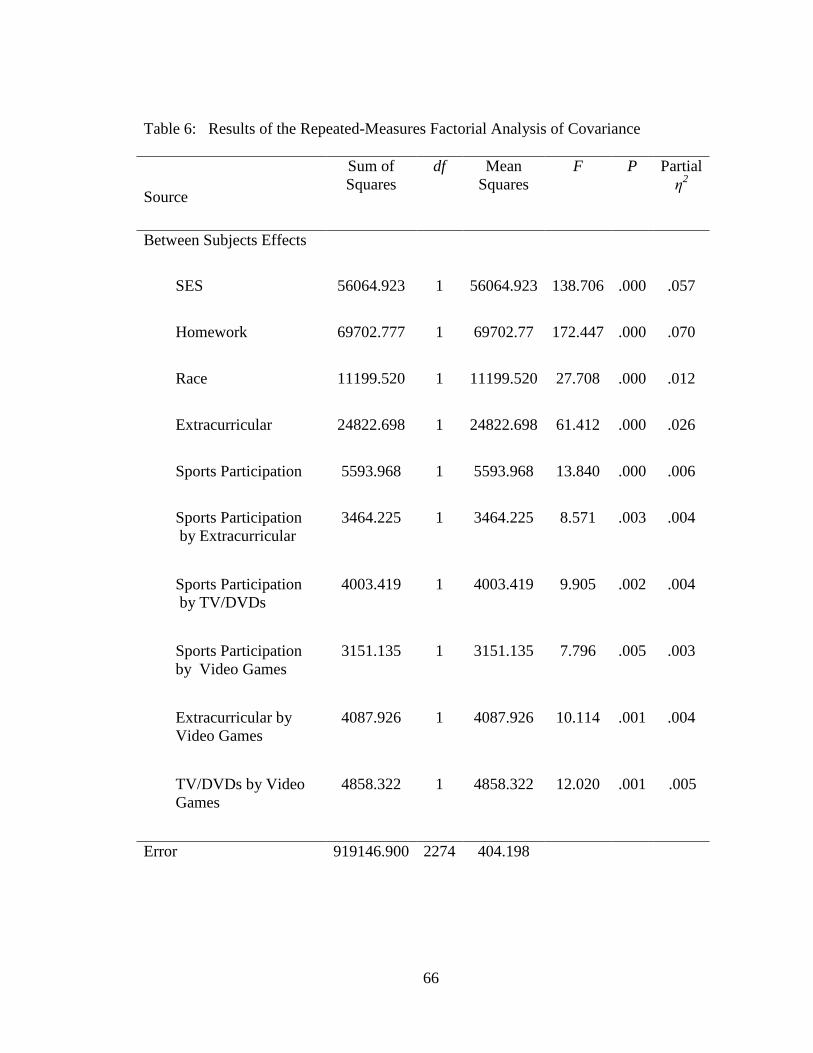
66
Table 6: Results of the Repeated-Measures Factorial Analysis of Covariance
Sum of
Squares
df Mean
Squares
F P Partial
η2
Source
Between Subjects Effects
SES 56064.923 1 56064.923 138.706 .000 .057
Homework 69702.777 1 69702.77 172.447 .000 .070
Race 11199.520 1 11199.520 27.708 .000 .012
Extracurricular 24822.698 1 24822.698 61.412 .000 .026
Sports Participation 5593.968 1 5593.968 13.840 .000 .006
Sports Participation
by Extracurricular
3464.225 1 3464.225 8.571 .003 .004
Sports Participation
by TV/DVDs
4003.419 1 4003.419 9.905 .002 .004
Sports Participation
by Video Games
3151.135 1 3151.135 7.796 .005 .003
Extracurricular by
Video Games
4087.926 1 4087.926 10.114 .001 .004
TV/DVDs by Video
Games
4858.322 1 4858.322 12.020 .001 .005
Error 919146.900 2274 404.198

67
The interaction between time spent watching TV/DVDs and time spent playing video
games was also statistically significant F (1, 2274) = 12.06, p < .05. Figure 1 shows the
mean Math IRT-estimated number right- scores at the base year and first follow up
assessment for each of the two video game groups. For those who played video games
less than 1 hour per day, Math IRT-estimated number right- scores were higher at the
base year assessment (M = 36.18., SE =.48) than they were at the first follow up
assessment (M = 35.63, SE =.75). For those who played video games 1 hour or more a
day, Math IRT-estimated number right- scores were lower at the base year assessment (M
= 35.34, SE =.50) than at the follow up assessment (M = 36.67, SE = .78). Therefore, we
can conclude that a statistically significant difference exist between the base year
assessment and the first follow-up assessment among African American and Hispanic
male high school student athletes.
33.5
34
34.5
35
35.5
36
36.5
37
37.5
Base Year Follow Up
Time Spent Playing Video Games
Me
an
Ma
th IR
T S
co
res
Less than 1 hour per day
1 hour or more per day
Figure 1: Time and Time Spent Playing Video Interaction

68
In addition to the statistically significant covariate effects and main effects, time by sports
participation by time spent on watching TV/DVDs interaction was also statistically
significant F (1, 2274) = 7.03, p < .05. Among those who did not participate in sports,
those who spent less than 3 hours per day watching TV/DVDs had lower Math IRT-
estimated number right- scores (M = 33.03, SE =.70) than those who spent 3 hours or
more per day watching TV/DVDs (M = 35.96, SE =.78). Among those who did
participate in sports, those who spent less than 3 hours per day watching TV/DVDs had
higher Math IRT-estimated number right- scores (M = 38.45, SE =.73) than those who
spent 3 hours or more per day watching TV/DVDs (M = 36.38, SE =.52), as shown in
figure 2. Therefore, we can conclude that for those who participated in sports there was a
negative effect of watching 3 hours per day or more watching TV/DVDs, whereas for
those who did not participate in sports there was actually a beneficial effect of watching
TV/DVDs for 3 hours per day or more per day. No other interaction between subject
variables was statistically significant.

69
0
5
10
15
20
25
30
35
40
45
Did not participate Participated
Sports Participation
Me
an
Ma
th IR
T S
co
res
Less than 3 hours per day
3 hours or more per day
Figure 2: Sports Participation and Time Spent Watching TV/DVDs Interaction
Research Question 1
The first research question presented in Chapter 1 was: What are the effects of Hispanic
and African American male student‟ time use patterns on their academic achievement,
controlling for SES and time spent completing mathematics homework? There were three
sub-questions.
(1a). The first sub-question was: What are the effects of Hispanic and African American
male students‟ time spent in extracurricular activities on their mathematics achievement,
controlling for socio-economic status and time spent completing mathematics
homework? The test of the main effect for time spent on extracurricular activities was
statistically significant F (1, 2274) = 61.41, p <.001, as shown in Table 6.

70
(1b). The second sub-question was: What are the effects of Hispanic and African
American male students‟ time spent watching TV/DVDs on their mathematics
achievement, controlling for socio-economic status and time spent completing
mathematics homework? The main effect for time spent watching TV/DVDs was not
statistically significant F (1, 2274) = .372, p >.05. This indicated that there was no effect
of time spent watching TV/DVDs on mathematics achievement when controlling for SES
and time spent completing mathematics homework as shown in Appendix D. However, it
should be noted that there was a small but statistically significant negative correlation
between time spent watching TV/DVDs and mathematics achievement both at the base
year and first follow-up assessments when SES and time spent completing mathematics
homework were not controlled.
(1c). The third sub-question was: What are the effects of Hispanic and African American
male students‟ time spent playing video/computer games on their mathematics
achievement, controlling for socio-economic status and time spent completing
mathematics homework? The main effect for time spent playing video/computer games
was not statistically significant F (1, 2274) = .019, p >.05. The means indicated that those
who spent less than 1 hour per day playing video games (M=35.91, SE .519) had lower
Math IRT-estimated number right- scores than those who spent 1 hour per day or more
playing video games (M = 36.01, SE = .540) when controlling for SES and time spent
completing mathematics homework. The 95% confidence interval for the mean
difference between nonparticipants and student athletes groups ranged from 34.36 to
38.20, as shown in Appendix E.
71
Research Question 2
The second research question was: What are the effects of Hispanic and African
American male students‟ sports participation on their academic achievement, controlling
for socio-economic status and time spent completing mathematics homework? The main
effect for sports participation was statistically significant F (1, 2274) = 13.84, p <.001.
This indicated that there were statistically significant differences between those who
participated in sports and those who did not in terms of academic achievement, when
controlling for SES and time spent completing mathematics homework. Again, however,
it is important to note that there were small but statistically significant positive
correlations between sports participation and academic achievement (both at the base
year and first follow-up assessments) when SES and time spent completing homework
were not controlled as shown in Appendix B.
Research Question 3
The third research question was: Is there a difference between Hispanic and African
American male students‟ academic achievement based on sports participation and time
use controlling for socio-economic status and time spent completing mathematics
homework? There were four sub-questions to the third research question.
(3a). The first sub-question was: Is the effect of sports participation on mathematics
achievement the same for Hispanic and African American male students, controlling for
socio-economic status and time spent completing mathematics homework?

72
The interaction between race and sports participation was not statistically significant F
(1, 2274) = .390, p >.05. This indicated that the effect of sports participation (or more
accurately, the lack of an effect for sports participation) was the same for African
American and Hispanic male student athletes, as displayed in Appendix D.
(3b). The second sub-question was: Is the effect of time spent on extracurricular activities
on mathematics achievement the same for Hispanic and African American male students,
controlling for socio-economic status and time spent doing mathematics homework? The
race by time spent on extracurricular activities interaction was not statistically significant
F (1, 2274) = .003, p >.05 as shown in Appendix D. This indicated that the positive effect
of extracurricular activities was the same for African American and Hispanic male
student athletes.
(3c). The third sub-question was: Is the effect of time spent watching TV/DVDs on
mathematics achievement the same for Hispanic and African American male students,
controlling for socio-economic status and time spent completing mathematics
homework? The race by time spent watching TV/DVDs interaction was not statistically
significant F (1, 2274) = .65, p >.05 as shown in Appendix D. This indicated that any
effect of time spent watching TV/DVDs was the same for African American and
Hispanic male student athletes on their academic achievement.

73
(3d). The forth sub-question: Is the effect of time spent playing video/computer games on
mathematics achievement the same for Hispanic and African American male student
athletes, controlling for socio-economic status and time spent completing mathematics
homework? The interaction between race and time spent playing video/computer games
was not statistically significant F (1, 2274) = .003, p >.05 as shown in Appendix D. This
indicated that the detrimental effect of time spent playing video/computer games was the
same for African American and Hispanic male student athletes on their academic
achievement.
74
CHAPTER FIVE: SUMMARY
Summary of Findings
In this investigation, the researcher has assessed indicators (socioeconomic status, time
use patterns, sports participation, and race) within the construct of academic achievement
among African American and Hispanic male student athletes. Their contribution to the
main effects revealed that statistically significant differences exist between the non sports
participant and sports participant groups. A statistically significant difference was found
among student athletes and their non-athletic peers in their overall Math IRT-estimated
number right- scores selected for this analysis.
The first research question was: What are the effects of Hispanic and African American
male student‟ time management on their academic achievement, controlling for SES and
time spent completing mathematics homework? African American and Hispanic male
student athletes who spent 5 hours or more per week on extracurricular activities tended
to have higher Math IRT-estimated number right- scores. African American and Hispanic
male student athletes who spent more time watching TV and DVDs tended to have lower
Math IRT-estimated number right- scores. African American and Hispanic male student
athletes who spent more time in extracurricular activities tended to have higher Math
IRT-estimated number right- scores.
75
African American and Hispanic male student athletes who spent more time on homework
tended to have higher Math IRT-estimated number right- scores that those who spent less
than 1 hour per day playing video games had higher Math IRT-estimated number right-
scores than those who spent 1 hour per day or more playing video games.
The second research question was: What are the effects of Hispanic and African
American male students‟ sports participation on their academic achievement, controlling
for socio-economic status and time spent completing mathematics homework? The main
effect for sports participation was not statistically significant, indicating that there was no
difference between those who participated in sports and those who did not in terms of
mathematics achievement, when controlling for SES and time spent completing
mathematics homework. Again, however, it is important to note that there were small but
statistically significant positive correlations between sports participation and mathematics
achievement (both at the base year and first follow-up assessments) when SES and time
spent doing mathematics achievement were not controlled.
The third research question was: Is there a difference between Hispanic and African
American male students‟ academic achievement based on sports participation and time
use controlling for socio-economic status and time spent completing mathematics
homework? The interaction between race and sports participation was not statistically
significant, indicating that the effect of sports participation (or more accurately, the lack
of an effect for sports participation) was the same for African American and Hispanic
male student athletes.

76
Similarly, the race by time spent on extracurricular activities was not statistically
significant, indicating that the positive effect of extracurricular activities was the same for
African American and Hispanic male student athletes. The race by time spent watching
TV/DVDs interaction was also not statistically significant, indicating that any effect of
time spent watching TV/DVDs (which disappeared when controlling for SES and time
spent doing homework) was the same for African American and Hispanic male student
athletes. The interaction between race and time spent playing video/computer games was
not statistically significant, indicating that the adverse effect of time spent playing
video/computer games was the same for African American and Hispanic male student
athletes. Finally, it is noteworthy that effective use of time (i.e., playing video games
less) and sports participation positively influences academic achievement of African
American and Hispanic males high school student athletes.
Discussion
There has been considerable debate regarding the benefits and drawbacks of
interscholastic sports, particularly with regard to the relationship between athletic success
and academic success. School-sponsored athletics fall within the general rubric of
extracurricular activities (or, alternatively, co-curricular activities). Such activities are
considered inherently educational. Results of data analysis presented in this study
contradict the zero sum theory.

77
According to Stephens and Schaben (2002), extracurricular activities are not a diversion
but rather an extension of a good educational program. Students who participate in sports
and/or extracurricular activities tend to have higher test scores, better attendance records,
lower dropout rates and fewer discipline problems than non participants.
Given that, few studies have used more stringent evaluation methods of the interaction
between factors among sports participants. Baines and Stanley (2003) point to the
difficulty in the transfer of motivation from the sports environment to the academic one
as a reason for poor academic performance. While this may be the case for some African
American and Hispanic student athletes, many look forward to the opportunity of
continuing their education at the university level. These youths who often entertain hopes
of success in professional sports may underestimate the amount of academic effort
required to remain eligible for varsity play at the high school and university level.
Ascertaining the contribution that such sports and/or extracurricular activities make
towards the mission of academic achievement – closing the achievement gap – is a
complex task. Does this particular issue mean that student athletes of color should avoid
sports at the cost of athletics? Does it mean that athletics should be concentrated on, with
the idea that academics just does not matter? The answer to the above is – of course not.
This is not a black or white issue, but involves shades of gray. The point is that students
at all age levels are faced with pressures that their parents and grandparents were not
faced with (at least on an academic level).

78
Kindergartners are already expected to read, second graders are expected to know cursive
and other academic information, their older peers know. Added to that is the high stakes
testing mentality, as part of the “No Child Left Behind” Act (NCLB 2001). Today
students‟ plates are full already and when you add athletics to the mix there is more
demand placed upon theses student athletes. Especially among high-quality athletic
programs, you may end up with student athletes who are in need of time management
skills.
Without the time management skills, student athletes face burnout and other potentially
problematic scenarios. There are some things that need to happen in order for student
athletes to succeed. What needs to happen here, then? Emphasis should be placed back
on the Physical Education classes and sports as part of an overall educational curriculum.
When sports are placed in their proper context – as a way to build healthy bodies, and
healthy minds, there is less pressure to excel at the sports (Hillman, Castelli, & Buck,
2005). More emphasis on using sports to develop the whole person as a viable tool will
benefit student athletes.
This of course, would take a major shift in thinking when it comes to sports in schools.
The prominence of winning at all costs ends up truly having a dire impact on most
student athletes. It does not matter if these children are in kindergarten or college. The
effects of this is that student athletes graduate from college (if they graduate at all)
already burned out. (Almost as burned out as some men and women who have been in the
workforce for 30 years or more).

79
In addition, there is little proof that athletics beyond college actually has an impact on the
person‟s career choice or chances of job placement. We have all heard the one about the
All-American high school quarterback who comes back to his 20th
class reunion as a
failure in life. Sometimes, in fact such preferential treatment to high school and college
athletes can have negative effects. When a person does not place the appropriate amount
of focus (time & energy) on their academics and places too much is emphasis on
athletics, this choice has a negative effect on student athletes.
This leads us to another issue; academics need to be stressed above and beyond athletics.
Some colleges give lip service to this – some are actually pretty good at insisting their
student athletes‟ graduate with high GPAs. Moreover, life skills such as time
management should be imbedded within the regular academic curriculum. Nevertheless,
it is not only the colleges that are the problems. High schools, Middle schools and
Elementary schools sometimes allow their star athletes to slide, not allowing them the
benefit of hard study. The result is functional illiterate athletes who are great at following
hand signals. For example, a quarterback who cannot read a newspaper or job
application, academics was not a priority in his life. No schools are doing their athletes a
favor if they are not holding these students to the same tough standards they might hold
their non-athletes to.
As for the need of time management strategies, more focus needs to be devoted to quality
study time and less to athletics. This means less practice time (two hours instead of four
hours of practice) should be the standard at the middle and high school level. Again, it
also goes back to the notion of only winning on the field.

80
Instead, greater emphasis needs to be placed on winning within the classroom instead of
only on the football field or basketball court. As a result you develop student athletes that
are not quite as burned out and who benefit from a balanced lifestyle and enjoys their
sport more.
In addition, less stress in general needs to be placed on students. It is not sports alone that
cause problems. Students are expected to be “well rounded.” This means you are likely to
find students in athletic programs, drama programs, chess club, yearbook staff and
various other activities. The more extracurricular activities there are, or so it seems, the
better well rounded the student will become and the more likely he or she will go to
college and from there, into the real world.
We are bringing up a generation of over-stressed, overanxious students who simply
cannot function. They would like to begin their daily journey; however, they are too tired
and become uninterested. This tiredness is a result of being overwhelmed by
sports/extracurricular activities commitments and not enough time for academics. For
example, the majority of high school student athletes start their day 5:30 a.m. and it
around 9 pm or later. Upon completion of their homework for six or seven classes, they
may get 4 or 5 hours of sleep during the weeknights.
As a comparison, most working professionals‟ hours are not as long. Student athletes do
not sleep enough on average and it not only impacts the student‟s ability to learn, but also
impacts the student‟s health as well.

81
If student athletes do not get the proper rest, he or she is at risk to contract illness that are
likely able to keep him/her out of school, putting the student further behind on his/her
studies in school. Again, add sports competition to the mix (and other extracurricular
activities) and the student athletes‟ well being suffers.
Setting priorities and managing time effectively is a basic skill to managing individual
performance. The pressure to find innovative ways to achieve goals, and enjoy life
outside of academics is even more intense in today‟s less structured, information-driven
society. Meeting the daily challenge of managing personal responsibilities requires
learning strategies designed to meet individual needs, which create more balance within
student athletes‟ daily lives.
The S.P.I.R.E.S. Conceptual Model (Survey, Plan, Initiate, Reflection, Evaluation,
Success) is a systematic approach developed by the researcher from a student athlete
perspective in order to help student athletes improve intellectually, physically and
emotionally. The student athlete would begin by surveying the current task or events. For
example, a point guard on the basketball team would survey the court before he/she calls
a play. Afterwards, a plan of action would be formulated (i.e., design a play to attack the
opponents 3-2 zone defense). The student athlete would then initiate the plan of action
by setting up the offense or defense and execute the play exactly how the coach designed
it.

82
At this point, the student athlete may need a time out. During the time out, the student
athlete time would reflect on how well or poorly the play was executed. After reflecting
on the task or daily events, the student athlete would evaluate the strengths and weakness
of the previous plan. Next, the student athlete would make adjustments or modifications
as needed. He/she would re-arrange and move uncompleted tasks or events to the next
day of practice with the goal of completing the each task. Last and importantly, the
student athlete would schedule entertainment or break time (i.e., an hour or two for you)
in order to break up the monotony of his/her daily routine. The goal of this time
management technique is to assist student athletes with placing proper emphasis on
academics while not completely ignoring the nonacademic aspect of life. This strategy
supports living a balance lifestyle and development of the total person. Success on and
off the court can be achieved by using this strategy appropriately.
Recommendations for Future Research
The present study examined various factors that influence academic achievement among
African American and Hispanic male high school student athletes. The researcher
hypothesizes that Sports/Extracurricular Activity Participation and effective management
of discretionary time enhances the academic achievement level of student athletes. This is
referred to as the Sports Life Theory. Conceptually, this investigation revealed
differences among African American and Hispanic male high school student athletes and
their non-athletic peers.

83
However, the question of why this difference exists remains unanswered. Clearly, further
analyses are necessary to investigate the relationships between students‟ time
management skills, academic outcomes, interaction effects of various indicators and the
quality of the interactions are needed. The process needs to further investigate the
decision making skills utilized by student athletes concerning the use of their
discretionary time. We do not know, for example how much control student athletes in
various settings exercise over their discretionary time. When or at what age should we
teach time mastery skills? To what extent do student athletes plan out their uses of time
versus making decisions on the spur of the moment? Other research agendas may include
the following: comparing the effects of interscholastic sports participation on academic
performance to the effects of sports participation outside of school; investigating
influence among the different academic subject areas by sports participation; comparing
sports participation perspectives of other countries and their levels of academic
performance to those of the United States.
The goal is to provide student athletes with more tools to make positive decisions and
manage their time efficiently. In an effort to uncover detailed trends, accurate data files
are needed. By building upon additional data and these insights, future research will
fortify student athletes on their journey into the real game of life.
Conclusion
The primary focus of this research is to find strategies to help each student athlete
maximize his or her potential, more research on the relationship between effective use of
time and sports participation is required.
84
Many students, even if they are not involved in athletics, end up graduating from college.
Eventually, some former student athletes find that they simply cannot manage their lives
effectively. Time use efficiency requires that students are aware of the activities that fill
their time (Kelley, 2002 ). There should be some emphasis placed on time management
from a fairly early level, even within academic settings.
Some student athletes learn decision making skills using the trial by fire approach. While
some student athletes learn to multi-task quite effectively, others simply cannot grasp the
concept. Unfortunately, none of the literature really focuses on whether or not time
management classes in school actually help students out upon graduation. However, if
students have an inkling of how they need to behave in the real world, they might
experience a smoother transition from academia into the real world.
Adding one more requirement to student athletes‟ plate is simply overwhelming today.
We have no doubt that participation in sports is also linked to an increase in self-esteem,
positive body image, and self-confidence as well as decreased incidence of depression,
pregnancy, and smoking initiation (Nieman, 1999). All of these issues affect the student
athletes‟ well being.
Their well being and development is being compromise under the disguise of more being
better and the infamous “winning at all costs attitude.” Due to the time management
research among student athletes, it is difficult to support the need for and implementation
of a time management curriculum. We can only surmise what the difficulties are, based
on simple logic.

85
A few studies cited in this paper pointed out that student athletes especially at the large
revenue producing collegiate programs, are expected to put in a bunch of hours, even
during the off-season, to ensure their places on particular teams. With this added
pressure, it should not be too surprising to see a future generation of student burn-outs
who might suffer from ulcers and other stress-related diseases, such as stroke, high blood
pressure and heart attacks.
In short, there is absolutely nothing wrong with the idea of sports in school. However,
when the school relies on sports to the cost of everything, it is the student athlete who
ends up suffering. Moreover, when this person ends up suffering, society as a whole
suffers as well. It is not necessary to abolish sports programs or to place every student on
a time management track.
Our focus on sports needs to shift and reality needs to reign when it comes to these
programs. We need adequate preparation of our youth concerning everyday tasks such as
effective management of their time and finances. Sports are important but it has its place.
Academics, first and foremost must continue to take precedent over any other type of
activity. Student athletes must have the capability of juggling a myriad of responsibilities
successfully in order to attain their academic and non-academic goals.

86
APPENDIX A: IRB APPROVAL LETTER
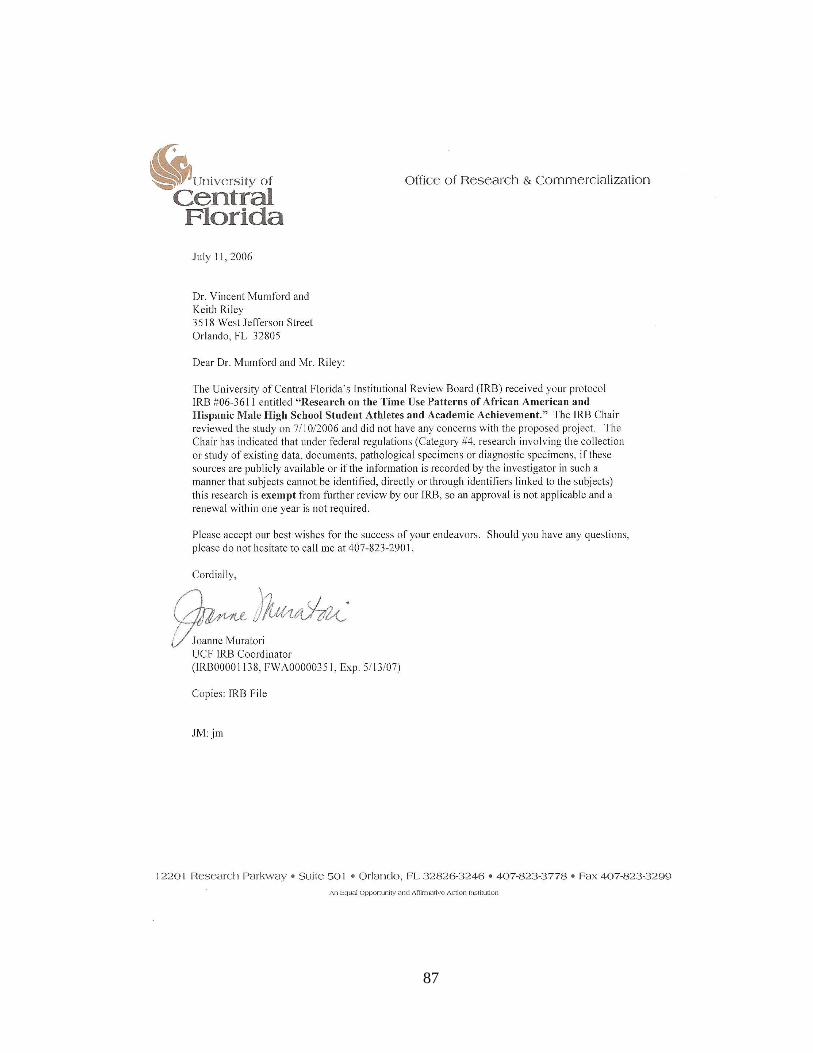
87

88
APPENDIX B: DESCRIPTIVES AND CORRELATIONS TABLES
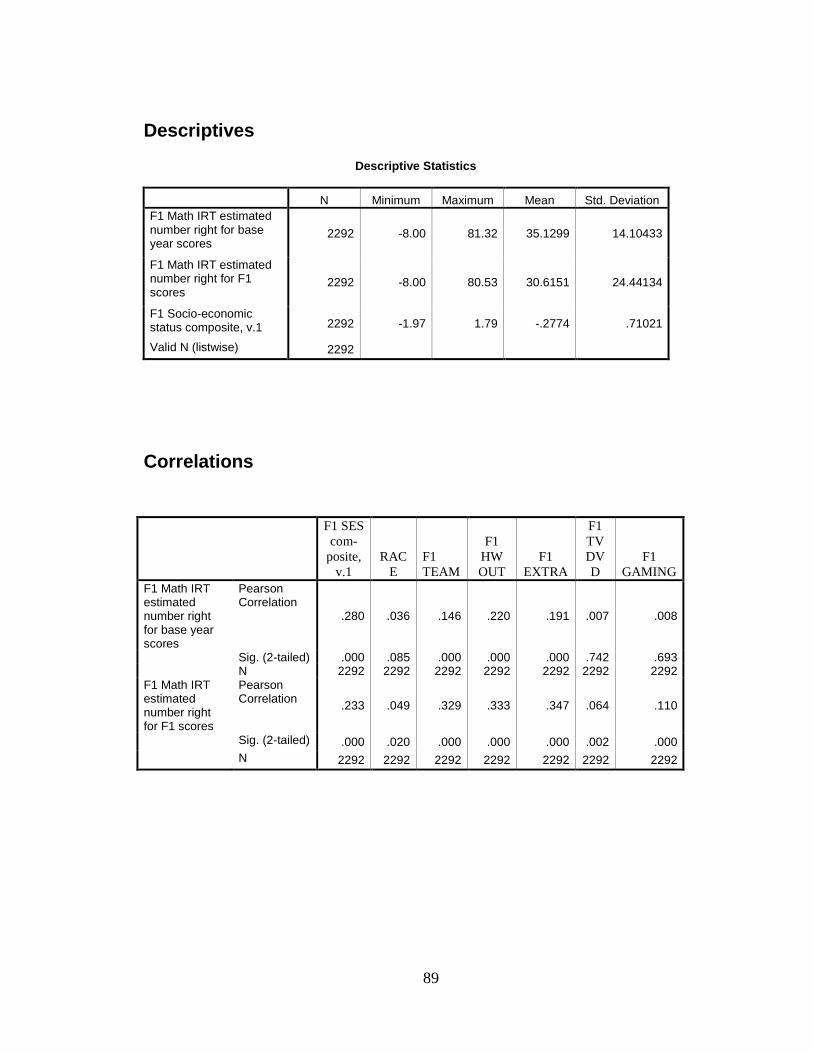
89
Descriptives Descriptive Statistics
N Minimum Maximum Mean Std. Deviation
F1 Math IRT estimated number right for base year scores
2292 -8.00 81.32 35.1299 14.10433
F1 Math IRT estimated number right for F1 scores
2292 -8.00 80.53 30.6151 24.44134
F1 Socio-economic status composite, v.1 2292 -1.97 1.79 -.2774 .71021
Valid N (listwise) 2292
Correlations
F1 SES
com-
posite,
v.1
RAC
E
F1
TEAM
F1
HW
OUT
F1
EXTRA
F1
TV
DV
D
F1
GAMING
F1 Math IRT estimated number right for base year scores
Pearson Correlation
.280 .036 .146 .220 .191 .007 .008
Sig. (2-tailed) .000 .085 .000 .000 .000 .742 .693 N 2292 2292 2292 2292 2292 2292 2292 F1 Math IRT estimated number right for F1 scores
Pearson Correlation
.233 .049 .329 .333 .347 .064 .110
Sig. (2-tailed) .000 .020 .000 .000 .000 .002 .000
N 2292 2292 2292 2292 2292 2292 2292

90
APPENDIX C: WITHIN-SUBJECTS CONTRASTS

91
Tests of Within-Subjects Contrasts
Measure: MEASURE_1
Source
TIME
Type III Sum of Squares df
Mean Square F Sig.
Partial Eta
Squared
TIME Linear 799.508 1 799.508 4.184 .041 .002
TIME*F1SES1 Linear 112.573 1 112.573 .589 .443 .000
TIME*F1HWOUT Linear 14303.712 1 14303.712 74.859 .000 .032
TIME*RACE Linear 1220.974 1 1220.974 6.390 .012 .003
TIME*F1EXTRA Linear 6355.043 1 6355.043 33.259 .000 .014
TIME*F1TVDVD Linear 69.618 1 69.618 .364 .546 .000
TIME*F1GAMING Linear 735.008 1 735.008 .050 .002 .000
TIME*F1TEAM Linear 3938.880 1 3938.990 20.614 .000 .009
TIME*RACE * F1TEAM Linear 533.058 1 533.058 2.790 .095 .001
TIME*RACE * F1EXTRA Linear 21.426 1 21.426 .112 .738 .000
TIME*RACE * F1TVDVD Linear 183.601 1 183.601 .961 .327 .000
TIME*RACE * F1GAMING Linear 265.257 1 265.257 1.388 .239 .001
TIME*F1TEAM * F1EXTRA Linear 7406.020 1 7406.020 38.760 .000 .017
TIME*F1TEAM * F1TVDVD Linear 1335.469 1 1335.469 6.989 .008 .003
TIME*F1TEAM * F1GAMING Linear 1072.933 1 1072.933 5,615 .018 .002
TIME*F1EXTRA * F1TVDVD Linear 22.583 1 22.583 .118 .731 .000
TIME*F1EXTRA * F1GAMING
Linear 796.819 1 796.819 4.170 .041 .002
TIME*F1TVDVD * F1GAMING
Linear 1566.166 1 1566.166 8.197 .004 .004
Error 434504.716
2274 191.075

92
APPENDIX D: BETWEEN-SUBJECTS EFFECTS

93
Tests of Between-Subjects Effects
Measure: MEASURE_1 Transformed Variable: Average
Source Type III Sum of Squares df Mean Square F Sig.
Partial Eta
Squared
Intercept 2500839.902 1 2500839.902 6187.161 .000 .731
F1SES1 56064.923 1 56064.923 138.706 .000 .057
F1HWOUT 69702.777 1 69702.777 172.447 .000 .070
RACE 11199.520 1 11199.520 27.708 .000 .012
F1EXTRA 24822.698 1 24822.698 61.412 .000 .026
F1TVDVD 150.344 1 150.344 .372 .542 .000
F1GAMING 7,854 1 7.854 .019 .889 .000
F1TEAM 5593.968 1 5593.968 13.840 .000 .006
RACE * F1TEAM 157.749 1 157.749 .390 .532 .000
RACE * F1EXTRA 1.254 1 1.254 .003 .956 .000
RACE * F1TVDVD 262.632 1 262.632 .650 .420 .000
RACE * F1GAMING 1.308 1 1.308 .003 .955 .000
F1TEAM * F1EXTRA 3464.225 1 3464.225 8.571 .003 .004
F1TEAM * F1TVDVD 4003.419 1 4003.419 9.905 .002 .004
F1TEAM * F1GAMING 3151.135 1 3151.135 7.796 .005 .003
F1EXTRA * F1TVDVD 263.107 1 263.107 .651 .420 .000
F1EXTRA * F1GAMING 4087.926 1 4087.926 10.114 .001 .004
F1TVDVD * F1GAMING 4858.322 1 4858.322 12.020 .001 .005
Error 919146.900 2274 404.198

94
APPENDIX E: ESTIMATED MARGINAL MEANS
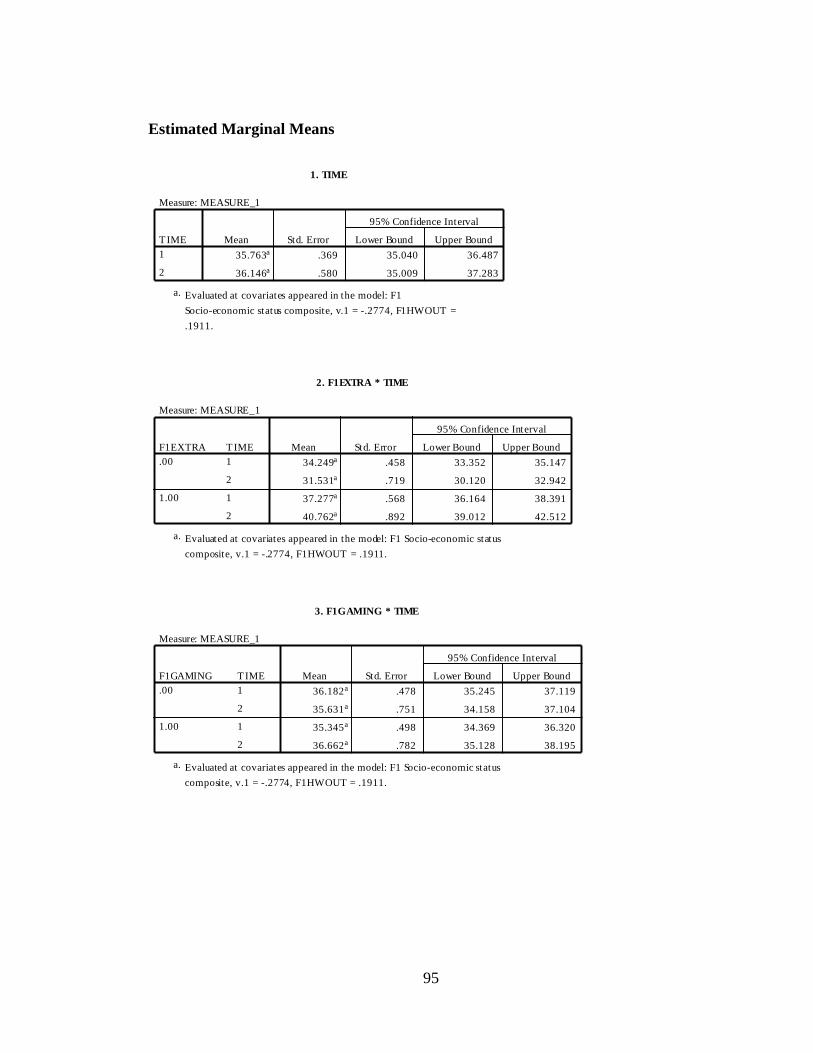
95
Estimated Marginal Means
1. TIME
Measure: MEASURE_1
35.763a .369 35.040 36.487
36.146a .580 35.009 37.283
TIME
1
2
Mean Std. Error Lower Bound Upper Bound
95% Confidence Interval
Evaluated at covariates appeared in the model: F1
Socio-economic status composite, v.1 = -.2774, F1HWOUT =
.1911.
a.
2. F1EXTRA * TIME
Measure: MEASURE_1
34.249a .458 33.352 35.147
31.531a .719 30.120 32.942
37.277a .568 36.164 38.391
40.762a .892 39.012 42.512
T IME
1
2
1
2
F1EXTRA
.00
1.00
Mean Std. Error Lower Bound Upper Bound
95% Confidence Interval
Evaluated at covariates appeared in the model: F1 Socio-economic status
composite, v.1 = -.2774, F1HWOUT = .1911.
a.
3. F1GAMING * TIME
Measure: MEASURE_1
36.182a .478 35.245 37.119
35.631a .751 34.158 37.104
35.345a .498 34.369 36.320
36.662a .782 35.128 38.195
T IME
1
2
1
2
F1GAMING
.00
1.00
Mean Std. Error Lower Bound Upper Bound
95% Confidence Interval
Evaluated at covariates appeared in the model: F1 Socio-economic status
composite, v.1 = -.2774, F1HWOUT = .1911.
a.

96
Estimated Marginal Means
4. F1TEAM * TIME
Measure: MEASURE_1
35.529a .514 34.521 36.538
33.473a .808 31.888 35.057
35.997a .517 34.984 37.011
38.820a .812 37.227 40.413
T IME
1
2
1
2
F1T EAM
.00
1.00
Mean Std. Error Lower Bound Upper Bound
95% Confidence Interval
Evaluated at covariates appeared in the model: F1 Socio-economic status
composite, v.1 = -.2774, F1HWOUT = .1911.
a.
5. F1TEAM * F1EXTRA * TIME
Measure: MEASURE_1
34.532a .404 33.739 35.325
26.105a .636 24.858 27.351
36.527a .940 34.684 38.369
40.841a 1.477 37.945 43.737
33.967a .809 32.379 35.554
36.957a 1.272 34.462 39.452
38.028a .613 36.826 39.230
40.682a .963 38.793 42.571
TIME
1
2
1
2
1
2
1
2
F1EXTRA
.00
1.00
.00
1.00
F1TEAM
.00
1.00
Mean Std. Error Lower Bound Upper Bound
95% Confidence Interval
Evaluated at covariates appeared in the model: F1 Socio-economic status composite, v.1
= -.2774, F1HWOUT = .1911.
a.
6. F1TEAM * F1GAMING * TIME
Measure: MEASURE_1
35.495a .632 34.256 36.733
31.234a .993 29.287 33.181
35.564a .728 34.136 36.993
35.712a 1.145 33.467 37.957
36.869a .741 35.416 38.323
40.028a 1.165 37.744 42.313
35.125a .712 33.729 36.521
37.611a 1.119 35.417 39.806
TIME
1
2
1
2
1
2
1
2
F1GAMING
.00
1.00
.00
1.00
F1TEAM
.00
1.00
Mean Std. Error Lower Bound Upper Bound
95% Confidence Interval
Evaluated at covariates appeared in the model: F1 Socio-economic status composite, v.1 =
-.2774, F1HWOUT = .1911.
a.

97
Estimated Marginal Means
7. F1EXTRA * F1GAMING * TIME
Measure: MEASURE_1
33.967a .634 32.723 35.210
29.206a .997 27.251 31.160
34.532a .625 33.306 35.758
33.856a .982 31.930 35.783
38.397a .734 36.958 39.837
42.056a 1.154 39.794 44.319
36.157a .818 34.554 37.761
39.467a 1.285 36.946 41.987
TIME
1
2
1
2
1
2
1
2
F1GAMING
.00
1.00
.00
1.00
F1EXTRA
.00
1.00
Mean Std. Error Lower Bound Upper Bound
95% Confidence Interval
Evaluated at covariates appeared in the model: F1 Socio-economic status composite, v.1 =
-.2774, F1HWOUT = .1911.
a.
8. F1TVDVD * F1GAMING * TIME
Measure: MEASURE_1
35.622a .503 34.634 36.609
33.487a .791 31.935 35.038
35.769a .698 34.401 37.137
38.089a 1.096 35.939 40.239
36.743a .752 35.267 38.218
37.775a 1.182 35.457 40.094
34.920a .654 33.638 36.203
35.234a 1.028 33.219 37.249
TIME
1
2
1
2
1
2
1
2
F1GAMING
.00
1.00
.00
1.00
F1TVDVD
.00
1.00
Mean Std. Error Lower Bound Upper Bound
95% Confidence Interval
Evaluated at covariates appeared in the model: F1 Socio-economic status composite, v.1 =
-.2774, F1HWOUT = .1911.
a.
9. F1TEAM * F1TVDVD * TIME
Measure: MEASURE_1
34.935a .644 33.671 36.198
31.147a 1.013 29.161 33.133
36.124a .722 34.709 37.540
35.799a 1.134 33.574 38.023
36.456a .668 35.145 37.767
40.429a 1.051 38.368 42.489
35.539a .793 33.984 37.093
37.211a 1.246 34.768 39.654
TIME
1
2
1
2
1
2
1
2
F1TVDVD
.00
1.00
.00
1.00
F1TEAM
.00
1.00
Mean Std. Error Lower Bound Upper Bound
95% Confidence Interval
Evaluated at covariates appeared in the model: F1 Socio-economic status composite, v.1
= -.2774, F1HWOUT = .1911.
a.
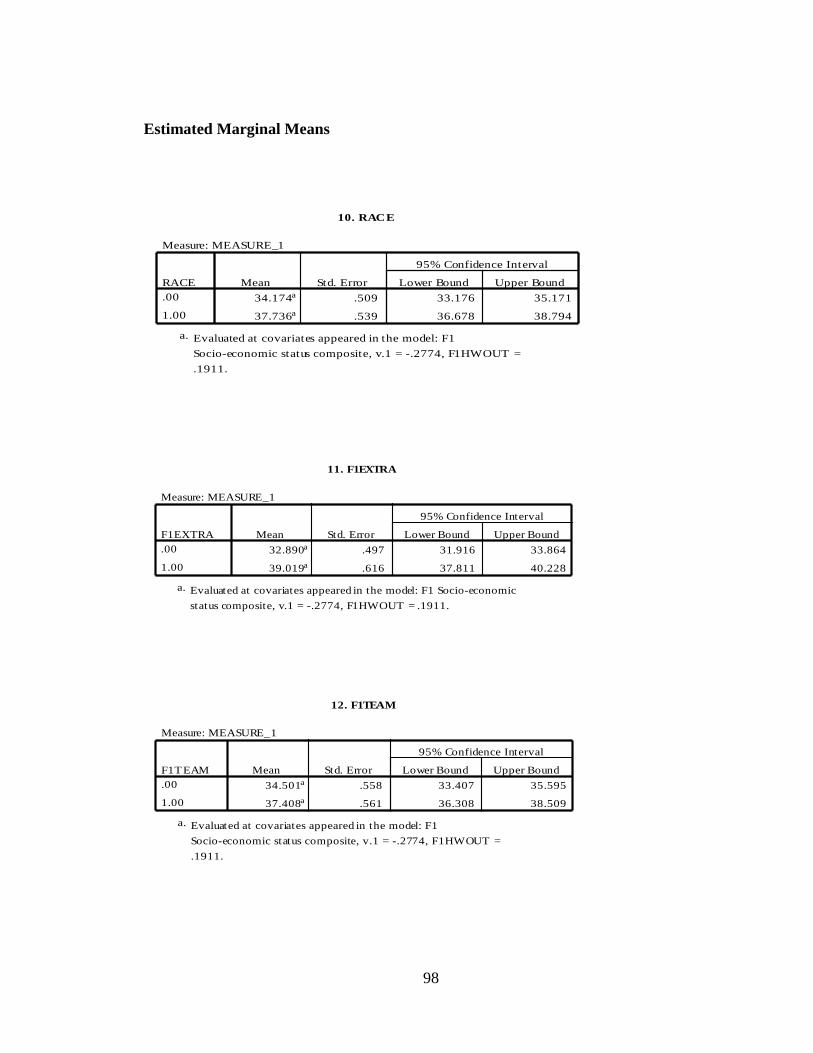
98
Estimated Marginal Means
10. RACE
Measure: MEASURE_1
34.174a .509 33.176 35.171
37.736a .539 36.678 38.794
RACE
.00
1.00
Mean Std. Error Lower Bound Upper Bound
95% Confidence Interval
Evaluated at covariates appeared in the model: F1
Socio-economic status composite, v.1 = -.2774, F1HWOUT =
.1911.
a.
11. F1EXTRA
Measure: MEASURE_1
32.890a .497 31.916 33.864
39.019a .616 37.811 40.228
F1EXTRA
.00
1.00
Mean Std. Error Lower Bound Upper Bound
95% Confidence Interval
Evaluated at covariates appeared in the model: F1 Socio-economic
status composite, v.1 = -.2774, F1HWOUT = .1911.
a.
12. F1TEAM
Measure: MEASURE_1
34.501a .558 33.407 35.595
37.408a .561 36.308 38.509
F1T EAM
.00
1.00
Mean Std. Error Lower Bound Upper Bound
95% Confidence Interval
Evaluated at covariates appeared in the model: F1
Socio-economic status composite, v.1 = -.2774, F1HWOUT =
.1911.
a.
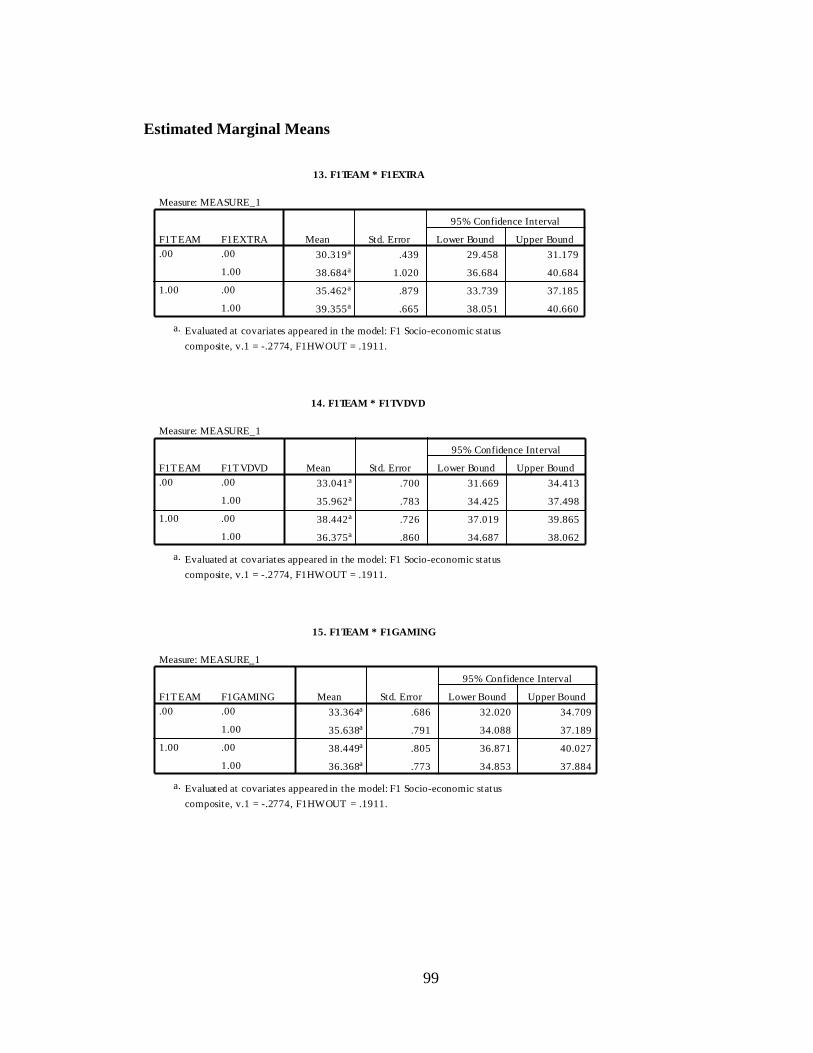
99
Estimated Marginal Means
13. F1TEAM * F1EXTRA
Measure: MEASURE_1
30.319a .439 29.458 31.179
38.684a 1.020 36.684 40.684
35.462a .879 33.739 37.185
39.355a .665 38.051 40.660
F1EXTRA
.00
1.00
.00
1.00
F1T EAM
.00
1.00
Mean Std. Error Lower Bound Upper Bound
95% Confidence Interval
Evaluated at covariates appeared in the model: F1 Socio-economic status
composite, v.1 = -.2774, F1HWOUT = .1911.
a.
14. F1TEAM * F1TVDVD
Measure: MEASURE_1
33.041a .700 31.669 34.413
35.962a .783 34.425 37.498
38.442a .726 37.019 39.865
36.375a .860 34.687 38.062
F1T VDVD
.00
1.00
.00
1.00
F1T EAM
.00
1.00
Mean Std. Error Lower Bound Upper Bound
95% Confidence Interval
Evaluated at covariates appeared in the model: F1 Socio-economic status
composite, v.1 = -.2774, F1HWOUT = .1911.
a.
15. F1TEAM * F1GAMING
Measure: MEASURE_1
33.364a .686 32.020 34.709
35.638a .791 34.088 37.189
38.449a .805 36.871 40.027
36.368a .773 34.853 37.884
F1GAMING
.00
1.00
.00
1.00
F1T EAM
.00
1.00
Mean Std. Error Lower Bound Upper Bound
95% Confidence Interval
Evaluated at covariates appeared in the model: F1 Socio-economic status
composite, v.1 = -.2774, F1HWOUT = .1911.
a.

100
Estimated Marginal Means
16. F1EXTRA * F1GAMING
Measure: MEASURE_1
31.586a .688 30.236 32.936
34.194a .678 32.864 35.524
40.227a .797 38.665 41.789
37.812a .888 36.071 39.553
F1GAMING
.00
1.00
.00
1.00
F1EXT RA
.00
1.00
Mean Std. Error Lower Bound Upper Bound
95% Confidence Interval
Evaluated at covariates appeared in the model: F1 Socio-economic status
composite, v.1 = -.2774, F1HWOUT = .1911.
a.
17. F1TVDVD * F1GAMING
Measure: MEASURE_1
34.554a .546 33.482 35.626
36.929a .757 35.444 38.414
37.259a .817 35.658 38.860
35.077a .710 33.686 36.469
F1GAMING
.00
1.00
.00
1.00
F1T VDVD
.00
1.00
Mean Std. Error Lower Bound Upper Bound
95% Confidence Interval
Evaluated at covariates appeared in the model: F1 Socio-economic status
composite, v.1 = -.2774, F1HWOUT = .1911.
a.
18. F1GAMING
Measure: MEASURE_1
35.907a .519 34.890 36.924
36.003a .540 34.944 37.062
F1GAMING
.00
1.00
Mean Std. Error Lower Bound Upper Bound
95% Confidence Interval
Evaluated at covariates appeared in the model: F1 Socio-economic
status composite, v.1 = -.2774, F1HWOUT = .1911.
a.

101
LIST OF REFERENCES
Aguinaga, J. A. (1994). Statistical abstract of the United States 1993.
Alwin, D. F. (1988). From obedience to autonomy: Changes in traits desired in children.
1924-1978. Public Opinion Quarterly, 52, 33-52.
Axelrod-Contrada, J. (1998). The Juggling Game. Career World, 27(3), 26.
Baines, L., & Stanley, G. (2003). Coaching Last Bastion of Academic Excellence?
Clearing House, 76(4), 217.
Baum, A. L. (1998). Young females in the athletic arena. Child and Adolescent
Psychiatric Clinics of North America, 7(4), 745-755.
Blyth, D., Simmons, R., & Bush, D. (1978). The transition into early adolescence: A
longitudinal comparison of youth in two educational contexts. Sociology of
Education, 51, 149–162.
Borders, L. D., & Drury, S. M. (1992). Comprehensive School Counseling Programs: A
Review for Policymakers and Practitioners. Journal of Counseling and
Development, 70(4), 487-498.
Braddock, J. (1981). Race, athletics, and educational attainment Youth & Society, 12,
335-350.
Britton, B., & Tesser, A. (1991). „Effects of time management practices on college
grades‟. Journal of Educational Psychology, 83(3), 405-410.
Broh, B. A. (2002). Linking Extracurricular Programming to Academic Achievement:
Who Benefits and Why? Sociology of Education, 75(1), 69-95.
Brown, R., & Evans, W. (2002). Extracurricular activity and ethnicity: Creating greater
school connection among diverse student populations. Urban Education, 37, 41-
58.
Caulfield, T. (1980). The successful ones. The Personnel and Guidance Journal, 59, 241-
245.
Coakley, J. (1978). Sport in society: Issues and controversies. St. Louis: The C. V.
Mosby Company.
Coleman, J. S. (1961). The Adolescent Society: Free Press of Glencoe.
Dickman, D., & Lammel, J. A. (2000). Getting to the Core of Student Athletic Standards.
Principal Leadership, 1(2), 30-32.

102
Eccles, J. S., & Barber, B. L. (1999). Student Council, Volunteering, Basketball, or
Marching Band: What Kind of Extracurricular Involvement Matters? Journal of
Adolescent Research, 14(1), 10-43.
Edwards, T. (1967). Scholarship and athletics. The Journal of Health, Physical
Education, and Recreation, 38, 75.
Eidsmoe, R. (1964). High school athletes are brighter. The Journal of Health, Physical
Education, and Recreation, 35, 53 -54.
Evans, E. M., Schweingruber, H., & Stevenson, H. W. (2002). Gender Differences in
Interest and Knowledge Acquisition: The United States, Taiwan, and Japan. Sex
Roles: A Journal of Research, 47, 34
Fejgin, N. (1994). Participation in high school competitive sports: A subversion of school
mission or contribution to academic goals? Sociology of Sports Journal, 11, 211-
230.
Fox, M. A., Connolly, B. A., & Snyder, T. D. (2005). Youth Indicators, 2005: Trends in
the Well-Being of American Youth. NCES 2005-050.
Fredricks, J. A., & Eccles, J. S. (2002). Children's Competence and Value Beliefs From
Childhood Through Adolescence: Growth Trajectories in Two Male-Sex-Typed
Domains. Developmental Psychology, 38(4), 519-533.
Gerber, S. B. (1996). Extracurricular activities and academic achievement. Journal of
Research & Development in Education, 30(1), 42-50.
Gifford, V. D., & Dean, M. M. (1990). Differences in extracurricular activity
participation, achievement, and attitudes toward school between ninth-grade
students attending junior high school and those attending senior high school.
Adolescence, 25(100), 799-802.
Greendorfer, S. L. (1987). Psycho-social correlates of organized physical activity.
Journal of Physical Education, Recreation and Dance, 58, 59-64.
Gysbers, N., Hughey K., Starr M., & Lapan, R. (1992). Improving school guidance
programs: A framework for program, personnel, and results evaluation. Journal of
Counseling & Development, 70, 565-570.
Gysbers, N. C., & Henderson, P. (2000). Developing and Managing your School
Guidance Program (3rd ed.). Alexandria, VA: American School Counselor
Haggerty, C., Dugoni, B., Reed, L., Cederlund, A., & Taylor, J. (1996). National
Education Longitudinal Study (NELS: 88/94) Methodology Report. Technical
Report.
Hanks, M. (1979). Race, Sexual Status and Athletics in the Process of Educational
Achievement. Social Science Quarterly, 60(3), 482 - 496.

103
Harvancik, M. J., & Golsan, G. (1986). Academic success and participation in high
school extracurricular activities: Is there a relationship? Paper presented at the
94th Annual Convention of the American Psychological Association Washington,
DC.
Hillman, C. H., Castelli, D. M., & Buck, S. M. (2005). Aerobic Fitness and
Neurocognitive Function in Healthy Preadolescent Children. Medicine & Science
in Sports & Exercise, 37(11), 1967-1974.
Holland, A., & Andre, T. (1987). Participation in extracurricular activities in secondary
school: What is known, what needs to be known? Review of Educational
Research, 57(4), 437-466.
Hood, A. B., Craig, A. F., & Ferguson, B. W. (1992). The impact of athletics, part-time
employment, and other activities on academic achievement. Journal of College
Student Development, 33(5), 447-453.
Ingels, S., Pratt D., Rogers, J., Seigel, P., and Stutts, E. (2005). Education Longitudinal
Study of 2002: Base-Year to First Follow-up Data File Documentation (NCES
2006–344). U.S. Department of Education, National Center for Education
Statistics. Washington, DC: U.S. Government Printing Office. Available:
http://nces.ed.gov/pubsearch.
Ingels, S. J., Burns, L. J., Charleston, S., Chen, X., Cataldi, E. F., & Owings, J. A.
(2005a). A Profile of the American High School Sophomore in 2002: Initial
Results From the Base Year of the Education Longitudinal Study of 2002.
Statistical Analysis Report. NCES 2005-338. Retrieved. from
http://search.ebscohost.com/login.aspx?direct=true&db=eric&AN=ED484427&si
te=ehost-live
Ingels, S. J., Burns, L. J., Charleston, S., Chen, X., Cataldi, E. F., & Owings, J. A.
(2005b). A Profile of the American High School Sophomore in 2002: Initial
Results from the Base Year of the Education Longitudinal Study of 2002.
Statistical Analysis Report. NCES 2005-338. National Center for Education
Statistics.
Jable, J. T. (1986). Participation in extracurricular activities in secondary school: What is
known, what needs to be known? Journal of Physical Education, Recreation, and
Dance, 57, 61 - 68.
Joekel, R. G. (1985). Student Activities and Academic Eligibility Requirements. NASSP
Bulletin 69(483), 3 - 9.
Jordan, W. J. (1999). Black High School Students' Participation in School-Sponsored
Sports Activities: Effects on School Engagement and Achievement. Journal of
Negro Education, 68(1), 54-71.

104
Kelley, W. (2002). Harnessing the river of time: A theoretical framework of time use
efficiency with suggestions for counselors. Journal of Employment Counseling
39(1), 12 - 21.
Knapp, L. G., Kelly-Reid, J. E., Whitmore, R. W., Wu, S., Huh, S., Levine, B., (2005).
Enrollment in Postsecondary Institutions, Fall 2002 and Financial Statistics,
Fiscal Year 2002. E.D. Tabs. NCES 2005-168. U.S. Department of Education.
Landers, D. M., & Landers, D. M. (1978). Socialization via Interscholastic Athletics: Its
Effects on Delinquency and Educational Attainment. Sociology of Education,
51(4), 299-303.
Larson, R., & Verma, S. (1999). How Children and Adolescents Spend Time Across
theWorld: Work, Play, and Developmental Opportunities. Psychological Bulletin,
125(6), 701-736.
Laughlin, N. T. (1978). Athletic participation and the grade point average, absences, cuts,
and disciplinary referrals of high school athletes. International Journal of Sport
Psychology, 9(2), 79-89.
Lemke, M., & Gonzales, P. (2006). U.S. Student and Adult Performance on International
Assessments of Educational Achievement. Findings from "The Condition of
Education, 2006." NCES 2006-073.
Linville, P. W. (1987). Self-Complexity as a Cognitive Buffer Against Stress-Related
Illness and Depression. Journal of Personality and Social Psychology, 52(4), 663-
676.
Lisella, L. C., & Serwatka, T. S. (1996). Extracurricular participation and academic
achievement in minority students in urban schools. Urban Review, 28(1), 63-80.
Marsh, H. W. (1992). Extracurricular Activities: Beneficial Extension of the Traditional
Curriculum or Subversion of Academic Goals? Journal of Educational
Psychology, 84(4), 553-562.
Marsh, H. W. (1993). The Effects of Participation in Sport During the Last Two Years of
High School. Sociology of Sports Journal, 1, 18 - 43.
McCarthy, B., & McCarthy, E. (1992). Intimate marriage. New York: Carroll and Graf.
McNeal, R. B., Jr. (1999). Participation in High School Extracurricular Activities:
Investigating School Effects. Social Science Quarterly 80(2), 291 - 309.
McNeal, R. B., Jr. (1998). High school extracurricular activities: Closed structures and
stratifying patterns of participation. Journal of Educational Research, 91, 183-
191.
McPherson, B. D. (1980). Sport in the Educational Milieu: Unanswered Questions and
Untested Assumptions. Phi Delta Kappan, 61(9), 605-606.

105
Melnick, M. J., Sabo, D. F., & Vanfossen, B. (1992). Educational effects of
interscholastic athletic participation on African-American and Hispanic youth.
Adolescence, 27(106), 295-308.
Misra, R., & McKean, M. (2000). College students' academic stress and its relation to
their anxiety, time management and leisure satisfaction. American Journal of
Health Studies, 16(1), 41.
Miller, P. & Kerr, G., (2002). The athletic, academic and social experiences of
intercollegiate student-athletes. Journal of Sport Behavior, 25(4), 346.
National Center for Education Statistics. (1994). National Education Longitudinal Study
(NELS), 1988 User’s Manual. Washington, DC: U.S. Department of Education.
National Federation of State High School, A. (2006). Participation in High School Sports
Increases Again; Confirms NFHS Commitment to Stronger Leadership. In
Personett, A. (ed).
http://www.nfhs.org/web/2006/09/participation_in_high_school_sports_increases
_again_confirms_nf.aspx
Nieman, D. C., & Pedersen, B. K. (1999). Exercise and immune function: Recent
developments. Sport Medicine, 27, 73 - 80.
Otto, E. P., & Alwin, D. F. (1977). Athletics, aspirations, and attainments. Sociology of
Education, 42, 102 - 113
Parsad, B., and Lewis, L. (2003). Remedial Education at Degree-Granting Postsecondary
Institutions in Fall 2000 (NCES 2004–010). Washington, DC: National Center for
Education Statistics.
Peltier, G. L., Laden, R. and Matranga, M. (1999l). Do high school athletes succeed in
college? A review of research. High School Journal, 82(4), 234.
Picou, J. S. (1978). Race, athletic achievement and educational aspiration. Sociological
Quarterly, 19(3), 429-438.
Picou, J. S., & Hwang, S. (1982). Educational aspirations of "educationally
disadvantaged" athletes. Journal of Sport Behavior, 5, 59 - 76.
Picou, J. S., McCarter, V., & Howell, F. M. (1985). Do high school athletics pay? Some
further evidence. Sociology of Sport Journal, 2 (1), 72 - 76.
Posner, J. K., & Vandell, D. L. (1999). After-School Activities and the Development of
Low-Income Urban Children: A Longitudinal Study. Developmental Psychology,
35(3), 868-879.
Schafer, W. E., & Armer, J. M. (1968). Athletes are not inferior students. Transaction, 6,
21-26, 61-62.

106
Schreiber, J. B., & Chambers, E. A. (2002). After-School Pursuits, Ethnicity, and
Achievement for 8th- and 10th-Grade Students. Journal of Educational Research,
96(2), 90.
Silliker, S. A., & Quirk, J. T. (1997). The effect of extracurricular activity participation
on the academic performance of male and. School Counselor, 44(4), 288.
Snyder, E. E., & Spreitzer, E. (1992). Social Psychological Concomitants of Adolescents'
Role Identities as Scholars and Athletes: A Longitudinal Analysis. Youth and
Society, 23(4), 507-522.
Spady, W. G. (1970). Lament for the letterman: Effects of peer status and extracurricular
activities on goals and achievement. American Journal of Sociology, 75, 680 -
702.
Stephens, L. J., & Schaben, L. A. (2002). The Effect of Interscholastic Sports
Participation on Academic Achievement of Middle Level School Students.
NASSP Bulletin, 86 (630), 34.
Stevenson, C. L. (1975). Socialization Effects of Participation in Sport: A Critical
Review of the Research. Research Quarterly, 46(3), 287-301.
Stuart, D. L. (1985). Academic preparation and subsequent performance of intercollegiate
football players. Journal of College Student Personnel, 26, 124-129.
Suggs, W. (2004). NCAA Weighs New Penalties for Academic Laggards. Chronicle of
Higher Education, 50(33), A42-A43.
Taylor, E. (1999). Bring in `Da Noise': Race, Sports, and the Role of Schools.
Educational Leadership, 56(7), 75.
Taylor, J. L., & Chiogioji, E. N. (1987). Implications of educational reform on high
school pe programs. Journal of Physical Education, Recreation & Dance 58(2).
Terenzini, P. T., & et al. (1996). Students' Out-of-Class Experiences and Their Influence
on Learning and Cognitive Development: A Literature Review. Journal of
College Student Development, 37(2), 149 - 162.
Vilhjalmsson, R., & Kristjansdottir, G. (2003). Gender differences in physical activity in
older children and adolescents: the central role of organized sport. 56(2), 365.
Walker, A., & Stott, K. (2000). Performance improvement in Schools: A Case of
overdose? Educational Management & Administration, 28(1), 63.
Ward, E. (1999). “History of the NCAA CHAMPS/Life Skills Program” In Gaining the
Competitive Edge: Enriching the Collegiate Experience of the New Student-
Athlete. Columbia National Resource Center for the First Year Experience and
Students in Transition, University of South Carolina.

107
Wells, R. H., & Picou, J. S. (1980). Interscholastic athletes and socialization for
educational achievement. Journal of Sport Behavior 3(3), 119 - 128.
Wirt, J., Choy, S., Rooney, P., Provasnik, S., Sen, A., & Tobin, R. (2004). The Condition
of Education 2004. NCES 2004-077. US Department of Education.
Worrell, F. C., & Bucknavage, L. B. (2004). Participation in extracurricular activities by
students attending assisted and prestige schools in Trinidad. Caribbean
Curriculum, 11, 129 - 147.
Zill, N., Booth, A., & Dunn, J. F. (1996). Family change and student achievement: What
we have learned, what it means for schools. In Family-school links: How do they
affect educational outcomes? (pp. 139-174): Lawrence Erlbaum Associates, Inc.
Zill, N., & Nord, C. W. (1994). Running in Place: How American Families are Faring in
a Changing Economy and an Individualistic Society. District of Columbia: Child
Trends, Inc.
Zill, N., Nord, C. W., & Loomis, L. S. (1995). Adolescent Time Use, Risky Behavior, and
Outcomes: An Analysis of National Data. Rockville: Westat, Inc.