an extracellular interactome of immunoglobulin and lrr
TRANSCRIPT

Supplemental Information
EXTENDED EXPERIMENTAL PROCEDURES
Bioinformatics for Drosophila IgSF, FnIII, and LRR-type ProteinsWe have built a list of all extracellular Drosophila IgSF, FnIII and LRR proteins (including the other L-Domain Superfamily proteins)
(Table S1) based on previously published annotations of these families (Dolan et al., 2007; Hynes and Zhao, 2000; Kurusu et al.,
2008; Vogel et al., 2003), and improved by several up-to-date databases and tools, including SMART (Letunic et al., 2012),
SUPERFAMILY (Wilson et al., 2009), Pfam (Punta et al., 2012) and InterPro (Hunter et al., 2009, 2012). We also manually checked
all proteins for expected features, such as signal peptides at their 50 ends, transmembrane helices and complete domain structures,
resulting in selecting better splice variants for expression and improving gene predictions by combining neighboring genes into single
proteins. Furthermore, in cases where expected protein features appeared to be incomplete or lacking (such as half an Ig domain at a
gene boundary, or a missing signal peptide at the 50 end), or when predictions were weak, we checked orthologous genes in other
available arthropod genomes to improve our gene predictions, gene boundaries and features such as signal peptides and transmem-
brane helices.
For the determination of signal peptides, transmembrane helices and GPI linkages, we used Phobius (Kall et al., 2007), SignalP
version 3 (Bendtsen et al., 2004), TMHMM version 2 (Krogh et al., 2001), Big-PI Predictor (Eisenhaber et al., 1999), and visual inspec-
tion of Kyte-Doolittle plots, coupled to searches in orthologous arthropod sequences when predictions were ambiguous. We also
searched literature for reported instances of GPI modifications for proteins of interest.
As a result, we have identified 129 IgSF, 59 FnIII and 71 LRR-containing Drosophila melanogaster proteins, making up a collection
of 202 proteins (Figure 1, step 1 and Table S1), with the said domains residing in the extracellular compartment. There are 43 proteins
that contain both extracellular IgSF and FnIII domains, 10 that contain both extracellular IgSF and LRR, and four that contain both
extracellular FnIII and LRR domains (Figure 1). Overall, the Drosophila genome encodes for �3300 proteins with signal peptides,
and �500 with a signal peptide (SP) and one transmembrane helix (TM) (Personal communication with Nick Grishin). The set of pro-
teins we identified, which are mostly SP+1TM proteins, makes a significant portion (�30%) of all Drosophila SP+1TM proteins.
For an overall analysis of all IgSF sequences, a multiple sequence alignment and a phylogenetic tree of all Drosophila IgSF (Fig-
ure S4) were created with Clustal Omega (Sievers et al., 2011). Phylogenetic trees are visualized and captured in Seaview (Gouy
et al., 2010) and Archaeopteryx (Han and Zmasek, 2009).
It should also be noted here that while IgSF and FnIII proteins are mostly extracellular, LRR protein family appears to be equally
represented in the intracellular and extracellular milieu. Most cell surface LRR proteins contain only this annotated domain in their
extracellular regions, but a few also contain IgSF and/or FnIII domains (Figure 1). Capitalization of protein names (in Figure 3 and else-
where applicable) was kept consistent with FlyBase gene Symbols (http://flybase.org) to avoid confusion between similarly named
genes and proteins.
Molecular Cloning of Drosophila cDNAA majority of genes (140 out of 202) were cloned from cDNA available from the BDGP and fly genetics community using TOPO TA
Cloning into pCR8/GW/TOPO (Invitrogen, K250020). The remaining genes (62) were cloned from Drosophila adult and embryonic
mRNA using RT-PCR, followed by TOPO TA Cloning. These vectors served as Gateway entry vectors for further cloning into two
expression vectors using LR Clonase II (Invitrogen, 11791020), one to express the gene in bait form and the other in prey (Figures
S1A and S1B). The expression vectors were built on pMT/BiP/V5 (Invitrogen, V4130-20), which uses a copper-inducible Drosophila
metallothionein promoter and has the signal sequence of the Drosophila BiP protein. For the bait expression vector, we inserted a
Gateway Recombination Cassette (Invitrogen, 11828-029), an HRV 3C Protease Site and an Fc tag from human IgG1 between
the existing BiP signal sequence and the C-terminal V5 antibody epitope and hexahistidine tags. For the prey expression vector,
we inserted a Gateway Recombination Cassette, an HRV 3C Protease Site, a pentameric helical section of the rat COMP protein,
and the human placental alkaline phosphate (AP), but also replaced the V5 antibody epitope with a FLAG antibody epitope.
Overall, we have successfully cloned 195 out of 202 target genes. During RT-PCR, we also fortuitously cloned four extra splice
variants (one for Ptp99A, one for Dscam2 and two for Sli), which we included in the Extracellular Interactome collection, raising
our collection size to 199. Finally, we included three more extracellular proteins of interest to our research groups, Appl, NetA and
NetB, bringing our collection to 202 transcripts in total.
Protein Expression and Western BlottingAll proteins were expressed in Drosophila Schneider 2 (S2) cells in Schneider’s medium (Lonza, Walkersville, MD) with 10% Fetal
Bovine Serum, 50 units/ml Penicillin, 50 mg/ml Streptomycin, and 2 mM L-Glutamine. S2 cells were transfected transiently using
Effectene (QIAGEN, 301425) following manufacturer’s notes. Transfected cells were induced for protein expression with 1 mM
CuSO4 18 hr after transfection, and media were collected three days after induction. Protease inhibitors (Sigma, P8849) and
0.02% NaN3 were added to collected media before storage at 4�C in 96-deep-well blocks. We have demonstrated that culture
medium containing expressed proteins can be stored at 4�C for up to a year without significant degradation of the proteins or change
in assay results (data not shown).
Every bait and prey sample produced was run on SDS-PAGE gels, blotted and probed with mouse anti-Penta-His antibody
(QIAGEN, 34660) for assessing protein expression. We utilized an Odyssey IR-Fluorescence imaging system (LI-COR) and
Cell 154, 228–239, July 3, 2013 ª2013 Elsevier Inc. S1
fluorophore labeled secondary antibodies to quantitate some of the bait and prey samples: Overall, we observed expression as high
as �0.2 mM in conditioned media. The lowest protein concentration we could detect and measure was 0.2 nM, for Vn-AP5. Expres-
sion for several samples could not be detected (see Table S1).
Extracellular Interaction AssayProtein A-coated plates (96-well format, Thermo Fisher Scientific, 15130) were washed with Phosphate-Buffered Saline (PBS) with
0.1% Tween-20, and 100 ml of medium containing secreted Fc-fusion proteins (bait) were added overnight at 4�C for bait capture.
Protein A plates were then blocked with PBSwith 1%Bovine Serum Albumin (BSA) for three hours at room temperature, and washed
with PBS with 1 mMCaCl2, 1 mMMgCl2, and 0.1%BSA. This was followed by incubation with 100 ml of medium containing secreted
AP5-fusion proteins (prey) at room temperature, and another wash. Finally, 100 ml of BluePhos Phosphatase Substrate (KPL, 50-88-
02) was added to each well. Absorbance at 650 nm was measured at 1 and 2 hr using a VersaMax microplate reader (Molecular
Dimensions), and images of these 96-well plates were scanned. We observed linear signal increase for Absorbance values up to
1.9 over the two-hour incubation, above which the signal saturated (data not shown).
The ECIAwas performedmostly by hand, assisted by simple liquid handling devices suchmulti-channel pipetters and 96-well plate
dispensers and washers; however, it can be automated for high through put using robotics.
We have included extensive positive and negative controls throughout our experimental setup. Data collected from each 96-well
plate contained several negative controls (four mock prey, and C. elegans SYG-2 in bait form against Dscam in prey form), and pos-
itive controls (C. elegans SYG-2 in bait form against C. elegans SYG-1 in prey form, and Dscam in bait form against Dscam in prey
form) as internal controls. Overall, data for each bait included tenmock prey controls, three negative controls (SYG-2 against Dscam)
and six positive controls. Finally, C. elegans SYG-2 in bait form and a mock transfection were tested against every prey, serving as
two more global negative controls.
The complete set of absorbance results were collated into a data matrix using Perl scripts, and analyzed in MATLAB (MathWorks).
Interactome Data AnalysisOur analysis pipeline included, first, normalizing ECIA measurements by bait (Fc). This produces Z-scores (standard deviations from
mean), and helps normalize against systematically higher values, such as those resulting from longer bait and prey incubations, or for
stickiness of baits. One modification we applied to Z-score calculation was to use trimmed means and standard deviations for the
calculation of Z-scores. This was necessary since true positives caused a non-Gaussian distribution of ECIA measurements and
inflate means and standard deviations. This, in turn, had led to many true positives being classified as non-interactors, especially
for proteins with very strong and numerous interactions. Note that we are not excluding any data: we are only removing extreme
values from the calculation of certain overall statistics, but using all data to complete the analysis. We chose to generate statistics
by trimming all values that are clear outliers by using low and high cutoffs. The values of these cutoffs were empirically determined
based on the observed distribution of all assay results. This resulted in exclusion of an average of only 3.6 (2%) (median = 2 [1%]) data
points per bait from the calculation of trimmed statistics.
The need for trimmed statistics can be demonstrated with the hub molecule CG10824 (Common DIP, DIPc). If Z-scores are calcu-
latedwith untrimmedmean and standard deviations, wemisleadingly observe zero prey that interact with CG10824-Fc at Z > 10 (max
Z is 7.2). However, using trimmed statistics, we have 22 preymolecules that interact with CG10824-Fc at Z > 10 (max Z is 697), which
is correctly indicative of CG10824’s interactions.
The data matrix, which had now bait-normalized Z-scores, was normalized along the prey axis. This accounted for ‘‘sticky’’ prey
proteins, and was crucial in removing non-specific interactions.
The need for normalization along the prey axis can be demonstrated with the ‘‘sticky’’ prey Dpr8-AP5. Out of 202 bait samples (Fc
molecules) tested against Dpr8-AP5, 122 have Zbait-normalized > 10, clearly an anomaly. After normalization along the prey, that number
was down to four, three of which were DIPs or DIPc.
In the next step, the symmetric nature of our data, i.e., the bait-prey swapping, was used to eliminate interactions that only
appeared in one orientation. We experimented with three methods: (1) Z > 10 and Zswapped > 10, (2) Stouffer’s Z > 10, and (3)
(Z*Zswapped)�1 > 10. Of these, the first method of requiring both orientation to have Z-scores above 10 proved too restrictive, as it
eliminated interactions such as Vein-Boi, where the protein quantities limited signal strength especially in one orientation (such as
in Boi-Fc versus Vein-AP5), but the interactions were genuine. The statistically rigorous Stouffer’s proved to be too lax, allowing
too many interactions, while not increasing the number of interactions we deemed likely or proven. Finally, the geometric mean of
Z’s, (Z*Zswapped)�1, appeared to be a conservative but still sensitive statistic, and was chosen.
In the last step of analysis, all interactions with (Z*Zswapped)�1 > 10 were investigated in the scanned images for confirmation. A
limited number of interactions (12 in total) where 10 < (Z*Zswapped)�1 < 25 were considered low confidence and removed, since
they involved sticky proteins, proteins that did not express appreciably, or scanned images of assay plates did not visually indicate
a color change. We also realized that the prey normalization step, which was crucial for removing sticky proteins, also decreased
Z-scores for several interactions of the Dpr/DIP/DIPc interaction network; we manually investigated our results, and added clear in-
teractions from this class to our list of positives. As the final confirmation, all the remaining interactions, deemed as ‘‘hits,’’ were
repeated with ECIA in both bait-prey orientations, using new batches of expression media for bait and prey. All were successfully
reproduced.
S2 Cell 154, 228–239, July 3, 2013 ª2013 Elsevier Inc.
ECIA Data: Internal Consistency and ReproducibilityOur assay setup includes an inherent control for internal consistency, which is that swapped bait-prey experiments should give non-
identical, but similar results.We actually make use of this consistency by calculating the geometric mean of the Z-scores of the swap-
ped pairs, and hence eliminating interactions that did not occur in both bait-prey orientations. The numerical values of the original
Absorbance(650 nm) measurements or the Z-scores for the bait/prey-swapped data points are not expected to be identical, since
these are mostly determined by protein expression levels of bait and prey. However, we still observed strong Pearson Correlation
Coefficients (CC) of 0.78 and 0.72 for the two interactome data sets for Absorbance(650 nm) values.
We have also assessed the reproducibility of our results. We performed two very large interactomes, first for the IgSF only and
second for the complete collection, which included the IgSF. There is a close match between the common parts of the two, which
can be visually assessed in Figure S2A versus Figure S2B, green triangle. The Pearson Correlation Coefficients between the two data
sets is 0.86. This high correlation is despite the fact that the interactomes were performedwith independently produced protein sam-
ples, and the assay results are strongly affected by the variable protein expression levels. Another way to assess the reproducibility is
tabulating the interactions observed in both interactomes: The strongly observed 22 interactions (ECIA scores > 100) of the smaller
Interactome were all observed in the second interactome, while out of all the 62 interactions observed in the smaller Interactome, 54
were also above our statistical significance cutoff in the larger Interactome. Of the remaining eight, all of them were observed in the
second Interactome in at least one orientation at 7 s or above, but failed to pass our stringent statistical limit. Both the correlation
statistics and the match between the lists of detected interactions indicate excellent reproducibility of the assay. The fact that all
detected interactions could later be reproduced also reinforces this point.
Other Properties of the ECIA DataWe have observed that several proteins, especially prey, produced systematically higher absorbance values, a consequence of
protein ‘‘stickiness.’’ In our data, we are able to distinguish between sticky proteins and interaction hubs, as sticky proteins
(such as Dpr8-AP5) have elevated background levels, but interaction hubs (such as CG10824-AP5) do not. This can be observed
in Figure 4B, which has ECIA measurements for sticky Dpr8-AP5 against many baits, all of which have elevated levels, with
only CG42343 and CG10824 (DIPc) significantly standing out as true interactions. However, the interaction hub CG10824-AP5
in Figure 4A has average background levels for proteins it does not interact with, while having many strong measurements for
its true interactors.
We looked into possible reasons for stickiness of certain proteins. We have not been able to find any biophysical property (such as
molecular weight, charge, isoelectric point or hydrophobicity) that is shared between sticky proteins. Therefore, we believe most
stickiness to result from the S2 strain in producing certain ECDs heterogeneously, where a fraction of the sample is not properly
folded.
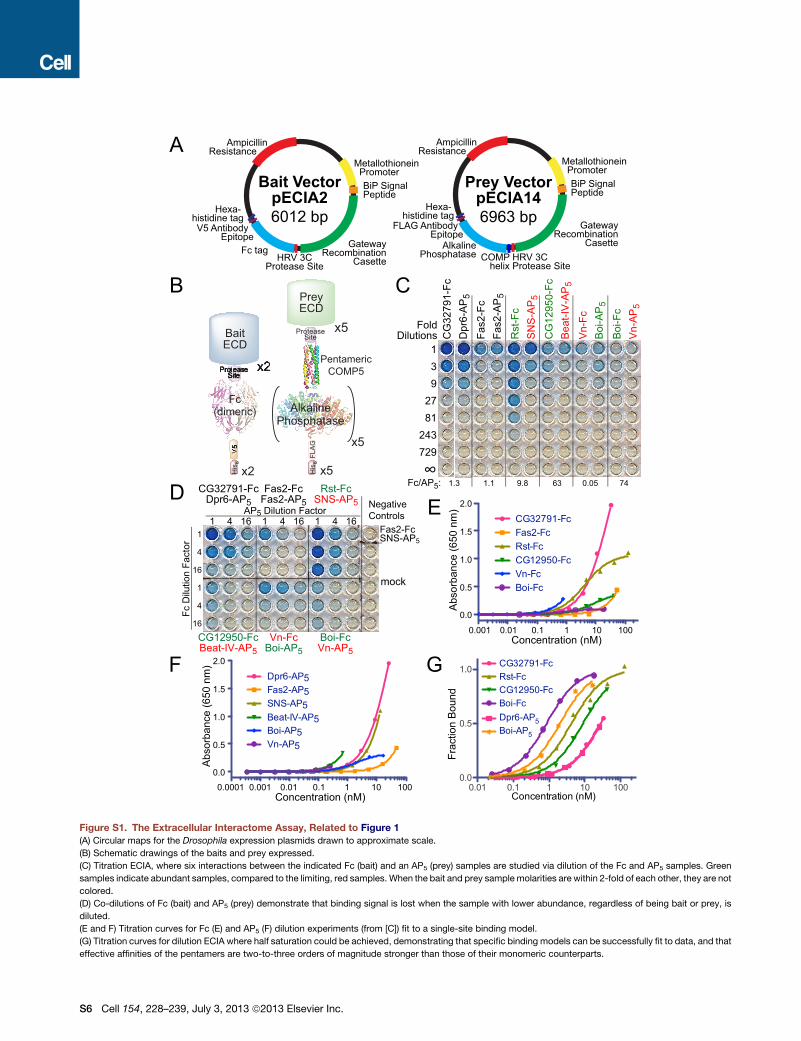
We also performed titrations of the ECIA by diluting the bait and prey samples for six selected interactions (Figures S1C–S1G). The
fact that the strength of the binding signal is determined by the concentration of the interaction partner in lower abundance, regard-
less of bait/prey orientation, indicates that the observed signal is the result of specific binding. Furthermore, the binding data fit to
single-site binding curves demonstrate that the effective affinity of pentameric prey are stronger by 20-fold (Dpr6-CG32791) to
70,000 fold (Vn-Boi) compared to monomeric proteins (Figure S1G, compare with Figure 4D).
We also observed very weak or no expression for 13% of target proteins. These lead to false negatives in our interactome, in two
prominent axon guidance complexes, Robo–Slit and Netrin-A–Unc-5. These false negatives result from poor expression of Slit and
Netrin-A, respectively. In the case of the missing Netrin-A–Unc-5 interaction, we are able to observe the very closely related Netrin-
B–Unc-5 complex. This was probably due to the a subcloning defect that resulted in expression of a truncated version of Netrin-B,
lacking its charged and sticky C-terminal tail, resulting in improved in-solution behavior (our unpublished data) for the still weakly
expressing Netrin-B. The Netrin-A ECD constructs contained the problematic C-terminal end.
Finally, it should be noted that ECIA might be less likely to detect homophilic interactions. Through oligomerization, we may be
favoring homophilic interactions within the prey oligomer, making the prey unavailable for interacting with the bait. This is an espe-
cially acute problem if the homophilic molecules interact in cis, where proteins align side by side. We do not know how much this
contributes to our false negative rate, but it is clearly not greatly detrimental, as we report homophilic interactions for 10% of our pro-
teins. Based on our database and literature survey of the proteins in this study (Table S2), ECIA has been able to detect 16 out of 24
known homophilic interactions (67%).
Definition of the DIP and Side FamiliesFor the Side family, we chose to follow Zinn (2009), which defined it as a family of eight closely related proteins (Figure S3B). This is
despite the fact that we did not observe interactions for four of these proteins (Figure 3B). However, we also did not observe inter-
actions for seven of the fourteen members of the Beat family, and it is likely that lack of functional expression of any of these Side and
Beat family members is the explanation for this lack of apparent binding partners.
For the DIP family, we have seen Dpr-interactions with eight proteins (Figure 3A) that meet the general sequence features
(Figures S3D and S3E) of the DIP family. We have added CG11320 to the list of DIPs, which is a close paralog of the DIPs
CG14010 and CG31646, and could not be expressed due to a mistake in our cloning that resulted in inclusion of its transmem-
brane helix in the secretion construct (see Table S1 for details). Two more proteins, CG31814 and CG40378, also displayed
Cell 154, 228–239, July 3, 2013 ª2013 Elsevier Inc. S3
significant sequence similarity to DIPs and shared overall DIP features. However, these two were successfully expressed. We
include these two as putative DIPs, and suggest that lack of Dpr-interactors for them might be the result of lack of expression
of their Dpr partners. Dpr4 and Dpr15 do not express appreciably and therefore might be potential interactors of CG11320,
CG31814, and CG40378.
In addition to these, we observed the recently discovered gene CG42596 to be closely related to Dprs, constituting a possible
‘‘Dpr21.’’ This gene was not annotated at the time of our cloning, and therefore, we did not include it in our Interactome screen.
Analysis of Previous Large-Scale Interactome DataFor all genes included in our list, we have analyzed all large-scale interactome data sets deposited to the DroID database using Cyto-
scape version 2.8.3 (Shannon et al., 2003; Smoot et al., 2011) and the DroID plugin version 1.5 with the April 2012 release (data
version 2012_04) of DroID. We also parsed Table S3 from Guruharsha et al. (2011) for complete DPiM data. All interactions reported
for our gene collection by previous large-scale interactomes are tabulated Table S3. None of these interactions are within our list of
observed interactions. Only one interaction reported by DPiM for the protein ImpL2, with Ilp2 – a protein that was not studied by us
since it has no Ig, FnIII or LRR domains, is independently reported in the literature (Honegger et al., 2008) (Table S4, yellow row). Inter-
estingly, this interaction is between two secreted proteins, not cell surface proteins, and is therefore not affected by some of the pit-
falls others and we report for the established interactome methodologies.
Within the large-scale experimental DroID data, when all significance filters were removed and all interactions were filtered for
having as both interactors IgSF, FnIII and LRR proteins, there were seven interactions observed: five were from DPiM and two
were from the Finley Lab Y2H (Table S4, white rows). Two of these interactions, both from DPiM, were either observed in our Extra-
cellular Interactome or are plausible; however, neither of these passed the significance score used by the authors of their study, and
therefore do not count as bona fide discoveries.
We have also searched published literature for all extracellular interactions of the proteins included in our interactome. Results are
tabulated in Table S1 next to relevant proteins in column T, and in Table S2.
Baculoviral Expression, Protein Purification, Gel Filtration Chromatography, and SPRFor biophysical studies, extracellular domains for proteins of interest were further cloned into the baculovirus transfer vector
pAcGP67A (BDBiosciences, 554756) with C-terminal hexahistidine tags. Baculoviruses were produced in Sf9 cells using BaculoGold
linearized baculovirus DNA (BD Biosciences, 552846) and Cellfectin II (Invitrogen, 10362-100). Protein expression was done in High
Five cells at 27�C for 48 to 66 hr, depending on the degradation sensitivity of the protein expressed. Proteins were then purified over
Nickel-Nitrilotriacetic acid (Ni-NTA) Agarose (QIAGEN, 30250) columns and with gel filtration chromatography, using Superdex 200
columns (GE Healthcare), in 10 mM HEPES pH 7.2, 150 mM NaCl.
For Surface Plasmon Resonance experiments, expression plasmids were designed to have an Avi-tag C-terminal to the protein
of interest but N-terminal to the hexahistidine tag. High Five cells were co-transfected with baculoviruses for the Avi-tagged
protein of interest and the biotin ligase BirA (secreted) in the presence of 100 mM D-Biotin for in-culture biotinylation. These
C-terminally biotinylated proteins were used as ligands (stationary phase) in SPR experiments, while biotin-free samples were
used as analytes (mobile phase). Biacore experiments were performed with a Biacore T100 (GE Healthcare) at 25�C using SA
(Streptavidin-coupled Carboxymethyl Dextran) chips. In most cases, 10 mM HEPES pH 7.2, 150 mM NaCl, 1% BSA, and
0.05% Polysorbate-20 was used as the mobile phase buffer. Dissociation constants (Kd) were calculated by fitting Langmuir
isotherms to steady state responses, and kinetic constants (kon, koff) were calculated by fitting the complete response curves.
In many cases, fast kinetics of binding prevented us from acquiring reliable kinetics values, but equilibrium parameters (dissoci-
ation constants) were accurately collected. In the case for the Unc-5–SNS interaction, where we attempted to measure a very
weak affinity (with KD �0.5 mM) and full saturation of the surface with analyte could not be achieved, we predicted maximum
response units (Rmax) based on response units captured of the ligand on the SPR chip surface, and used the predicted Rmax in
fitting our results for an approximate KD.
Among the SPR-validated interactions we confirmed were those of Dpr6 against the DIP CG32791, and the common DIP
CG10824. Curiously, CG32791 is one of the few Dpr/DIPs that did not bind the common DIP. Our SPR results have confirmed
that CG32791 and CG10824 do not interact appreciably (Kd [ 30 uM, data not shown).
In Vivo Staining of Drosophila EmbryosStaining of live-dissected stage 16 Drosophila embryos with AP5 fusion proteins was done as previously described in Fox and Zinn
(2005), and Lee et al. (2009). Supernatants from S2 cell culture containing the AP5 fusion proteins were concentrated 5-fold in
Amicon Ultra-4 Centrifugal Filter Units (100 kDa cutoff), and these concentrates were used directly for staining. Following incuba-
tion with AP5 fusion proteins, embryos were fixed, and labeled with antibodies. The primary antibodies used were rabbit anti-AP
(Serotec) at 1:500 and mAb 1D4 (anti-Fas2) at 1:3. The secondary antibodies were Alexa-Fluor anti-mouse 568 and Alexa-Fluor
anti-rabbit 488, both at 1:1000. Imaging was performed on a Zeiss Axioplan microscope with a 40 x water-immersion objective.
Overexpression of CG14521 in muscles (Figure 7F) was achieved by combining a UAS-containing insertion upstream of the gene
with the muscle-specific 24B-GAL4 driver.
S4 Cell 154, 228–239, July 3, 2013 ª2013 Elsevier Inc.
SUPPLEMENTAL REFERENCES
Bendtsen, J.D., Nielsen, H., von Heijne, G., and Brunak, S. (2004). Improved prediction of signal peptides: SignalP 3.0. J. Mol. Biol. 340, 783–795.
Eisenhaber, B., Bork, P., and Eisenhaber, F. (1999). Prediction of potential GPI-modification sites in proprotein sequences. J. Mol. Biol. 292, 741–758.
Eswar, N., Webb, B., Marti-Renom, M.A., Madhusudhan, M.S., Eramian, D., Shen, M.-Y., Pieper, U., and Sali, A. (2006). Comparative protein structure modeling
using MODELLER. In Current Protocols in Protein Science (Brooklyn, NY: Wiley), pp. 2.9.1–2.9.31.
Gouy, M., Guindon, S., and Gascuel, O. (2010). SeaView version 4: A multiplatform graphical user interface for sequence alignment and phylogenetic tree build-
ing. Mol. Biol. Evol. 27, 221–224.
Han, M.V., and Zmasek, C.M. (2009). phyloXML: XML for evolutionary biology and comparative genomics. BMC Bioinformatics 10, 356.
Honegger, B., Galic, M., Kohler, K., Wittwer, F., Brogiolo, W., Hafen, E., and Stocker, H. (2008). Imp-L2, a putative homolog of vertebrate IGF-binding protein 7,
counteracts insulin signaling in Drosophila and is essential for starvation resistance. J. Biol. 7, 10.
Hunter, S., Apweiler, R., Attwood, T.K., Bairoch, A., Bateman, A., Binns, D., Bork, P., Das, U., Daugherty, L., Duquenne, L., et al. (2009). InterPro: the integrative
protein signature database. Nucleic Acids Res. 37(Database issue), D211–D215.
Hunter, S., Jones, P., Mitchell, A., Apweiler, R., Attwood, T.K., Bateman, A., Bernard, T., Binns, D., Bork, P., Burge, S., et al. (2012). InterPro in 2011: new de-
velopments in the family and domain prediction database. Nucleic Acids Res. 40(Database issue), D306–D312.
Hynes, R.O., and Zhao, Q. (2000). The evolution of cell adhesion. J. Cell Biol. 150, F89–F96.
Kall, L., Krogh, A., and Sonnhammer, E.L.L. (2007). Advantages of combined transmembrane topology and signal peptide prediction–the Phobius web server.
Nucleic Acids Res. 35, W429–W432.
Kelley, L.A., and Sternberg, M.J.E. (2009). Protein structure prediction on the Web: a case study using the Phyre server. Nat. Protoc. 4, 363–371.
Krogh, A., Larsson, B., von Heijne, G., and Sonnhammer, E.L. (2001). Predicting transmembrane protein topology with a hidden Markov model: application to
complete genomes. J. Mol. Biol. 305, 567–580.
Letunic, I., Doerks, T., and Bork, P. (2012). SMART 7: recent updates to the protein domain annotation resource. Nucleic Acids Res. 40(Database issue), D302–
D305.
Punta, M., Coggill, P.C., Eberhardt, R.Y., Mistry, J., Tate, J., Boursnell, C., Pang, N., Forslund, K., Ceric, G., Clements, J., et al. (2012). The Pfam protein families
database. Nucleic Acids Res. 40(Database issue), D290–D301.
Shannon, P., Markiel, A., Ozier, O., Baliga, N.S., Wang, J.T., Ramage, D., Amin, N., Schwikowski, B., and Ideker, T. (2003). Cytoscape: a software environment for
integrated models of biomolecular interaction networks. Genome Res. 13, 2498–2504.
Sievers, F., Wilm, A., Dineen, D., Gibson, T.J., Karplus, K., Li, W., Lopez, R., McWilliam, H., Remmert, M., Soding, J., et al. (2011). Fast, scalable generation of
high-quality protein multiple sequence alignments using Clustal Omega. Mol. Syst. Biol. 7, 539.
Smoot, M.E., Ono, K., Ruscheinski, J., Wang, P.-L., and Ideker, T. (2011). Cytoscape 2.8: new features for data integration and network visualization. Bioinfor-
matics 27, 431–432.
Wilson, D., Pethica, R., Zhou, Y., Talbot, C., Vogel, C., Madera, M., Chothia, C., and Gough, J. (2009). SUPERFAMILY—sophisticated comparative genomics,
data mining, visualization and phylogeny. Nucleic Acids Res. 37(Database issue), D380–D386.
Zhong, J., Zhang, H., Stanyon, C.A., Tromp, G., and Finley, R.L., Jr. (2003). A strategy for constructing large protein interaction maps using the yeast two-hybrid
system: regulated expression arrays and two-phase mating. Genome Res. 13, 2691–2699.
Cell 154, 228–239, July 3, 2013 ª2013 Elsevier Inc. S5
Gateway Recombination
Casette
BiP SignalPeptide
Metallothionein Promoter
AmpicillinResistance
Bait VectorpECIA26012 bp
Fc tagHRV 3C
Protease Site
V5 Antibody Epitope
Hexa- histidine tag
Prey VectorpECIA146963 bp
AlkalinePhosphatase
FLAG Antibody Epitope
Hexa- histidine tag
Gateway Recombination
Casette
BiP SignalPeptide
Metallothionein Promoter
AmpicillinResistance
HRV 3CProtease Site
COMPhelix
A
PentamericCOMP5
FLA
GH
is6
x5
x5
x2
V5
His
6
ProteaseSite
BaitECD
x2
ProteaseSite
PreyECD
PS
x2
5V
5V
5V
5555555V
5V
5V
5V
5V
5V
5V
55V
5VVVVVVVV
5555VVV
55
SSSSSSProt eeaseePro eesaPro aaaaoooootototeeeeaaaaaaoooooooooo eeeaaaaaeot
SSSSiteSiteSitSiSSiteeeSiteSSSSSSSSSSSS eitx22x2222x2x22
Fc(dimeric)
x5
AlkalinePhosphatase
C
CG32791-FcDpr6-AP5
Fas2-FcFas2-AP5
Rst-FcSNS-AP5
CG12950-FcBeat-IV-AP5
Vn-FcBoi-AP5
Boi-FcVn-AP5
NegativeControls
Fas2-FcSNS-AP5
mock
Fc D
ilutio
n Fa
ctor
1
4
16
1
4
16
1 4 16 1 4 16 1 4 16AP5 Dilution Factor
FoldDilutions
Fc/AP5: 1.3 1.1 9.8 63 0.05 74
139
2781
243729
∞C
G32
791-
Fc
Fas2
-Fc
Rst
-Fc
CG
1295
0-Fc
Vn-
Fc
Boi
-Fc
Dpr
6-A
P5
Fas2
-AP
5
SN
S-A
P5
Bea
t-IV
-AP
5
Boi
-AP
5
Vn-
AP
5
DE
F G
Frac
tion
Bou
ndA
bsor
banc
e (6
50 n
m) 2.0
1.5
1.0
0.5
0.0
0.001 0.01 0.1 1 10 100Concentration (nM)
Abs
orba
nce
(650
nm
)
0.001 0.01 0.1 1 10 1000.0001
2.0
1.5
1.0
0.5
0.0
Concentration (nM)
B
Figure S1. The Extracellular Interactome Assay, Related to Figure 1
(A) Circular maps for the Drosophila expression plasmids drawn to approximate scale.
(B) Schematic drawings of the baits and prey expressed.
(C) Titration ECIA, where six interactions between the indicated Fc (bait) and an AP5 (prey) samples are studied via dilution of the Fc and AP5 samples. Green
samples indicate abundant samples, compared to the limiting, red samples. When the bait and prey samplemolarities are within 2-fold of each other, they are not
colored.
(D) Co-dilutions of Fc (bait) and AP5 (prey) demonstrate that binding signal is lost when the sample with lower abundance, regardless of being bait or prey, is
diluted.
(E and F) Titration curves for Fc (E) and AP5 (F) dilution experiments (from [C]) fit to a single-site binding model.
(G) Titration curves for dilution ECIA where half saturation could be achieved, demonstrating that specific binding models can be successfully fit to data, and that
effective affinities of the pentamers are two-to-three orders of magnitude stronger than those of their monomeric counterparts.
S6 Cell 154, 228–239, July 3, 2013 ª2013 Elsevier Inc.
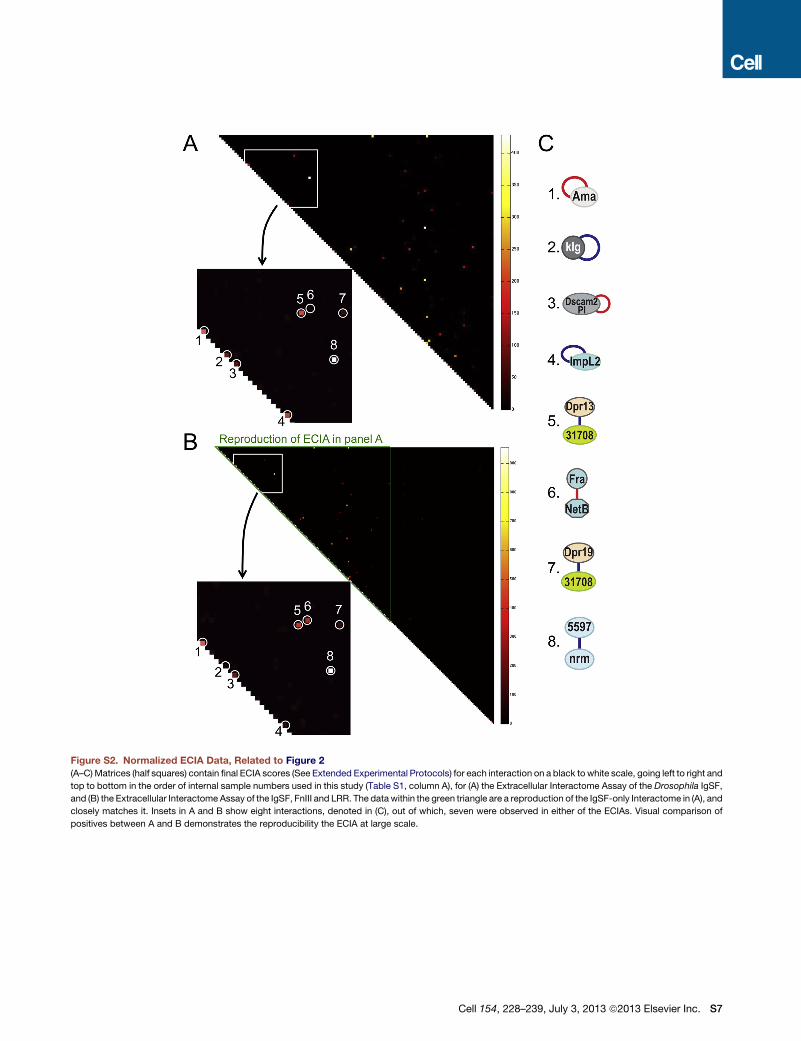
Figure S2. Normalized ECIA Data, Related to Figure 2
(A–C)Matrices (half squares) contain final ECIA scores (See Extended Experimental Protocols) for each interaction on a black to white scale, going left to right and
top to bottom in the order of internal sample numbers used in this study (Table S1, column A), for (A) the Extracellular Interactome Assay of the Drosophila IgSF,
and (B) the Extracellular Interactome Assay of the IgSF, FnIII and LRR. The data within the green triangle are a reproduction of the IgSF-only Interactome in (A), and
closely matches it. Insets in A and B show eight interactions, denoted in (C), out of which, seven were observed in either of the ECIAs. Visual comparison of
positives between A and B demonstrates the reproducibility the ECIA at large scale.
Cell 154, 228–239, July 3, 2013 ª2013 Elsevier Inc. S7
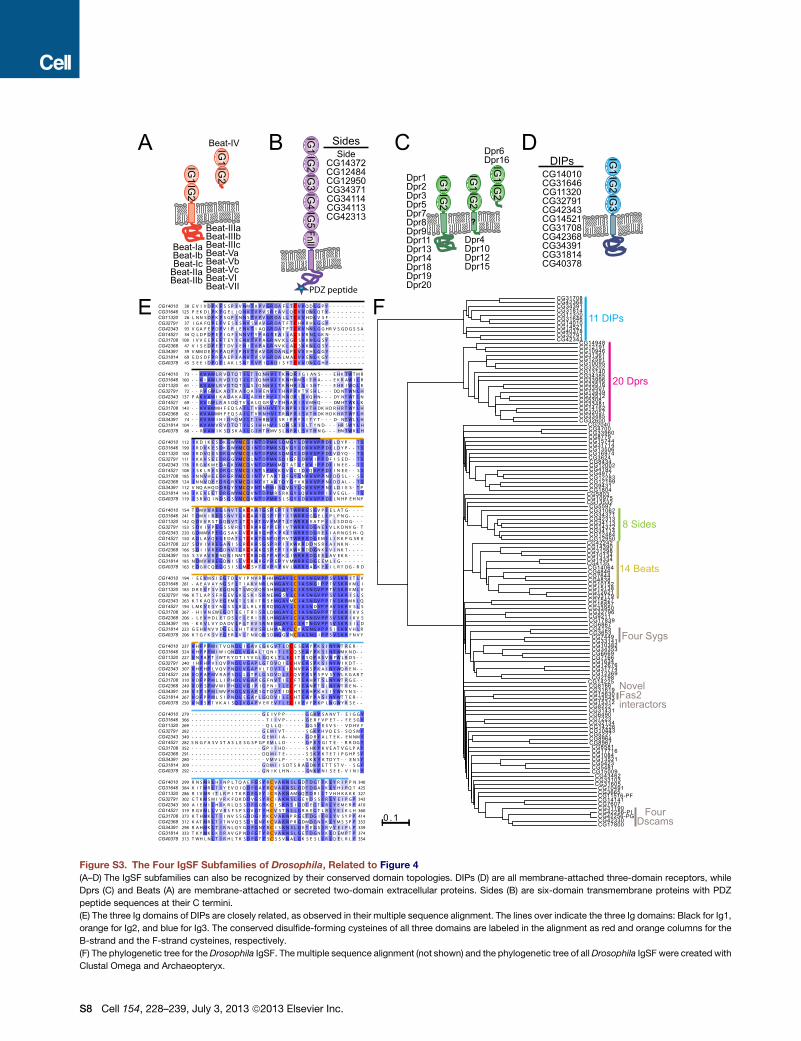
Figure S3. The Four IgSF Subfamilies of Drosophila, Related to Figure 4
(A–D) The IgSF subfamilies can also be recognized by their conserved domain topologies. DIPs (D) are all membrane-attached three-domain receptors, while
Dprs (C) and Beats (A) are membrane-attached or secreted two-domain extracellular proteins. Sides (B) are six-domain transmembrane proteins with PDZ
peptide sequences at their C termini.
(E) The three Ig domains of DIPs are closely related, as observed in their multiple sequence alignment. The lines over indicate the three Ig domains: Black for Ig1,
orange for Ig2, and blue for Ig3. The conserved disulfide-forming cysteines of all three domains are labeled in the alignment as red and orange columns for the
B-strand and the F-strand cysteines, respectively.
(F) The phylogenetic tree for theDrosophila IgSF. Themultiple sequence alignment (not shown) and the phylogenetic tree of allDrosophila IgSF were created with
Clustal Omega and Archaeopteryx.
S8 Cell 154, 228–239, July 3, 2013 ª2013 Elsevier Inc.
A B
0.05
0.1
0.15
0.2
0.25
0.3
0.35
0.4Full lengthN+D1
D1D2D3
D1+D2D2+D3
D1+D2+D3+c
Full
EC
DD
1D
2D
3D
4D
5D
6D
1+D
2D
1–D
4D
3+D
4D
3–D
6D
5+D
6
Vn-
Fc (B
ait)
Boi-AP5 (Prey)
Absorbance(650 nm)
Vn
boi ihog
Egfr
kek1
Hh
HhCHhN
H
HH
H
Ig IgIgIg FnIII FnIIID1 D2 D3 D4 D5 D6
Ig EGFN D1 D2 D3 c
?
Hh:
Ihog/Boi:
Vn:
EGFR: L FU L FU TyrK TyrK
EGFR
Vn
BoiHh
cytoplasm
extracellularspace
C
D
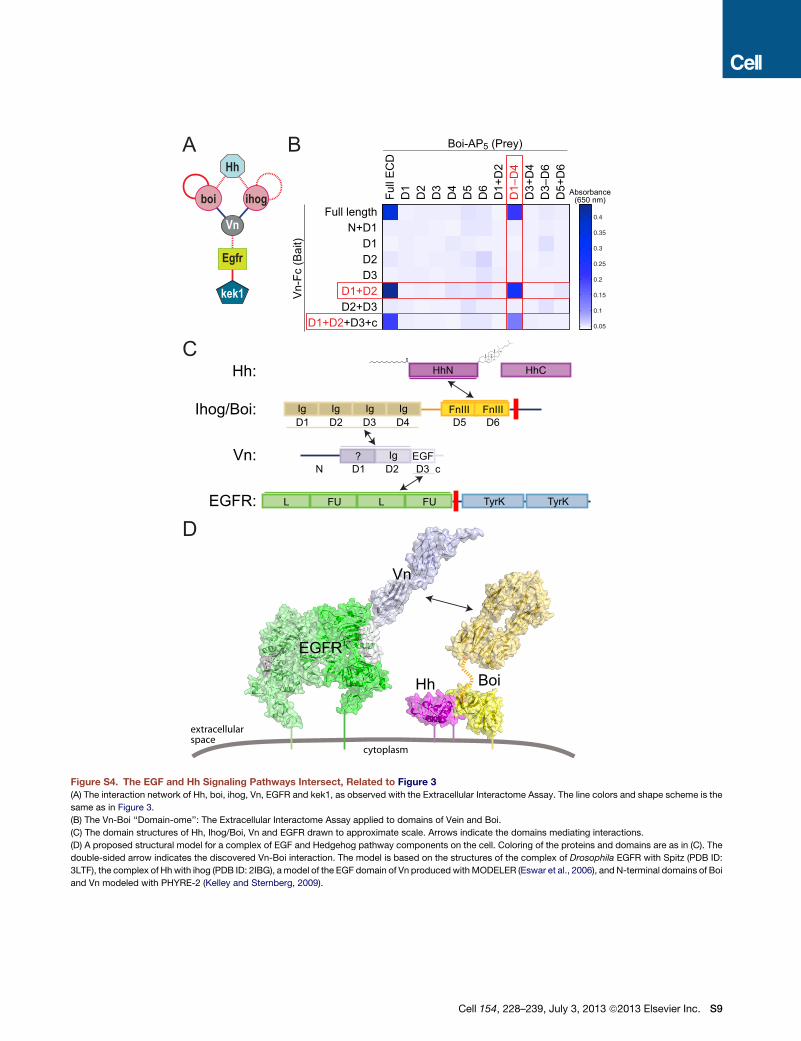
Figure S4. The EGF and Hh Signaling Pathways Intersect, Related to Figure 3
(A) The interaction network of Hh, boi, ihog, Vn, EGFR and kek1, as observed with the Extracellular Interactome Assay. The line colors and shape scheme is the
same as in Figure 3.
(B) The Vn-Boi ‘‘Domain-ome’’: The Extracellular Interactome Assay applied to domains of Vein and Boi.
(C) The domain structures of Hh, Ihog/Boi, Vn and EGFR drawn to approximate scale. Arrows indicate the domains mediating interactions.
(D) A proposed structural model for a complex of EGF and Hedgehog pathway components on the cell. Coloring of the proteins and domains are as in (C). The
double-sided arrow indicates the discovered Vn-Boi interaction. The model is based on the structures of the complex of Drosophila EGFR with Spitz (PDB ID:
3LTF), the complex of Hhwith ihog (PDB ID: 2IBG), amodel of the EGF domain of Vn produced withMODELER (Eswar et al., 2006), and N-terminal domains of Boi
and Vn modeled with PHYRE-2 (Kelley and Sternberg, 2009).
Cell 154, 228–239, July 3, 2013 ª2013 Elsevier Inc. S9
50
150
250
350
450
550
-20 -10 0 10 20 30 40 50 60 70 80 Time (s)
Res
pons
e (R
U)
100 200 300 400 500
0 2 4 6 8 10
Res
pons
e (R
U)
Concentration (μM)
Kd = 469 ± 10 nM
0 50
100 150 200 250 300 350
-20 -10 0 10 20 30 40 50 60 Time (s)
)U
R(esnopse
R
50 100 150 200 250 300 350
0 2 4 6 8 10 12 14
)U
R(esnopse
R
Concentration (μM)
Kd = 1.46 ± 0.18 μM
A B
C D
250
0
50
100
150
200
-20 -10 0 10 20 30 40 50 60Time (s)
Res
pons
e (R
U)
50100150200250300
0 2 4 6 8 10 12 14Concentration (μM)
Res
pons
e (R
U)
Kd = 3.1 ± 0.1 μM
Kd = 2.6 ± 0.2 μM
-500
50100150200250300350400450
-50 0 50 100 150 200Time (s)
Res
pons
e (R
U)
050
100150200250300350400450
0 1 2 3 4 5 6 7 8
Res
pons
e (R
U)
Concentration (μM)
12.5 μM6.253.131.560.780.390.200.100.0490.024
12.5 μM6.253.131.560.780.390.200.100.0490.0240.012
10 μM52.51.250.630.310.310.160.0780.0390.0200.010
8 μM4210.50.250.130.0630.0310.0160.0078
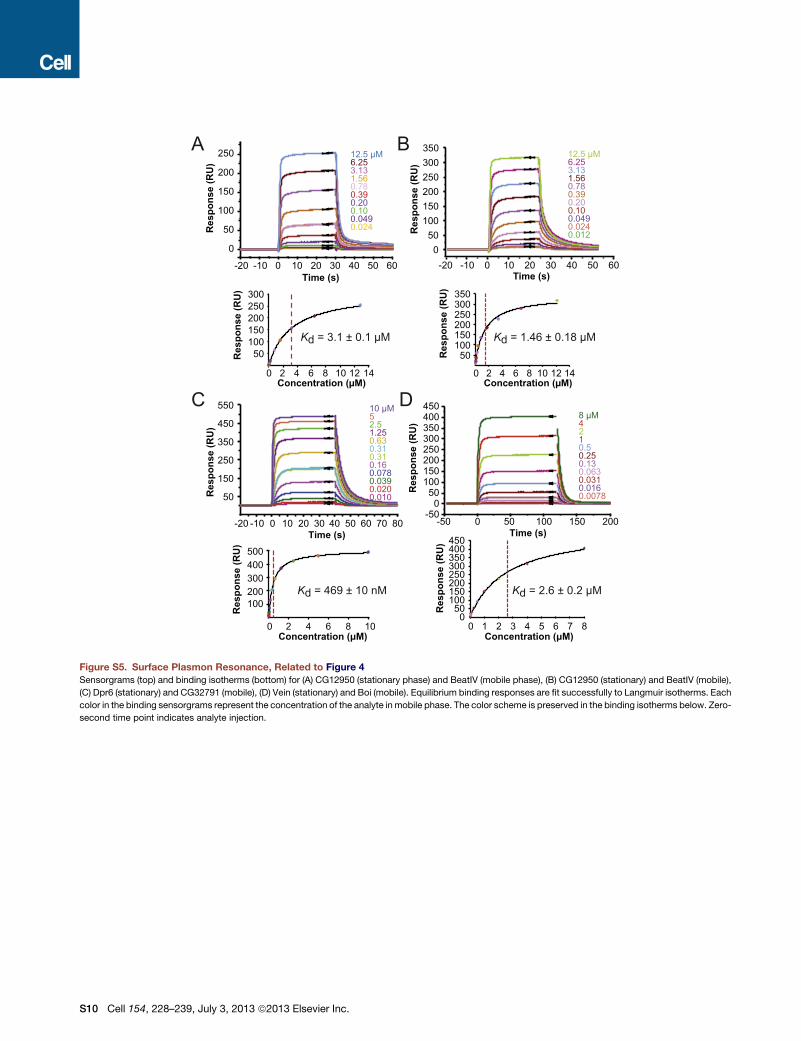
Figure S5. Surface Plasmon Resonance, Related to Figure 4
Sensorgrams (top) and binding isotherms (bottom) for (A) CG12950 (stationary phase) and BeatIV (mobile phase), (B) CG12950 (stationary) and BeatIV (mobile),
(C) Dpr6 (stationary) and CG32791 (mobile), (D) Vein (stationary) and Boi (mobile). Equilibrium binding responses are fit successfully to Langmuir isotherms. Each
color in the binding sensorgrams represent the concentration of the analyte in mobile phase. The color scheme is preserved in the binding isotherms below. Zero-
second time point indicates analyte injection.
S10 Cell 154, 228–239, July 3, 2013 ª2013 Elsevier Inc.
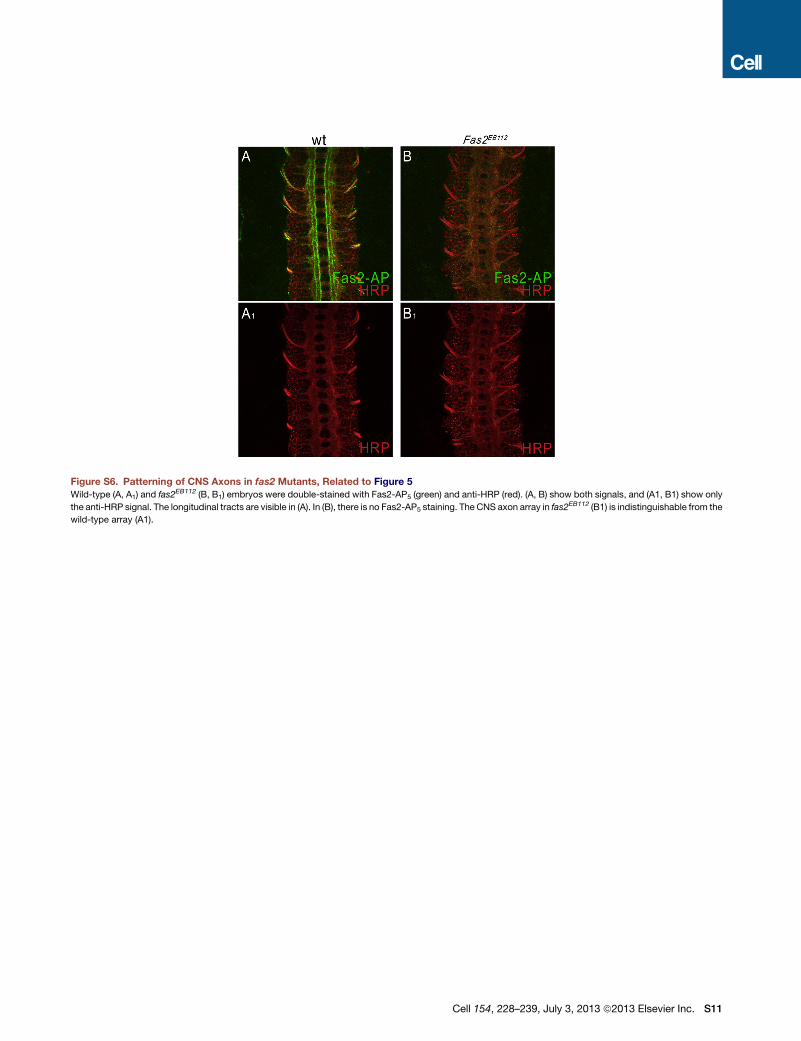
Figure S6. Patterning of CNS Axons in fas2 Mutants, Related to Figure 5
Wild-type (A, A1) and fas2EB112 (B, B1) embryos were double-stained with Fas2-AP5 (green) and anti-HRP (red). (A, B) show both signals, and (A1, B1) show only
the anti-HRP signal. The longitudinal tracts are visible in (A). In (B), there is no Fas2-AP5 staining. The CNS axon array in fas2EB112 (B1) is indistinguishable from the
wild-type array (A1).
Cell 154, 228–239, July 3, 2013 ª2013 Elsevier Inc. S11
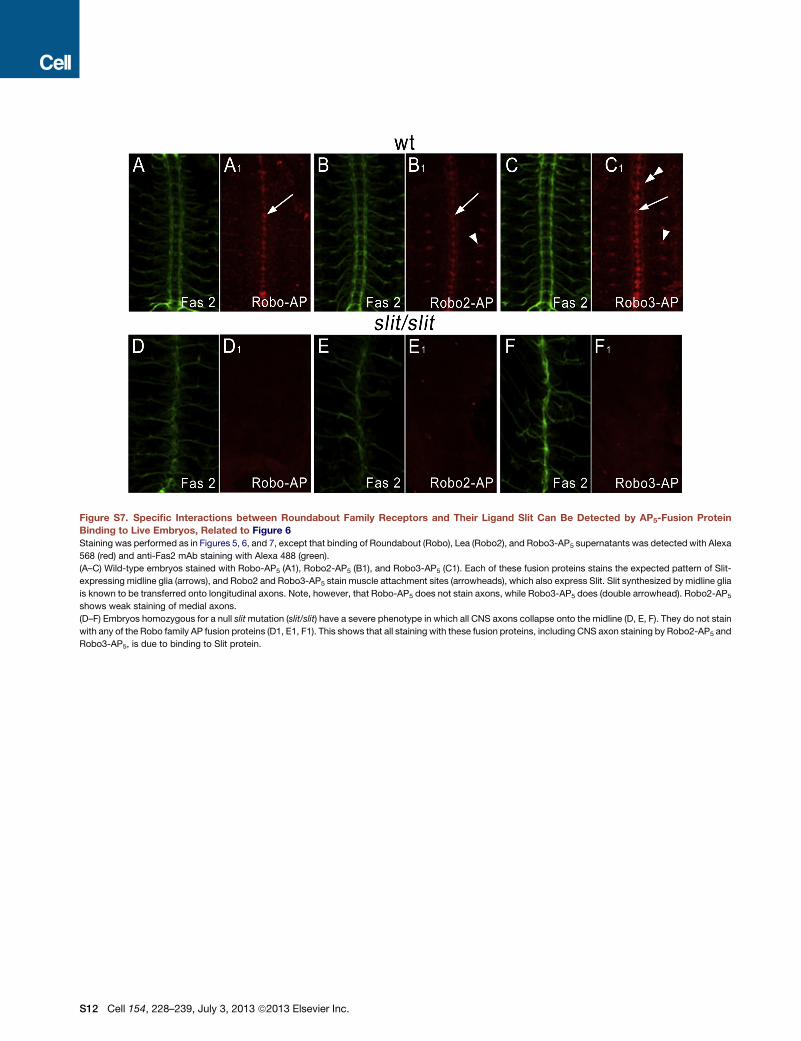
Figure S7. Specific Interactions between Roundabout Family Receptors and Their Ligand Slit Can Be Detected by AP5-Fusion Protein
Binding to Live Embryos, Related to Figure 6
Staining was performed as in Figures 5, 6, and 7, except that binding of Roundabout (Robo), Lea (Robo2), and Robo3-AP5 supernatants was detected with Alexa
568 (red) and anti-Fas2 mAb staining with Alexa 488 (green).
(A–C) Wild-type embryos stained with Robo-AP5 (A1), Robo2-AP5 (B1), and Robo3-AP5 (C1). Each of these fusion proteins stains the expected pattern of Slit-
expressing midline glia (arrows), and Robo2 and Robo3-AP5 stain muscle attachment sites (arrowheads), which also express Slit. Slit synthesized by midline glia
is known to be transferred onto longitudinal axons. Note, however, that Robo-AP5 does not stain axons, while Robo3-AP5 does (double arrowhead). Robo2-AP5
shows weak staining of medial axons.
(D–F) Embryos homozygous for a null slitmutation (slit/slit) have a severe phenotype in which all CNS axons collapse onto the midline (D, E, F). They do not stain
with any of the Robo family AP fusion proteins (D1, E1, F1). This shows that all staining with these fusion proteins, including CNS axon staining by Robo2-AP5 and
Robo3-AP5, is due to binding to Slit protein.
S12 Cell 154, 228–239, July 3, 2013 ª2013 Elsevier Inc.