an image-based approach to extreme scale in situ
TRANSCRIPT
See discussions, stats, and author profiles for this publication at: https://www.researchgate.net/publication/282295974
An Image-Based Approach to Extreme Scale in Situ Visualization and Analysis
Article · January 2015
DOI: 10.1109/SC.2014.40
CITATIONS
62READS
244
6 authors, including:
Some of the authors of this publication are also working on these related projects:
Energy Exascale Earth System Model (E3SM) View project
LATEC workbench View project
Sebastien Jourdain
Kitware, Inc.
15 PUBLICATIONS 244 CITATIONS
SEE PROFILE
John Patchett
Los Alamos National Laboratory
25 PUBLICATIONS 285 CITATIONS
SEE PROFILE
David Rogers
Los Alamos National Laboratory
27 PUBLICATIONS 304 CITATIONS
SEE PROFILE
Mark Petersen
Los Alamos National Laboratory
53 PUBLICATIONS 1,069 CITATIONS
SEE PROFILE
All content following this page was uploaded by Sebastien Jourdain on 05 May 2016.
The user has requested enhancement of the downloaded file.

An Image-based Approach to Extreme Scale In SituVisualization and Analysis
James AhrensLos Alamos National Laboratory
Los Alamos, NM 87545Email: [email protected]
John PatchettLos Alamos National Laboratory
Los Alamos, NM 87545Email: [email protected]
Sebastien JourdainKitware Inc
Santa Fe, NM 87505Email: [email protected]
David H. RogersLos Alamos National Laboratory
Los Alamos, NM 87545Email: [email protected]
Patrick O’LearyKitware Inc
Santa Fe, NM 87505Email: [email protected]
Mark PetersenLos Alamos National Laboratory
Los Alamos, NM 87545Email: [email protected]
Abstract—Extreme scale scientific simulations are leading acharge to exascale computation, and data analytics runs the riskof being a bottleneck to scientific discovery. Due to power and I/Oconstraints, we expect in situ visualization and analysis will be acritical component of these workflows. Options for extreme scaledata analysis are often presented as a stark contrast: write largefiles to disk for interactive, exploratory analysis, or perform in situanalysis to save detailed data about phenomena that a scientistsknows about in advance. We present a novel framework for athird option – a highly interactive, image-based approach thatpromotes exploration of simulation results, and is easily accessedthrough extensions to widely used open source tools. This insitu approach supports interactive exploration of a wide rangeof results, while still significantly reducing data movement andstorage.
I. INTRODUCTION
The supercomputing community has embarked upon arevolutionary path towards extreme scale (� 1015 FLOPS).Just as the massive computing power of these machinesimprove how we do simulation science, these new machinesare changing how we analyze simulation results. Applicationscientists use visualization and analysis to understand andadvance their science. At smaller scales, the data are storedor moved to another machine for post-processing. However,both the complexity and size of their scientific simulationscontinue to evolve as we advance en route to extreme scalecomputing platforms. With storage bandwidth significantlyfalling behind the rate needed to move data, standard post-processing techniques will not be able to effectively scale in thefuture. Therefore, the fundamental extreme scale visualizationand analysis challenge is there is too much simulation dataand too little transfer bandwidth.
In situ techniques that analyze the data while it still residesin simulation memory show a promising path forward [1], [2],[3], [4]. The same supercomputing resources that compute thesimulation data are also used for the analysis and, as such, thedata do not have to be moved. Typically, in situ approacheseither are a predefined set of analyses or, rarely, make au-tomatic decisions about which analyses and visualizations tocreate. Therefore, we see the goals of in situ visualization andanalysis as multifaceted: 1) to preserve important elements of
the simulations, 2) to significantly reduce the data needed topreserve these elements, and 3) to offer as much flexibility aspossible for post-processing exploration.
Simulation results must be transformed from an extremescale sized data space to a petascale storage system resultingin a massive compaction from sparse raw simulation data todense visualization and analysis data. We envision the scientistusing our framework to define which analyses are needed and atarget data size bounds of the analysis results at the beginningof their simulation in situ run. Understanding the space ofin situ visualization and analysis solutions within the contextof data funneling process is a salient key to addressing theextreme scale challenge.
We present a novel framework – implemented in existingopen-source tools [5] - to be used by a scientist to define a setof operations he/she finds to be most useful in exploring theirdata. The framework implements an image-based approachthat results in a database of highly compressed data thatis fundamentally different from what is currently available.Importantly, our framework effectively preserves the ability tointeractively explore the same ”operation space” defined at thestart of the problem, so that data elements can be combined inmuch the same way they could in the original tool [6]. Thus,interactive exploration - so important to scientific discovery -is supported on a useful spectrum of operations.
Imagery is on the order of 106 in size, whereas extremescale simulation data is on the order of � 1015 in size. Asan example, suppose we have an extreme scale simulation thatcalculates temperature and density over 1000 of time steps. Forboth variables, a scientist would like to visualize 10 isosurfacevalues and X, Y, and Z cut planes for 10 locations in eachdimension. One hundred different camera positions are alsoselected, in a hemisphere above the dataset pointing towardsthe data set. We will run the in situ image acquisition for everytime step. These parameters will produce: 2 variables ⇥ 1000time steps ⇥ (10 isosurface values + 3 ⇥ 10 cut planes) ⇥ 100camera positions ⇥ 3 images (depth, float, and lighting) = 2.4⇥ 107 images. If we assume each image is 1MB (megapixel,four byte image), this results in approximately 24 TBs, whichis a reasonable size for a large exascale simulation.
SC14, November 16-21, 2014, New Orleans, Louisiana, USA978-1-4799-5500-8/14/$31.00 c�2014 IEEE
Thus, the image-based approach reduces the simulationoutput by storing a set of output images directly from thesimulation into an image database. One can think of thisapproach as the traditional in situ mode, but we are samplingthe visualization and analysis parameter space, such as camerapositions, operations, parameters to operations, etc., to producea set of images [1], [7], [8], [9] stored in a data-intensivedatabase. It’s important to note these images are derived fromfull-resolution data with high accuracy.
The framework, implementing our image-based approachas a solution for extreme data visualization and analysischallenges, makes several contributions to the “traditional insitu” mode.
Interactive Exploration Database. Our image-based ap-proach takes traditional in situ visualization and analysis andenables interactive exploration using an image database. This,in turn, creates a viable solution for extreme scale visualizationand analysis. Our framework:
• Enables many different interaction modes including:1) animation and selection for objects, 2) camera and3) time, than we imagined possible with a set of pre-generated analysis.
• Creates an incredibly responsive interactive solution,rivaling modern post-processing approaches, based onproducing constant time retrieval and assembly ofvisualization objects from the image database.
• Encourages the use of both computationally intensiveanalysis and temporal exploration typically avoided inpost-processing approaches.
• Demonstrates the time to create an image collectionis not of great concern.
Metadata Searching. By leveraging an image database,our image-based approach allows the analyst to execute meta-data queries or browse analysis results to produce a prioritizedsequence of matching results.
Creation of New Visualizations and Content Querying.We’ve added composing of individually imaged visualizationobjects to our image-based approach to allow the analyst toreason about his/her simulation results from visualization spaceand create new content. This unique capability:
• Provides access to the underlying data to enableadvanced rendering during post-processing (e.g. newlookup tables, lighting, ...).
• Makes it possible to perform queries that search on thecontent of the image in the database. Therefore, usingimage-based visual queries, the analyst can ask simplescientific questions and get the expected results. Theseimage-based queries show promise of answering muchmore complicated questions.
Finally, we have exposed the framework of our image-based approach to the scientist through an advanced selectioninterface that allows him/her to make sophisticated (time,storage, analysis, ...) decisions for the production of in situvisualization and analysis output.
In the sections that follow, we illustrate how our image-based approach to extreme scale in situ visualization and anal-ysis meets our goals for future post-processing exploration.
II. RELATED WORK
Our framework has number of contributions and, therefore,we review related work for these areas. In situ approaches arean important mechanism for visualization and analysis due tothe cost of data movement and storage required for traditionalpost processing [10]. A key concern with in situ approaches isthe need to maintain exploratory analysis capabilities despitethe fact that data gathering occurs as a batch process atsimulation run-time. For example, Woodring et al [11] saved ahierarchy of random samples from a particle-based simulationto create a flexible representation for later analysis.
Interactive Exploration Database. A key component ofour solution is the creation of a large image collection from astructured sampling of camera positions, time steps and visual-ization operators. One option for managing these rendering isto compress them into a collection of movies. Chen et al [12]use this approach to accelerate interactive scientific visualiza-tion over the Internet. Kageyama and Yamada [13] appliedthis approach in situ to a simulation. Both create specialized“movie players” that support exploratory interactions accessingthe linear movies to retrieve specific rotations, time steps andoperators. Our solution extends these approaches by supportingthe compositing of images to create new visualizations as wellas metadata and image-based querying. Tikhonova et al in[14], [1], [15] represent the scientific data set to be visualizedas a collection of proxy images. By retrieving images fromthis collection and applying image-based rendering techniques,interactive volume rendered results are produced. A range ofview points, transfer functions, rendering, and lighting optionsare reproduced interactively. Our work is complementary tothis image-based approach. Combining the approaches wouldsupport additional data compression, flexibility, and explo-ration possibilities.
Metadata Searching. Commercial multimedia databasessuch as Google’s image search have brought the powerfulnon-traditional search/query techniques to the mainstream.Recent work by Subrahmaniam [16] identifies issues and futureresearch directions for multimedia databases. For speed andflexibility in responding to our unique access patterns, wecreated our own image database. When populating an imagedatabase it is desirable to gather metadata about when and howthe images are created, to enable querying of these parameters.Therefore, when we create imagery in situ, we save camerapositions, time steps, details about the visualization operators,and statistics about the data. We highlight a connection toprovenance systems, such as VisTrails, that directly storeanalysis results and how they are created. This is important sothat results can be reproduced by others, improving scientificintegrity [17]. Our approach could be evaluated as a visualiza-tion and analysis storage representation in such a system.
Creation of New Visualizations and Content Query-ing. Our approach supports the creation of new visualizationby combining images with depth information. Tikhonova etal [14] also supports the creation of new visualizations fromtheir database using interpolation. It is worth noting, whencompositing images that contain opaque geometry, our resultswill be pixel accurate whereas with image-based interpolation,some loss is expected especially as the viewer moves awayfrom sampling locations available in the database. Our ideafor compositing visualization results evolved from the long
history of parallel compositing techniques that enable scalableinteractive visualization. Moreland et al provides a recentoverview of approaches [18] and apply additional optimizationto this critical technique.
We are interested in supporting a variety of methodsfor interacting with our visualization. From an in situ start-ing point, we offer a traditional point-and-click interactionmethod, supporting the rotations, time steps, and visualizationoperations selected by the scientist in the setup of his/hersimulation run. We also support interaction via an interactivedatabase perspective. As mentioned above we support metadatasearches. There are many image content search possibilities aswell as search by color and search by similarly. In this paper,we focused on including image content queries that supportquerying about the visual weight of the objects in the generatedvisualization. This is a unique capability for an interactivescientific visualization framework and derives from the factthat we stored the visualization metadata, visualization objects,and their resulting 2D projections as images. There are manyapproaches to calculating the statistics of the 2D projection ofa set of 3D objects [19]. Related to our approach, Jun Tao etal [20] computes a collection of streamline images and appliesan image quality metric to select an optimal viewpoint. Ourapproach extends this work by virtue of being in situ and byour ability to change our evaluation metric dynamically witha scientist-generated query.
Complementary work would support indices on the originalscientific data. These are referred to as data content-basedqueries and an overview is provided in [21]. An exemplarwithin this literature is Stockinger et al [22], which usedefficient bitmap indices to support querying against the originaldata. Thus, we could save bitmaps with our visualizationoffering both image-based and data-based queries.
III. OVERVIEW OF APPROACH
Though we are running into a bandwidth barrier, interactivepost-processing visualization and analysis is still essentialat extreme scale. When creating new simulations, scientistsanalyze support for exploration and debugging. Also, theyneed the capability to share data with colleagues that donot have access to their computing resources. Finally, thereneeds to be an analysis transition path for existing codes fromterascale/petascale (1012/1015 FLOPS) to extreme scale.
In the image-based approach, we produce a multitude ofanalysis outputs, such as images and plots, that will showscientists about their data through interactions with an imagedatabase. Visualization and analysis operators typically pro-duce results that are many orders of magnitude smaller thanthe original data. Specifically, imagery is on the order of 106 insize, whereas extreme scale simulation data is on the order of� 1015 in size. Our expectation is that the memory size, withassociated burst buffers [23] and storage, will be on the orderof 1015 (i.e., a petabyte). We believe a petabyte is a reasonablesize for an extreme scale simulation output and, therefore, thismeans we can store approximately 109 (a billion) images ofthe simulation. This is on the order of the number of imagesuploaded to Facebook per year or the total number of photoshosted by Flickr [24]. The benefit of being able to store thismany images is providing flexibility, similar to a data approach,for exploratory simulation analysis.
From our example present in the Introduction section, wewould produce 2.4 ⇥ 107 images at 1MB per image forapproximately 24 TBs, which is reasonable given our previousassumptions. We expect that massive computing power willbe available on the supercomputer with associated burst buffer[23] and data intensive storage systems [25] to process theseimages.
One interesting property of this approach is that the rel-atively fixed size of the output imagery, due to limits ofhuman visual acuity [26], means that as we continue to scalesimulation and supercomputer sizes we will be able to storemore and more imagery as machine sizes grow. While theimage size might grow as the simulation size grows, the analystis less likely to increase the sampling of the correspondingparameters, operators, and camera space. This approach sup-ports many different potential interaction modes, and may offerdifferent insights than interacting with simulation data withtraditional analysis and visualization tools.
There are a number of useful image-based rendering ap-proaches that may help us to sample and present generatedimages [1], [6]. The goal of this work has not been to producebetter image-based rendering techniques. Rather, the goal is tounderstand how in situ methods are able to support flexible andaccurate analysis of extreme scale datasets. In particular, wehave focused on potential interaction modes with image data,but not necessarily those enabled by image-based renderingtechniques.
Many scientific simulation communities produce imagecollections for later analysis and archival purposes. One ofthe best examples, the CESM (Community Earth SystemModel) [27], includes the diagnostics for all its componentmodels including atmosphere, ocean, land, and sea ice. Thesevisualizations are available on a webpage for analysis andarchival purposes. They are generated in a post-processingmanner after the simulations have completed. This collectionrepresents a community consensus on a set of visualizationsthat are useful to the community. Other examples includeastronomy [28], cosmology [29], and high-energy physics[30]. We recognize the current limitations of these collections.Specifically, most of these collections contain fully-renderedimages that make it difficult to retrieve the original simulationdata values. Optimizations to our approach will help to correctthese shortcomings.
A. Simulation Data to Image Database
Our image-based approach framework is built on topof ParaView, a modern visualization and analysis tool usedaround the world in post-processing for advanced modelingand simulation workflows. ParaView is an open-source, multi-platform data analysis application [31] developed to analyzeextremely large datasets using distributed memory computingresources. Most modern post-processing applications utilize acommon pipeline architecture (e.g VisiT, ...). Thus, any ofthese tools could be easily adapted for use with our image-based approach framework.
When starting an image-based analysis, the computationalscientist will define a desired set of visualization and analysisoperators using a test data set and a familiar post-processingapplication, as depicted in Figure 1.
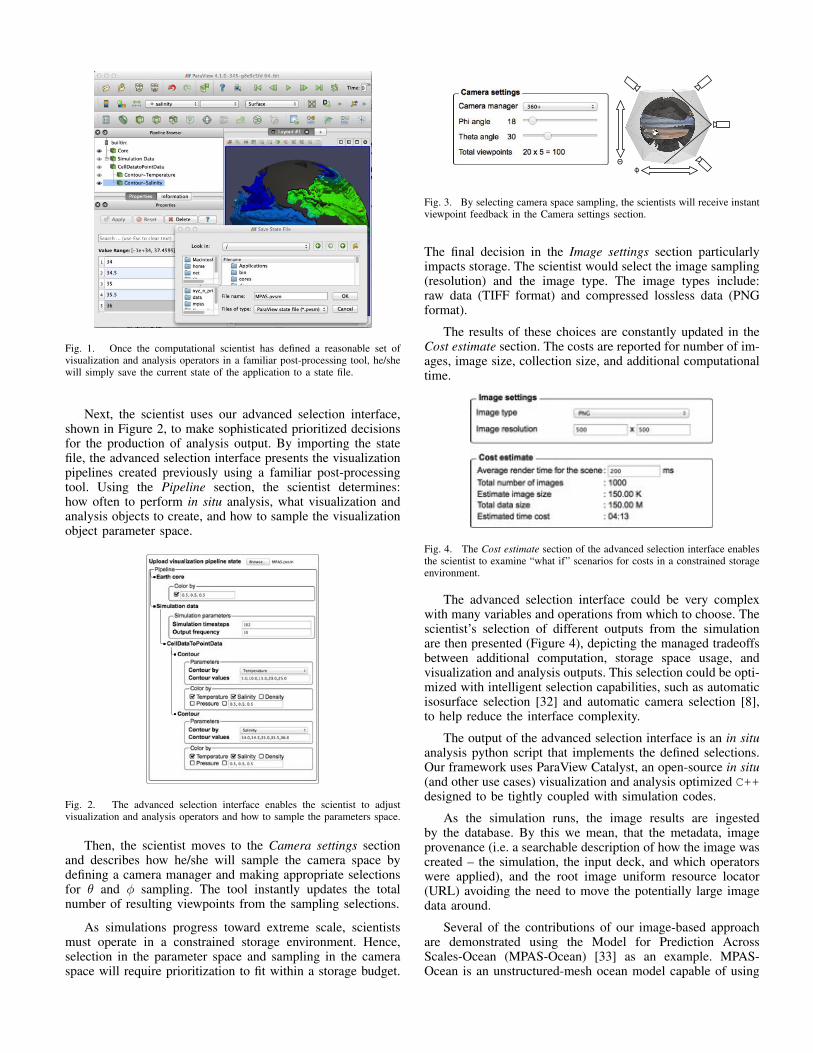
Fig. 1. Once the computational scientist has defined a reasonable set ofvisualization and analysis operators in a familiar post-processing tool, he/shewill simply save the current state of the application to a state file.
Next, the scientist uses our advanced selection interface,shown in Figure 2, to make sophisticated prioritized decisionsfor the production of analysis output. By importing the statefile, the advanced selection interface presents the visualizationpipelines created previously using a familiar post-processingtool. Using the Pipeline section, the scientist determines:how often to perform in situ analysis, what visualization andanalysis objects to create, and how to sample the visualizationobject parameter space.
Fig. 2. The advanced selection interface enables the scientist to adjustvisualization and analysis operators and how to sample the parameters space.
Then, the scientist moves to the Camera settings sectionand describes how he/she will sample the camera space bydefining a camera manager and making appropriate selectionsfor ✓ and � sampling. The tool instantly updates the totalnumber of resulting viewpoints from the sampling selections.
As simulations progress toward extreme scale, scientistsmust operate in a constrained storage environment. Hence,selection in the parameter space and sampling in the cameraspace will require prioritization to fit within a storage budget.
Θφ
Fig. 3. By selecting camera space sampling, the scientists will receive instantviewpoint feedback in the Camera settings section.
The final decision in the Image settings section particularlyimpacts storage. The scientist would select the image sampling(resolution) and the image type. The image types include:raw data (TIFF format) and compressed lossless data (PNGformat).
The results of these choices are constantly updated in theCost estimate section. The costs are reported for number of im-ages, image size, collection size, and additional computationaltime.
Fig. 4. The Cost estimate section of the advanced selection interface enablesthe scientist to examine “what if” scenarios for costs in a constrained storageenvironment.
The advanced selection interface could be very complexwith many variables and operations from which to choose. Thescientist’s selection of different outputs from the simulationare then presented (Figure 4), depicting the managed tradeoffsbetween additional computation, storage space usage, andvisualization and analysis outputs. This selection could be opti-mized with intelligent selection capabilities, such as automaticisosurface selection [32] and automatic camera selection [8],to help reduce the interface complexity.
The output of the advanced selection interface is an in situanalysis python script that implements the defined selections.Our framework uses ParaView Catalyst, an open-source in situ(and other use cases) visualization and analysis optimized C++designed to be tightly coupled with simulation codes.
As the simulation runs, the image results are ingestedby the database. By this we mean, that the metadata, imageprovenance (i.e. a searchable description of how the image wascreated – the simulation, the input deck, and which operatorswere applied), and the root image uniform resource locator(URL) avoiding the need to move the potentially large imagedata around.
Several of the contributions of our image-based approachare demonstrated using the Model for Prediction AcrossScales-Ocean (MPAS-Ocean) [33] as an example. MPAS-Ocean is an unstructured-mesh ocean model capable of using

enhanced horizontal resolution in selected regions of the oceandomain. MPAS-Ocean is one component within the MPASframework of climate models that is developed in cooperationbetween Los Alamos National Laboratory (LANL) and theNational Center for Atmospheric Research (NCAR).
The example runs are from real-world simulations withrealistic topography, wind forcing, and temperature and salinityrestoring. The horizontal grids are quasi-uniform over theglobe, with simulations performed at nominal grid cell widthsof 120 km.
B. Interactive Exploration Database
The interactive exploration database enables a diverse set ofinteractions with a set (database) of pre-generated visualizationand analysis results. The interactive exploration database sup-ports essentially three elements and two modes of interaction,depicted in Figure 5. The three elements of interaction are time,(visualization and analysis) objects, and camera. The modesof interaction are: animation, where the interaction sequencethrough time, objects, and camera; and selection, where theanalyst would select time, objects, and camera.
Object CameraTime
Selection
Animation
Fig. 5. The interactive space enabled by the interactive exploration database.
We have developed an interface for an interactive explo-ration database that supports the three elements and the twomodes of interaction. From the top row of Figure 5, the analystcan select a time, an object (e.g., a three-dimension contour),and a camera, which requests the corresponding image to befetched from the database. In fact, for each image in the toprow a set describing time, object, and camera would be spec-ified in the request. The bottom row of Figure 5 demonstratesanimation of time, object, and camera, respectively, from theinitial selection of the top row. We assume the sampling ofthe parameter space and camera space is dense enough so thatinteraction can be achieved on the three elements.
For the rotation images in Figure 6, we can see that themouse-enabled rotation requires an image to be fetched fromthe database. Starting at the lower right image, if the analystrotates up with the mouse, then the camera position changeis queried and the upper right image is returned (likewise forrotations to the left and/or up and left). Mouse-enabled panningand zooming are simple image-based operations. Zoomingdisplays the image by varying the pixel size to 1⇥1, 2⇥2, ...
Zoom + PanRotation
Fig. 6. Mouse enabled interactive exploration such as rotation requires animage fetch from the database, while zooming and panning are image-basedoperations.
n⇥n, for zooming in, and removing necessary (row, column)pairs for zooming out. Panning simply shifts the image sideto side or up and down. It’s important to note that all query-based interactions are still valid and respect these image-basedinteractions. This is at the discretion of the scientist.
The image-based approach provides interactive (12+ fps)response from the interactive exploration database on typi-cally available scientific network throughputs/bandwidths. Inaddition, adding more flexibility to the interactive explorationdatabase only requires saving more images, which in turn moredensely samples the parameter space and camera space.
One interesting advantage of this approach over the tra-ditional interactive post-processing approach is that for theimage-based approach, the time to display one image isapproximately the same time for any other image because thetime to compute and render complex visualization and analysisobjects has been amortized in situ within the simulation. Fora traditional post-processing approach that computes visual-ization and analysis objects upon request, the wait time isextremely variable, ranging from seconds (rendering) to min-utes (loading, pipeline selection, and computing). This inherenttime to result bias produces a corresponding bias in whatvisualization and analysis objects are interactively explored.Specifically, because data sets are typically stored on disk asseparate files for each time step, and the time to load a datasetis typically long, very little interactive exploration in time isdone. Our interactive exploration database addresses these is-sues, encouraging both computationally intensive visualizationand analysis objects and temporal exploration typically avoidedin post-processing approaches.
Although there may be a concern about the time it will taketo create this image collection, we believe that this is a manage-able issue since: (1) We show, in the Results and Performancesection, that the creation of images is constant, O(1), in timeas the problem size grows; (2) we have demonstrated in thepast that in situ data visualization and analysis weakly scales;and (3) we expect that visualization and analysis operators willbe accelerated to run on next-generation hardware at tens offrames per second [34].
C. Metadata Searching
By leveraging the interactive exploration database, ourimage-based approach allows the analyst to execute metadata
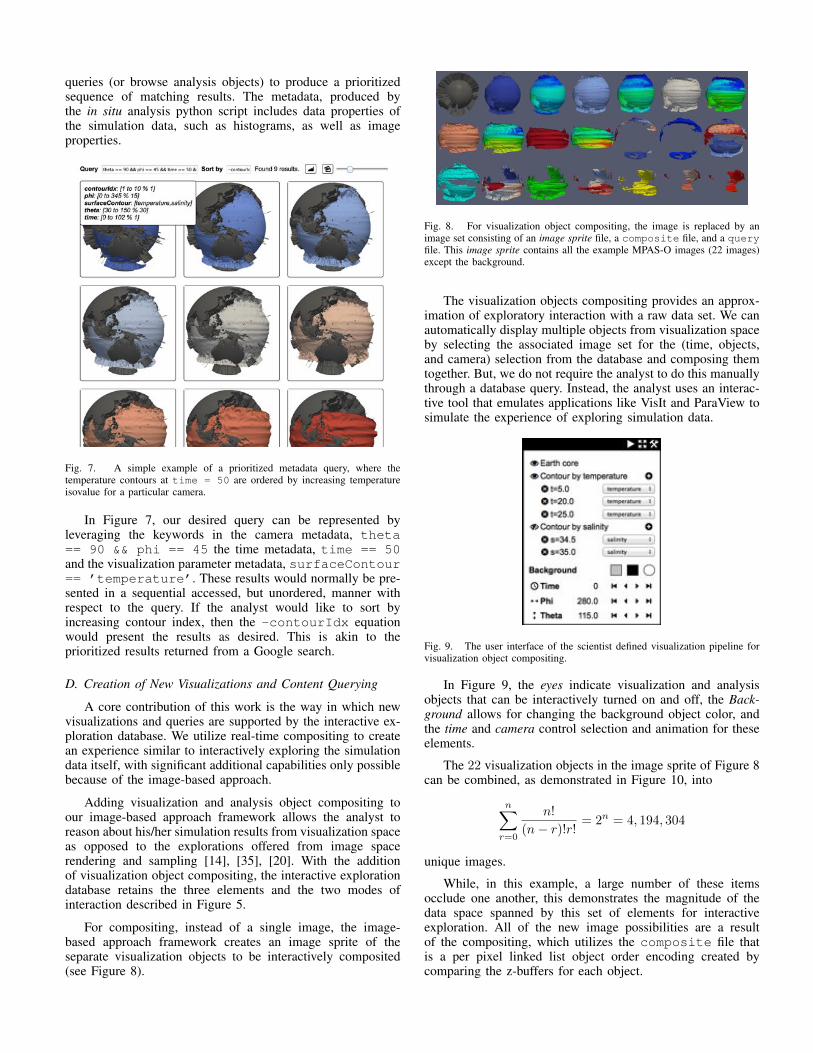
queries (or browse analysis objects) to produce a prioritizedsequence of matching results. The metadata, produced bythe in situ analysis python script includes data properties ofthe simulation data, such as histograms, as well as imageproperties.
Fig. 7. A simple example of a prioritized metadata query, where thetemperature contours at time = 50 are ordered by increasing temperatureisovalue for a particular camera.
In Figure 7, our desired query can be represented byleveraging the keywords in the camera metadata, theta== 90 && phi == 45 the time metadata, time == 50and the visualization parameter metadata, surfaceContour== ’temperature’. These results would normally be pre-sented in a sequential accessed, but unordered, manner withrespect to the query. If the analyst would like to sort byincreasing contour index, then the -contourIdx equationwould present the results as desired. This is akin to theprioritized results returned from a Google search.
D. Creation of New Visualizations and Content Querying
A core contribution of this work is the way in which newvisualizations and queries are supported by the interactive ex-ploration database. We utilize real-time compositing to createan experience similar to interactively exploring the simulationdata itself, with significant additional capabilities only possiblebecause of the image-based approach.
Adding visualization and analysis object compositing toour image-based approach framework allows the analyst toreason about his/her simulation results from visualization spaceas opposed to the explorations offered from image spacerendering and sampling [14], [35], [20]. With the additionof visualization object compositing, the interactive explorationdatabase retains the three elements and the two modes ofinteraction described in Figure 5.
For compositing, instead of a single image, the image-based approach framework creates an image sprite of theseparate visualization objects to be interactively composited(see Figure 8).
Fig. 8. For visualization object compositing, the image is replaced by animage set consisting of an image sprite file, a composite file, and a queryfile. This image sprite contains all the example MPAS-O images (22 images)except the background.
The visualization objects compositing provides an approx-imation of exploratory interaction with a raw data set. We canautomatically display multiple objects from visualization spaceby selecting the associated image set for the (time, objects,and camera) selection from the database and composing themtogether. But, we do not require the analyst to do this manuallythrough a database query. Instead, the analyst uses an interac-tive tool that emulates applications like VisIt and ParaView tosimulate the experience of exploring simulation data.
Fig. 9. The user interface of the scientist defined visualization pipeline forvisualization object compositing.
In Figure 9, the eyes indicate visualization and analysisobjects that can be interactively turned on and off, the Back-ground allows for changing the background object color, andthe time and camera control selection and animation for theseelements.
The 22 visualization objects in the image sprite of Figure 8can be combined, as demonstrated in Figure 10, into
nX
r=0
n!
(n� r)!r!= 2n = 4, 194, 304
unique images.
While, in this example, a large number of these itemsocclude one another, this demonstrates the magnitude of thedata space spanned by this set of elements for interactiveexploration. All of the new image possibilities are a resultof the compositing, which utilizes the composite file thatis a per pixel linked list object order encoding created bycomparing the z-buffers for each object.
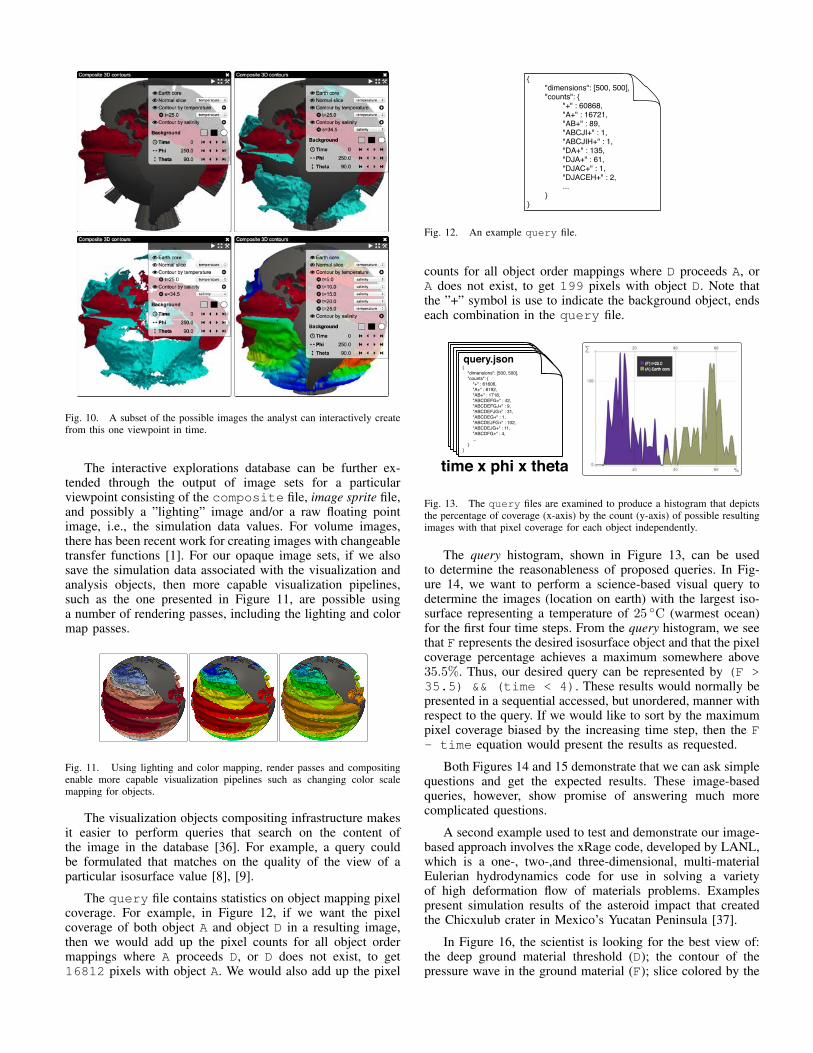
Fig. 10. A subset of the possible images the analyst can interactively createfrom this one viewpoint in time.
The interactive explorations database can be further ex-tended through the output of image sets for a particularviewpoint consisting of the composite file, image sprite file,and possibly a ”lighting” image and/or a raw floating pointimage, i.e., the simulation data values. For volume images,there has been recent work for creating images with changeabletransfer functions [1]. For our opaque image sets, if we alsosave the simulation data associated with the visualization andanalysis objects, then more capable visualization pipelines,such as the one presented in Figure 11, are possible usinga number of rendering passes, including the lighting and colormap passes.
Fig. 11. Using lighting and color mapping, render passes and compositingenable more capable visualization pipelines such as changing color scalemapping for objects.
The visualization objects compositing infrastructure makesit easier to perform queries that search on the content ofthe image in the database [36]. For example, a query couldbe formulated that matches on the quality of the view of aparticular isosurface value [8], [9].
The query file contains statistics on object mapping pixelcoverage. For example, in Figure 12, if we want the pixelcoverage of both object A and object D in a resulting image,then we would add up the pixel counts for all object ordermappings where A proceeds D, or D does not exist, to get16812 pixels with object A. We would also add up the pixel
{"dimensions": [500, 500],"counts": {
"+" : 60868,"A+" : 16721,"AB+" : 89,"ABCJI+" : 1,"ABCJIH+" : 1,"DA+" : 135,"DJA+" : 61,"DJAC+" : 1,"DJACEH+" : 2,...
}}
Fig. 12. An example query file.
counts for all object order mappings where D proceeds A, orA does not exist, to get 199 pixels with object D. Note thatthe ”+” symbol is use to indicate the background object, endseach combination in the query file.
time x phi x theta
{ "dimensions": [500, 500], "counts": { "+" : 61606, "A+" : 8192, "AB+" : 1718, "ABCDEFG+" : 42, "ABCDEFGJ+" : 9, "ABCDEFJG+" : 31, "ABCDEG+" : 1, "ABCDEJFG+" : 102, "ABCDEJG+" : 11, "ABCDFG+" : 4, ... }}
query.json{ "dimensions": [500, 500], "counts": { "+" : 61606, "A+" : 8192, "AB+" : 1718, "ABCDEFG+" : 42, "ABCDEFGJ+" : 9, "ABCDEFJG+" : 31, "ABCDEG+" : 1, "ABCDEJFG+" : 102, "ABCDEJG+" : 11, "ABCDFG+" : 4, ... }}
query.json{ "dimensions": [500, 500], "counts": { "+" : 61606, "A+" : 8192, "AB+" : 1718, "ABCDEFG+" : 42, "ABCDEFGJ+" : 9, "ABCDEFJG+" : 31, "ABCDEG+" : 1, "ABCDEJFG+" : 102, "ABCDEJG+" : 11, "ABCDFG+" : 4, ... }}
query.json{ "dimensions": [500, 500], "counts": { "+" : 61606, "A+" : 8192, "AB+" : 1718, "ABCDEFG+" : 42, "ABCDEFGJ+" : 9, "ABCDEFJG+" : 31, "ABCDEG+" : 1, "ABCDEJFG+" : 102, "ABCDEJG+" : 11, "ABCDFG+" : 4, ... }}
query.json{ "dimensions": [500, 500], "counts": { "+" : 61606, "A+" : 8192, "AB+" : 1718, "ABCDEFG+" : 42, "ABCDEFGJ+" : 9, "ABCDEFJG+" : 31, "ABCDEG+" : 1, "ABCDEJFG+" : 102, "ABCDEJG+" : 11, "ABCDFG+" : 4, ... }}
query.json
%
∑
Fig. 13. The query files are examined to produce a histogram that depictsthe percentage of coverage (x-axis) by the count (y-axis) of possible resultingimages with that pixel coverage for each object independently.
The query histogram, shown in Figure 13, can be usedto determine the reasonableness of proposed queries. In Fig-ure 14, we want to perform a science-based visual query todetermine the images (location on earth) with the largest iso-surface representing a temperature of 25 �C (warmest ocean)for the first four time steps. From the query histogram, we seethat F represents the desired isosurface object and that the pixelcoverage percentage achieves a maximum somewhere above35.5%. Thus, our desired query can be represented by (F >35.5) && (time < 4). These results would normally bepresented in a sequential accessed, but unordered, manner withrespect to the query. If we would like to sort by the maximumpixel coverage biased by the increasing time step, then the F- time equation would present the results as requested.
Both Figures 14 and 15 demonstrate that we can ask simplequestions and get the expected results. These image-basedqueries, however, show promise of answering much morecomplicated questions.
A second example used to test and demonstrate our image-based approach involves the xRage code, developed by LANL,which is a one-, two-,and three-dimensional, multi-materialEulerian hydrodynamics code for use in solving a varietyof high deformation flow of materials problems. Examplespresent simulation results of the asteroid impact that createdthe Chicxulub crater in Mexico’s Yucatan Peninsula [37].
In Figure 16, the scientist is looking for the best view of:the deep ground material threshold (D); the contour of thepressure wave in the ground material (F); slice colored by the
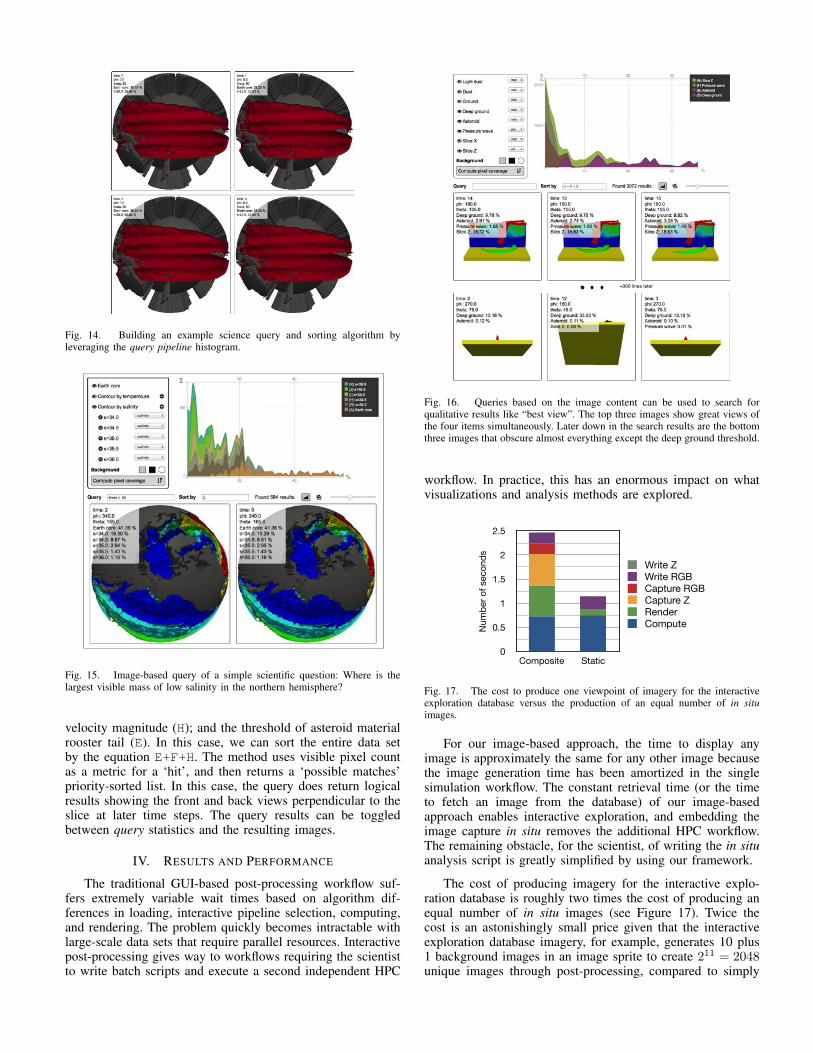
Fig. 14. Building an example science query and sorting algorithm byleveraging the query pipeline histogram.
%
∑
Fig. 15. Image-based query of a simple scientific question: Where is thelargest visible mass of low salinity in the northern hemisphere?
velocity magnitude (H); and the threshold of asteroid materialrooster tail (E). In this case, we can sort the entire data setby the equation E+F+H. The method uses visible pixel countas a metric for a ‘hit’, and then returns a ‘possible matches’priority-sorted list. In this case, the query does return logicalresults showing the front and back views perpendicular to theslice at later time steps. The query results can be toggledbetween query statistics and the resulting images.
IV. RESULTS AND PERFORMANCE
The traditional GUI-based post-processing workflow suf-fers extremely variable wait times based on algorithm dif-ferences in loading, interactive pipeline selection, computing,and rendering. The problem quickly becomes intractable withlarge-scale data sets that require parallel resources. Interactivepost-processing gives way to workflows requiring the scientistto write batch scripts and execute a second independent HPC
+900 lines later
%
2000
1000
∑
Fig. 16. Queries based on the image content can be used to search forqualitative results like “best view”. The top three images show great views ofthe four items simultaneously. Later down in the search results are the bottomthree images that obscure almost everything except the deep ground threshold.
workflow. In practice, this has an enormous impact on whatvisualizations and analysis methods are explored.
Composite StaticComputeRenderCapture ZCapture RGBWrite RGBWrite Z
0.7275507556 0.74843428890.6335603333 0.11524604440.6541053556 00.2199727333 00.2283980667 0.28096208890.0016216444 0
0
0.5
1
1.5
2
2.5
Composite Static
Num
ber o
f sec
onds
ComputeRenderCapture ZCapture RGBWrite RGBWrite Z
Fig. 17. The cost to produce one viewpoint of imagery for the interactiveexploration database versus the production of an equal number of in situimages.
For our image-based approach, the time to display anyimage is approximately the same for any other image becausethe image generation time has been amortized in the singlesimulation workflow. The constant retrieval time (or the timeto fetch an image from the database) of our image-basedapproach enables interactive exploration, and embedding theimage capture in situ removes the additional HPC workflow.The remaining obstacle, for the scientist, of writing the in situanalysis script is greatly simplified by using our framework.
The cost of producing imagery for the interactive explo-ration database is roughly two times the cost of producing anequal number of in situ images (see Figure 17). Twice thecost is an astonishingly small price given that the interactiveexploration database imagery, for example, generates 10 plus1 background images in an image sprite to create 211 = 2048unique images through post-processing, compared to simply
the 10 unique images.
One goal of in situ visualization and analysis is to reducethe time it takes a scientist to gain insight into the problembeing simulated. From past studies, we see that ParaViewCatalyst performs and scales well [38]. In a detailed study [39]led by the visualization group at Sandia National Laboratory,the in situ analysis showed weak scaling up to 64k cores ona variety of simulation codes. A second study comparing intransit and in situ analysis workflows [40], led by the samegroup, demonstrates the overall computational time (simulation+ in situ analysis) scales for Sandia’s CTH simulation code forvarious problem sizes and process counts. It rivals in transitapproaches as the simulation size grows.
As the problem size increases and the number of processesincrease, the benefits of using in situ analysis become moreapparent [3].
0
8
15
23
30
128 256 512 1024 2048
Num
ber o
f min
utes
Number of cores
xRageCoprocessing
0
30
60
90
120
128 512 2048 8192 32768
Num
ber o
f min
utes
Number of ranks
33k blocks220k blocks1.5m blocks
0E+00
2.5E+08
5.0E+08
7.5E+08
1.0E+09
192 384 768 1536 3072 61440
15
30
45
60
Tota
l num
ber o
f cel
ls
Number of cores
Num
ber o
f min
utes
Number of cellsSimulationCoprocessing
Number of cellsSimulationIn-situ
Fig. 18. The weak scaling results of compositing imagery produced every tentime steps up to 6144 cores along with the growth in problem size (numberof cells).
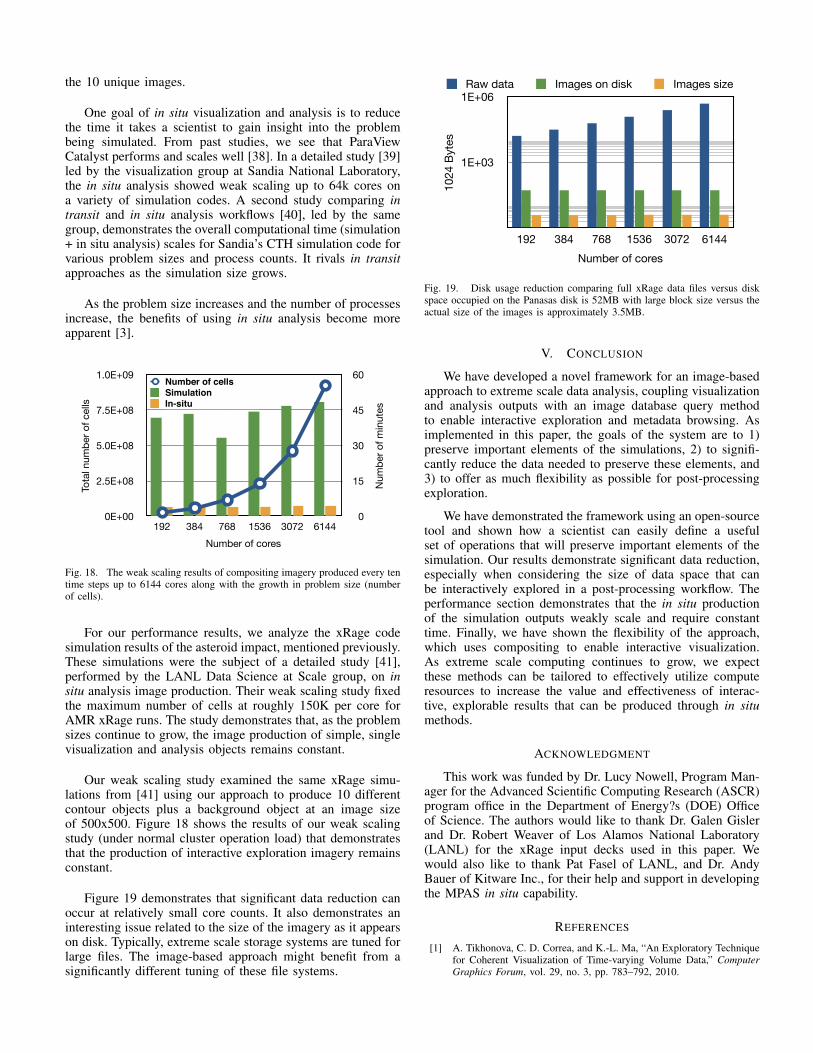
For our performance results, we analyze the xRage codesimulation results of the asteroid impact, mentioned previously.These simulations were the subject of a detailed study [41],performed by the LANL Data Science at Scale group, on insitu analysis image production. Their weak scaling study fixedthe maximum number of cells at roughly 150K per core forAMR xRage runs. The study demonstrates that, as the problemsizes continue to grow, the image production of simple, singlevisualization and analysis objects remains constant.
Our weak scaling study examined the same xRage simu-lations from [41] using our approach to produce 10 differentcontour objects plus a background object at an image sizeof 500x500. Figure 18 shows the results of our weak scalingstudy (under normal cluster operation load) that demonstratesthat the production of interactive exploration imagery remainsconstant.
Figure 19 demonstrates that significant data reduction canoccur at relatively small core counts. It also demonstrates aninteresting issue related to the size of the imagery as it appearson disk. Typically, extreme scale storage systems are tuned forlarge files. The image-based approach might benefit from asignificantly different tuning of these file systems.
Composite StaticComputeRenderCapture ZCapture RGBWrite RGBWrite Z
0.7275507556 0.74843428890.6335603333 0.11524604440.6541053556 00.2199727333 00.2283980667 0.28096208890.0016216444 0
0
0.5
1
1.5
2
2.5
Composite
Num
ber o
f sec
onds
ComputeRenderCapture ZCapture RGBWrite RGBWrite Z
1E+03
1E+06
192 384 768 1536 3072 6144
1024
Byt
es
Number of cores
Raw data Images on disk Images size
Fig. 19. Disk usage reduction comparing full xRage data files versus diskspace occupied on the Panasas disk is 52MB with large block size versus theactual size of the images is approximately 3.5MB.
V. CONCLUSION
We have developed a novel framework for an image-basedapproach to extreme scale data analysis, coupling visualizationand analysis outputs with an image database query methodto enable interactive exploration and metadata browsing. Asimplemented in this paper, the goals of the system are to 1)preserve important elements of the simulations, 2) to signifi-cantly reduce the data needed to preserve these elements, and3) to offer as much flexibility as possible for post-processingexploration.
We have demonstrated the framework using an open-sourcetool and shown how a scientist can easily define a usefulset of operations that will preserve important elements of thesimulation. Our results demonstrate significant data reduction,especially when considering the size of data space that canbe interactively explored in a post-processing workflow. Theperformance section demonstrates that the in situ productionof the simulation outputs weakly scale and require constanttime. Finally, we have shown the flexibility of the approach,which uses compositing to enable interactive visualization.As extreme scale computing continues to grow, we expectthese methods can be tailored to effectively utilize computeresources to increase the value and effectiveness of interac-tive, explorable results that can be produced through in situmethods.
ACKNOWLEDGMENT
This work was funded by Dr. Lucy Nowell, Program Man-ager for the Advanced Scientific Computing Research (ASCR)program office in the Department of Energy?s (DOE) Officeof Science. The authors would like to thank Dr. Galen Gislerand Dr. Robert Weaver of Los Alamos National Laboratory(LANL) for the xRage input decks used in this paper. Wewould also like to thank Pat Fasel of LANL, and Dr. AndyBauer of Kitware Inc., for their help and support in developingthe MPAS in situ capability.
REFERENCES
[1] A. Tikhonova, C. D. Correa, and K.-L. Ma, “An Exploratory Techniquefor Coherent Visualization of Time-varying Volume Data,” ComputerGraphics Forum, vol. 29, no. 3, pp. 783–792, 2010.

[2] T. Tu, H. Yu, L. Ramirez-Guzman, J. Bielak, O. Ghattas, K.-L. Ma, andD. R. O’Hallaron, “From mesh generation to scientific visualization: anend-to-end approach to parallel supercomputing,” in SC ’06: Proceed-ings of the 2006 ACM/IEEE conference on Supercomputing, November2006, p. 91.
[3] K. Moreland, N. Fabian, P. Marion, and B. Geveci, “Visualization onsupercomputing platform level II ASC milestone (3537-1b) results fromSandia,” Technical report SAND2010-6118, Sandia National Laborato-ries, Tech. Rep., 2010.
[4] H. Yu, C. Wang, R. W. Grout, J. H. Chen, and K.-L. Ma, “Insitu visualization for large-scale combustion simulations,” ComputerGraphics and Applications, IEEE, vol. 30, no. 3, pp. 45–57, 2010.
[5] E. Luke and C. D. Hansen, “Semotus Visum: A Flexible RemoteVisualization Framework,” in IEEE Visualization, 2002, pp. 61–68.
[6] H. Shum and S. B. Kang, “Review of image-based rendering tech-niques,” in Visual Communications and Image Processing 2000. In-ternational Society for Optics and Photonics, 2000, pp. 2–13.
[7] S. Takahashi, I. Fujishiro, Y. Takeshima, and T. Nishita, “A Feature-Driven Approach to Locating Optimal Viewpoints for Volume Visual-ization,” in IEEE Visualization, 2005, p. 63.
[8] U. Bordoloi and H.-W. Shen, “View Selection for Volume Rendering,”in IEEE Visualization, 2005, p. 62.
[9] G. Ji and H.-W. Shen, “Dynamic View Selection for Time-VaryingVolumes,” IEEE Transactions on Visualization and Computer Graphics,vol. 12, no. 5, pp. 1109–1116, 2006.
[10] K.-L. Ma, “In Situ Visualization at Extreme Scale: Challenges andOpportunities,” IEEE Comput. Graph. Appl., vol. 29, no. 6, pp. 14–19, Nov. 2009.
[11] J. Woodring, J. Ahrens, J. Figg, J. Wendelberger, S. Habib, andK. Heitmann, “In-situ Sampling of a Large-Scale Particle Simulationfor Interactive Visualization and Analysis,” Computer Graphics Forum,vol. 30, no. 3, pp. 1151–1160, 2011.
[12] J. Chen, I. Yoon, and W. Bethel, “Interactive, Internet Delivery of Vi-sualization via Structured Prerendered Multiresolution Imagery,” IEEETransactions on Visualization and Computer Graphics, vol. 14, no. 2,pp. 302–312, Mar. 2008.
[13] A. Kageyama and T. Yamada, “An approach to exascale visualization:Interactive viewing of in-situ visualization,” Computer Physics Commu-nications, vol. 185, no. 1, pp. 79–85, 2014.
[14] A. Tikhonova, C. D. Correa, and K.-L. Ma, “Visualization by Proxy:A Novel Framework for Deferred Interaction with Volume Data,” IEEETransactions on Visualization and Computer Graphics, vol. 16, no. 6,pp. 1551–1559, 2010.
[15] A. Tikhonova, H. Yu, C. D. Correa, J. H. Chen, and K.-L. Ma, “APreview and Exploratory Technique for Large-scale Scientific Sim-ulations,” in Proceedings of the 11th Eurographics Conference onParallel Graphics and Visualization, ser. EG PGV’11. Aire-la-Ville,Switzerland, Switzerland: Eurographics Association, 2011, pp. 111–120.
[16] V. S. Subrahmanian and S. Jajodia, Multimedia Database Systems:Issues and Research Directions, 1st ed. Springer Publishing Company,Incorporated, 2012.
[17] J. Freire, D. Koop, F. Chirigati, and C. Silva, “Reproducibility usingVisTrails,” Implementing Reproducible Computational Research, 2014.
[18] K. Moreland, W. Kendall, T. Peterka, and J. Huang, “An ImageCompositing Solution at Scale,” in Proceedings of 2011 InternationalConference for High Performance Computing, Networking, Storage andAnalysis, ser. SC ’11. New York, NY, USA: ACM, 2011, pp. 25:1–25:10.
[19] N. Elmqvist and P. Tsigas, “A taxonomy of 3d occlusion managementfor visualization,” Visualization and Computer Graphics, IEEE Trans-actions on, vol. 14, no. 5, pp. 1095–1109, 2008.
[20] J. Tao, J. Ma, C. Wang, and C.-K. Shene, “A Unified Approach toStreamline Selection and Viewpoint Selection for 3D Flow Visual-ization,” IEEE Transactions on Visualization and Computer Graphics,vol. 19, no. 3, pp. 393–406, 2013.
[21] O. Rubel, E. W. Bethel, Prabhat, and K. Wu, “Query-Driven Visu-alization and Analysis,” in High Performance Visualization—EnablingExtreme-Scale Scientific Insight, ser. Chapman & Hall, CRC Compu-tational Science, E. W. Bethel, H. Childs, and C. Hansen, Eds. Boca
Raton, FL, USA: CRC Press/Francis–Taylor Group, Nov. 2012, pp.117–144.
[22] K. Stockinger, E. W. Bethel, J. Shalf, and K. Wu, “Query-drivenvisualization of large data sets,” in 16th IEEE Visualization 2005 (VIS2005). IEEE Computer Society, 2005, p. 22.
[23] J. Bent, S. Faibish, J. Ahrens, G. Grider, J. Patchett, P. Tzelnic, andJ. Woodring, “Jitter-free co-processing on a prototype exascale storagestack,” in Mass Storage Systems and Technologies (MSST), 2012 IEEE28th Symposium on. IEEE, 2012, pp. 1–5.
[24] Z. Sheppard. (2010, September) 5,000,000,000. [Online]. Available:http://blog.flickr.net/en/2010/09/19/5000000000/
[25] R. Hecht and S. Jablonski, “NoSQL evaluation: A use case orientedsurvey,” in Cloud and Service Computing (CSC), 2011 InternationalConference on, December 2011, pp. 336–341.
[26] M. F. Deering, “The Limits of Human Vision,” in 2nd InternationalImmersive Projection Technology Workshop, 1998.
[27] Community Earth System Model Working Group. (2014, March)CESM 1.0 experiments, data and diagnostics. [Online]. Available:http://www.cesm.ucar.edu/experiments/cesm1.0/
[28] A. Szalay, J. Gray, A. Thakar, B. Boroski, R. Gal, N. Li,P. Kunszt, T. Malik, W. O’Mullane, M. Nieto-Santisteban, J. Raddick,C. Stoughton, and J. vandenBerg. (2014, March) The SDSS DR1Sky-Server: public access to a terabyte of astronomical data. [Online].Available: http://cas.sdss.org/dr6/en/skyserver/paper/
[29] G. Lemson and VIRGO Collaboration, “Halo and Galaxy FormationHistories from the Millennium Simulation: Public release of a VO-oriented and SQL-queryable database for studying the evolution ofgalaxies in the Lambda-CDM cosmogony,” 2006.
[30] I. Antcheva, M. Ballintijn, B. Bellenot, M. Biskup, R. Brun, N. Buncic,P. Canal, D. Casadei, O. Couet, V. Fine, L. Franco, G. Ganis, A. Gheata,D. G. Maline, M. Goto, J. Iwaszkiewicz, A. Kreshuk, D. M. Segura,R. Maunder, L. Moneta, A. Naumann, E. Offermann, V. Onuchin,S. Panacek, F. Rademakers, P. Russo, and M. Tadel, “ROOT a c++framework for petabyte data storage, statistical analysis and visualiza-tion,” Computer Physics Communications, vol. 180, pp. 2499–2512,December 2009.
[31] A. H. Squillacote, D. E. DeMarle, J. Ahrens, C. Law, B. Geveci,K. Moreland, and B. King, ParaView Guide, 1st ed. Kitware,Incorporated, 2007.
[32] C. L. Bajaj, V. Pascucci, and D. R. Schikore, “The Contour Spectrum,”in Proceedings of the 8th Conference on Visualization ’97, ser. VIS ’97,1997, pp. 167–ff.
[33] T. Ringler, M. Petersen, R. Higdon, D. Jacobsen, P. Jones, and M. Mal-trud, “A multi-resolution approach to global ocean modeling,” OceanModelling, vol. 69, pp. 211–232, 2013.
[34] L. Lo, C. Sewell, and J. Ahrens, “PISTON: A Portable Cross-PlatformFramework for Data-Parallel Visualization Operators,” in EurographicsSymposium on Parallel Graphics and Visualization, 2012.
[35] C. Wang and H.-W. Shen, “Information Theory in Scientific Visualiza-tion,” Entropy, vol. 13, no. 1, pp. 254–273, 2011.
[36] K. Wu, W. Koegler, J. Chen, and A. Shoshani, “Using bitmap indexfor interactive exploration of large datasets,” in 15th InternationalConference on Scientific and Statistical Database Management, July2003, pp. 65–74.
[37] M. Gittings, R. Weaver, M. Clover, T. Betlach, N. Byrne, R. Coker,E. Dendy, R. Hueckstaedt, K. New, W. R. Oakes, D. Ranta, and R. Ste-fan, “The RAGE radiation-hydrodynamic code,” Computational Science& Discovery, vol. 1, no. 1, p. 63pp, 2008.
[38] H. Karimabadi, P. O’Leary, B. Loring, A. Majumdar, M. Tatineni,and B. Geveci, “In-situ visualization for global hybrid simulations,”in the Conference on Extreme Science and Engineering DiscoveryEnvironment: Gateway to Discovery (XSEDE ’13). Association forComputing Machinery, July 2013, p. 8.
[39] N. Fabian, K. Moreland, D. Thompson, A. C. Bauer, P. Marion,B. Geveci, M. Rasquin, and K. E. Jansen, “The ParaView CoprocessingLibrary: A Scalable, General Purpose In Situ Visualization Library,”in IEEE Symposium on Large-Scale Data Analysis and Visualization(LDAV) 2011. Institute of Electrical and Electronics Engineers, October2011, pp. 89–96.

[40] D. Rogers, K. Moreland, R. Oldfield, and N. Fabian, “Data Co-Processing for Extreme Scale Analysis Level II ASC Milestone (4547)from Sandia,” Technical report SAND2013-1122, Sandia National Lab-oratories, Tech. Rep., March 2013.
[41] J. M. Patchett, J. P. Ahrens, B. Nouanesengsy, P. K. Fasel, P. O’Leary,C. M. Sewell, J. L. Woodring, C. J. Mitchell, L.-T. Lo, K. L. Myers,J. R. Wendelberger, C. V. Canada, M. G. Daniels, H. M. Abhold, andG. M. Rockefeller, “LANL CSSE L2: Case Study of In Situ DataAnalysis in ASC Integrated Codes,” Technical report LA-UR-13-26599,Los Alamos National Laboratories, Tech. Rep., 2013.
View publication statsView publication stats