an improved method for determining contribution of utility
TRANSCRIPT

International Journal on Electrical Engineering and Informatics - Volume 2, Number 3, 2010
204
An Improved Method for Determining Contribution of Utility and Customer Harmonic Distortions In A Power Distribution System
M. Farhoodnea1, Azah Mohamed2, H. Shareef3, and R. A. Jabbar Khan4
1,2,3Department of Electrical, Electronic and Systems Engineering, University Kebangsaan, Malaysia
4Rachna College of Engineering and Technology, Gujranwala, Pakistan [email protected]
Abstract: This paper presents an improved method for determining the share of harmonic distortion generated by utility and customer in a distribution system. The method is based on a Norton equivalent circuit to represent the whole system, modeling the customer side with RLC components by using measured voltage and current at the point of common coupling (PCC). The proposed method evaluates the contribution of harmonic voltage and current distortion, which may appear from utility and customer sides of the system. Several case studies have been made to verify the accuracy of the method in determining the share of utility and customer harmonic distortions. Results showed that the proposed method can accurately determine harmonic contributions of utility and customer sides for measurement made at the PCC. Keywords: Harmonic distortion, harmonic source location, power quality. 1. Introduction The proliferation of electronic nonlinear devices such as adjustable speed drives, inverters and personal computers in the past three decades has caused severe harmonic distortion in power distribution systems. These harmonics distort fundamental voltage and current waveforms and have many negative effects on power systems. It may cause resonance problems, overheating in capacitor banks and transformers, false operation of protection device and reduction of power quality which eventually increases the maintenance costs of the system. Before taking the necessary harmonic control measures, it is important to know who is responsible for the cause of harmonic distortion. Several methods have been proposed to identify the location of harmonic sources so as to determine whether the source is from the utility and customer side. One of the earlier methods for harmonic source localization is based on the real power direction in which the side that produces greater harmonic power is responsible for harmonic distortion [1]. However, the accuracy of the real power direction method is less than 50% and therefore the reliability of the method is questionable. An incentive-based method for harmonic source localization is presented in which the method is found to be impractical because it requires knowledge of actual impedances of the system for its calculation [2-3]. Other methods for harmonic source localization are such as the critical impedance method [4]and voltage magnitude comparison method [5] which requires implementation of switching tests for obtaining the harmonic impedance. Hence, the switching tests do not allow its application in practical power systems. A recent method for harmonic source localization which is called as the harmonic vector method (HVM) [6] uses resistance as the reference impedance for modeling the customer side and uses the equations in [2-3] for determining the harmonic contribution of utility and customer. However, modeling the customer side by an equivalent resistance may introduce inaccuracy in calculating the harmonic contribution factors especially in cases where loads contain inductive elements such as motors. In [7], the total harmonic distortion (THD) is used for finding the share of harmonic distortion from utility and customer sides. The disadvantage of this method is that the THD value cannot show the variation of contributions caused by changes in phase angle of harmonic
205
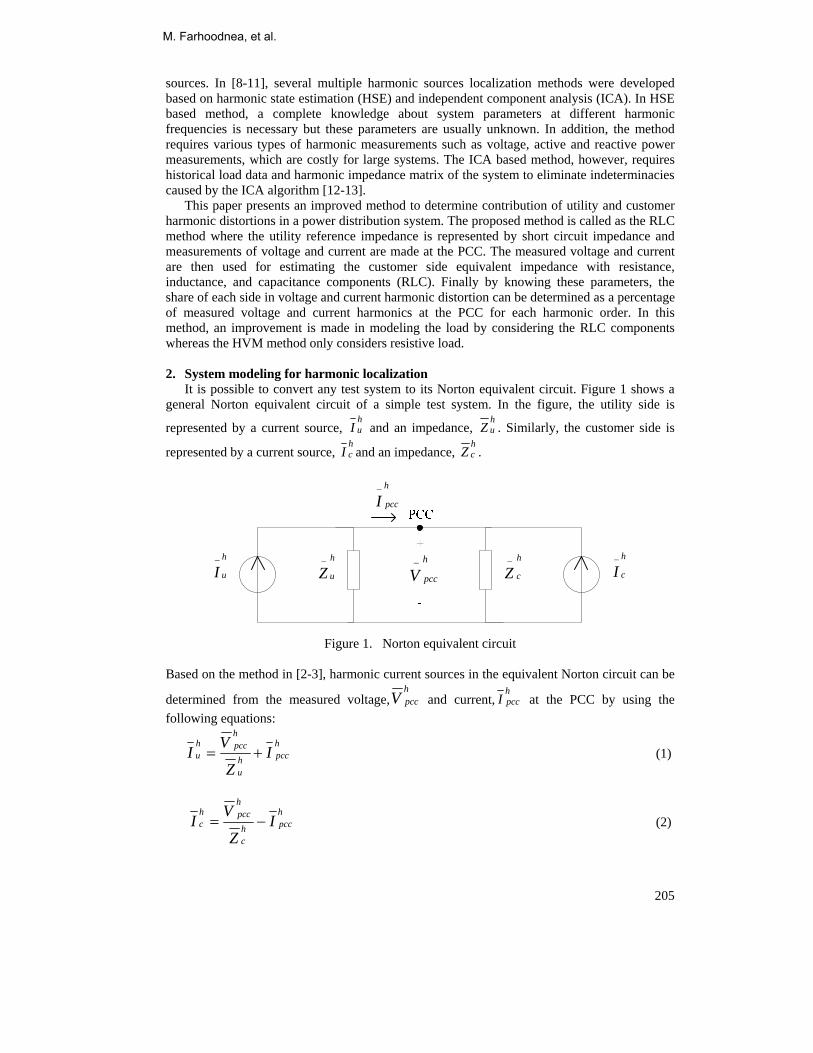
sources. In [8-11], several multiple harmonic sources localization methods were developed based on harmonic state estimation (HSE) and independent component analysis (ICA). In HSE based method, a complete knowledge about system parameters at different harmonic frequencies is necessary but these parameters are usually unknown. In addition, the method requires various types of harmonic measurements such as voltage, active and reactive power measurements, which are costly for large systems. The ICA based method, however, requires historical load data and harmonic impedance matrix of the system to eliminate indeterminacies caused by the ICA algorithm [12-13]. This paper presents an improved method to determine contribution of utility and customer harmonic distortions in a power distribution system. The proposed method is called as the RLC method where the utility reference impedance is represented by short circuit impedance and measurements of voltage and current are made at the PCC. The measured voltage and current are then used for estimating the customer side equivalent impedance with resistance, inductance, and capacitance components (RLC). Finally by knowing these parameters, the share of each side in voltage and current harmonic distortion can be determined as a percentage of measured voltage and current harmonics at the PCC for each harmonic order. In this method, an improvement is made in modeling the load by considering the RLC components whereas the HVM method only considers resistive load. 2. System modeling for harmonic localization It is possible to convert any test system to its Norton equivalent circuit. Figure 1 shows a general Norton equivalent circuit of a simple test system. In the figure, the utility side is
represented by a current source, huI and an impedance,
huZ . Similarly, the customer side is
represented by a current source, hcI and an impedance,
hcZ .
h
cZ− h
cI−h
uZ−h
uI− h
pccV−
h
pccI−
Figure 1. Norton equivalent circuit
Based on the method in [2-3], harmonic current sources in the equivalent Norton circuit can be
determined from the measured voltage,hpccV and current,
hpccI at the PCC by using the
following equations:
hpcch
u
hpcch
u IZ
VI += (1)
hpcch
c
hpcch
c IZ
VI −= (2)
M. Farhoodnea, et al.
206
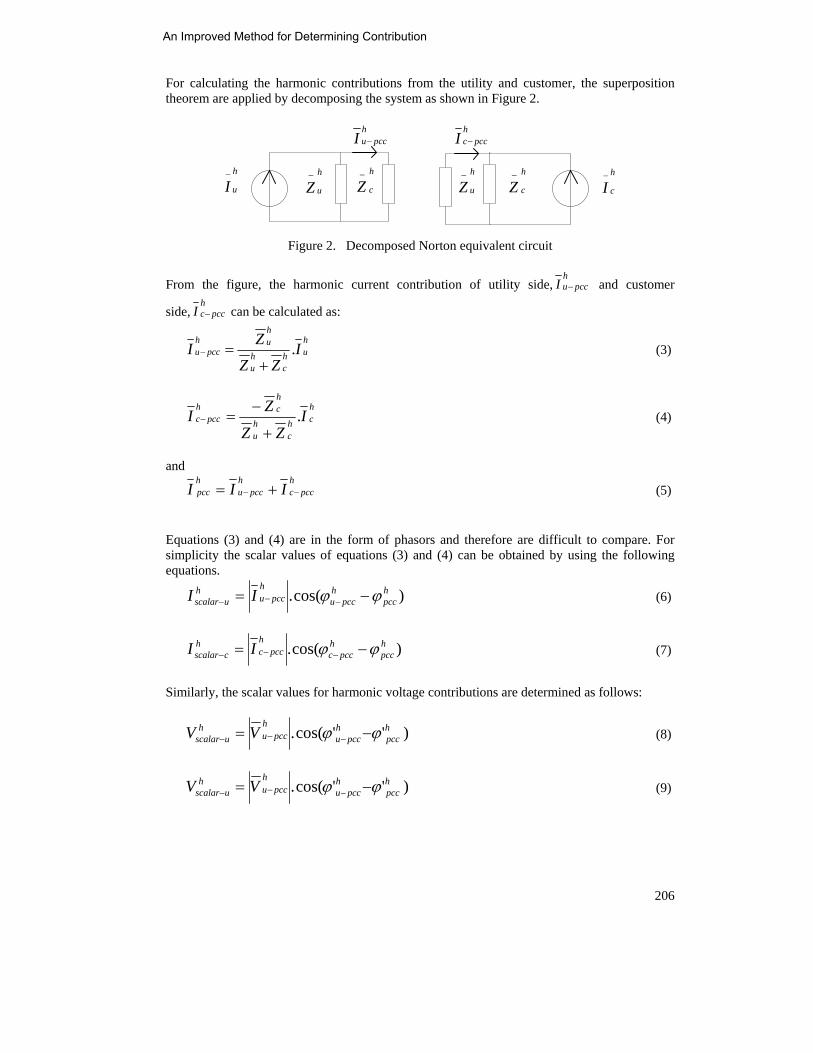
For calculating the harmonic contributions from the utility and customer, the superposition theorem are applied by decomposing the system as shown in Figure 2.
h
cZ− h
cI−h
uZ−h
uI− h
cZ− h
uZ−
hpccuI −
hpcccI −
Figure 2. Decomposed Norton equivalent circuit
From the figure, the harmonic current contribution of utility side,h
pccuI − and customer
side,h
pcccI − can be calculated as:
huh
chu
huh
pccu IZZ
ZI .+
=− (3)
hch
chu
hch
pccc IZZ
ZI .+
−=−
(4)
and
h
pccch
pccuhpcc III −− += (5)
Equations (3) and (4) are in the form of phasors and therefore are difficult to compare. For simplicity the scalar values of equations (3) and (4) can be obtained by using the following equations.
)cos(. h
pcch
pccu
hpccu
huscalar II ϕϕ −= −−− (6)
)cos(. h
pcch
pccch
pccch
cscalar II ϕϕ −= −−− (7)
Similarly, the scalar values for harmonic voltage contributions are determined as follows:
)''cos(. h
pcch
pccuh
pccuh
uscalar VV ϕϕ −= −−− (8)
)''cos(. h
pcch
pccuh
pccuh
uscalar VV ϕϕ −= −−− (9)
An Improved Method for Determining Contribution

207
where hϕ and h'ϕ are the phase angle difference between currents and voltages, respectively. These scalar values may have either positive or negative signs. This means that the scalar values with the same sign add up each other and values with opposite signs cancel out each other as illustrated in Figure 3.
h cscalarI −
h uscalarI −
h
pcccI −
−
h
pccuI −
−
h
pccI−h
pcccI −
−
h
pccI−
hcscalarI −
h
uscalar
I−
(b)(a) Figure 3. Scalar contribution of harmonic vector, (a) add up condition,
(b) cancel out condition If the utility impedance deviates from its reference impedance, any deviation from the
reference impedance (h
olduZ − ) can be shown as a new harmonic current source (h
newuI − ) at the utility side by using,
h
newpcch
oldu
h
newpcch
newu IZ
VI −−
−−
−−
−−
+= (10)
The same procedure can be done to determine the deviation of customer impedance from its reference impedance. For modeling the customer load, the resistance (R), inductance (L) and capacitance (C) load model is used [7, 14-15]. Figure 4 depicts the equivalent circuit for the customer side and it is assumed that the customer load consumes real power.
hPCCV
hPCCI
hRI h
CapI hLI
hCI
Figure 4. Customer equivalent circuit
M. Farhoodnea, et al.

208
Using the measured voltage and current at the PCC, the RLC parameters of the customer load are determined as follows:
( )
∑
∑
=
== H
hh
hPCC
hPCC
H
h
hPCC
c
IV
VR
1
1
2
)cos(.. ϕ For cR >0 (11)
( )∑
∑
=
=
−= H
h
hPCC
H
hh
hCLI
hPCC
c
hV
IVhC
1
22
1
..
)sin(...
ω
ϕ For cC >0 (12)
( )
∑
∑
=
== H
hh
hLI
hPCC
H
h
hPCC
c
hIV
hVL
1
1
22
/)sin(...
/
ϕω For cL >0 (13)
where,
c
hPCCh
PCChCLI R
VII −= (14)
cap
hPCCh
CLIhLI Z
VII −= (15)
L
hPCCh
LIhI Z
VII −= (16)
and hϕ is the phase angle difference between related voltage and current.
Note that hII represents the current source related to nonlinear components at the customer
side and therefore is considered as the customer harmonic current source, hcI .
3. Implementation Procedure of The Proposed RLC Method The procedure in implementing the proposed RLC method for determining contribution of utility and customer harmonic distortions in a power distribution system is described in terms of a flowchart as shown in Figure 5.
An Improved Method for Determining Contribution

209
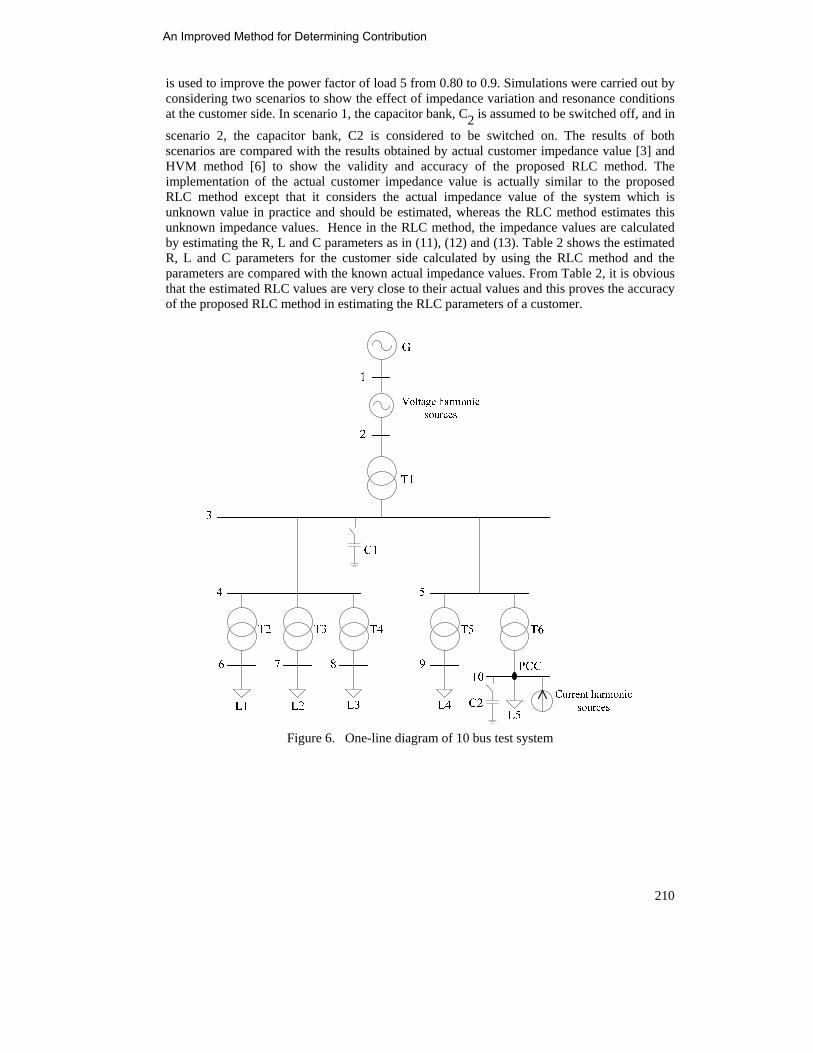
Figure 5. Implementation procedure of the proposed RLC method 4. Case study To verify the proposed harmonic source localization method, 10 bus test system shown in Figure 6 is considered. Simulations were carried out using the Matlab programming package to calculate the contribution of voltage and current harmonic distortion from the utility and customer. The system data for the test system are as shown in Table 1. In the simulation, harmonic sources are assumed to exist at both the utility side (bus 2) and customer side (bus 10). Harmonic voltage sources containing 5th, 7th, and 11th harmonic orders are injected at the utility side while the customer harmonic sources are represented as harmonic current sources that contain the same harmonic orders as the utility side harmonic source. The capacitor bank, C1 is adjusted to improve the power factor at bus 4 from 0.73 to 0.9. All the loads are assumed
to operate at full load condition with a power factor of 0.80. The capacitor bank, C2 at bus 10
Yes
No
Convert the contribution of each side to its scalar values using
equations (6) and (9)
Calculate the contribution of each
side by using equations (3‐5)
Determine the new harmonic current source by using
equation (10)
Measure Voltage and Current at the PCC
Determine utility side harmonic source by using its short circuit impedance and equation (1)
Model the customer side by using equations (11‐16)
Is new impedance inserted
to the system?
M. Farhoodnea, et al.
210
is used to improve the power factor of load 5 from 0.80 to 0.9. Simulations were carried out by considering two scenarios to show the effect of impedance variation and resonance conditions at the customer side. In scenario 1, the capacitor bank, C2 is assumed to be switched off, and in
scenario 2, the capacitor bank, C2 is considered to be switched on. The results of both scenarios are compared with the results obtained by actual customer impedance value [3] and HVM method [6] to show the validity and accuracy of the proposed RLC method. The implementation of the actual customer impedance value is actually similar to the proposed RLC method except that it considers the actual impedance value of the system which is unknown value in practice and should be estimated, whereas the RLC method estimates this unknown impedance values. Hence in the RLC method, the impedance values are calculated by estimating the R, L and C parameters as in (11), (12) and (13). Table 2 shows the estimated R, L and C parameters for the customer side calculated by using the RLC method and the parameters are compared with the known actual impedance values. From Table 2, it is obvious that the estimated RLC values are very close to their actual values and this proves the accuracy of the proposed RLC method in estimating the RLC parameters of a customer.
Figure 6. One-line diagram of 10 bus test system
An Improved Method for Determining Contribution

211
Table 1. Test system data
Components Parameter Value Components Parameter Value
G1
NV ( PhPh− rms )
''kS
RX /
33 kV 100 MVA
10 T1
NV ( PhPh− rms )
NS
%Z
33/11 kV 7.5 MVA
0.97+j4.69 UP.
T2, T4, T5 NV ( PhPh− rms )
NS
%Z
11/0.415 kV 1 MVA
1+j5 UP. T3, T6
NV ( PhPh− rms )
NS
%Z
11/0.415 kV 2.5 MVA 1+j5 UP.
Load 1 Active power ( P ) P.F
600 kW 0.8 Load 2,3 Active power ( P )
P.F 1440 kW
0.8
Load 4 Active power ( P ) P.F
398.4 kW 0.8 Load 5 Active power ( P )
P.F 1284 kW
0.8 Capacitor bank (C1)
Reactive power ( cQ ) 1.11 MVAr Capacitor bank (C2)
Reactive power ( cQ ) 0.24 MVAr
Table 2. Load parameters Load parameters )(ΩcR )(mHcL )( FcC μ Actual impedance value 0.134 0.585 0 RLC method 0.135 0.587 0
A. Scenario 1 (system without capacitor bank 2C ) In this scenario, the harmonic voltage source is at bus 2 and is considered as the utility harmonic source and the harmonic current source is at bus 10 and is considered as the customer harmonic source. Both harmonic sources contain 5th, 7th, and 11th harmonic orders. In the absence of capacitor bank C2, the customer load is modeled as an RLC load and a nonlinear current source. Voltage and current are measured at the PCC. The determined harmonic contributions are shown in Table 3. From the results shown in Table 3, it is noted that the utility contribute more voltage and current harmonic distortion compared to the customer, thus indicating that the utility is more responsible for producing voltage and current harmonics in the system. For example, the share of utility 5th harmonic voltage distortion is about 71% while for the same harmonic voltage distortion the share of customer side is about 28%. Comparing the results of harmonic contribution values as depicted in Table 3, it is observed that the harmonic contribution values obtained from using the estimated RLC load impedance and the actual load impedance are very close to each other with a relative error of less than 1.5%. The small differences in the customer and utility harmonic contribution values prove the accuracy of the proposed RLC method. In this case, the estimated short circuit impedance of the utility is Ω j0.0124+0.0025 .
M. Farhoodnea, et al.

212
Table 3. Utility and customer harmonic contributions for system without capacitor bank PCC
voltage (V) 31.03 ∠ -43 50.58 ∠ -64.35 17.30 ∠ -169.36
PCC current (A) 233.87 ∠ -8.66 292.59 ∠ -21.19 105.86 ∠ 137.75
Harmonic order 5th 7th 11th
Localization method RLC method
Customer Actual
impedance value
RLC method
Customer Actual
impedance value
RLC method
Customer Actual
impedance value
Customer voltage (V) 9.22 ∠ -59.21 9.23 ∠ -58.65 21.01 ∠ -72.36 21.09 ∠ -71.97 6.35 ∠ -66.17 6.39 ∠ -66.97
Customer harmonic voltage
contribution (%)
28.52 28.61 41.53 41.32 -8.32 -7.91
Customer current (A) 139.54 ∠ 36 139.73 ∠ 36.56 201.81 ∠ 28.08 202.57 ∠ 28.46 77.35 ∠ 33.09 77.75 ∠ 32.29
Customer harmonic current
contribution (%)
42.44 42.08 45.0 44.82 -19.72 -19.57
Utility voltage (V) 22.33 ∠ -36.38 22.28 ∠ -36.58 29.91 ∠ -58.74 29.8 ∠ -58.97 19.75 ∠ 172.39 19.69 ∠ 172.17
Utility harmonic voltage
contribution (%)
71.47 71.35 58.83 58.63 108.38 107.95
Utility current (A) 166.56 ∠ -44.73 167.87 ∠ -44.87 221.97 ∠ -64.72 223.37 ∠ -64.91 146.06 ∠ 168.57 147.11 ∠ 168.38
Utility harmonic current
contribution (%)
57.55 57.91 54.98 55.64 118.48 119.57
B. Scenario 2 (system with capacitor bank 2C ) In this scenario, the capacitor bank at bus 10 is switched on so that the customer impedance is reduced. In this situation, the current and voltage at the PCC will be different from that of scenario 1, depending upon utility and customer impedances. The test results for this scenario are shown in Table 4. From above results, it is clear that by inserting a capacitor at bus 10, harmonic contribution of customer in all voltage and current harmonic orders is increased. This is due to the shunt resonance caused by the capacitor bank, C2 and the load inductance in the vicinity of 5th, 7th and 11th harmonic frequencies. Table 4 also shows that the simulation results using the actual impedance of customer side are quite close to results of the RLC method with relative errors of less than 1.7%. The small deviations from the actual values in Table 4 prove the accuracy and validity of the RLC method for determining the harmonic contributions of utility and customer in a power distribution system. A comparison of the proposed RLC method is also made with the HVM method [6] in terms of percentage voltage and current harmonic distortions as shown in Figure 7. From the figure, it is evident that the percentage of voltage and current harmonic distortions of the RLC method are almost similar to that of using the actual impedance value as compared to the results of the HVM method. These results prove the accuracy of the proposed RLC method which considers a more accurate R, L, C load model. The inaccuracy of the HVM method is due to the load model which only considers resistive load.
An Improved Method for Determining Contribution

213
Table 4. Utility and customer harmonic contributions or system with capacitor bank PCC
voltage (V) 50.70 ∠ -65.92 72.77 ∠ -128.16 22.34 ∠ 98.56
PCC current (A) 613.6 ∠ -2.89 873.45 ∠ -55.17 449.29 ∠ 155.55
Harmonic order 5th 7th 11th
Measurement method RLC method
Customer Actual
impedance value
RLC method
Customer Actual
impedance value
RLC method Customer Actual impedance value
Load voltage (V) 33.15 ∠ -85.30 33.13 ∠ -85.16 68.26 ∠ -152.37 68.14 ∠ -152.29 25.36 ∠ 50.18 25.27 ∠ 50.19
Load harmonic voltage
contribution (%)
61.67 61.67 85.54 85.44 75.34 75.11
Load current (A) 501.85 ∠ 9.91 501.55 ∠ 10.05 655.49 ∠ -51.93 654.41 ∠ -51.86 308.73 ∠ 149.44 307.59 ∠ 149.45
Load harmonic current
contribution (%)
79.77 79.66 74.89 74.79 68.32 68.07
Utility voltage (V) 22.33 ∠ -36.38 22.28 ∠ -36.58 29.91 ∠ -58.74 29.8 ∠ -58.97 19.75 ∠ 172.39 19.69 ∠ 172.17
Utility harmonic voltage
contribution (%)
38.80 38.30 14.44 14.53 24.60 24.84
Utility current (A) 166.56 ∠ -44.73 167.87 ∠ -44.87 221.97 ∠ -64.72 223.37 ∠ -64.91 146.06 ∠ 168.57 147.11 ∠ 168.38
Utility harmonic current
contribution (%)
20.22 20.33 25.06 25.20 31.67 31.92
Figure 7. Comparison between the RLC method and the HVM method a. Voltage contribution before inserting C2. b.Voltage contribution after inserting C2. c. Current contribution before inserting C2. d. Current contribution after inserting C2.
M. Farhoodnea, et al.

214
5. Conclusion The proposed RLC method for predicting the contribution of harmonic distortion at the PCC has been developed by modeling the power system in terms of its Norton equivalent circuit. In the method, the utility harmonic source is represented by its short circuit impedance and a current source whereas the customer impedance is modeled in terms of its R, L and C components. The method is considered simple because it uses a scalar index for determining the harmonic contributions at both utility and customer sides. Comparing the RLC method with the HVM method and the method using the actual impedances of utility and customer, the results show that the RLC method is capable of estimating the harmonic contributions accurately even in resonance condition. References [1] W. Xu, et al., "An Investigation on the Validity of Power Direction Method for Harmonic
Source Determination," Power Engineering Review, IEEE, vol. 22, pp. 62-62, 2002. [2] X. Wilsun and L. Yilu, "A method to determine customer harmonic contributions for
incentive-based harmonic control applications," in Power Engineering Society Summer Meeting, 1999. IEEE, 1999, pp. 361-366 vol.1.
[3] X. Wilsun and L. Yilu, "A method for determining customer and utility harmonic contributions at the point of common coupling," IEEE Transactions on Power Delivery, vol. 15, pp. 804-811, 2000.
[4] C. Chaoying, et al., "Critical impedance method - a new detecting harmonic sources method in distribution systems," IEEE Transactions on Power Delivery, vol. 19, pp. 288-297, 2004.
[5] N. Hamzah, et al., "Harmonic source location at the point of common coupling based on voltage magnitude," in TENCON 2004. 2004 IEEE Region 10 Conference, 2004, pp. 220-223 Vol. 3.
[6] T. Pfajfar, et al., "Harmonic Contributions Evaluation With the Harmonic Current Vector Method," IEEE Transactions on Power Delivery, vol. 23, pp. 425-433, 2008.
[7] S. F. de Paula Silva and J. C. de Oliveira, "The sharing of responsibility between the supplier and the consumer for harmonic voltage distortion: A case study," Electric Power Systems Research, vol. 78, pp. 1959-1964, 2008.
[8] Z. P. Du, et al., "Identification of harmonic sources of power systems using state estimation," Generation, Transmission and Distribution, IEE Proceedings-, vol. 146, pp. 7-12, 1999.
[9] G. D'Antona, et al., "State Estimation for the Localization of Harmonic Sources in Electric Distribution Systems," IEEE Transactions on Instrumentation and Measurement, vol. 58, pp. 1462-1470, 2009.
[10] A. Kumar, et al., "Determination of location of multiple harmonic sources in a power system," International Journal of Electrical Power & Energy Systems, vol. 26, pp. 73-78, 2004.
[11] E. Gursoy, "Independent component analysis for harmonic source identification in electric power systems," Drexel University, 2007.
[12] E. Oja and A. Hyvarinen, "Independent component analysis: algorithms and applications," Neural Networks, vol. 13, pp. 411-430, 2000.
[13] D. Niebur, et al., "Independent Component Analysis Techniques for Power System Load Estimation," Applied Mathematics for Restructured Electric Power Systems, pp. 287-317.
[14] S. Varadan and E. B. Makram, "Generalized load modeling in the presence of harmonics and distortion," in System Theory, 1993. Proceedings SSST '93., Twenty-Fifth Southeastern Symposium on, 1993, pp. 124-128.
[15] M. M. M. El Arini, "A time domain load modelling technique and harmonics analysis," in Harmonics And Quality of Power, 1998. Proceedings. 8th International Conference on, 1998, pp. 930-938 vol.2.
An Improved Method for Determining Contribution

215
M. Farhoodnea received his B.Sc degree in Electrical Engineering from the Azad University of Najaf Abad, Esfahan, Iran in 2005. He is currently pursuing his Master degree in Electrical Engineering at the Department of Electrical, Electronic and Systems Engineering, Universiti Kebangsaan Malaysia.
Azah Mohamed received her B.Sc from King’s College, University of London in 1978 and M.Sc and Ph.D from Universiti Malaya in 1988 and 1995, respectively. She is a professor at the Department of Electrical, Electronic and Systems Engineering, Universiti Kebangsaan Malaysia. Her main research interests are in power system security, power quality, distributed generation and artificial intelligence. She is a senior member of IEEE.
H. Shareef received his B.Sc with honor from IIT, Bangladesh, MS degree from METU, Turkey, and Ph.D from Universiti Teknologi, Malaysia. He currently is an academic staff at the Department of Electrical, Electronic and Systems Engineering, Universiti Kebangsaan Malaysia. His current research interests are power system deregulation and power quality.
R. A. Jabbar Khan was born in Gujranwala, Pakistan, in 1966. He received his B.Eng, MEng, and PhD from UET Pakistan, University of Wollongong Australia and RMIT University Australia, in 1991, 1996 and 2003, respectively. Currently, he is serving as Principal of Rachna College of Engineering & Technology Gujranwala, Pakistan. His research interests include power quality, power system simulation, and deregulation of electricity.
M. Farhoodnea, et al.