determining utility system value of demand flexibility
TRANSCRIPT
DOE/EE-2011
Determining Utility System Value of Demand Flexibility from Grid-Interactive Efficient Buildings
April 2020
The State and Local Energy Efficiency Action Network is a state and local effort facilitated by the U.S. Department of
Energy and U.S. Environmental Protection Agency to offer resources, discussion forums, and technical assistance to state and local decision makers as they provide low-cost,
reliable energy to their communities through energy efficiency.
Learn more at www.seeaction.energy.gov
April 2020 www.seeaction.energy.gov i
If this document is referenced, it should be cited as:
State and Local Energy Efficiency Action Network. (2020). Determining Utility System Value of Demand Flexibility from Grid-Interactive Efficient Buildings. Prepared by: Tom Eckman, Lisa Schwartz, and Greg Leventis, Lawrence Berkeley National Laboratory.
FOR MORE INFORMATION
Regarding Determining Utility System Value of Demand Flexibility from Grid-Interactive Efficient Buildings, please contact:
Lisa Schwartz Lawrence Berkeley National Laboratory
Regarding the State and Local Energy Efficiency Action Network, please contact:
Johanna Zetterberg U.S. Department of Energy
April 2020 www.seeaction.energy.gov i
Acknowledgments
The work described in this study was funded by the U.S. Department of Energy’s (DOE’s) Building Technologies Office, Office of Energy Efficiency and Renewable Energy, under Lawrence Berkeley National Laboratory Contract No. DE-AC02-05CH11231. This study was prepared under DOE’s authority to encourage and facilitate the exchange of information among State and local governments with respect to energy conservation and energy efficiency, and provide technical assistance on such matters. This study was specifically prepared for the use and dissemination of the State and Local Energy Efficiency (SEE) Action Network, a DOE program that DOE and the U.S. Environmental Protection Agency facilitate, to offer resources and technical assistance to state and local decision makers as they provide low-cost, reliable energy to their communities through energy efficiency. The purpose of SEE Action is not to provide advice or recommendations to DOE or the Federal government.
The authors acknowledge our DOE program managers, Johanna Zetterberg and Monica Neukomm, for their guidance in preparing this report. We also thank the following individuals for reviewing a draft of this document: Beth Conlin and Maureen McNamara (U.S. Environmental Protection Agency), Rachel Gold and Christopher Perry (American Council for an Energy-Efficient Economy), John Mayernik (National Renewable Energy Laboratory), Rich Sedano (Regulatory Assistance Project), Rodney Sobin (National Association of State Energy Officials), Tim Woolf (Synapse Energy Economics), and Henry Yoshimura (ISO New England). Finally, we thank SEE Action Network Executive Committee members for providing feedback on a summary of the report outline.
All opinions, errors, and omissions remain the responsibility of the authors. All reference URLs were accurate as of the date of publication.
Other Reports in This Series
• Introduction for State and Local Governments: Describes grid-interactive efficient buildings in the context of state and local government interests; highlights trends, challenges and opportunities for demand flexibility; provides an overview of valuation and performance assessments for demand flexibility; and outlines actions that state and local governments can take, in concert with utilities, regional grid operators, and building owners, to advance demand flexibility
• Issues and Considerations for Advancing Performance Assessments for Demand Flexibility from Grid-Interactive Efficient Buildings: Summarizes current practices and opportunities to encourage robust and cost-effective assessments of demand flexibility performance and improve planning and implementation based on verified performance.
In addition, DOE offers a fact sheet, overview, and series of technical reports with more information on technologies and strategies for grid-interactive efficient buildings: https://www.energy.gov/eere/buildings/grid-interactive-efficient-buildings.
April 2020 www.seeaction.energy.gov ii
Acronyms
AESC Avoided Energy Supply Component CCCGT combined-cycle combustion gas turbine CONE Cost of New Entry DER distributed energy resource DOE U.S. Department of Energy DRIPE Demand Reduction-Induced Price Effects DRP Distributed Resource Plan EIA U.S. Energy Information Administration EPA U.S. Environmental Protection Agency EPRI Electric Power Research Institute ERCOT Electric Reliability Council of Texas EUL expected useful life FEMA Federal Emergency Management Agency HECO Hawaiian Electric Companies HVAC heating, ventilation, and air conditioning ICE Interruption Cost Estimator IRP integrated resource plan (or planning) ISO Independent system operator ISO-NE New England Independent System Operator LACE levelized avoided cost of energy LBNL Lawrence Berkeley National Laboratory (Berkeley Lab) LCOE levelized cost of energy LDA locational deliverability area MISO Midcontinent Independent System Operator NYISO New York Independent System Operator NSPM National Standard Practice Manual NWPCC Northwest Power and Conservation Council O&M operation and maintenance PJM Pennsylvania New Jersey Maryland Interconnection PV photovoltaic RFP request for proposal RPM Resource Portfolio Model RPS Renewable Portfolio Standard RTO Regional Transmission Organization SPP Southwest Power Pool T&D transmission and distribution
April 2020 www.seeaction.energy.gov iii
Glossary
Ancillary services: A variety of operations beyond generation and transmission that are required to maintain grid stability and security. These services generally include frequency control, spinning reserves, and operating reserves. Traditionally, ancillary services have been provided by generators and other equipment (e.g., capacitors) on the utility system; however, development of smart technologies has broadened the types of equipment that can be used to provide ancillary services.
Congestion: When the lowest-priced energy is prevented from flowing freely to a specific area on the grid because heavy electricity use is causing parts of the grid to operate near their limits.
Demand flexibility: Capability of DERs to adjust a building’s load profile across different timescales; energy flexibility and load flexibility are often used interchangeably with demand flexibility.
Demand response: Change in the rate of electricity consumption in response to price signals or the specific requests of a grid operator.
Distributed energy resource (DER): A resource sited close to customers that can provide all or some of their immediate power needs and/or can be used by the utility system to either reduce demand or provide supply to satisfy the energy, capacity, or ancillary service needs of the grid.
Energy efficiency: Ongoing reduction in energy use to provide the same or improved level of function.
Grid-interactive efficient building: An energy-efficient building that uses smart technologies and on-site DERs to provide demand flexibility while co-optimizing for energy cost, grid services, and occupant needs and preferences in a continuous and integrated way.
Grid services: Services that support the generation, transmission, and distribution of electricity and provide value through avoided electricity system costs (generation and/or delivery costs); this report focuses on grid services that can be provided by grid-interactive efficient buildings.
Non-wires solutions: An electricity grid investment or project that uses nontraditional transmission and distribution (T&D) solutions, such as distributed generation, energy storage, energy efficiency, demand response, and grid software and controls, to defer or replace the need for specific equipment upgrades, such as T&D lines or transformers, by reducing load at a substation or circuit level.
Smart technologies for energy management: Advanced controls, sensors, models, and analytics used to manage DERs. Grid-interactive efficient buildings are characterized by their use of these technologies.
April 2020 www.seeaction.energy.gov iv
Table of Contents
1. Executive Summary ....................................................................................................................1
2. Introduction...............................................................................................................................8
3. Factors Impacting the Economic Value of Grid Services ............................................................. 14
Electricity Market Structure ............................................................................................................... 14
Available Resource Options and Costs ............................................................................................... 16
State Energy Policies and Regulatory Context ................................................................................... 17
4. Common Methods for Determining Economic Value of DERs That Can Provide Demand Flexibility for Grid Services ............................................................................................................................... 19
System Capacity Expansion Market/Models ...................................................................................... 19
Competitive Bidding/Auctions ........................................................................................................... 21
Proxy Resources ................................................................................................................................. 22
Administrative/Public Policy Determinations .................................................................................... 23
Special Studies .................................................................................................................................... 23
5. Enhanced Valuation Methods to Capture the Value of Demand Flexibility in Grid-Interactive Efficient Buildings ............................................................................................................................ 25
Overview of Enhanced Planning and Analysis .................................................................................... 25
Distribution System Planning and Analysis ............................................................................... 27
Bulk Power System Planning and Analysis ................................................................................ 29
Specific Enhanced Valuation Methods ............................................................................................... 31
Appendix A. Example Valuation Methods and Practices Applicable to Demand Flexibility in Grid-Interactive Efficient Buildings ......................................................................................................... A-1
System Capacity Expansion/Market Models .................................................................................... A-1
Competitive Bidding/Auctions ......................................................................................................... A-4
Proxy Resources ............................................................................................................................... A-7
Administrative/Public Policy Determinations .................................................................................. A-8
Special Studies .................................................................................................................................. A-9
Appendix B. Summary of Valuation Enhancements and Implementation Resources ......................... B-1
April 2020 www.seeaction.energy.gov v
List of Tables
Table 1. Summary of Valuation Enhancements and Related Actions ........................................................... 6
Table 2. Applicability of Enhanced Valuation Methods to Distribution, Generation, and Transmission Planning Analyses ....................................................................................................................................... 30
Table 3. Summary of Valuation Enhancements, Technical Implementation Steps, and Guidance ............ 43
List of Figures
Figure 1. Framework for Evaluating Benefits and Costs of DERs on Electric Utility Systems ....................... 9
Figure 2. Electric Power Markets in the United States ............................................................................... 15
Figure 3. States with Integrated Resource Planning Requirements ........................................................... 16
Figure 4. Major Planning and Analysis Processes for Economic Valuation of Demand Flexibility for Grid Services ....................................................................................................................................................... 26
Figure 5. EPRI’s Integrated Grid Distribution Analysis Framework ............................................................. 28
Figure 6. Time-Sensitive Value of Energy Efficiency Measures for Residential Air-Conditioning, by Region/State ............................................................................................................................................... 33
Figure 7. Relative Contribution to Total Utility System Value for Energy and Capacity Savings From Residential Air-Conditioning in California ................................................................................................... 35
Figure 8. Berkeley Lab’s Analytical Framework for Addressing DER Interactions ...................................... 37
Figure 9. Interaction Between Energy Efficiency and Demand Response Development ........................... 38
Figure 10. Impact of Demand Response and Energy Efficiency Acquisition on the Timing and Amount of CCCGT Development in the Northwest ...................................................................................................... 42
April 2020 www.seeaction.energy.gov vi
Abstract
This report focuses on ways current methods and practices that establish the value to electric utility systems of distributed energy resource (DER) investments can be enhanced to determine the value of demand flexibility in grid-interactive efficient buildings that can provide grid services. The report introduces key valuation concepts that are applicable to demand flexibility in buildings and links to other documents that describe these concepts and their implementation in more detail.
The scope of this report is limited to the valuation of economic benefits to the utility system. These are the foundational values on which other benefits (and costs) can be built. Establishing the economic value to the grid of demand flexibility provides the information needed to design programs, market rules, and rates that align the economic interest of utility customers with building owners and occupants. By nature, DERs directly impact customers and provide societal benefits external to the utility system. Jurisdictions can use utility system benefits and costs as the foundation of their economic analysis but align their primary cost-effectiveness metric with all applicable policy objectives, which may include customer and societal (non-utility system) impacts.
This report suggests enhancements to current methods and practices that state and local policymakers, public utility commissions, state energy offices, utilities, state utility consumer representatives, and other stakeholders can use. These enhancements can improve the consistency and robustness of economic valuation of demand flexibility for grid services. The report concludes with a discussion of considerations for prioritizing implementation of these improvements based on potential impacts and ease of implementation.
April 2020 www.seeaction.energy.gov vii
HOW TO USE THIS REPORT
This report is intended to support increased use of DERs for demand flexibility in grid-interactive efficient buildings by improving methods used to establish their economic value to the utility system for grid services. These methods are used in cost-effectiveness analyses; design of programs, rates, and market rules; and setting and achieving state and local policy goals.
The report provides an overview of current economic valuation methods and practices and considerations for how jurisdictions might enhance these methods and practices to more fully account for the value of demand flexibility. The report is organized as follows:
Section 1 summarizes major findings.
Section 2 introduces key concepts that have a direct bearing on valuation of demand flexibility for potential grid services, including how it changes the way grid services are valued.
Section 3 describes how the determination of the “avoided resource” value of grid services differs across the country due to three factors: (1) electricity market structure; (2) available resource options and costs; and (3) state energy policies and regulatory context.
Section 4 provides an overview of the most common methods used to define and derive the economic value of DERs providing grid services, all of which can be applied to demand flexibility.
Section 5 discusses how current economic valuation methods for DERs could be enhanced to address five issues that are critically associated with determining the economic value to the utility system of demand flexibility, with a focus on resource and program planning. This section also provides options for prioritizing implementation of these enhancements based on potential impacts and ease of implementation.
Appendix A summarizes examples of entities that have implemented one or more of the presented enhancements to valuation methods.
Appendix B is a table listing valuation enhancements discussed in the report and primary resource documents for more detailed guidance on implementation.
Sections 2-4 provide background for those who are not familiar with factors that determine the value of resources providing utility grid services or the most common methods used to estimate their value. Readers who are familiar with this material may want to go directly to the discussion in Section 5.
April 2020 www.seeaction.energy.gov 1
1. Executive Summary
Demand flexibility—the capability provided by distributed energy resources (DERs) to adjust load profiles across different timescales—can provide significant benefits to the electric utility system through a combination of actions that control or reduce electricity consumption to avoid system costs. Grid-interactive efficient buildings are an important source of demand flexibility.
This report focuses on methods and practices for determining the economic value of demand flexibility that grid-interactive efficient buildings can provide to electric utility systems.1 Establishing this value provides basic information needed to design programs, market rules, and rates that align the economic interest of utility customers with building owners and occupants. The report provides guidance to state and local policymakers, public utility commissions, state energy offices, utilities, state utility consumer representatives, and other stakeholders on how to improve consistency and robustness of economic valuation of grid services provided by demand flexibility in grid-interactive efficient buildings.
The report considers the value of demand flexibility in terms of distribution system and bulk power system (generation and transmission) impacts—specifically, net changes in associated costs and benefits. These capital and operation and maintenance (O&M) impacts are reflected in utility revenue requirements, the annual revenue the utility is entitled to collect from its customers. While the report is most useful to vertically integrated states that oversee planning for both distribution and bulk power systems, enhanced methods for distribution system analyses also are relevant for states with restructured electricity markets.
1 Several resource valuation frameworks that can support resource and program planning also point to consideration of participant and societal values when determining the full value of resources. Jurisdictions can use utility system benefits and costs as the foundation of their economic analysis but align their primary cost-effectiveness metric with all applicable policy objectives, which may include non-utility system impacts.
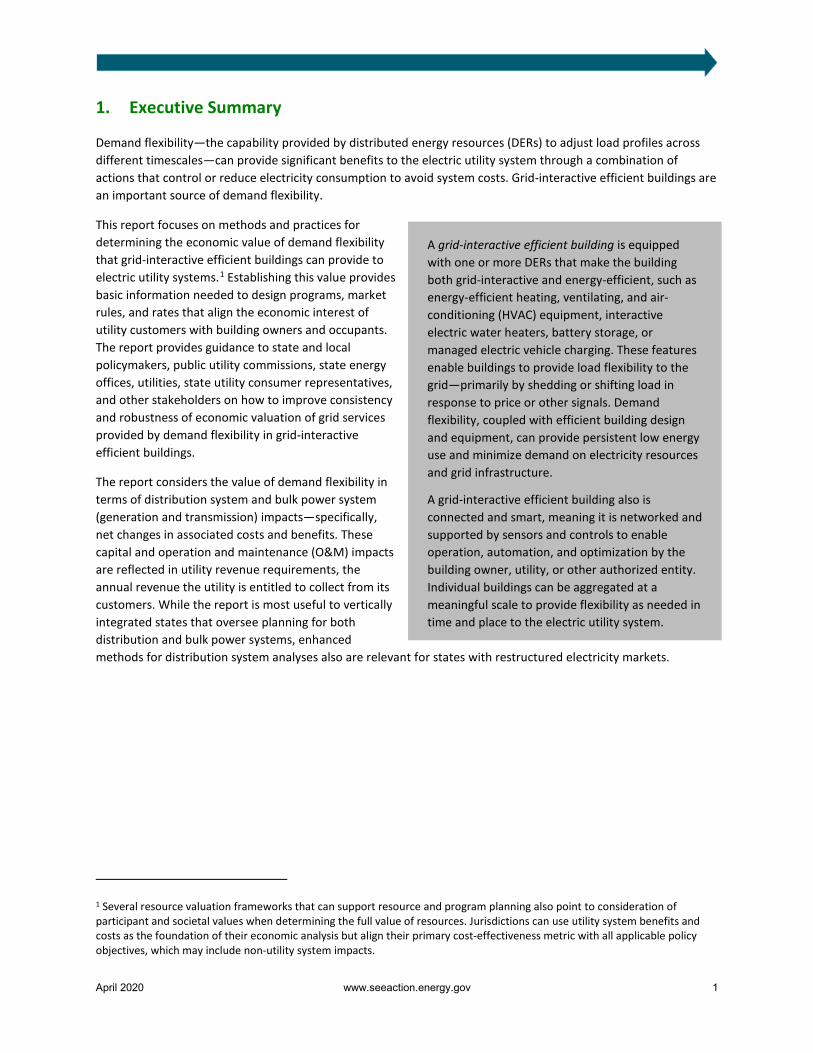
A grid-interactive efficient building is equipped with one or more DERs that make the building both grid-interactive and energy-efficient, such as energy-efficient heating, ventilating, and air-conditioning (HVAC) equipment, interactive electric water heaters, battery storage, or managed electric vehicle charging. These features enable buildings to provide load flexibility to the grid—primarily by shedding or shifting load in response to price or other signals. Demand flexibility, coupled with efficient building design and equipment, can provide persistent low energy use and minimize demand on electricity resources and grid infrastructure.
A grid-interactive efficient building also is connected and smart, meaning it is networked and supported by sensors and controls to enable operation, automation, and optimization by the building owner, utility, or other authorized entity. Individual buildings can be aggregated at a meaningful scale to provide flexibility as needed in time and place to the electric utility system.
April 2020 www.seeaction.energy.gov 2
Grid services that can provide economic value to the utility system can be characterized as services that:
1. Reduce generation costs by offsetting generation capacity investments, avoiding power plant fuel costs and O&M costs, or providing ancillary services, such as frequency and voltage support and regulation and contingency reserves, at lower cost; and/or
2. Reduce delivery costs by offsetting transmission and distribution (T&D) capacity investments, increasing T&D equipment life and reducing equipment maintenance, or supporting T&D ancillary services, such as distribution-level voltage control, at a lower cost.
Because demand flexibility is dispatched in response to a signal from a utility or regional grid operator, the list of DERs for which economic values need to be established is limited to those that rely on controls.
There is no single economic value of demand flexibility for utility systems. The value of a single “unit” (e.g., kW, kWh) of grid service provided by demand flexibility is a function of the:
• timing of the impact (temporal load profile)
• location in the interconnected grid
• grid services provided
• expected service life (persistence) of the impact
• avoided cost of the least-expensive resource alternative that provides comparable grid service.
The economic valuation of demand flexibility for grid services should be established through planning processes that address these factors. Traditionally, the economic value of energy efficiency, demand response, and other DERs has been determined using the “avoided cost” of conventional resources that provide the identical utility system service. The underlying economic principle of this approach is that the value of a resource can be estimated
WHY PROPER ECONOMIC VALUATION OF DEMAND FLEXIBILITY IS CRITICAL UP FRONT
Utility and third-party program administrators forecast the cost-effectiveness of energy efficiency, demand response, and other DER measures and programs prior to implementation. These economic valuations affect assessments of resource potential, decisions on program measures, financial incentive levels, and program budgets that occur at the planning stage. If the value of demand flexibility provided by grid-interactive efficient buildings is undervalued at the planning stage, less emphasis likely will be placed on developing these resource opportunities.
The utility or regional grid operator decides how and when to call on demand flexibility (to the extent permitted under any contract or agreement with the building owner or operator). The actual responses of building owners and occupants determine the ultimate grid impacts. To minimize differences between assumed timing and magnitude of grid impacts in the planning process and performance assessments of actual grid services, jurisdictions can both enhance current valuation methods at the planning stage and modify program designs for some measures.
This report focuses on administrative processes used during planning to recognize the economic value of a subset of DERs that provide grid services through demand flexibility. These upfront processes provide signals for investments by building owners and service providers, enable compensation for demand flexibility value, and provide utilities with confidence that DERs will be recognized in utility cost recovery proceedings.
April 2020 www.seeaction.energy.gov 3
using the cost of acquiring the next least expensive alternative resource that provides comparable services (i.e., the avoided cost of that resource).
Thus, the primary task required to determine the value of demand flexibility based on avoided cost is to identify the alternative resource and establish its cost. Methods used to accomplish this vary widely across the United States due to differences in: (1) electricity market structure; (2) available resource options and their costs; and (3) state energy policies and regulatory context. In addition, some states provide detailed guidance regarding specific types of analyses required. As a result, some jurisdictions use market-based valuation, while others use resource planning processes; some use time-sensitive valuation, while others do not; some include the value of avoided T&D, while others do not.
Demand flexibility should be treated on a par with supply-side options so that all grid impacts, costs, and benefits to the utility system can be quantified and monetized. While specific approaches vary, determining economic value of DERs providing demand flexibility generally falls within the following common practices.
• System capacity expansion and market models: Utilities and other entities use generation, transmission, and distribution capacity expansion models to evaluate the reliability, cost, and sometimes risk of alternative system expansion plans. These models primarily estimate the value of energy, capacity, ancillary services, and transmission or distribution capacity deferrals. Capacity expansion modeling processes use two general approaches to estimate the value of DERs providing demand flexibility.
• The most prevalent approach is to simply reduce the growth rate of energy and/or peak demand in load forecasts that serve as inputs to these models. Then, based on these lower load forecasts, the capacity expansion model optimizes the type, amount, and schedule of new conventional resources (generation, transmission, or distribution) to maintain system reliability at the lowest net present value system cost.
• The alternative, less prevalent, approach is to treat DERs as resource options directly in the capacity expansion modeling process. This allows DERs to compete directly with conventional resources in the model to determine their impact on system load growth and load shape and thus the type, amount, and timing of conventional resource development. In contrast to the more prevalent approach of decrementing the load forecast, this approach tests whether development of DERs will alter the avoided cost of the utility system being modeled. That is, the process accounts for interactions between DERs and the utility system in which they would be installed.
• Competitive bidding processes/auctions: Both vertically integrated utilities and regional grid operators use “the market” to determine the economic value of new and existing resources. Some vertically integrated utilities, after completing their integrated resource plan (IRP) or other long-range resource planning processes, may issue requests for proposals (RFPs) to meet any identified future needs for energy and peaking capacity. The cost of the most expensive resource for which a bid is accepted for a particular grid service establishes the avoided cost in the market. As long as resources are providing comparable grid services, it does not matter whether they are traditional generating, transmission, or distribution resources or demand-side options. Their value to the utility system is the same.
• Proxy resources: This approach uses the cost of a resource that provides comparable grid services (for example, a new natural gas-fired combined-cycle combustion turbine) to establish the value of energy or capacity savings for other resources providing the same grid services. It is essential that the proxy resource selected is the most likely competitive alternative for providing the grid service that could be supplied by investments in energy efficiency, demand response, or other DERs. That is, this method assumes that were it not for the investment in DERs, the proxy resource would be developed.

April 2020 www.seeaction.energy.gov 4
• Administrative/public policy determinations: Jurisdictions may decide to simplify compliance with a preferred policy direction by determining administratively the value of resource benefits. Such methods have been used to estimate the value of benefits that have proven difficult (or expensive) to quantify analytically. While there may be some analytical basis for the values selected, the approach relies on state regulatory or legislative action to establish the value of these benefits.
• Special studies: Quantification and monetization of some utility system benefits from demand flexibility may be best captured through specifically targeted research and analysis. For example, developing estimates of the benefits of energy efficiency to reduce future environmental damage costs might require analysis of environmental regulations and health impacts data. Another type of special study is valuing avoided or deferred T&D upgrades through non-wires solutions. Because such studies are location- and project-dependent, they likely will require targeted analysis. Methodologies are still under development for determining the value of energy resilience benefits that DERs can provide, building on longstanding approaches to valuing avoided power interruptions.
While these methods can be used to estimate the economic value of demand flexibility for grid services, many approaches—and their application—would benefit from specific enhancements in order to avoid under or overestimating the value of demand flexibility for grid services. Economic valuation of demand flexibility for grid services need not differ materially from the five common practices described above. Application of these approaches, particularly for planning purposes, likely will require additional data and improved analytical capabilities.
This report describes seven enhancements for consideration:
1. Account for all electric utility system economic impacts resulting from demand flexibility. For purposes of utility system valuation, demand flexibility should be treated on a par with supply-side options so that all grid impacts, costs, and benefits to the utility system can be quantified and monetized. This requires that its economic value reflect the impacts of demand flexibility across all asset types (generation, T&D), including the value of risk reduction and improved reliability and resilience.
2. Account for variations in value based on when demand flexibility occurs. The impact of demand flexibility should be addressed on a more granular timescale, because economic value of grid services
DATA REQUIREMENTS FOR THE VALUATION OF DEMAND FLEXIBILITY GRID SERVICES
• Hourly (subhourly) DER load or energy savings profiles • Load growth projections by feeder • System capacity planning studies—from distribution transformer to bulk system subtransmission • Existing and projected distributed generation deployment and production by location • Marginal line loss studies • System reliability studies (including voltages, protection, and phase balancing) • Systemwide and location-specific cost information, including for potential T&D upgrades • Systemwide and location-specific peak demand growth rates • Marginal cost of service studies* at hourly (or subhourly) timescale.
Source: Adapted from Pacific Northwest National Laboratory. 2018. Illinois Distributed Generation Rebate – Preliminary Stakeholder Input and Calculation Considerations.
April 2020 www.seeaction.energy.gov 5
provided by demand flexibility varies from subhourly to daily, monthly, and seasonally, as well as across future years. The value of DERs that can adjust load is dependent on the timing of their impacts.
3. Account for the impact of distribution system savings on transmission and generation system value. Demand flexibility that avoids distribution system losses when they are highest also results in reduced transmission system losses and generator capacity needs (including planning reserve margins). Distribution system-level impacts (locational impacts and their associated economic value) should be modeled and calculated first so the results can be used to adjust inputs to analysis of bulk transmission and generation system values.
4. Account for variations in value at specific locations on the grid. The economic value of demand flexibility that can provide grid services is highly dependent on where these impacts occur on T&D systems. Particular attention should be given to this issue in regions with centrally-organized wholesale electricity markets, where market prices for capacity do not reflect distribution system locational benefits.
5. Account for variations in value due to interactions between DERs providing demand flexibility. Higher levels of DERs increase the need to address interactions of DERs with one another and with the electric grid. DERs providing demand flexibility can interact with one another in material ways. It is unlikely that their collective and cumulative impacts are simply additive. Moreover, widespread deployment of demand flexibility for grid services will change grid operations and infrastructure development, altering avoided resource costs. These interactions will need to be accounted for to align impacts, such as amount, timing, and expected useful lives (EULs), that are estimated during planning for valuation and cost-effectiveness screening with those obtained through ex post assessments that estimate actual impacts.
6. Account for benefits across the full EULs of the resources. This enhancement addresses potential variation in measure/resource impacts of DERs for demand flexibility over their lifetimes when they provide grid services. First, their “dispatch,” while controlled by a grid operator, also will be dictated by the response of building owners and occupants. Second, by design, the technology employed may adjust impacts through time (e.g., learning thermostats and similar Artificial Intelligence learning controls).2 This implies that demand flexibility measures that defer or avoid capital expenditures, ongoing fuel costs, or O&M costs throughout their EULs should be valued differently than resources that only reduce near-term fuel costs or O&M costs. The same rule applies to demand flexibility forecasted to have variable and uncertain impacts through time.
7. Account for variations in value due to interactions between DERs and other system resources. The potential impact of demand flexibility on the dispatch of existing resources and the amount, type, and schedule of future development of conventional generation and T&D should be accounted for in system expansion models or market price forecasts used to estimate avoided costs. This enhancement can help more accurately estimate the long-run economic value of these resources. Implementation of this enhancement will likely require the most significant changes in methods used to value DERs for demand flexibility. Integrated analysis that accounts for interactive impacts between all types of resources requires system expansion models to include as options that can be selected for development all resources that can provide demand flexibility. Given data requirements and limitations of existing system expansion models, this enhancement is nascent. The report provides guidance on how such modeling might be accomplished.
2 Artificial Intelligence makes it possible for machines to learn from experience, adjust to new inputs, and improve performance through time.
April 2020 www.seeaction.energy.gov 6
To put these enhancements into practice for valuing energy efficiency, demand response, and other DERs during planning processes, the first step is for a jurisdiction to assess its current economic valuation methods and practices to determine how they compare to the enhanced methods and practices described above. Next is prioritizing the enhanced methods and practices based on weighting the magnitude of potential impacts against data requirements and analytical complexity (i.e., ease of implementation).
A later step, outside the scope of this report, is to make cost-effectiveness determinations. To assess whether demand flexibility in grid-interactive efficient buildings can provide grid services cost-effectively, compared with traditional distribution and bulk power system solutions, the incremental cost of the building technology or measure, plus the cost of electric utility infrastructure (e.g., communications and back office systems, Supervisory Control and Data Acquisition, advanced metering infrastructure or other utility metering, switch gear) necessary to implement and operate it—and any other cost for the utility system necessary to integrate the measure or technology (e.g., changes in feeder or substation configuration)—must be known.3 Also outside the scope of this report is determining how demand flexibility will be dispatched or how providers will be compensated for services.
Table 1 summarizes enhancements for consideration and related actions.
Table 1. Summary of Valuation Enhancements and Related Actions
Valuation Enhancement4 Related Action
1. Account for all electric utility system economic impacts resulting from demand flexibility
Prioritize enhancements for analyses used to derive the value of primary utility system benefits. While all substantive and reasonably quantifiable generation and T&D system impacts should ultimately be included, not all utility system benefits provided by demand flexibility are of equal value. A logical first step in implementing the enhancements is to focus on those that target valuation of primary utility system benefits of demand flexibility, including avoided costs of electricity generation or wholesale electricity purchases; deferred or avoided costs of power plant capacity; avoided T&D energy losses; and deferred or avoided costs for T&D capacity.
2. Account for variations in value based on when demand flexibility occurs
Develop and use hourly forecasts of avoided energy and capacity costs in combination with publicly available load shape data for DERs to value demand flexibility. For planning purposes, it may be necessary to rely on engineering estimates of grid system impacts of demand flexibility because of limited publicly available data on the load profile impacts of DERs; however, the intrinsic capabilities of deployed DERs providing demand flexibility will facilitate assessment of their actual grid impacts. Since DERs providing demand flexibility must, by nature, be under control, their actual impacts should be much easier to validate than historical energy efficiency measures and programs. That is, verification of impacts of demand flexibility in near-real time will be possible because actual responses to dispatch signals (e.g., price, electronics) can be tracked or directly measured via sensors and metering.
3 These costs are specific to the measure, technology, building, and utility and are likely to change with widespread adoption of grid-interactive efficient buildings. Cost-effectiveness calculations should pair local and contemporary cost estimates with the value of the electric grid benefits derived through the methods described in this report. 4See Table 2 for technical implementation steps and Appendix B for implementation resources.
April 2020 www.seeaction.energy.gov 7
Valuation Enhancement4 Related Action
3. Account for the impact of distribution system savings on transmission and generation system value
Model and calculate distribution system-level impacts (i.e., locational impacts and associated economic value) first so that results can be used to adjust inputs to analysis of bulk transmission and generation system values.
4. Account for variations in value at specific locations on the grid
Initiate a distribution system planning process that includes: (1) hosting capacity analysis to estimate generating DER capacity limits and identify demand flexibility that can mitigate limits; (2) thermal limit analysis to estimate locational value of non-wires solutions; (3) energy analysis to quantify marginal distribution system losses; and (4) systemwide analysis of the avoided cost of deferred distribution capacity expansion.
5. Account for variations in value due to interactions between DERs providing demand flexibility
Start accounting for interactions between DERs. Implementing enhancements to better account for the interaction between DERs can be accomplished with varying levels of complexity. Basic analysis can assume that deployment of multiple types of DERs does not impact the existing or future electric grid in a way that alters the type, amount, or schedule of conventional technologies developed to provide comparable grid services (i.e., deployment of DERs does not impact avoided costs). Such basic analysis does not require the use of system capacity expansion models.
6. Account for benefits across the full expected lives of the resources
As a first step, use the EUL of DERs providing demand flexibility to calculate their economic value. Because demand flexibility is largely based on controls, the dispatch of which is determined by the combined impact of grid operators and owner/occupant responses, EULs may be more a function of rate and program design, compared to EULs for traditional energy efficiency measures. Uncertainty regarding EULs for demand flexibility may be best addressed through program design.
7. Account for variations in value due to interactions between DERs and other system resources
Use distribution, transmission, and generation capacity expansion modeling, supplemented as necessary with other methods described in Section 4 of this report, to determine the impact of widespread deployment of demand flexibility for grid services. Implementing this enhancement will require customization of commercially available capacity expansion models.
April 2020 www.seeaction.energy.gov 8
2. Introduction
This section briefly introduces key concepts that have a direct bearing on valuation of demand flexibility for grid services, including how these services are valued.
Demand flexibility can provide significant benefits to the grid through a combination of actions that control or reduce electricity consumption to avoid electricity system costs.5 Grid services that can provide economic value can be characterized as services that:
1. Reduce generation costs by offsetting generation capacity investments, avoiding power plant fuel costs and O&M costs, or providing ancillary services such as frequency and voltage support and regulation and contingency reserves at lower cost; and/or
2. Reduce delivery costs by offsetting T&D capacity investments, increasing T&D equipment life and reducing equipment maintenance, or supporting T&D ancillary services, such as distribution-level voltage control, at a lower cost.
Text Box 1 lists potential types of utility system avoided costs for grid services that demand flexibility can provide.
TEXT BOX 1: SOURCES OF VALUE DEMAND FLEXIBILITY TO UTILITY SYSTEMS
• Avoided energy costs—value of avoiding generation or purchasing electric energy • Avoided generating capacity costs—value of avoiding generation or purchasing peaking capacity • Avoided reserves—value of reduction in reserve capacity requirements • Avoided T&D costs—value of load reduction on T&D system • Avoided T&D marginal line losses—value of avoided marginal line losses • Avoided ancillary services—value of reduction in services required to maintain grid stability and security • Energy and/or capacity price suppression effects—reduced market clearing prices, which may extend
outside the utility’s service territory because of the regional nature of wholesale electricity markets • Avoided costs of compliance with state Renewable Portfolio Standards (RPS)—reduction in absolute
amount of renewable resources that must be acquired • Avoided environmental compliance costs—reduction in future costs of complying with environmental
regulations • Avoided credit and collection costs—value of reduced probability of customers falling behind or defaulting
on utility bill payment obligations as a result of lower customer energy bills • Reduced risk—value of utility system risk reduction (Demand flexibility does not have fuel price risk or
environmental compliance cost risk and affects the need for investment in new electricity infrastructure across generation and T&D systems.)
• Increased reliability—value of reduced probability and/or likely duration of customer service interruptions • Increased resilience—value of maintaining more livable conditions for consumers for longer periods
(compared to buildings that are not energy-efficient), preserving business operations (in combination with on-site generation plus storage or local microgrids), and reducing the amount of capacity required for recovery from disruptions (i.e., black starts).
Adapted from Woolf et al. 2017. State policies may require consideration of utility system benefits not listed here.
5 Alstone et al. 2017.
April 2020 www.seeaction.energy.gov 9
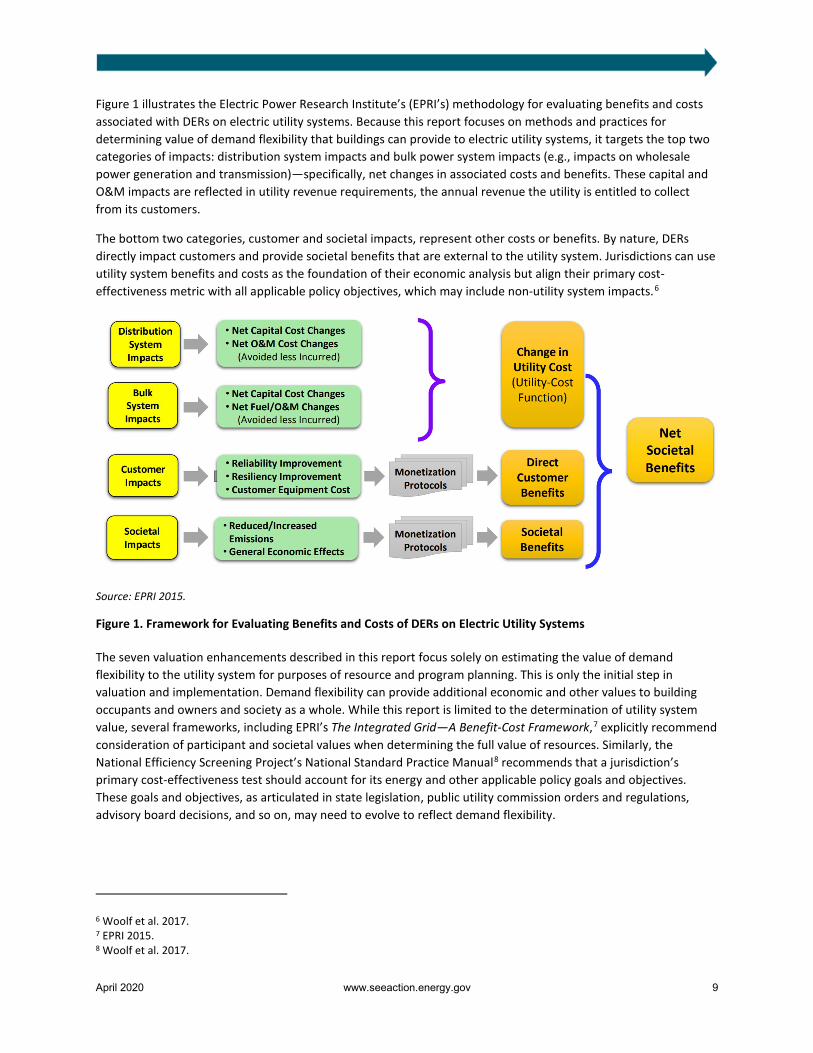
Figure 1 illustrates the Electric Power Research Institute’s (EPRI’s) methodology for evaluating benefits and costs associated with DERs on electric utility systems. Because this report focuses on methods and practices for determining value of demand flexibility that buildings can provide to electric utility systems, it targets the top two categories of impacts: distribution system impacts and bulk power system impacts (e.g., impacts on wholesale power generation and transmission)—specifically, net changes in associated costs and benefits. These capital and O&M impacts are reflected in utility revenue requirements, the annual revenue the utility is entitled to collect from its customers.
The bottom two categories, customer and societal impacts, represent other costs or benefits. By nature, DERs directly impact customers and provide societal benefits that are external to the utility system. Jurisdictions can use utility system benefits and costs as the foundation of their economic analysis but align their primary cost-effectiveness metric with all applicable policy objectives, which may include non-utility system impacts.6
Source: EPRI 2015.
Figure 1. Framework for Evaluating Benefits and Costs of DERs on Electric Utility Systems
The seven valuation enhancements described in this report focus solely on estimating the value of demand flexibility to the utility system for purposes of resource and program planning. This is only the initial step in valuation and implementation. Demand flexibility can provide additional economic and other values to building occupants and owners and society as a whole. While this report is limited to the determination of utility system value, several frameworks, including EPRI’s The Integrated Grid—A Benefit-Cost Framework,7 explicitly recommend consideration of participant and societal values when determining the full value of resources. Similarly, the National Efficiency Screening Project’s National Standard Practice Manual8 recommends that a jurisdiction’s primary cost-effectiveness test should account for its energy and other applicable policy goals and objectives. These goals and objectives, as articulated in state legislation, public utility commission orders and regulations, advisory board decisions, and so on, may need to evolve to reflect demand flexibility.
6 Woolf et al. 2017. 7 EPRI 2015. 8 Woolf et al. 2017.
April 2020 www.seeaction.energy.gov 10
Grid-interactive efficient buildings can provide services to the electric grid using five strategies.9
• Energy efficiency: The ongoing reduction in energy use while providing the same or improved level of building function.10
• Load shed: The ability to reduce electricity use for a short time period and typically on short notice. Shedding is typically dispatched during peak demand periods and during emergencies.
• Load shift: The ability to change the timing of electricity use. In some situations, a shift may lead to changing the amount of electricity that is consumed. Load shift in this report focuses on intentional, planned shifting for reasons such as minimizing demand during peak periods, taking advantage of the cheapest electricity prices, or reducing the need for renewable curtailment. For some technologies, there are times when a load shed can lead to some level of load shifting.
• Modulate: The ability to balance power supply/demand or reactive power draw/supply autonomously (within seconds to subseconds) in response to a signal from the grid operator during the dispatch period.
• Generate: The ability to generate electricity for on-site consumption and even dispatch electricity to the grid in response to a signal from the grid. Batteries are often included in this discussion, as they improve the process of dispatching such generated power.
Unlike some traditional uses of DERs, demand flexibility is initiated by a response to a signal (manual or electronic communication, price) from a utility or regional grid operator. This narrows the list of DERs for which economic values need to be established to those that rely on controls.
There is no single economic value of demand flexibility for utility systems. The economic value of a single unit (e.g., kW, kWh) of grid service provided by demand flexibility is a function of the timing of the impact (temporal load profile), the location in the interconnected grid, the grid services provided, the expected service life (persistence) of the impact, and the avoided cost of the least-expensive resource alternative that provides comparable grid service. These five factors are described below.
The timing of the impact: The economic value of demand flexibility is a function of its real-time temporal impacts. For example, demand flexibility that has impacts coincident with transmission system and/or distribution system peak demands has greater value. Several recent Berkeley Lab studies explored the time-dependent value of energy efficiency across multiple utility systems and measures. Mims et al. (2017) concluded that “The time-varying value of energy efficiency savings is important because, when calculating the benefits to the power system produced by energy efficiency savings, that value will be determined by the season and hour of the day that the energy reductions occur.”
The value of grid services that can be provided by adjusting load profiles in buildings is even more dependent on temporal value, because these services are only needed during specific times of the day and seasons of the year or at times when the electricity grid is under stress (e.g., extreme peak demands, variability in output or complete loss of generation, or loss of transmission assets). Moreover, as discussed in Text Box 2, because different methods are used to provide the specified grid service, the profile of energy and demand savings varies by measure type (and how the measure is employed). Therefore, input assumptions used to calculate the temporal value of demand flexibility need to reflect either the shape of the energy (kWh) and demand (kW) savings or the shape of the end use it impacts at a granular (subhourly, hourly) time scale.
9 Neukomm et al. 2019. 10 This has the greatest impact for the grid during high-cost periods and minimizes utilization of costly generation resources.
April 2020 www.seeaction.energy.gov 11
TEXT BOX 2: THREE WAYS TO SAVE—ONLY TWO ARE BOTH INTERACTIVE AND PROVIDE DEMAND FLEXIBILITY
Electricity consumption is calculated by multiplying instantaneous demand (watts, kilowatts, megawatts) by a unit of time (second, minute, hour, year). This means that there are only three basic ways to achieve energy savings: (1) reduce demand; (2) modify duration; or (3) both reduce demand and modify duration. Following are three examples. Reduce demand through improved end-use technology: These energy efficiency measures reduce the energy needed to accomplish a given task (e.g., light-emitting diode lamps that require 12 watts to produce the same lumen output and color temperature as a 75-watt incandescent lamp). The energy savings from a technology that reduces energy required to accomplish a specific end-use task typically has the same load profile as the end-use load shape. Higher efficacy lighting and high efficiency motors are examples of measures that have savings profiles identical to their baseline end-use load shapes. Alter duration through controls: These measures employ controls (automatic or manual) to change (typically reduce) the hours of operation of electricity-consuming devices (e.g., occupancy sensors to switch off lights in unoccupied spaces, sensors and software to power down computers or televisions to standby mode when not in use). The shape of the energy savings from controls is typically different than the underlying end-use load shapes because savings result from modifying the duty cycle (changing the hours of operation)—not simply reducing wattage used to perform the desired task. Reduce demand through improved end-use technology and alter duration through controls: These measures apply both demand reduction and altered hours of operation (e.g., installation of high efficacy lighting with daylighting controls to reduce wattage and switch off lighting when natural lighting is adequate). As with controls, energy savings occur from modifying the end use duty-cycle (hours of use) as well as the level of demand. Thus, the savings load shape typically is not the same as the end-use load shape. Energy-efficient buildings may include any of these three ways to save electricity. In order to adjust loads up or down, and in different timescales, demand flexibility in buildings must have the capability to control either their level of demand, or both the timing and level of demand, in response to some type of signal (price, electronic, or other form of communication) from the utility or regional grid operator.
Location within interconnected grid: Some forms of demand flexibility may derive a significant portion of value based on locational impacts. For example, depending on distribution circuit characteristics, the combined impact of demand flexibility may defer the need for additional distribution investments. Therefore, its value depends on where in the distribution circuit the building providing demand flexibility is located, its proximity to any network constraints, and its ability to reduce the need for distribution investments. Some energy efficiency and demand response programs have been targeted at specific geographic locations to reduce or defer the need to increase local distribution system capacity or defer upgrades to transmission capacity.11
11 Chew et al. 2018 summarizes several recent examples.
April 2020 www.seeaction.energy.gov 12
While the economic value of these targeted non-wires solutions is determined by site-specific conditions, widescale deployment of demand flexibility also can defer investments in T&D infrastructure by reducing the overall pace of peak demand growth in a broader geographic area. In contrast to the value of targeted load reductions, these system-level avoided T&D costs are estimates of the overall, long-term ratio of T&D savings per kW of avoided load growth (and kW of peak savings).12 This system-level avoided T&D cost assumes that every kW of load reduction in any location within an interconnected system will have the same value. This simplification is reasonable only for widespread deployment of demand flexibility programs. This assumption presumes that in some places and times, even small load reductions that keep load below the capacity of existing equipment avoid large incremental T&D investments, while in other places and times, relatively large load reductions may have little effect on T&D investments.13
Grid services provided: The value of demand flexibility depends on the type of grid services it provides and the cost of alternative resources that can provide the same services. For example, the value of load shedding or shifting services that reduce peak demand is determined by the cost of having to meet the peak through additional generation and any associated T&D upgrades. As another example, demand flexibility that provides voltage support by modulating loads typically competes with existing, rather than new, resources that provide such ancillary services. That means that demand flexibility for voltage support likely avoids only fuel and variable O&M costs.
Expected service life: With respect to persistence, DERs that provide demand flexibility can be grouped into two categories. Some types of DERs provide grid services that avoid or defer utility capital expenditures or ongoing fuel and O&M costs because impacts persist over many years. Other types of DERs may only reduce near-term expenditures and as a result are likely to have less value.
For example, some forms of demand flexibility, such as energy-efficient heating, ventilating, and air-conditioning (HVAC) equipment and lighting systems with integrated controls, permit load shedding or shifting to reduce both annual energy use and peak period consumption for 10-20 years or longer—while providing building occupants the same or improved level of service. Economic valuation of energy and capacity savings from these building technologies should recognize the fact that they reduce overall energy consumption and peak demand over the long-term, rather than just avoid near-term market purchases or fuel costs. Thus, their value stems from their ability to defer or reduce both near-term fuel costs and future capital expenditures for generation, distribution, and/or transmission capacity.14
In contrast, other forms of demand flexibility have shorter lifetimes or are operated in a way that grid services they provide can only be relied on to reduce the utility system’s near-term variable operation (primarily fuel) and maintenance costs. An energy-efficient building with demand flexibility can provide additional value to the grid by shedding, shifting, or modulating its load in response to grid conditions.15 Depending on the mechanism used to
12 A simple method used to calculate system-level T&D deferral value divides the forecast (or historical) increases in T&D investment (transmission and distribution are calculated separately) by the net T&D capacity gained to derive a $/kW cost for incremental T&D capacity. This value is then scaled by a utilization factor derived by dividing system peak capacity by the system energy carrying capacity to capture spending on demand upgrades rather than energy upgrades. 13 See Chapter 10, Synapse Energy Economics et al. 2018. 14 From a planning perspective, there is some risk that long-lived DERs providing demand flexibility could be less valuable than short-lived ones—for example, if market prices or capacity costs are lower in the future because less expensive technology becomes available. While this would reduce the economic value of demand flexibility, this same risk also applies to investments in conventional technologies that provide comparable grid services. 15 Grid-interactive efficient buildings also can provide grid services using distributed generation. The valuation of services distributed generation can provide follows the same principles and methodologies discussed in this report.
April 2020 www.seeaction.energy.gov 13
dispatch these grid services, the utility system may or may not avoid or defer capital investments in new generation, distribution, or transmission infrastructure.
For example, a program that secures long-term (5- to 10-year) contracts from participating buildings for load shedding or shifting to provide peaking capacity will be of greater value than a program that contracts year-to-year for provision of these same grid services. The program that secures longer-term contracts can be relied on to reduce not only near-term market purchases or fuel costs, but also may reduce or defer capital investments in new infrastructure. The EUL of grid services provided by different forms of demand flexibility should be recognized in the methods and assumptions used to establish their economic value to the utility system.
Avoided cost of the next least-expensive resource alternative: The economic value of grid services provided by DERs traditionally has been determined using the avoided cost of conventional resources that provide the identical utility system service. The underlying economic principle is that the value of a resource can be estimated using the cost of acquiring the next least-expensive alternative resource that provides comparable services. Therefore, the primary task for determining the value of demand flexibility to the electric utility system, based on avoided cost, is to identify the alternative resource and compare its cost.
Estimating the alternative resource costs of providing these grid services requires metrics about the grid services that buildings can provide such as their energy (kWh) savings, capacity (kW) savings, capability to provide voltage and frequency support, and reliability and resilience impacts. It also requires information on potential environmental impacts (e.g., air emissions) of DERs providing demand flexibility so these impacts can be compared to those of other resources for electricity generation and delivery. The next section of this report discusses the primary factors that produce variations across jurisdictions in the cost of acquiring the next least-expensive alternative resource that can provide comparable grid services—the avoided cost.
[T]he primary task for determining the value of demand flexibility to the
electric utility system, based on avoided cost, is to identify the alternative
resource and compare its cost.
April 2020 www.seeaction.energy.gov 14
3. Factors Impacting the Economic Value of Grid Services
As stated above, the value of a resource can be estimated using the cost of acquiring the next least-expensive alternative resource that provides comparable services (i.e., the avoided cost of that resource). This section provides an overview of how the determination of the resource value of grid services based on avoided cost differs across the country due to three factors: (1) electricity market structure; (2) available resource options and their costs; and (3) state energy policies and regulatory context.
Electricity Market Structure
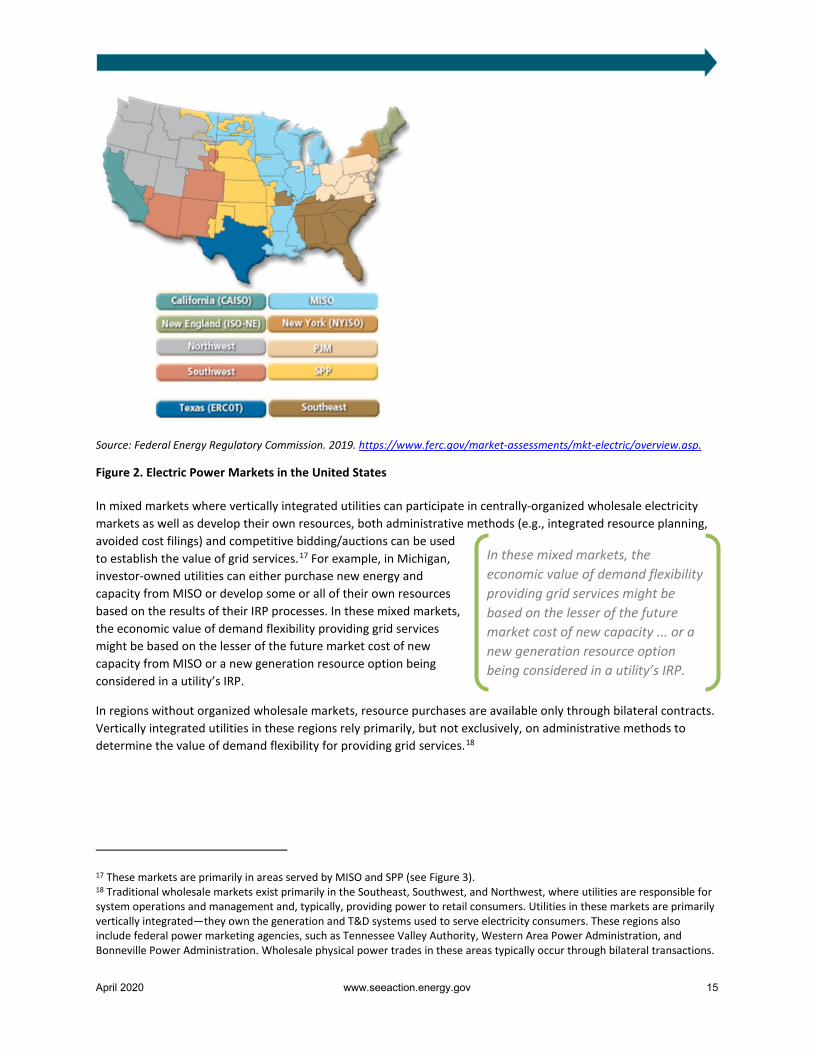
In centrally-organized wholesale electricity markets (sometimes referred to as “restructured markets”), Independent System Operators (ISOs) and Regional Transmission Organizations (RTOs) facilitate open access to the transmission system and foster competition among wholesale market participants (Figure 2). These ISOs and RTOs operate markets to determine which resources, including distributed generation and storage, energy efficiency, and demand response—where these resources are permitted to participate—will be dispatched (operated on the system) during each hour of the day.16
ISOs and RTOs rely on competitive bidding to establish the value of grid services (e.g., for day-ahead energy markets). PJM, New York ISO (NYISO), and ISO New England (ISO-NE) also operate forward capacity markets to establish prices for capacity services for future years (e.g., 3 years out); California ISO (CAISO), the Electric Reliability Council of Texas (ERCOT), the Midcontinent ISO (MISO), and the Southwest Power Pool (SPP) rely only on energy markets to establish prices for capacity services. While specific market rules differ, PJM, NYISO, and ISO-NE secure capacity using annual auctions where entities can bid in both generation and, in the case of PJM and ISO-NE, demand-side options to supply forecasted capacity needs. In PJM and ISO-NE, the value of demand flexibility that provides peaking capacity will be established by the market clearing prices of the most expensive resources (whether demand side or supply side) selected in an auction. In contrast, ERCOT uses energy-only market price mechanisms for development of new resources. That is, it lets the wholesale energy market price fluctuate freely to reflect the supply and demand balance during all hours of the year. High market prices that can occur during periods of peak demand or periods of constrained supply serve to incent development of new resources.
16 ISOs and RTOs operate the transmission system independently of, and foster competition for, electricity generation among wholesale market participants. Each of the regional grid operators operate bid-based energy and ancillary services markets to determine economic dispatch. Two-thirds of the nation’s electricity load is in ISO or RTO regions.
In PJM and ISO-NE, the value of demand flexibility that provides
peaking capacity will be established by the market clearing prices of the most expensive resources (whether
demand side or supply side) selected in an auction.
April 2020 www.seeaction.energy.gov 15
Source: Federal Energy Regulatory Commission. 2019. https://www.ferc.gov/market-assessments/mkt-electric/overview.asp.
Figure 2. Electric Power Markets in the United States
In mixed markets where vertically integrated utilities can participate in centrally-organized wholesale electricity markets as well as develop their own resources, both administrative methods (e.g., integrated resource planning, avoided cost filings) and competitive bidding/auctions can be used to establish the value of grid services.17 For example, in Michigan, investor-owned utilities can either purchase new energy and capacity from MISO or develop some or all of their own resources based on the results of their IRP processes. In these mixed markets, the economic value of demand flexibility providing grid services might be based on the lesser of the future market cost of new capacity from MISO or a new generation resource option being considered in a utility’s IRP.
In regions without organized wholesale markets, resource purchases are available only through bilateral contracts. Vertically integrated utilities in these regions rely primarily, but not exclusively, on administrative methods to determine the value of demand flexibility for providing grid services.18
17 These markets are primarily in areas served by MISO and SPP (see Figure 3). 18 Traditional wholesale markets exist primarily in the Southeast, Southwest, and Northwest, where utilities are responsible for system operations and management and, typically, providing power to retail consumers. Utilities in these markets are primarily vertically integrated—they own the generation and T&D systems used to serve electricity consumers. These regions also include federal power marketing agencies, such as Tennessee Valley Authority, Western Area Power Administration, and Bonneville Power Administration. Wholesale physical power trades in these areas typically occur through bilateral transactions.
In these mixed markets, the economic value of demand flexibility providing grid services might be based on the lesser of the future market cost of new capacity ... or a new generation resource option being considered in a utility’s IRP.
April 2020 www.seeaction.energy.gov 16
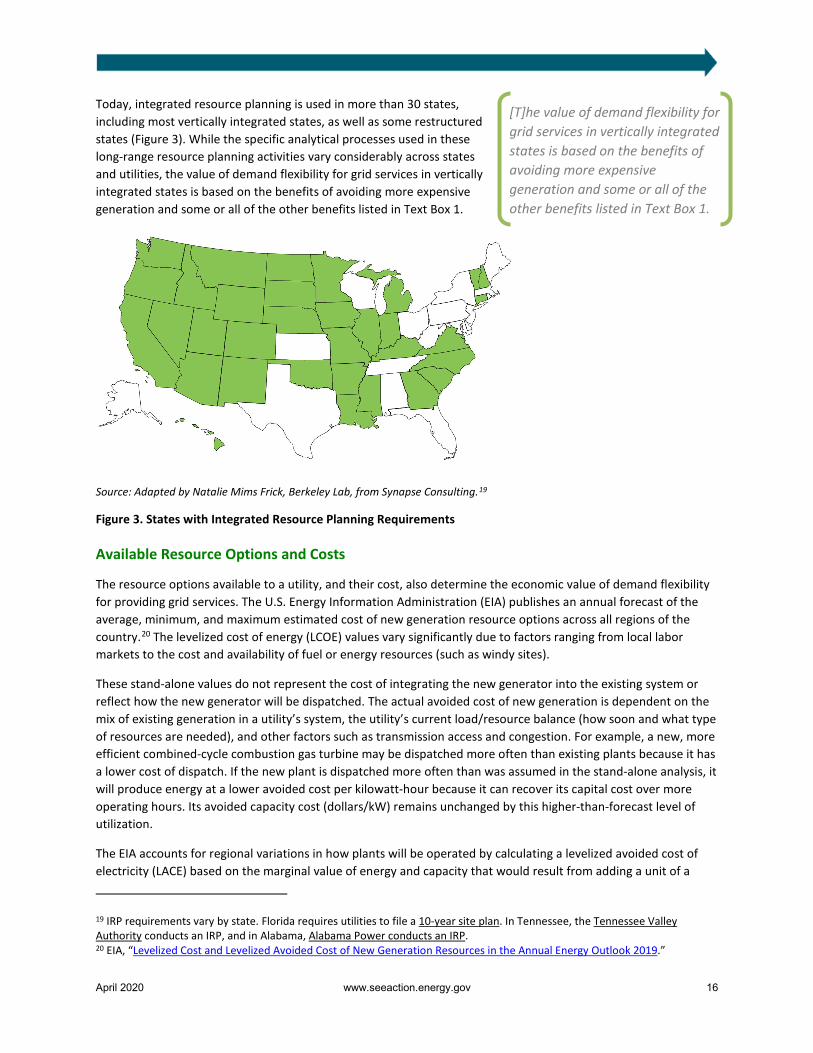
Today, integrated resource planning is used in more than 30 states, including most vertically integrated states, as well as some restructured states (Figure 3). While the specific analytical processes used in these long-range resource planning activities vary considerably across states and utilities, the value of demand flexibility for grid services in vertically integrated states is based on the benefits of avoiding more expensive generation and some or all of the other benefits listed in Text Box 1.
Source: Adapted by Natalie Mims Frick, Berkeley Lab, from Synapse Consulting.19
Figure 3. States with Integrated Resource Planning Requirements
Available Resource Options and Costs
The resource options available to a utility, and their cost, also determine the economic value of demand flexibility for providing grid services. The U.S. Energy Information Administration (EIA) publishes an annual forecast of the average, minimum, and maximum estimated cost of new generation resource options across all regions of the country.20 The levelized cost of energy (LCOE) values vary significantly due to factors ranging from local labor markets to the cost and availability of fuel or energy resources (such as windy sites).
These stand-alone values do not represent the cost of integrating the new generator into the existing system or reflect how the new generator will be dispatched. The actual avoided cost of new generation is dependent on the mix of existing generation in a utility’s system, the utility’s current load/resource balance (how soon and what type of resources are needed), and other factors such as transmission access and congestion. For example, a new, more efficient combined-cycle combustion gas turbine may be dispatched more often than existing plants because it has a lower cost of dispatch. If the new plant is dispatched more often than was assumed in the stand-alone analysis, it will produce energy at a lower avoided cost per kilowatt-hour because it can recover its capital cost over more operating hours. Its avoided capacity cost (dollars/kW) remains unchanged by this higher-than-forecast level of utilization.
The EIA accounts for regional variations in how plants will be operated by calculating a levelized avoided cost of electricity (LACE) based on the marginal value of energy and capacity that would result from adding a unit of a
19 IRP requirements vary by state. Florida requires utilities to file a 10-year site plan. In Tennessee, the Tennessee Valley Authority conducts an IRP, and in Alabama, Alabama Power conducts an IRP. 20 EIA, “Levelized Cost and Levelized Avoided Cost of New Generation Resources in the Annual Energy Outlook 2019.”
[T]he value of demand flexibility for grid services in vertically integrated states is based on the benefits of avoiding more expensive generation and some or all of the other benefits listed in Text Box 1.

April 2020 www.seeaction.energy.gov 17
given technology to the system as it exists, or is projected to exist, at a specific future date. LACE accounts for both variation in daily and seasonal electricity demand in the region where a new project is under consideration and characteristics of the existing generation fleet to which new capacity will be added. As a result, this analytical approach directly compares the prospective new generation resource against the mix of new and existing generation and capacity that it would displace. Using this metric still produces significant variations in avoided cost for the same technology across the country. As will be discussed in Section 4 in this report, the use of LACE values is preferable to using the stand-alone LCOE to determine the economic value of demand flexibility.
State Energy Policies and Regulatory Context
State energy policies and public utility commission requirements significantly influence determination of the avoided cost or value of energy efficiency, demand response, and other DERs. Commission orders typically establish costs and benefits to be included in a utility’s (or third-party program administrator’s) cost-effectiveness tests and may prescribe a specific methodology for determining avoided cost. State policies directly or indirectly influence which of the utility system benefits of DERs listed in Text Box 1 to include in determinations of their economic value.21
State resource standards also directly impact avoided costs. Twenty-seven states are currently implementing long-term (3+ years) binding energy savings targets,22 and 29 states, the District of Columbia, and 3 territories have adopted RPS.23 These standards typically mandate a minimum level of development of these resources. Such mandates can alter the avoided cost of new resources. For example, wind resource development to satisfy a state RPS might lower the avoided cost of energy (kWh), but have little impact on the avoided cost of new peaking capacity (kW), which depends on both the existing capacity mix and load characteristics in a region.24 In contrast, utility development of energy efficiency to satisfy a state’s energy efficiency resource standard might reduce the near-term need for new generation or transmission peaking capacity.25
State planning requirements for generation and T&D investments also may alter the avoided cost. As noted previously, more than 30 states require some form of integrated resource planning. In addition, a growing number of states have distribution system planning requirements.26 Typically, these planning requirements are intended to
21 The National Efficiency Screening Project and EPRI both recommend that cost-effectiveness tests include at a minimum all substantive and reasonably quantifiable generation and T&D impacts for utility systems. Woolf et al. 2017 and EPRI 2015. The National Efficiency Screening Project maintains a Database of State Efficiency Screening Practices that provides information on state cost-effectiveness screening practices for electric efficiency programs funded by utility customers, including a summary of utility system costs and benefits included in each state’s primary cost-effectiveness test. https://nationalefficiencyscreening.org/state-database-dsesp/. Also see Sutter et al. forthcoming. 22 https://aceee.org/sites/default/files/state-eers-0519.pdf. Definitions for binding energy efficiency standards vary (see Goldman et al. 2018, The Future of U.S. Electricity Efficiency Programs Funded by Utility Customers: Program Spending and Savings Projections to 2030). 23 https://www.ncsl.org/research/energy/renewable-portfolio-standards.aspx. 24 Because load must be continuously balanced, dispatchable generating units with the capability to vary output to follow demand (including dispatchable demand flexibility technologies) generally have more value to a system than less flexible units (non-dispatchable technologies), such as wind plants and DERs that are not equipped with such controls. 25 SEE Action Network. 2015. State Approaches to Demand Reduction Induced Price Effects: Examining How Energy Efficiency Can Lower Prices for All. 26 Homer et al. 2017; Cooke et al. 2018; Schwartz 2020.
State policies directly or indirectly influence which of the utility system benefits of
DERs … to include in determinations of their
economic value.

April 2020 www.seeaction.energy.gov 18
result in lower utility system cost, provide equivalent or improved reliability, and potentially lower the economic risk of utility system development. Requirements generally include systematic comparison of conventional generation and T&D solutions with DER options.
In addition, state and local air pollution regulations can impact the type or location of new generation facilities that can be developed, affecting the avoided cost of those facilities. For example, limitations on nitrogen oxide emissions can limit the location where development of natural gas-fired combustion turbines is permitted. This may result in higher electric transmission costs or even higher natural gas commodity costs due to natural gas pipeline access. Several states have established regulations on greenhouse gas emissions. For example, states participating in the Regional Greenhouse Gas Initiative27 require electricity generators to secure allowances for carbon dioxide emissions via auction or trade, adding to the cost of fossil-fuel generating resources. These regulations and siting requirements effectively internalize (i.e., include in utility revenue requirements) costs that were previously imposed only on society (i.e., externalized).
27 https://www.rggi.org/.

April 2020 www.seeaction.energy.gov 19
4. Common Methods for Determining Economic Value of DERs That Can Provide Demand Flexibility for Grid Services
To account for differences in electricity market structure, variations in available resource options and their costs, and state energy policies and regulatory context, current methods and practices used to define and derive the economic value of DERs that can provide demand flexibility vary widely. In addition, some states provide detailed guidance regarding specific types of analyses required. As a result, some jurisdictions use market-based valuation, while others use resource planning processes; some use time-sensitive valuation, while others do not; some include the value of avoided T&D, while others do not. Discussed below are the most commonly used general approaches, with examples:28
• System capacity expansion and market models
• Competitive bidding processes/auctions
• Proxy resources
• Administrative/public policy determinations
• Special studies.
While these methods can be used to estimate the economic value of demand flexibility for grid services, many approaches—and their application—would benefit from the specific enhancements described in Section 5 of this report.
To assess whether demand flexibility in grid-interactive efficient buildings can provide grid services cost-effectively, compared with traditional bulk power system and distribution system solutions, the incremental cost of the building technology or measure, plus the cost of electric utility infrastructure (e.g., communications and back office systems, Supervisory Control and Data Acquisition, advanced metering infrastructure or other utility metering, switch gear) necessary to implement and operate it—and any other cost imposed on the utility system necessary to integrate the measure or technology (e.g., changes in feeder or substation configuration)—must be known. These costs are specific to the measure, technology, building, and utility and are likely to change with widespread adoption of grid-interactive efficient buildings. Cost-effectiveness calculations should pair local and contemporary cost estimates with the value of the electric grid benefits derived through the methods described in this report.
System Capacity Expansion Market/Models
The most comprehensive and complex method for determining the value of DERs that can provide demand flexibility relies on system capacity expansion models. Utilities and other entities use generation, transmission, and distribution capacity expansion models to evaluate the reliability, cost, and sometimes risk of alternative system expansion plans (Text Box 3). These models are primarily used to estimate the value of energy, capacity, ancillary services, and T&D capacity deferrals. The models also can estimate the value of Demand Reduction-Induced Price Effects (DRIPE),29 avoided RPS compliance costs, and avoided environmental compliance costs.
28 For a more extensive treatment of current methods used to quantify utility system benefits (as well as other non-energy benefits) of energy efficiency, see Lazar, J., and Colburn, K. 2013. Recognizing the Full Value of Energy Efficiency - What’s Under the Feel-Good Frosting of the World’s Most Valuable Layer Cake of Benefits. Regulatory Assistance Project. 29 DRIPE is a measurement of the value of demand reductions in terms of the decrease in wholesale energy prices, resulting in lower total expenditures on electricity or natural gas in a grid system. SEE Action Network. 2015. State Approaches to Demand Reduction Induced Price Effects: Examining How Energy Efficiency Can Lower Prices for All.
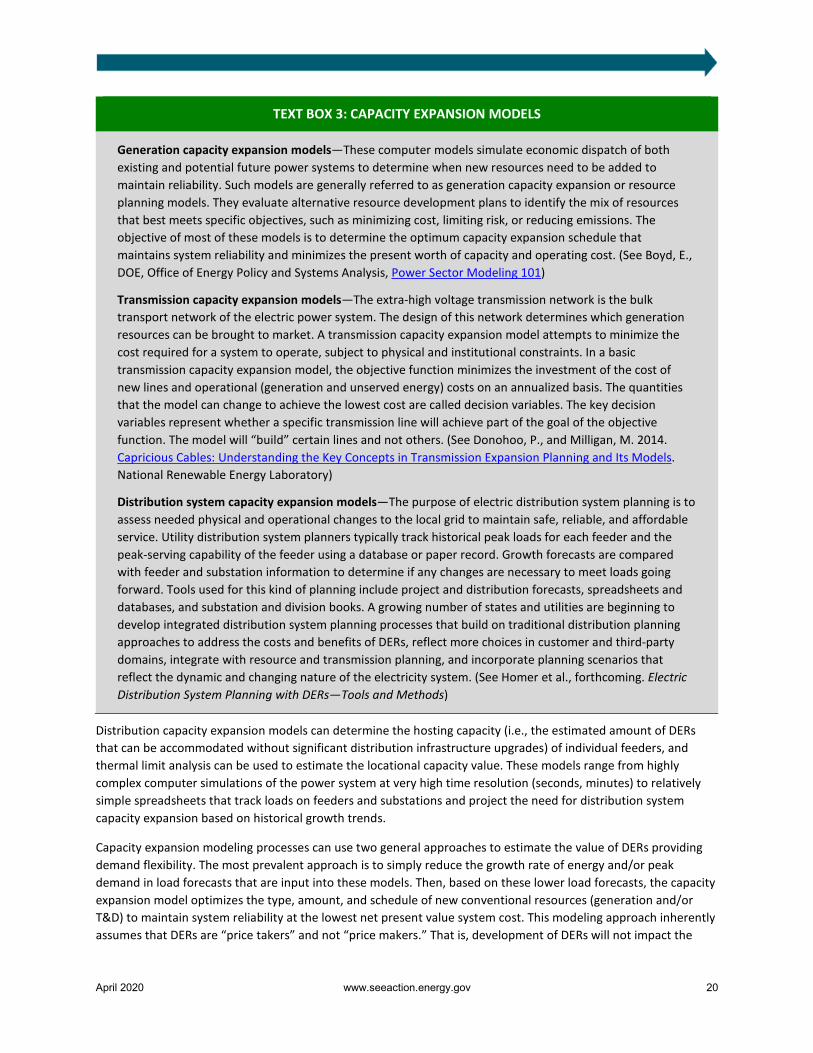
April 2020 www.seeaction.energy.gov 20
Distribution capacity expansion models can determine the hosting capacity (i.e., the estimated amount of DERs that can be accommodated without significant distribution infrastructure upgrades) of individual feeders, and thermal limit analysis can be used to estimate the locational capacity value. These models range from highly complex computer simulations of the power system at very high time resolution (seconds, minutes) to relatively simple spreadsheets that track loads on feeders and substations and project the need for distribution system capacity expansion based on historical growth trends.
Capacity expansion modeling processes can use two general approaches to estimate the value of DERs providing demand flexibility. The most prevalent approach is to simply reduce the growth rate of energy and/or peak demand in load forecasts that are input into these models. Then, based on these lower load forecasts, the capacity expansion model optimizes the type, amount, and schedule of new conventional resources (generation and/or T&D) to maintain system reliability at the lowest net present value system cost. This modeling approach inherently assumes that DERs are “price takers” and not “price makers.” That is, development of DERs will not impact the
TEXT BOX 3: CAPACITY EXPANSION MODELS
Generation capacity expansion models—These computer models simulate economic dispatch of both existing and potential future power systems to determine when new resources need to be added to maintain reliability. Such models are generally referred to as generation capacity expansion or resource planning models. They evaluate alternative resource development plans to identify the mix of resources that best meets specific objectives, such as minimizing cost, limiting risk, or reducing emissions. The objective of most of these models is to determine the optimum capacity expansion schedule that maintains system reliability and minimizes the present worth of capacity and operating cost. (See Boyd, E., DOE, Office of Energy Policy and Systems Analysis, Power Sector Modeling 101)
Transmission capacity expansion models—The extra-high voltage transmission network is the bulk transport network of the electric power system. The design of this network determines which generation resources can be brought to market. A transmission capacity expansion model attempts to minimize the cost required for a system to operate, subject to physical and institutional constraints. In a basic transmission capacity expansion model, the objective function minimizes the investment of the cost of new lines and operational (generation and unserved energy) costs on an annualized basis. The quantities that the model can change to achieve the lowest cost are called decision variables. The key decision variables represent whether a specific transmission line will achieve part of the goal of the objective function. The model will “build” certain lines and not others. (See Donohoo, P., and Milligan, M. 2014. Capricious Cables: Understanding the Key Concepts in Transmission Expansion Planning and Its Models. National Renewable Energy Laboratory)
Distribution system capacity expansion models—The purpose of electric distribution system planning is to assess needed physical and operational changes to the local grid to maintain safe, reliable, and affordable service. Utility distribution system planners typically track historical peak loads for each feeder and the peak-serving capability of the feeder using a database or paper record. Growth forecasts are compared with feeder and substation information to determine if any changes are necessary to meet loads going forward. Tools used for this kind of planning include project and distribution forecasts, spreadsheets and databases, and substation and division books. A growing number of states and utilities are beginning to develop integrated distribution system planning processes that build on traditional distribution planning approaches to address the costs and benefits of DERs, reflect more choices in customer and third-party domains, integrate with resource and transmission planning, and incorporate planning scenarios that reflect the dynamic and changing nature of the electricity system. (See Homer et al., forthcoming. Electric Distribution System Planning with DERs—Tools and Methods)
April 2020 www.seeaction.energy.gov 21
type, amount, and schedule of conventional resource development to an extent that alters the avoided cost of the utility system being modeled.
A variation on this approach was employed in the 2018 study on Avoided Energy Supply Components (AESC) in New England.30 It provides estimates of avoided costs associated with energy efficiency measures for utilities and third-party program administrators in New England states for internal decision-making and regulatory filings. To determine the value of energy efficiency (and other demand-side measures), avoided costs are calculated and provided for each New England state in a hypothetical future in which no new energy efficiency measures are installed in 2018 or later years. Recognizing the limitations of this approach, the study authors note that because the reference case represents a theoretical future in which no new energy efficiency measures are put into place, the study should not be used to infer information about actual future market conditions, energy prices, or resource builds in the region.
The alternative approach, which is less prevalent, is to treat DERs as resource options directly in the capacity expansion modeling process. This approach allows DERs to compete directly with conventional resources in the model to determine their impact on system load growth and load shape and thus the type, amount, and timing of conventional resource development. In contrast to the more prevalent approach of decrementing the load forecast, this approach tests whether development of DERs will alter the avoided cost of the utility system being modeled. That is, the process accounts for interactions between DERs and the utility system in which they would be installed.31 This is the approach used by both PacifiCorp in its 2017 IRP32 and the Northwest Power and Conservation Council (NWPCC)33 in all of its plans, including the most recent, Seventh Power Plan,34 to determine the value and cost-effectiveness of energy efficiency and demand response resources. NV Energy, using a commercially available distribution system planning model, also used this method to quantify the value of non-wires solutions in its 2019 Distributed Resource Plan.35 Appendix A describes these example uses of capacity expansion models in more detail.
Competitive Bidding/Auctions
This approach uses the market to determine the economic value of new and existing resources. It is used both by centrally organized markets and vertically integrated utilities. For example, ISO-NE and PJM allow demand response to bid into their forward capacity, energy, and ancillary services (operating reserves and regulation services) markets. Other types of DERs also can participate in their forward capacity markets.
In addition, energy and capacity markets can be used to estimate the economic value of transmission system capacity deferrals. For example, the NYISO captures the economic value of deferring transmission system capacity based on the cost of relieving congestion in a locale by calculating marginal congestion prices.36 That price reflects the difference between the marginal cost of energy at the maximum limit of the transmission line for that location and the marginal cost of the next unit of energy demanded (from the next available generator in the load schedule).
30 Woolf et al. 2018. Study sponsors—electric and gas utilities and other efficiency program administrators—and other parties (including representatives of state governments, utility consumer representatives, and other stakeholders) formed a study group to oversee design and production of the analysis and report. 31 See Frick et al. 2018 for a more detailed discussion. 32 https://www.pacificorp.com/energy/integrated-resource-plan.html. 33 https://www.nwcouncil.org/reports/seventh-power-plan. 34 https://www.nwcouncil.org/reports/seventh-power-plan. 35 http://pucweb1.state.nv.us/PDF/AxImages/DOCKETS_2015_THRU_PRESENT/2019-4/37375.pdf. 36 Transmission upgrades historically have been driven primarily by reliability, not by potential economic benefits of reduced congestion.
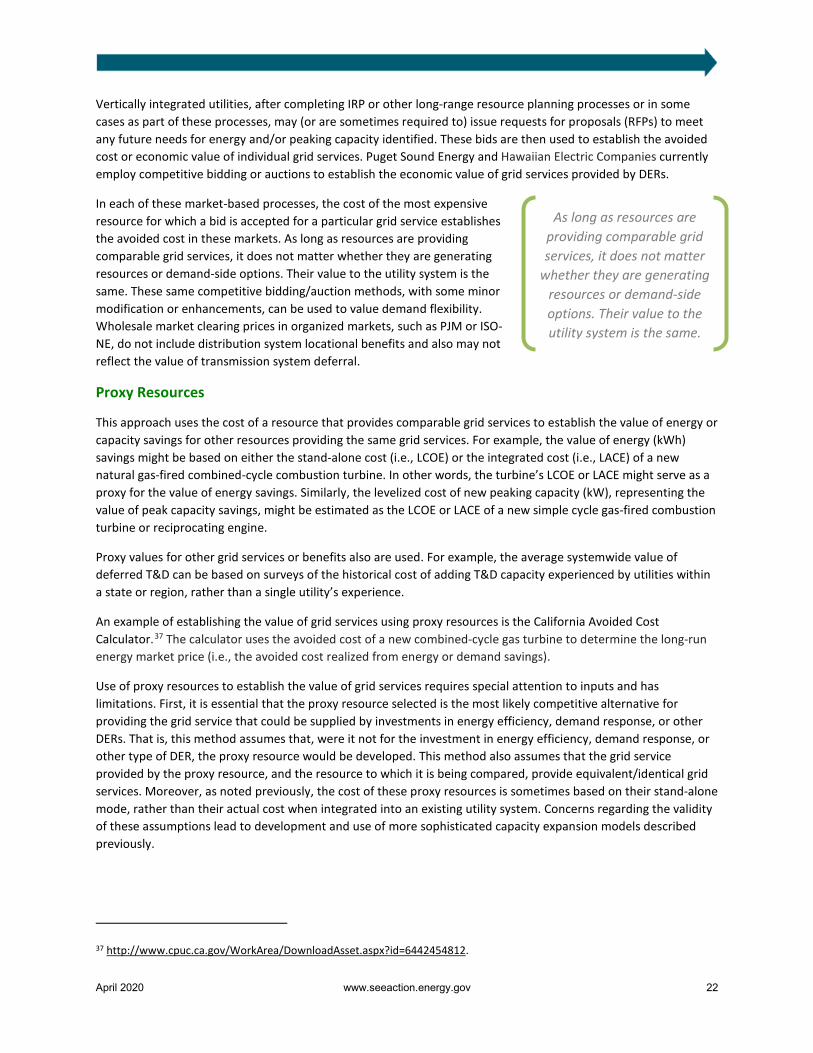
April 2020 www.seeaction.energy.gov 22
Vertically integrated utilities, after completing IRP or other long-range resource planning processes or in some cases as part of these processes, may (or are sometimes required to) issue requests for proposals (RFPs) to meet any future needs for energy and/or peaking capacity identified. These bids are then used to establish the avoided cost or economic value of individual grid services. Puget Sound Energy and Hawaiian Electric Companies currently employ competitive bidding or auctions to establish the economic value of grid services provided by DERs.
In each of these market-based processes, the cost of the most expensive resource for which a bid is accepted for a particular grid service establishes the avoided cost in these markets. As long as resources are providing comparable grid services, it does not matter whether they are generating resources or demand-side options. Their value to the utility system is the same. These same competitive bidding/auction methods, with some minor modification or enhancements, can be used to value demand flexibility. Wholesale market clearing prices in organized markets, such as PJM or ISO-NE, do not include distribution system locational benefits and also may not reflect the value of transmission system deferral.
Proxy Resources
This approach uses the cost of a resource that provides comparable grid services to establish the value of energy or capacity savings for other resources providing the same grid services. For example, the value of energy (kWh) savings might be based on either the stand-alone cost (i.e., LCOE) or the integrated cost (i.e., LACE) of a new natural gas-fired combined-cycle combustion turbine. In other words, the turbine’s LCOE or LACE might serve as a proxy for the value of energy savings. Similarly, the levelized cost of new peaking capacity (kW), representing the value of peak capacity savings, might be estimated as the LCOE or LACE of a new simple cycle gas-fired combustion turbine or reciprocating engine.
Proxy values for other grid services or benefits also are used. For example, the average systemwide value of deferred T&D can be based on surveys of the historical cost of adding T&D capacity experienced by utilities within a state or region, rather than a single utility’s experience.
An example of establishing the value of grid services using proxy resources is the California Avoided Cost Calculator.37 The calculator uses the avoided cost of a new combined-cycle gas turbine to determine the long-run energy market price (i.e., the avoided cost realized from energy or demand savings).
Use of proxy resources to establish the value of grid services requires special attention to inputs and has limitations. First, it is essential that the proxy resource selected is the most likely competitive alternative for providing the grid service that could be supplied by investments in energy efficiency, demand response, or other DERs. That is, this method assumes that, were it not for the investment in energy efficiency, demand response, or other type of DER, the proxy resource would be developed. This method also assumes that the grid service provided by the proxy resource, and the resource to which it is being compared, provide equivalent/identical grid services. Moreover, as noted previously, the cost of these proxy resources is sometimes based on their stand-alone mode, rather than their actual cost when integrated into an existing utility system. Concerns regarding the validity of these assumptions lead to development and use of more sophisticated capacity expansion models described previously.
37 http://www.cpuc.ca.gov/WorkArea/DownloadAsset.aspx?id=6442454812.
As long as resources are providing comparable grid services, it does not matter
whether they are generating resources or demand-side options. Their value to the utility system is the same.
April 2020 www.seeaction.energy.gov 23
Administrative/Public Policy Determinations
Jurisdictions may decide to simplify compliance with a preferred policy direction by determining administratively the value of some of the benefits listed in Text Box 1. Such methods have been used to estimate the value of benefits that have proven difficult (or expensive) to quantify analytically. The approach relies on state regulatory or legislative action to establish the value of these benefits. While there may be some analytical basis for the values selected, policy or regulatory considerations largely drive the final determination. The following examples illustrate the valuation process for two grid benefits from energy efficiency and demand response that have proven difficult to quantify: reducing risk and reducing emissions.
The Vermont Public Utilities Commission38 is in charge of approving avoided costs used to value demand-side energy services (including externality adjustments) for the energy efficiency utilities that provide those services in the state. In 1990, it approved (and renewed in 2015) a 10% risk adjustment applied as a discount to the cost of non-fuel-switching demand-side measures for state cost-effectiveness measure screening39 to account for avoided supply-side risks.40
The California Air Resources Board (CARB) is responsible for administering the state’s cap and trade program to meet legislative mandates for greenhouse gas emissions. CARB sets limits administratively, creating a market that establishes a price (i.e., value) on carbon dioxide by capping the number of available allowances.41 Thus, this approach combines both administrative and market mechanisms to establish the economic value of reduced emissions.
Special Studies
Quantification and monetization of some utility system benefits from demand flexibility may be best captured through specifically targeted research and analysis. For example, developing estimates of the benefits of energy efficiency to reduce future environmental damage costs might require analysis of environmental regulations and health impacts data. This is the approach adopted by Minnesota’s value of solar methodology, which estimates the value provided by DERs in avoiding environmental costs42 using state and U.S. Environmental Protection Agency (EPA) externality costs. Similarly, Consolidated Edison’s Benefit Cost Analysis Handbook provides a methodology for calculating the value of avoiding environmental damage costs from customer-sited generation units under 25 MW that do not participate in the Regional Greenhouse Gas Initiative’s cap and trade program.43 Both approaches could be applied to internalize (i.e., include in utility revenue requirements) the value of reducing environmental damage or health costs if required by state policy or regulation.
38 Formerly Vermont Public Service Board. 39 The Vermont Public Service Board also established a 15% non-energy benefits adder to the utility system benefits of energy efficiency in cost-effectiveness assessments to account for hard-to-quantify benefits that factor into participant decision-making, and an additional 15% adder for low-income benefits (Vermont Public Service Board Order No. 5270, 1990). 40 https://puc.vermont.gov/sites/psbnew/files/doc_library/order-re-eeu-avoided-cost-2016-2017.pdf. 41 https://www.arb.ca.gov/cc/capandtrade/capandtrade.htm. 42 http://mn.gov/commerce-stat/pdfs/vos-methodology.pdf. 43 https://www.coned.com/-/media/files/coned/documents/our-energy-future/our-energy-projects/coned-bcah.pdf?la=en
April 2020 www.seeaction.energy.gov 24
Another type of special study is valuing avoided or deferred T&D upgrades through non-wires solutions. Because such studies are location- and project-dependent, they typically require targeted analysis.44
Recent natural disasters and cyber incursions have demonstrated that planning for long-duration power interruptions caused by high-impact, low-probability events requires new approaches to increasing power system resilience. Although DERs offer resilience benefits, determining the value of those benefits is a relatively new endeavor, and methodologies are still under development. There are a number of approaches to valuing avoided power interruptions, currently the standard proxy for quantifying energy resilience.
A recent report prepared for the National Association of Regulatory Utility Commissioners focuses on current approaches to valuing resilience for DERs and usefulness of these methods to regulators.45 The report identifies two broad categories of analysis: economy-wide and bottom-up. Each category encompasses a variety of data collection approaches (e.g., stated preference versus revealed preference approaches) and quantitative tools (e.g., Interruption Cost Estimator (ICE) Calculator, Federal Emergency Management Agency (FEMA) BCA and IMPLAN). Four case studies correspond to four methods that have been used to analyze the resilience value of DERs: contingent valuation, defensive behavior method, damage cost method, and input-output modeling. The four criteria used in the evaluation are the method’s ease of use, scope of outputs, geographic scalability, and power interruption duration analysis capability. The authors conclude that, while some of the valuation methodologies they examined may be useful in regulatory decision-making, none met all four criteria for regulator usefulness and usability. That is, no single method is capable of capturing all regulatory concerns regarding the resilience value of DERs.
Berkeley Lab and Nexant, Inc., developed the ICE Calculator to help utilities, regulators, and other stakeholders value the benefits from investments in power system reliability.46 Many utilities use the ICE Calculator and reference it in regulatory proceedings. For example, Dominion Energy in Virginia used it to monetize benefits to their customers resulting from improved grid reliability.47 Pepco (Maryland) used the ICE Calculator to monetize resilience benefits of proposed microgrids in Largo and Rockville.48 Oklahoma Gas and Electric used the ICE Calculator as part of an assessment of grid modernization plans in Arkansas.49
The ICE Calculator is a useful tool to estimate short-duration power interruption costs—or the avoided interruption costs from investments in reliability. The tool is based on customer interruption cost survey data that focused on power interruption scenarios lasting 16 hours or less and is limited to the direct costs to customers. For these reasons, Berkeley Lab and other researchers do not recommend using the ICE Calculator to value the avoided direct and indirect economic impacts of longer duration power disruptions (i.e., resilience events).50
44 Northeast Energy Efficiency Partnerships. 2015. Energy Efficiency as a T&D Resource: Lessons from Recent U.S. Efforts to Use Geographically Targeted Efficiency Programs to Defer T&D Investments. 45 Rickerson et al. 2019. 46 For more on the ICE Calculator, see https://icecalculator.com/home and https://emp.lbl.gov/projects/economic-value-reliability-consumers; for more on utility applications of value-based reliability planning, see https://emp.lbl.gov/projects/utility-applications-value-based. 47 https://www.dominionenergy.com/library/domcom/media/about-us/electric-projects/grid-transformation/gtsa-072418.pdf. 48 The Maryland Public Service Commission ultimately decided that it could not quantify the value of resilience. See https://pubs.naruc.org/pub/531AD059-9CC0-BAF6-127B-99BCB5F02198. 49 http://www.apscservices.info/pdf/18/18-046-FR_34_1.pdf. 50 See https://pubs.naruc.org/pub/531AD059-9CC0-BAF6-127B-99BCB5F02198. Also see Larsen, P., A. Sanstad, K. LaCommare and J. Eto (eds.). 2019. Frontiers in the Economics of Widespread, Long-Duration Power Interruptions: Proceedings from an Expert Workshop. https://emp.lbl.gov/publications/frontiers-economics-widespread-long.
April 2020 www.seeaction.energy.gov 25
5. Enhanced Valuation Methods to Capture the Value of Demand Flexibility in Grid-Interactive Efficient Buildings
For broader recognition and support of potential economic benefits of demand flexibility in grid-interactive efficient buildings, modifications to current valuation methods and practices (discussed in Section 4) can be used to avoid under or overestimating its value for grid services. Economic valuation of demand flexibility for grid services need not differ materially from these five methods. At the same time, application of these approaches, particularly for planning purposes, likely will require additional data (Text Box 4) and improved analytical capabilities. This section discusses how current economic valuation methods could be enhanced to address seven limitations in those methods and practices.51 References to more detailed descriptions of methodologies, guidance documents, and examples document their application and provide sources for additional information (also see Appendix B).
Overview of Enhanced Planning and Analysis
The economic value of demand flexibility for grid services should be established by addressing the five factors discussed above52 in major planning and analytical processes for: (1) Distribution Planning and Analysis; (2) Bulk Power System Planning and Analysis; and (3) Risk and Reliability Analysis. An overview of enhancements to the five factors that can be applied to these planning processes follows and is summarized in Figure 4. Table 2 shows the
51 State policies and regulations may require specific analyses. Jurisdictions also may need to apply ISO/RTO criteria related to market design and cost-effectiveness. 52 The timing of the impact (temporal load profile), the location in the interconnected grid, the grid services provided, the expected service life (persistence) of the impact, and the avoided cost of the least-expensive resource alternative that provides comparable grid service.
TEXT BOX 4: DATA REQUIREMENTS FOR VALUATION OF GRID SERVICES
Enhanced methods and analytical practices for valuation of demand flexibility in grid-interactive efficient buildings likely will require utility-specific data to accurately estimate the value they can provide to the utility system:
• Hourly (subhourly) DER load or energy savings profiles • Load growth projections by feeder • System capacity planning studies—from distribution transformer to bulk system subtransmission • Existing and projected distributed generation deployment and production by location • Marginal line loss studies • System reliability studies (including voltages, protection, and phase balancing) • Systemwide and location-specific cost information, including for potential T&D upgrades • Systemwide and location-specific peak demand growth rates • Marginal cost-of-service studies at hourly (or subhourly) timescale.
Source: Adapted from Pacific Northwest National Laboratory. 2018. Illinois Distributed Generation Rebate – Preliminary Stakeholder Input and Calculation Considerations.
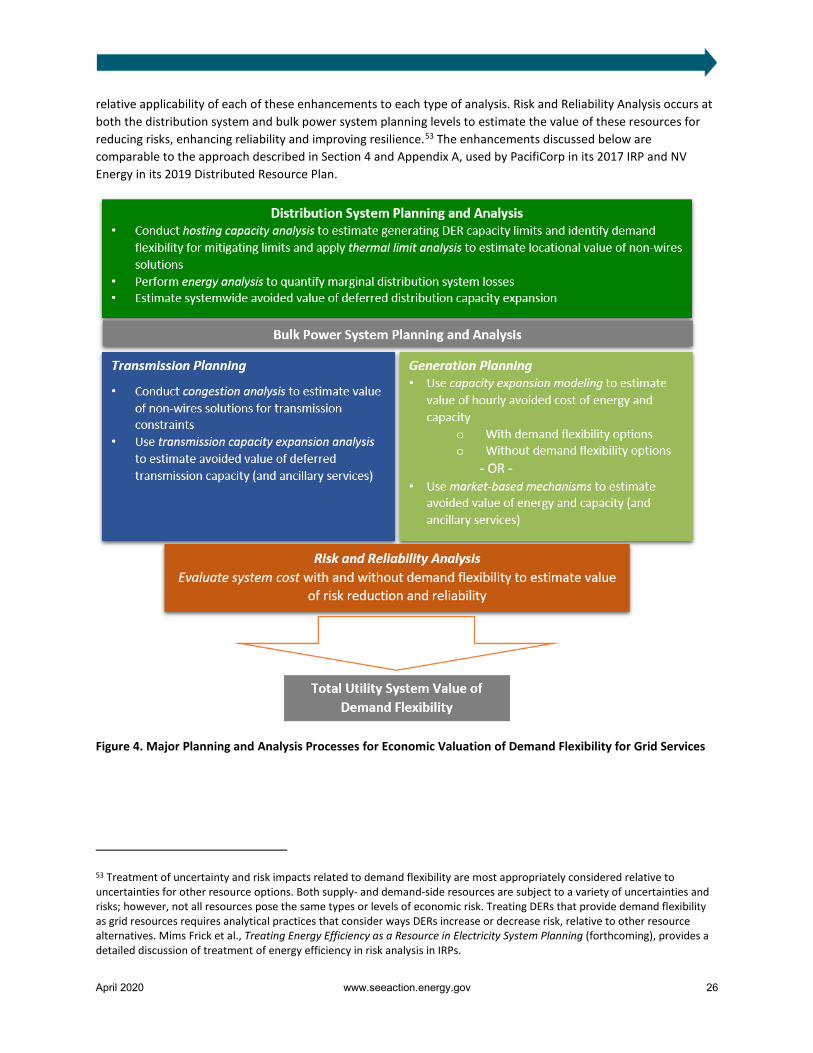
April 2020 www.seeaction.energy.gov 26
relative applicability of each of these enhancements to each type of analysis. Risk and Reliability Analysis occurs at both the distribution system and bulk power system planning levels to estimate the value of these resources for reducing risks, enhancing reliability and improving resilience.53 The enhancements discussed below are comparable to the approach described in Section 4 and Appendix A, used by PacifiCorp in its 2017 IRP and NV Energy in its 2019 Distributed Resource Plan.
Figure 4. Major Planning and Analysis Processes for Economic Valuation of Demand Flexibility for Grid Services
53 Treatment of uncertainty and risk impacts related to demand flexibility are most appropriately considered relative to uncertainties for other resource options. Both supply- and demand-side resources are subject to a variety of uncertainties and risks; however, not all resources pose the same types or levels of economic risk. Treating DERs that provide demand flexibility as grid resources requires analytical practices that consider ways DERs increase or decrease risk, relative to other resource alternatives. Mims Frick et al., Treating Energy Efficiency as a Resource in Electricity System Planning (forthcoming), provides a detailed discussion of treatment of energy efficiency in risk analysis in IRPs.

April 2020 www.seeaction.energy.gov 27
Distribution System Planning and Analysis
The enhanced valuation of utility system economic impacts for demand flexibility starts with Distribution System Planning and Analysis. This is where utilities estimate the value of avoided or deferred distribution capacity (i.e., demand flexibility’s locational value) and the magnitude of marginal energy losses that could be avoided by deployment of demand flexibility. Four new or expanded analyses can be used in distribution system planning to better capture the value of demand flexibility:
1. Conduct hosting capacity analysis to determine the maximum amount of generating DERs that can be interconnected at a specific point in the distribution system without adversely impacting power quality or reliability under existing control and protection systems and without additional upgrades. The results of this analysis serve as inputs into resource potential assessments used in capacity expansion modeling of the bulk power system.54
2. Perform energy analysis to quantify the magnitude of marginal distribution system losses. The results of this analysis are used to adjust building-level energy and capacity impacts on generation and transmission systems from demand flexibility provided by DERs.
3. Conduct thermal capacity (limit) analysis to identify potential locational value of demand flexibility from deferred or avoided investments in distribution assets. This requires specific information regarding load profile characteristics of DERs (including their interactions) to more accurately project hourly load growth for each distribution system feeder.
4. Estimate the systemwide avoided cost of deferred or avoided distribution capacity expansion. This analysis requires data on the value of demand flexibility to generation and transmission systems, using results from bulk power system analysis.
Most distribution system analyses should be completed first. Some of the outputs (e.g., marginal energy losses, reduced capacity needs) are required inputs for bulk power system analysis. Figure 5 shows the data flows for distribution system planning, including outputs used in bulk power system planning.
54 For example, if transmission constraints limit the amount of DERs that can be accommodated in the area, this constraint is then passed back down to distribution substation-level analysis and eventually to feeder-level analysis for determining the potential level of DERs that can interconnect at various points on the distribution system.
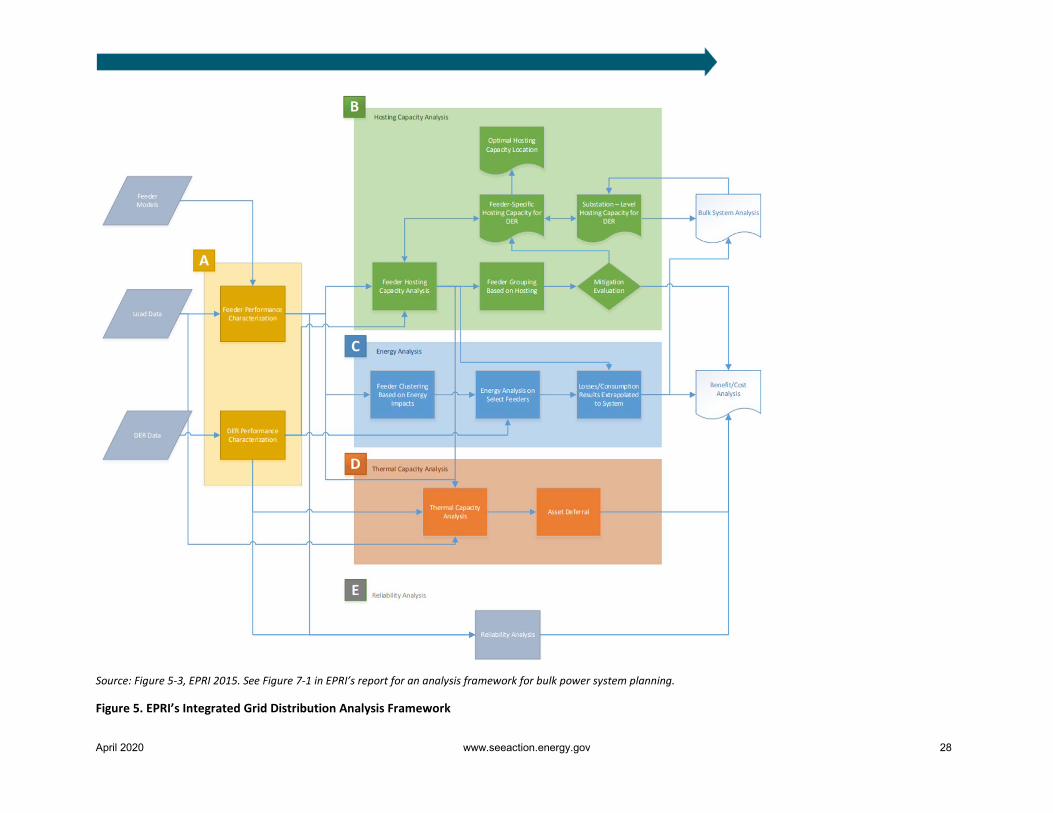
April 2020 www.seeaction.energy.gov 28
Source: Figure 5-3, EPRI 2015. See Figure 7-1 in EPRI’s report for an analysis framework for bulk power system planning.
Figure 5. EPRI’s Integrated Grid Distribution Analysis Framework
April 2020 www.seeaction.energy.gov 29
Bulk Power System Planning and Analysis
This element includes two parts. Transmission System Planning and Analysis uses transmission capacity expansion models to establish the value of transmission capacity deferral. Two new or enhanced analyses can be used to analyze the cost of transmission congestion and assess non-wires solutions to transmission capacity upgrade needs. Depending on market structure, additional analysis also may be conducted to estimate the value of ancillary services required to maintain grid stability and security such as frequency control, spinning reserves, and operating reserves.
Alternatively, the value of these grid services may be determined in Generation Planning and Analysis, where the primary task is to estimate the hourly (or subhourly) value of energy and generation capacity through the use of capacity expansion models or market modeling. This analysis also may be used to estimate the value of ancillary services. If widespread deployment of demand flexibility is anticipated, DERs that provide demand flexibility should be included in the modeling process as resource options for development. That approach better captures the interaction of DERs with each other and with the utility system. In organized wholesale markets, the bulk power system value of grid services provided by long-lived demand flexibility likely will require the use of market models that forecast future capacity, energy, and ancillary service costs beyond the period covered by auction/bidding mechanisms.55
55 ISOs/RTOs use a variety of market models for transmission and system capacity and energy planning. See, for example: MISO, ISO New England, and PJM.
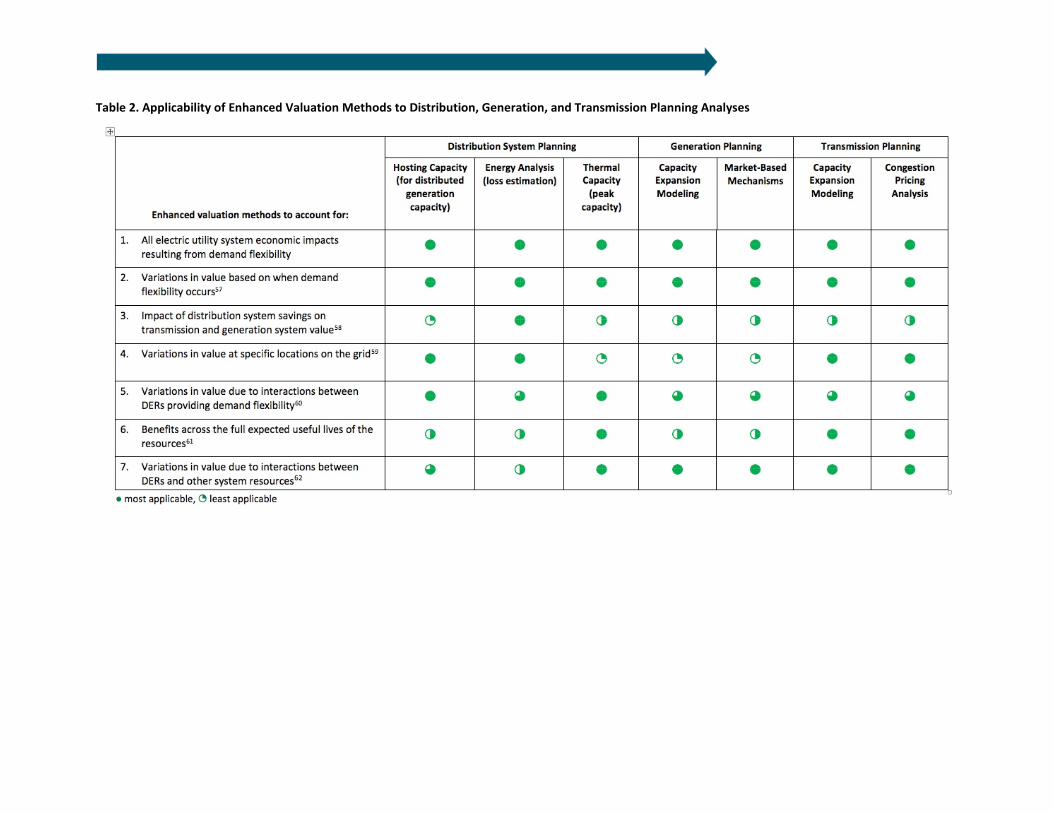
Table 2. Applicability of Enhanced Valuation Methods to Distribution, Generation, and Transmission Planning Analyses
April 2020 www.seeaction.energy.gov 31
Specific Enhanced Valuation Methods
The remainder of this section discusses planning strategies for enhancing a jurisdiction’s existing methods for valuing energy efficiency, demand response, and other DERs to avoid under or overestimating the value of demand flexibility in grid-interactive efficient buildings.
The first step is to assess the jurisdiction’s current economic valuation methods and practices to determine how they compare to the enhanced methods and practices described in this section. Once a jurisdiction has identified the enhancements it has yet to fully implement, the next step is to prioritize among the remaining enhancements by weighing the magnitude of their potential impacts against their data requirements and analytical complexity.
The seven enhanced valuation methods described below are in suggested priority order, based on potential impacts and ease of implementation.56
1. Account for all electric utility system economic impacts resulting from demand flexibility.
While the objective of this step, consistent with the EPRI framework and the National Standard Practice Manual (NSPM), is to ultimately include all substantive and reasonably quantifiable generation and T&D system impacts, not all utility system benefits provided by demand flexibility are of equal value. Text Box 5 provides general guidance on relative magnitude of economic value to utility systems of demand flexibility. While full implementation of this enhancement is the goal, because it is data-intensive and analytically complex, suggestions here begin with more incremental improvements in valuation practices.
A logical first step in accounting for all electric utility system impacts is to focus on those targeting valuation of primary utility system benefits. In order to value demand flexibility in buildings for utility systems, they must be recognized as potential resources for grid services in economic valuation processes.57 The principles and practices set forth by the NSPM and EPRI, based on the identical premise, provide guidance.58
The NSPM provides an overall framework for establishing a jurisdiction’s cost-effectiveness tests for considering energy efficiency (and other DERs) as utility system resources. The NSPM and EPRI frameworks both suggest that economic valuation of resources that provide grid services should account for all substantive and reasonably quantifiable generation and T&D system impacts. The NSPM lists factors (Text Box 1) that can be considered as contributing to the economic value of DERs to utility systems, all of which apply to DERs that provide demand flexibility.59 For example, organized wholesale markets do not value all utility system benefits that demand flexibility can provide because these markets do not pay for distribution system locational benefits or reflect impacts (adjusted for marginal losses) for transmission system deferral.
56 Valuation of demand flexibility during planning processes requires the analyst to determine all inputs to the calculation of their value, including cost, impacts, and lifetime, as well as the avoided cost of competing resources. Once assessments of the actual impacts (and lifetimes) of these resources are available, some of the complexity, such as accounting for interactive impacts, will be reduced. 57 For a more expansive discussion of the treatment of energy efficiency (and, by extension, other DERs) as grid resources in resource planning, see Mims Frick et al., Treating Energy Efficiency as a Resource in Electricity System Planning (forthcoming). 58 Woolf et al. 2017; EPRI 2015. 59 The National Efficiency Screening Project publishes case studies of jurisdictions that have followed its process for reviewing and potentially revising cost-effectiveness tests for energy efficiency.
[E]conomic valuation of resources that provide grid services should account for all
substantive and reasonably quantifiable generation and T&D system impacts.
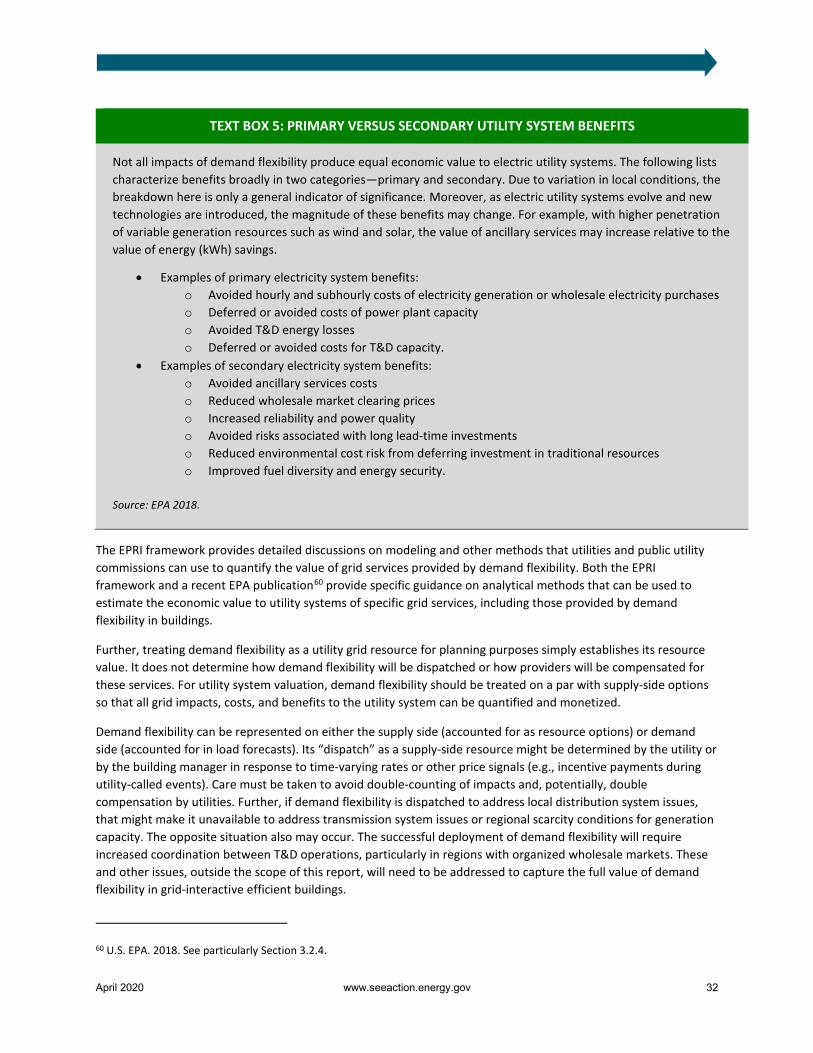
April 2020 www.seeaction.energy.gov 32
The EPRI framework provides detailed discussions on modeling and other methods that utilities and public utility commissions can use to quantify the value of grid services provided by demand flexibility. Both the EPRI framework and a recent EPA publication60 provide specific guidance on analytical methods that can be used to estimate the economic value to utility systems of specific grid services, including those provided by demand flexibility in buildings.
Further, treating demand flexibility as a utility grid resource for planning purposes simply establishes its resource value. It does not determine how demand flexibility will be dispatched or how providers will be compensated for these services. For utility system valuation, demand flexibility should be treated on a par with supply-side options so that all grid impacts, costs, and benefits to the utility system can be quantified and monetized.
Demand flexibility can be represented on either the supply side (accounted for as resource options) or demand side (accounted for in load forecasts). Its “dispatch” as a supply-side resource might be determined by the utility or by the building manager in response to time-varying rates or other price signals (e.g., incentive payments during utility-called events). Care must be taken to avoid double-counting of impacts and, potentially, double compensation by utilities. Further, if demand flexibility is dispatched to address local distribution system issues, that might make it unavailable to address transmission system issues or regional scarcity conditions for generation capacity. The opposite situation also may occur. The successful deployment of demand flexibility will require increased coordination between T&D operations, particularly in regions with organized wholesale markets. These and other issues, outside the scope of this report, will need to be addressed to capture the full value of demand flexibility in grid-interactive efficient buildings.
60 U.S. EPA. 2018. See particularly Section 3.2.4.
TEXT BOX 5: PRIMARY VERSUS SECONDARY UTILITY SYSTEM BENEFITS
Not all impacts of demand flexibility produce equal economic value to electric utility systems. The following lists characterize benefits broadly in two categories—primary and secondary. Due to variation in local conditions, the breakdown here is only a general indicator of significance. Moreover, as electric utility systems evolve and new technologies are introduced, the magnitude of these benefits may change. For example, with higher penetration of variable generation resources such as wind and solar, the value of ancillary services may increase relative to the value of energy (kWh) savings.
• Examples of primary electricity system benefits: o Avoided hourly and subhourly costs of electricity generation or wholesale electricity purchases o Deferred or avoided costs of power plant capacity o Avoided T&D energy losses o Deferred or avoided costs for T&D capacity.
• Examples of secondary electricity system benefits: o Avoided ancillary services costs o Reduced wholesale market clearing prices o Increased reliability and power quality o Avoided risks associated with long lead-time investments o Reduced environmental cost risk from deferring investment in traditional resources o Improved fuel diversity and energy security.
Source: EPA 2018.
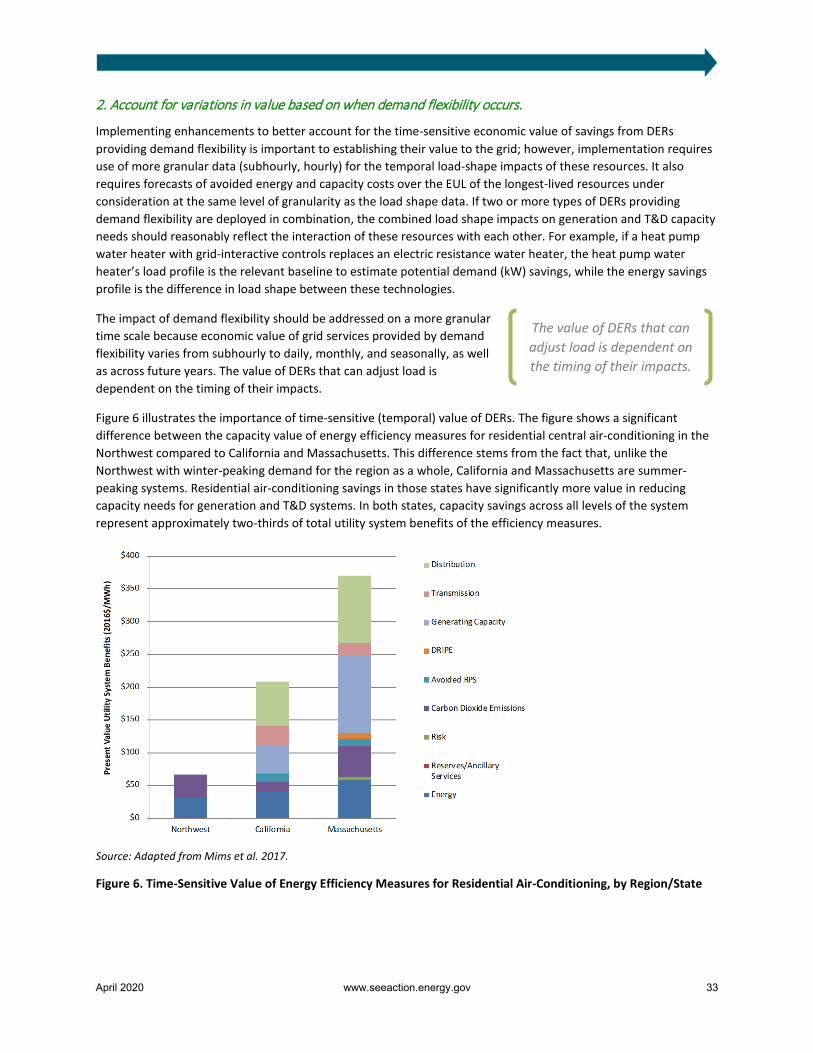
April 2020 www.seeaction.energy.gov 33
2. Account for variations in value based on when demand flexibility occurs.
Implementing enhancements to better account for the time-sensitive economic value of savings from DERs providing demand flexibility is important to establishing their value to the grid; however, implementation requires use of more granular data (subhourly, hourly) for the temporal load-shape impacts of these resources. It also requires forecasts of avoided energy and capacity costs over the EUL of the longest-lived resources under consideration at the same level of granularity as the load shape data. If two or more types of DERs providing demand flexibility are deployed in combination, the combined load shape impacts on generation and T&D capacity needs should reasonably reflect the interaction of these resources with each other. For example, if a heat pump water heater with grid-interactive controls replaces an electric resistance water heater, the heat pump water heater’s load profile is the relevant baseline to estimate potential demand (kW) savings, while the energy savings profile is the difference in load shape between these technologies.
The impact of demand flexibility should be addressed on a more granular time scale because economic value of grid services provided by demand flexibility varies from subhourly to daily, monthly, and seasonally, as well as across future years. The value of DERs that can adjust load is dependent on the timing of their impacts.
Figure 6 illustrates the importance of time-sensitive (temporal) value of DERs. The figure shows a significant difference between the capacity value of energy efficiency measures for residential central air-conditioning in the Northwest compared to California and Massachusetts. This difference stems from the fact that, unlike the Northwest with winter-peaking demand for the region as a whole, California and Massachusetts are summer-peaking systems. Residential air-conditioning savings in those states have significantly more value in reducing capacity needs for generation and T&D systems. In both states, capacity savings across all levels of the system represent approximately two-thirds of total utility system benefits of the efficiency measures.
Source: Adapted from Mims et al. 2017.
Figure 6. Time-Sensitive Value of Energy Efficiency Measures for Residential Air-Conditioning, by Region/State
The value of DERs that can adjust load is dependent on the timing of their impacts.
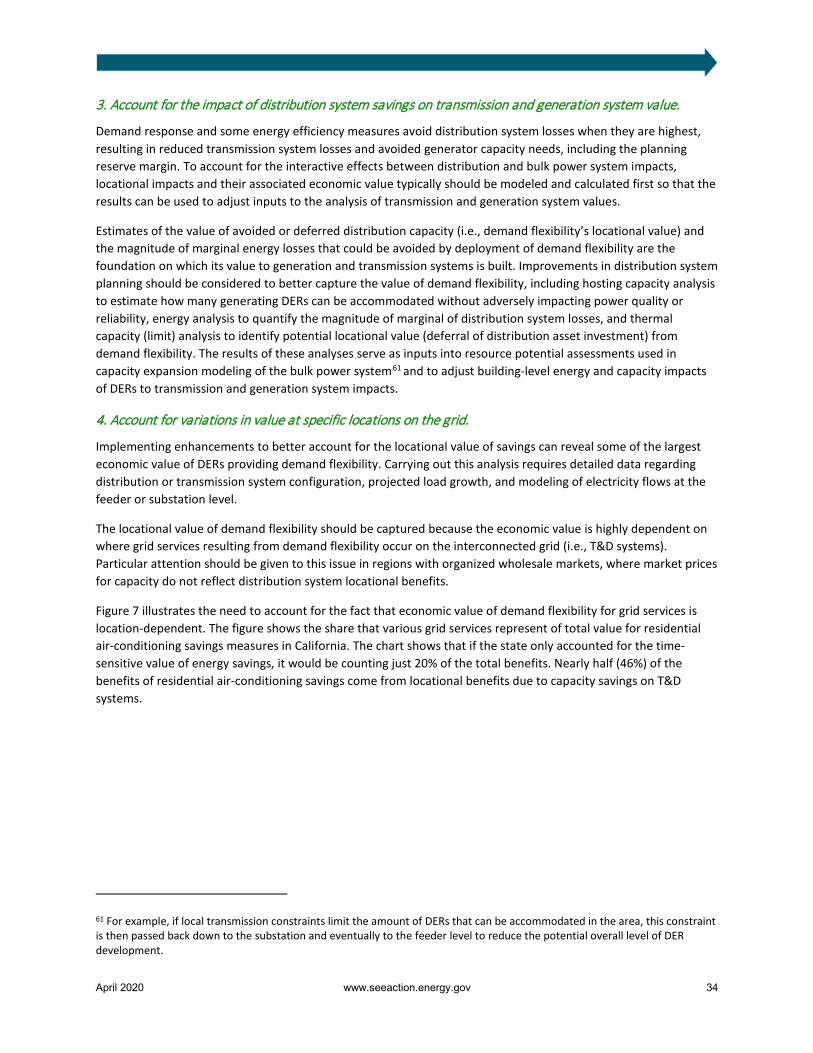
April 2020 www.seeaction.energy.gov 34
3. Account for the impact of distribution system savings on transmission and generation system value.
Demand response and some energy efficiency measures avoid distribution system losses when they are highest, resulting in reduced transmission system losses and avoided generator capacity needs, including the planning reserve margin. To account for the interactive effects between distribution and bulk power system impacts, locational impacts and their associated economic value typically should be modeled and calculated first so that the results can be used to adjust inputs to the analysis of transmission and generation system values.
Estimates of the value of avoided or deferred distribution capacity (i.e., demand flexibility’s locational value) and the magnitude of marginal energy losses that could be avoided by deployment of demand flexibility are the foundation on which its value to generation and transmission systems is built. Improvements in distribution system planning should be considered to better capture the value of demand flexibility, including hosting capacity analysis to estimate how many generating DERs can be accommodated without adversely impacting power quality or reliability, energy analysis to quantify the magnitude of marginal of distribution system losses, and thermal capacity (limit) analysis to identify potential locational value (deferral of distribution asset investment) from demand flexibility. The results of these analyses serve as inputs into resource potential assessments used in capacity expansion modeling of the bulk power system61 and to adjust building-level energy and capacity impacts of DERs to transmission and generation system impacts.
4. Account for variations in value at specific locations on the grid.
Implementing enhancements to better account for the locational value of savings can reveal some of the largest economic value of DERs providing demand flexibility. Carrying out this analysis requires detailed data regarding distribution or transmission system configuration, projected load growth, and modeling of electricity flows at the feeder or substation level.
The locational value of demand flexibility should be captured because the economic value is highly dependent on where grid services resulting from demand flexibility occur on the interconnected grid (i.e., T&D systems). Particular attention should be given to this issue in regions with organized wholesale markets, where market prices for capacity do not reflect distribution system locational benefits.
Figure 7 illustrates the need to account for the fact that economic value of demand flexibility for grid services is location-dependent. The figure shows the share that various grid services represent of total value for residential air-conditioning savings measures in California. The chart shows that if the state only accounted for the time-sensitive value of energy savings, it would be counting just 20% of the total benefits. Nearly half (46%) of the benefits of residential air-conditioning savings come from locational benefits due to capacity savings on T&D systems.
61 For example, if local transmission constraints limit the amount of DERs that can be accommodated in the area, this constraint is then passed back down to the substation and eventually to the feeder level to reduce the potential overall level of DER development.
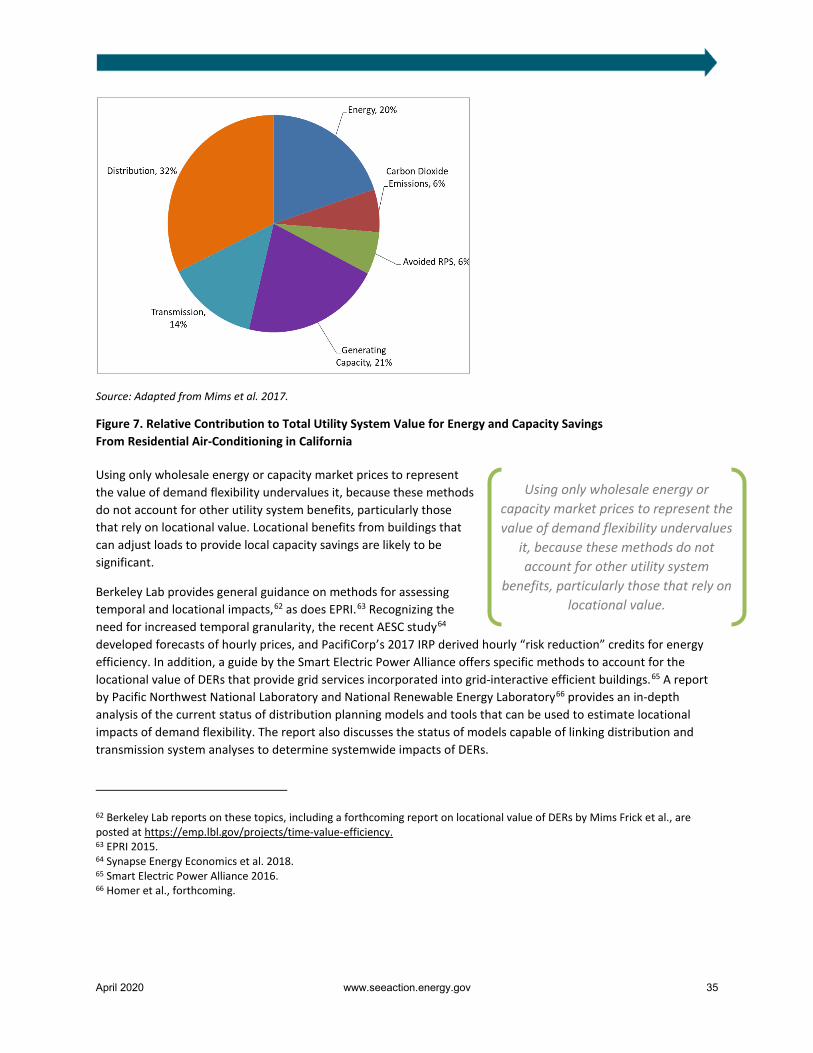
April 2020 www.seeaction.energy.gov 35
Source: Adapted from Mims et al. 2017.
Figure 7. Relative Contribution to Total Utility System Value for Energy and Capacity Savings From Residential Air-Conditioning in California
Using only wholesale energy or capacity market prices to represent the value of demand flexibility undervalues it, because these methods do not account for other utility system benefits, particularly those that rely on locational value. Locational benefits from buildings that can adjust loads to provide local capacity savings are likely to be significant.
Berkeley Lab provides general guidance on methods for assessing temporal and locational impacts,62 as does EPRI.63 Recognizing the need for increased temporal granularity, the recent AESC study64 developed forecasts of hourly prices, and PacifiCorp’s 2017 IRP derived hourly “risk reduction” credits for energy efficiency. In addition, a guide by the Smart Electric Power Alliance offers specific methods to account for the locational value of DERs that provide grid services incorporated into grid-interactive efficient buildings.65 A report by Pacific Northwest National Laboratory and National Renewable Energy Laboratory66 provides an in-depth analysis of the current status of distribution planning models and tools that can be used to estimate locational impacts of demand flexibility. The report also discusses the status of models capable of linking distribution and transmission system analyses to determine systemwide impacts of DERs.
62 Berkeley Lab reports on these topics, including a forthcoming report on locational value of DERs by Mims Frick et al., are posted at https://emp.lbl.gov/projects/time-value-efficiency. 63 EPRI 2015. 64 Synapse Energy Economics et al. 2018. 65 Smart Electric Power Alliance 2016. 66 Homer et al., forthcoming.
Using only wholesale energy or capacity market prices to represent the value of demand flexibility undervalues
it, because these methods do not account for other utility system
benefits, particularly those that rely on locational value.
April 2020 www.seeaction.energy.gov 36
States are developing guidance and analytical tools to determine the locational value of DERs. For example, through its Reforming the Energy Vision process, New York developed a benefit-cost guidebook that provides a foundational methodology with valuation assumptions to support a variety of utility programs and projects including investment in a distributed system platform and procurement of DERs through programs, tariffs, and competitive bidding.67 The California Public Utilities Commission, in collaboration with the state’s investor-owned utilities, stakeholders, and a consultant developed a spreadsheet tool designed to calculate locational benefits of DERs. California’s Locational Net Benefits Analysis Tool uses DER measure savings characteristics (load shape, lifetime, and so on) and specific distribution system data to calculate locational values.68 At the utility level, ConEd’s Benefit Cost Analysis Handbook recognizes the DER benefits of avoided distribution capacity infrastructure and provides methods to quantify location-specific marginal costs that the system defers or avoids by opting for non-wires solutions.69
5. Account for variations in value due to interactions between DERs providing demand flexibility.
Implementing enhancements to better account for the interaction between DERs providing demand flexibility, whether deployed individually or collectively, can be accomplished with varying levels of complexity. As a first step, analysis should capture major interactions between pairs of DERs, such as those that are likely to occur between demand response and energy efficiency, or photovoltaic (PV) with and without onsite storage. These interactions can be estimated assuming that deployment of DERs does not impact the existing or future electric grid sufficiently to alter the type, amount, or schedule of development of conventional technologies used to provide comparable grid services (i.e., deployment of DERs does not impact avoided cost). While system capacity expansion models can aid this analysis, they are not required.
Higher levels of DERs increases the need to address interactions of DERs with one another and with the electric grid. DERs providing demand flexibility can interact with one another in material ways. It is unlikely that their collective and cumulative impacts are simply additive. Moreover, widespread deployment of demand flexibility for grid services will change grid operations and infrastructure development, altering avoided resource costs. These interactions should be accounted for to align planning estimates of impacts (i.e., amount, timing, and EULs) for valuation and cost-effectiveness screening with those obtained through ex post assessments that estimate actual impacts.
A Berkeley Lab report describes three levels of analysis, varying from simple to more complex, to address interaction of DERs with one another and with the mix of resources in an existing or future utility system (Figure 8) and provides examples of utilities implementing these methods.70
67http://documents.dps.ny.gov/public/Common/ViewDoc.aspx?DocRefId=%7BF0CC59D0-4E2F-4440-8E14-1DC07566BB94%7D. 68 https://e3.sharefile.com/share/view/sf3b5f091144489ca. 69 https://www.coned.com/-/media/files/coned/documents/our-energy-future/our-energy-projects/coned-bcah.pdf?la=en. 70 Mims Frick et al. 2018.
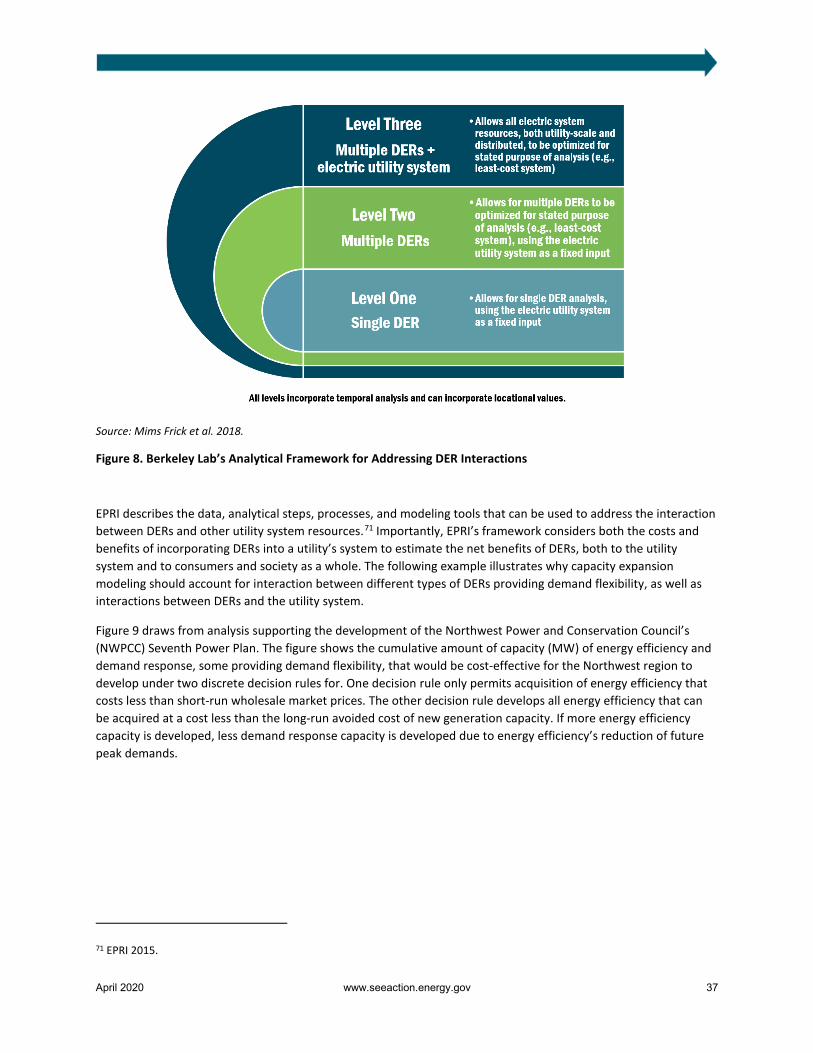
April 2020 www.seeaction.energy.gov 37
Source: Mims Frick et al. 2018.
Figure 8. Berkeley Lab’s Analytical Framework for Addressing DER Interactions
EPRI describes the data, analytical steps, processes, and modeling tools that can be used to address the interaction between DERs and other utility system resources.71 Importantly, EPRI’s framework considers both the costs and benefits of incorporating DERs into a utility’s system to estimate the net benefits of DERs, both to the utility system and to consumers and society as a whole. The following example illustrates why capacity expansion modeling should account for interaction between different types of DERs providing demand flexibility, as well as interactions between DERs and the utility system.
Figure 9 draws from analysis supporting the development of the Northwest Power and Conservation Council’s (NWPCC) Seventh Power Plan. The figure shows the cumulative amount of capacity (MW) of energy efficiency and demand response, some providing demand flexibility, that would be cost-effective for the Northwest region to develop under two discrete decision rules for. One decision rule only permits acquisition of energy efficiency that costs less than short-run wholesale market prices. The other decision rule develops all energy efficiency that can be acquired at a cost less than the long-run avoided cost of new generation capacity. If more energy efficiency capacity is developed, less demand response capacity is developed due to energy efficiency’s reduction of future peak demands.
71 EPRI 2015.
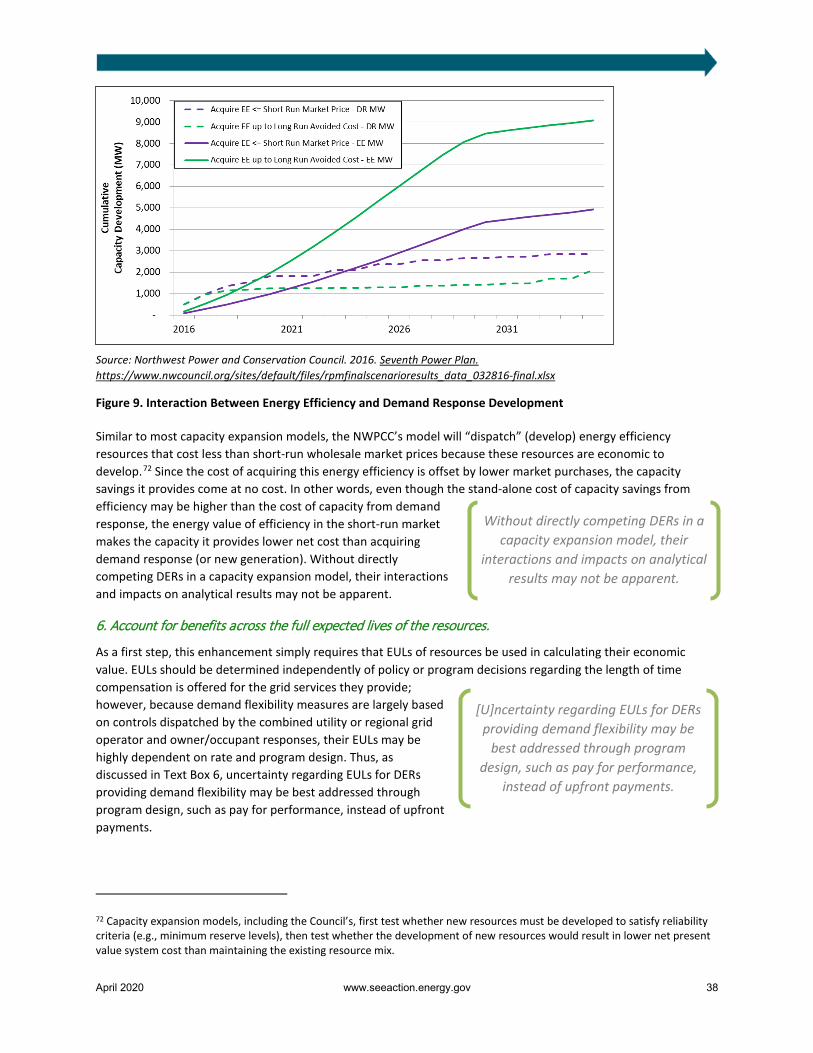
April 2020 www.seeaction.energy.gov 38
Source: Northwest Power and Conservation Council. 2016. Seventh Power Plan. https://www.nwcouncil.org/sites/default/files/rpmfinalscenarioresults_data_032816-final.xlsx
Figure 9. Interaction Between Energy Efficiency and Demand Response Development
Similar to most capacity expansion models, the NWPCC’s model will “dispatch” (develop) energy efficiency resources that cost less than short-run wholesale market prices because these resources are economic to develop.72 Since the cost of acquiring this energy efficiency is offset by lower market purchases, the capacity savings it provides come at no cost. In other words, even though the stand-alone cost of capacity savings from efficiency may be higher than the cost of capacity from demand response, the energy value of efficiency in the short-run market makes the capacity it provides lower net cost than acquiring demand response (or new generation). Without directly competing DERs in a capacity expansion model, their interactions and impacts on analytical results may not be apparent.
6. Account for benefits across the full expected lives of the resources.
As a first step, this enhancement simply requires that EULs of resources be used in calculating their economic value. EULs should be determined independently of policy or program decisions regarding the length of time compensation is offered for the grid services they provide; however, because demand flexibility measures are largely based on controls dispatched by the combined utility or regional grid operator and owner/occupant responses, their EULs may be highly dependent on rate and program design. Thus, as discussed in Text Box 6, uncertainty regarding EULs for DERs providing demand flexibility may be best addressed through program design, such as pay for performance, instead of upfront payments.
72 Capacity expansion models, including the Council’s, first test whether new resources must be developed to satisfy reliability criteria (e.g., minimum reserve levels), then test whether the development of new resources would result in lower net present value system cost than maintaining the existing resource mix.
Without directly competing DERs in a capacity expansion model, their
interactions and impacts on analytical results may not be apparent.
[U]ncertainty regarding EULs for DERs providing demand flexibility may be
best addressed through program design, such as pay for performance,
instead of upfront payments.
April 2020 www.seeaction.energy.gov 39
This enhancement addresses potential variation in measure/resource impacts of DERs for demand flexibility over their lifetimes when they provide grid services, because: (1) their dispatch, while controlled by a grid operator, also will be dictated by the response of building owners and occupants; or (2) by design, the technology they employ is intended to adjust their impact through time (e.g., learning thermostats and similar Artificial Intelligence learning controls).73 This implies that demand flexibility that defers or avoids capital expenditures, ongoing fuel costs, or O&M costs throughout their EULs should be valued differently than resources that only reduce near-term fuel costs or O&M costs, and demand flexibility that is forecast to have variable and uncertain impacts through time.
Thus, valuation of DERs providing demand flexibility accurately reflects the stability of their savings and EULs. The value of resources that can provide benefits to the utility system throughout their EULs is comparable to the cost of investments in conventional generation and T&D resources that provide grid services over similar lifetimes. Demand flexibility that is forecast to have consistent impacts (e.g., energy savings, capacity savings, or both) over the EULs of DERs that are providing it should be valued using assumptions that account for stable value over these full lifetimes.
In practice, this enhancement means that policy and program determinations regarding duration and level of compensation offered to providers of demand flexibility should be separated from determinations of the value of the grid service being provided. That is, cost-effectiveness computations should recognize the value of demand flexibility over the DERs’ EULs, independent of the length of time compensation is offered.
73 Artificial Intelligence makes it possible for machines to learn from experience, adjust to new inputs, and improve performance through time.
TEXT BOX 6: POTENTIAL IMPACTS FOR PROGRAM PLANNING AND DESIGN
Historically, utilities and other program administrators have relied on results of economic valuation of energy efficiency and demand response conducted at the planning stage for determining financial incentives for participating customers and other program design features such as consumer marketing. Program administrators could be reasonably confident that measured and verified impacts (i.e., energy savings, capacity savings, or both) would be close to those assumed during planning, in part because evaluated savings estimates informed future planning estimates.
However, for demand flexibility provided by grid-interactive efficient buildings, evaluated savings may differ significantly from planning estimates. This is particularly the case for measures that provide grid services through load shifting and modulating, because the value of these grid services is temporally dependent and strongly correlated with short-term market conditions. This is particularly problematic for measures with long (10–15-year) EULs, due to the inability to accurately forecast short-term market conditions over such extended periods. As a result, the traditional program design option of providing consumers with upfront financial incentives based on forecasted savings over a measure’s EUL may be difficult to justify with confidence.
Fortunately, since DERs providing demand flexibility must inherently be under control, their actual impacts should be much easier to validate than historical energy efficiency programs. Verification of impacts of these resources in near real time will be possible because actual responses to dispatch signals (e.g., price, electronic, time clock) can be tracked or directly measured via sensors and metering. This enhanced ability to verify impacts, coupled with greater uncertainty surrounding the accuracy of planning estimates for savings, may lead to program designs that rely more on pay-for-performance mechanisms rather than one-time, upfront payments.
April 2020 www.seeaction.energy.gov 40
For example, PJM’s market design policy provides compensation over a 4-year lifetime for energy efficiency measures. After this time, PJM recognizes these impacts in its load forecast and terminates payments. Even though PJM only compensates providers for the initial four years of an energy efficiency measure’s life, the approach inherently recognizes the continuing impact on current loads of energy efficiency measures previously acquired. For purposes of program or resource planning, the value of long-lived DERs providing demand flexibility, such as efficiency measures for lighting and HVAC systems, is still determined using their EULs, and not just the 4 years for which they are compensated.
In contrast, for DERs forecast to have variable and uncertain impacts through time, the economic value of the grid services of these less stable or more short-lived resources is most appropriately based on their near-term savings or by probability-weighted assumptions for impacts in future years. DER program design significantly impacts the types of DERs adopted. Thus, reducing uncertainty of DER impacts may be best addressed through program design.
7. Account for variations in value due to interactions between DERs and other system resources.
Implementing enhancements to better account for interactions between DERs and existing and potential conventional grid resources supplying comparable services requires capacity expansion models capable of modeling all DERs as resource options. DERs directly compete for dispatch against existing resources and for development against new conventional generation, transmission, and distribution technologies in these models. This enhancement involves the greatest complexity and data requirements. Enhancing valuation of demand flexibility through the use of generation and T&D capacity expansion modeling, supplemented as necessary with other methods described in Section 4, is most appropriate when determining the impact of widespread deployment of DERs. Significant scale is typically necessary to alter the type, timing, and amount of conventional generating resources sufficiently to materially affect avoided resource costs. As discussed in Text Box 7, to implement this enhancement, commercially available capacity expansion models currently require customization.
TEXT BOX 7: MODELING DERS IN CAPACITY EXPANSION MODELS
Energy efficiency, demand response, distributed storage, distributed solar PV, combined heat and power, and some other types of distributed generation can be modeled as options in most commercially available capacity expansion models; however, these models require users to define the specific characteristics of these resources. That is, unlike for generating resources, the databases provided by model vendors do not provide default characteristics for these DERs. Instead, the user must provide characteristics such as cost, quantity, lead times, and load shapes.
Most models do not limit the number of user-defined candidate resources that can be input for evaluation in the optimization process. Computer system capabilities (e.g., memory size, number, and processing speed of CPUs) and level of temporal granularity (e.g., 5-minute, 15-minute, hourly, daily) are generally more limiting than number of candidate resources on the run time required in the optimization process.
Capacity expansion models can isolate the economic value to the utility system for each grid service (e.g., peaking capacity, contingency reserves, energy savings, voltage support) to determine whether DERs provide the same service at a lower cost—or present lower economic risk—than other types of resources. To do so requires many user-defined inputs, an experienced modeler, potentially multiple model runs, and post-processing of model output.
For a detailed discussion of the limitation of existing models to analyze impacts on distribution systems, see EPRI. 2017. Systems Analysis in Electric Power Sector Modeling: A Review of the Recent Literature and Capabilities of Selected Capacity Planning Tools.
April 2020 www.seeaction.energy.gov 41
The potential impact of demand flexibility on the amount, type, and schedule of development of conventional generation and T&D will need to be accounted for in system expansion models or market price forecasts used to estimate avoided costs. This enhancement can be used to accurately estimate the long-run economic value of these resources.
Implementation of this enhancement will likely require the most significant changes in methods used to value DERs for demand flexibility. Integrated analysis that accounts for interactive impacts between all types of resources requires that system expansion models used to estimate avoided costs include all resources that provide demand flexibility as resource options so the model can select them for development. EPRI and Berkeley Lab provide guidance on how such modeling might be accomplished.74
Given data requirements and limitations of existing models, this enhancement is nascent. As discussed above, NWPCC’s Seventh Power Plan and PacifiCorp’s 2017 IRP treated DERs as resource options in capacity expansion modeling, accounting for interactions between energy efficiency and demand response resources and with generation options. Capacity expansion modeling allowed efficiency, demand response, and other DERs to compete directly with bulk power generation options for development. Thus, the models directly tested whether it is less costly to deploy efficiency, demand response, or new supply-side options to meet bulk power system capacity needs.75
Figure 10, developed from data supporting the NWPCC’s Seventh Power Plan, shows the impact on timing and amount of combined-cycle combustion gas turbine (CCCGT) development of various levels of energy efficiency and demand response development. The figure shows the cumulative amount of new CCCGT development under three scenarios.76 The first scenario does not consider demand response for development. Under the second scenario, energy efficiency is acquired if its levelized cost is below short-run wholesale market prices. Under the third scenario, energy efficiency is acquired if its levelized cost is below the long-run cost of new CCCGT generation. Under both the second and third scenarios, demand response and energy efficiency that provide peak capacity are acquired to satisfy reliability requirements if these resources are the lowest-cost option.
74 Mims Frick 2018; EPRI 2015. 75 The generation capacity expansion models that NWPCC and PacifiCorp use currently do not directly determine the economic value of T&D capacity. That is, the models do not derive specific locational values for these capacity savings. Instead, values are calculated based on the average T&D benefit of capacity deferral across their system and assigned to DERs as cost credits. 76 The amount and timing represent median (50%) results across 800 possible future conditions.
Integrated analysis that accounts for interactive impacts between all types of resources requires that system expansion models used to estimate avoided costs include all resources that provide
demand flexibility as resource options so the model can select them for development.
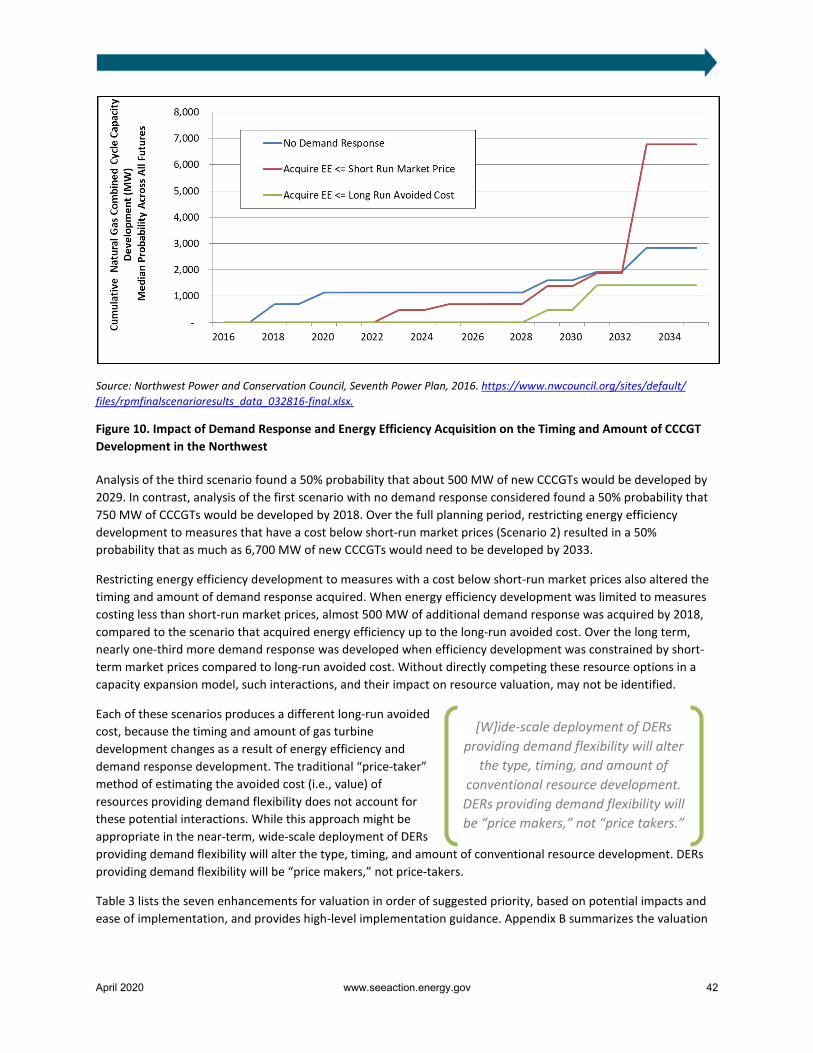
April 2020 www.seeaction.energy.gov 42
Source: Northwest Power and Conservation Council, Seventh Power Plan, 2016. https://www.nwcouncil.org/sites/default/ files/rpmfinalscenarioresults_data_032816-final.xlsx.
Figure 10. Impact of Demand Response and Energy Efficiency Acquisition on the Timing and Amount of CCCGT Development in the Northwest
Analysis of the third scenario found a 50% probability that about 500 MW of new CCCGTs would be developed by 2029. In contrast, analysis of the first scenario with no demand response considered found a 50% probability that 750 MW of CCCGTs would be developed by 2018. Over the full planning period, restricting energy efficiency development to measures that have a cost below short-run market prices (Scenario 2) resulted in a 50% probability that as much as 6,700 MW of new CCCGTs would need to be developed by 2033.
Restricting energy efficiency development to measures with a cost below short-run market prices also altered the timing and amount of demand response acquired. When energy efficiency development was limited to measures costing less than short-run market prices, almost 500 MW of additional demand response was acquired by 2018, compared to the scenario that acquired energy efficiency up to the long-run avoided cost. Over the long term, nearly one-third more demand response was developed when efficiency development was constrained by short-term market prices compared to long-run avoided cost. Without directly competing these resource options in a capacity expansion model, such interactions, and their impact on resource valuation, may not be identified.
Each of these scenarios produces a different long-run avoided cost, because the timing and amount of gas turbine development changes as a result of energy efficiency and demand response development. The traditional “price-taker” method of estimating the avoided cost (i.e., value) of resources providing demand flexibility does not account for these potential interactions. While this approach might be appropriate in the near-term, wide-scale deployment of DERs providing demand flexibility will alter the type, timing, and amount of conventional resource development. DERs providing demand flexibility will be “price makers,” not price-takers.
Table 3 lists the seven enhancements for valuation in order of suggested priority, based on potential impacts and ease of implementation, and provides high-level implementation guidance. Appendix B summarizes the valuation
[W]ide-scale deployment of DERs providing demand flexibility will alter
the type, timing, and amount of conventional resource development.
DERs providing demand flexibility will be “price makers,” not “price takers.”
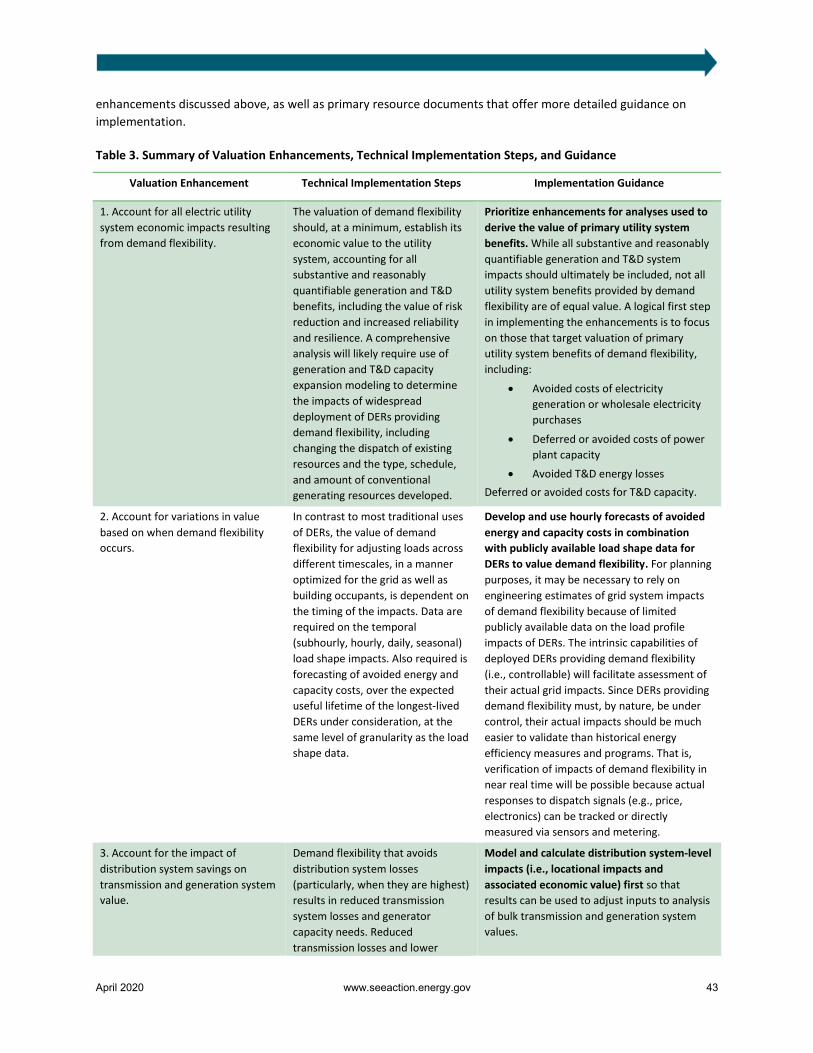
April 2020 www.seeaction.energy.gov 43
enhancements discussed above, as well as primary resource documents that offer more detailed guidance on implementation.
Table 3. Summary of Valuation Enhancements, Technical Implementation Steps, and Guidance
Valuation Enhancement Technical Implementation Steps Implementation Guidance
1. Account for all electric utility system economic impacts resulting from demand flexibility.
The valuation of demand flexibility should, at a minimum, establish its economic value to the utility system, accounting for all substantive and reasonably quantifiable generation and T&D benefits, including the value of risk reduction and increased reliability and resilience. A comprehensive analysis will likely require use of generation and T&D capacity expansion modeling to determine the impacts of widespread deployment of DERs providing demand flexibility, including changing the dispatch of existing resources and the type, schedule, and amount of conventional generating resources developed.
Prioritize enhancements for analyses used to derive the value of primary utility system benefits. While all substantive and reasonably quantifiable generation and T&D system impacts should ultimately be included, not all utility system benefits provided by demand flexibility are of equal value. A logical first step in implementing the enhancements is to focus on those that target valuation of primary utility system benefits of demand flexibility, including:
• Avoided costs of electricity generation or wholesale electricity purchases
• Deferred or avoided costs of power plant capacity
• Avoided T&D energy losses Deferred or avoided costs for T&D capacity.
2. Account for variations in value based on when demand flexibility occurs.
In contrast to most traditional uses of DERs, the value of demand flexibility for adjusting loads across different timescales, in a manner optimized for the grid as well as building occupants, is dependent on the timing of the impacts. Data are required on the temporal (subhourly, hourly, daily, seasonal) load shape impacts. Also required is forecasting of avoided energy and capacity costs, over the expected useful lifetime of the longest-lived DERs under consideration, at the same level of granularity as the load shape data.
Develop and use hourly forecasts of avoided energy and capacity costs in combination with publicly available load shape data for DERs to value demand flexibility. For planning purposes, it may be necessary to rely on engineering estimates of grid system impacts of demand flexibility because of limited publicly available data on the load profile impacts of DERs. The intrinsic capabilities of deployed DERs providing demand flexibility (i.e., controllable) will facilitate assessment of their actual grid impacts. Since DERs providing demand flexibility must, by nature, be under control, their actual impacts should be much easier to validate than historical energy efficiency measures and programs. That is, verification of impacts of demand flexibility in near real time will be possible because actual responses to dispatch signals (e.g., price, electronics) can be tracked or directly measured via sensors and metering.
3. Account for the impact of distribution system savings on transmission and generation system value.
Demand flexibility that avoids distribution system losses (particularly, when they are highest) results in reduced transmission system losses and generator capacity needs. Reduced transmission losses and lower
Model and calculate distribution system-level impacts (i.e., locational impacts and associated economic value) first so that results can be used to adjust inputs to analysis of bulk transmission and generation system values.
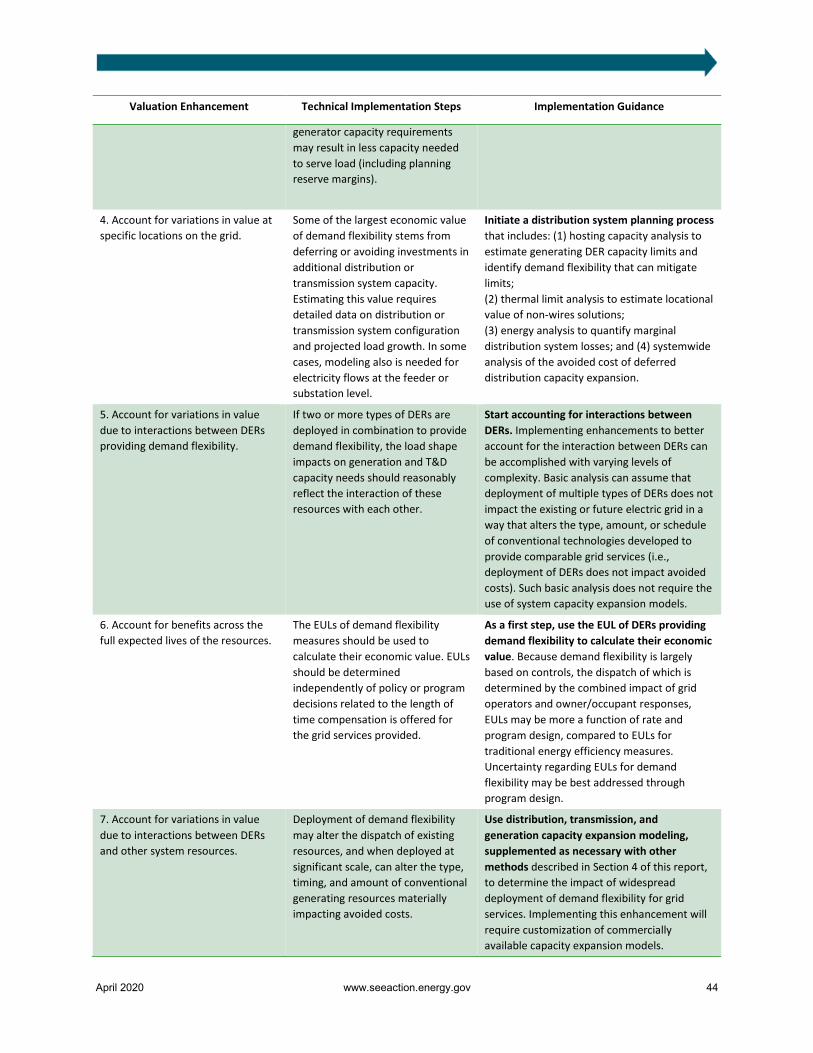
April 2020 www.seeaction.energy.gov 44
Valuation Enhancement Technical Implementation Steps Implementation Guidance
generator capacity requirements may result in less capacity needed to serve load (including planning reserve margins).
4. Account for variations in value at specific locations on the grid.
Some of the largest economic value of demand flexibility stems from deferring or avoiding investments in additional distribution or transmission system capacity. Estimating this value requires detailed data on distribution or transmission system configuration and projected load growth. In some cases, modeling also is needed for electricity flows at the feeder or substation level.
Initiate a distribution system planning process that includes: (1) hosting capacity analysis to estimate generating DER capacity limits and identify demand flexibility that can mitigate limits; (2) thermal limit analysis to estimate locational value of non-wires solutions; (3) energy analysis to quantify marginal distribution system losses; and (4) systemwide analysis of the avoided cost of deferred distribution capacity expansion.
5. Account for variations in value due to interactions between DERs providing demand flexibility.
If two or more types of DERs are deployed in combination to provide demand flexibility, the load shape impacts on generation and T&D capacity needs should reasonably reflect the interaction of these resources with each other.
Start accounting for interactions between DERs. Implementing enhancements to better account for the interaction between DERs can be accomplished with varying levels of complexity. Basic analysis can assume that deployment of multiple types of DERs does not impact the existing or future electric grid in a way that alters the type, amount, or schedule of conventional technologies developed to provide comparable grid services (i.e., deployment of DERs does not impact avoided costs). Such basic analysis does not require the use of system capacity expansion models.
6. Account for benefits across the full expected lives of the resources.
The EULs of demand flexibility measures should be used to calculate their economic value. EULs should be determined independently of policy or program decisions related to the length of time compensation is offered for the grid services provided.
As a first step, use the EUL of DERs providing demand flexibility to calculate their economic value. Because demand flexibility is largely based on controls, the dispatch of which is determined by the combined impact of grid operators and owner/occupant responses, EULs may be more a function of rate and program design, compared to EULs for traditional energy efficiency measures. Uncertainty regarding EULs for demand flexibility may be best addressed through program design.
7. Account for variations in value due to interactions between DERs and other system resources.
Deployment of demand flexibility may alter the dispatch of existing resources, and when deployed at significant scale, can alter the type, timing, and amount of conventional generating resources materially impacting avoided costs.
Use distribution, transmission, and generation capacity expansion modeling, supplemented as necessary with other methods described in Section 4 of this report, to determine the impact of widespread deployment of demand flexibility for grid services. Implementing this enhancement will require customization of commercially available capacity expansion models.
April 2020 www.seeaction.energy.gov 45
References
Alstone, P. et al. 2017. Final Report on Phase 2 Results: 2025 California Demand Response Potential Study: Charting California’s Demand Response Future. Berkeley, CA: Lawrence Berkeley National Laboratory. http://www.cpuc.ca.gov/General.aspx?id=10622.
Chew, B., E. Myers, T. Adolf, and E. Thomas. 2018. Non-Wires Alternatives: Case Studies from Leading U.S. Projects. https://e4thefuture.org/wp-content/uploads/2018/11/2018-Non-Wires-Alternatives-Report_FINAL.pdf.ConEdison. 2018. Benefit Cost Analysis Handbook. https://www.coned.com/-/media/files/coned/documents/our-energy-future/our-energy-projects/coned-bcah.pdf?la=en.
Cooke, A., J. Homer, and L. Schwartz. 2018. Distribution System Planning – State Examples by Topic. Richland, WA: Pacific Northwest National Laboratory and Lawrence Berkeley National Laboratory. https://epe.pnnl.gov/pdfs/DSP_State_Examples-PNNL-27366.pdf.
EPRI (Electric Power Research Institute). 2015. The Integrated Grid: A Benefit-Cost Framework. https://www.epri.com/#/pages/product/3002004878/?lang=en-US.
Homer, J., A. Cooke, L. Schwartz, G. Leventis, F. Flores-Espino, and M. Coddington. 2017. State Engagement in Electric Distribution System Planning. Richland, WA: Pacific Northwest National Laboratory, Lawrence Berkeley National Laboratory, and National Renewable Energy Laboratory. https://emp.lbl.gov/publications/state-engagement-electric.
Mims, N., T. Eckman, and C. Goldman. 2017. Time-varying value of electric energy efficiency. Berkeley, CA: Lawrence Berkeley National Laboratory. https://emp.lbl.gov/sites/default/files/time-varying-value-of-ee-june2017.pdf.
Mims, N., T. Eckman, and L. Schwartz. 2018. Time-Varying Value of Energy Efficiency in Michigan. Berkeley, CA: Lawrence Berkeley National Laboratory. http://eta-publications.lbl.gov/sites/default/files/lbnl_tve_michigan_20180402_final.pdf.
Mims Frick, N., L. Schwartz, and A. Taylor-Anyikire. 2018. A Framework for Integrated Analysis of Distributed Energy Resources: Guide for States. Berkeley, CA: Lawrence Berkeley National Laboratory. http://eta-publications.lbl.gov/sites/default/files/lbnl_integrated_der_report_20181127.pdf.
Mims Frick, N., and L. Schwartz. 2019. Time-Sensitive Value of Energy Efficiency: Use Cases in Electricity Sector Planning and Programs. Berkeley, CA: Lawrence Berkeley National Laboratory. https://emp.lbl.gov/publications/time-sensitive-value-efficiency-use.
Mims Frick, N., S. Price, N. Hanus, L. Schwartz, A. Hopkins, and M. Whited. Forthcoming. Locational Value of Distributed Energy Resources. Berkeley, CA: Lawrence Berkeley National Laboratory.
Neukomm, M., V. Nubbe, and R. Fares. 2019. Grid-interactive Efficient Buildings Technical Report Series: Overview of Research Challenges and Gaps. U.S. Department of Energy. https://www1.eere.energy.gov/buildings/pdfs/75470.pdf.
Rickerson, W., J. Gillis, and M. Bulkeley. 2019. The Value of Resilience for Distributed Energy Resources: An Overview of Current Analytical Practices. Prepared by Converge Strategies, LLC, for the National Association of Regulatory Utility Commissioners. https://pubs.naruc.org/pub.cfm?id=531AD059-9CC0-BAF6-127B-99BCB5F02198.
Schwartz, L. 2020. “PUC Distribution Planning Practices.” Distribution Systems and Planning Training for Southeast States. Presented March 12, 2020. https://eta-publications.lbl.gov/sites/default/files/12_-_schwartz_puc_distribution_planning_practices.pdf.
April 2020 www.seeaction.energy.gov 46
Smart Electric Power Alliance and Nexant. 2016. Beyond the Meter: Addressing the Locational Valuation Challenge for Distributed Energy Resources. https://sepapower.org/resource/beyond-the-meter-addressing-the-locational-valuation-challenge-for-distributed-energy-resources/.
Sutter, M., J. Mitchell-Jackson, S. Schiller, L. Schwartz, and I. Hoffman. Forthcoming. Non-Energy Impacts in Cost-Benefit Analyses of Energy Efficiency Programs Funded by Utility Customers: Resources for States. Berkeley, CA: Lawrence Berkeley National Laboratory.
Synapse Energy Economics et al. 2018. Avoided Energy Supply Components in New England: 2018 Report. Prepared for AESC 2018 Study Group. https://www.synapse-energy.com/sites/default/files/AESC-2018-17-080-Oct-ReRelease.pdf.
U.S. Environmental Protection Agency (EPA). 2018. Quantifying the Multiple Benefits of Energy Efficiency and Renewable Energy: A Guide for State and Local Governments. https://www.epa.gov/statelocalenergy/quantifying-multiple-benefits-energy-efficiency-and-renewable-energy-full-report.
Woolf, T., C. Neme, M. Kushler, S.R. Schiller, and T. Eckman. 2017. National Efficiency Screening Project. National Standard Practice Manual for Assessing Cost-Effectiveness of Energy Efficiency Resources. https://nationalefficiencyscreening.org/the-national-standard-practice-manual-for-energy-efficiency/.
April 2020 www.seeaction.energy.gov A-1
Appendix A. Example Valuation Methods and Practices Applicable to Demand Flexibility in Grid-Interactive Efficient Buildings This appendix provides more detailed discussion of commonly used methods to derive the economic value of DERs for grid services, particularly examples of utilities and other entities employing them. All of these methods can be used to determine the value of demand flexibility in grid-interactive efficient buildings.
System Capacity Expansion/Market Models
The most comprehensive method for determining the value of DERs for grid services is using system capacity expansion models. Utilities and other entities use generation, transmission, and distribution capacity expansion models to evaluate the reliability, cost, and sometimes risk of alternative system expansion plans. These models are primarily used to estimate the value of energy, capacity, ancillary services, and T&D system capacity deferrals. The models also can be used to estimate the value of DRIPE,77 avoided RPS compliance costs, and avoided environmental compliance costs.
Distribution capacity expansion models can be used to determine the hosting capacity (i.e., the estimated amount of distributed generation that can be accommodated on individual feeders without significant distribution system upgrades) as well as locational capacity value. Models range from highly complex computer simulations of the power system at very high time resolution (seconds, minutes) to relatively simple spreadsheets that track loads on feeders and substations and project the need for distribution system capacity expansion based on historical growth trends.
Two general approaches can estimate the value of grid services provided by energy efficiency, demand response, and other DERs in these capacity expansion modeling processes. The most prevalent approach is to simply reduce the growth rates of energy (and sometimes peak) demand in the load forecast that are inputs for these models. Then, based on the lower load forecast, the capacity expansion model optimizes the type, timing, and amount of new conventional resources (generation and/or T&D) that maintain system reliability at the lowest system cost on a net present value basis. This modeling approach assumes that DERs are price-takers and not price-makers. That is, the development of energy efficiency, demand response, and other DERs does not impact the type, amount, or development schedule of conventional resource development sufficiently to alter the avoided cost of the utility system being modeled.
An alternative, though less prevalent, approach tests whether DERs might be price-makers, due to their impacts on the type, amount, and schedule of conventional resource development. PacifiCorp’s 2017 IRP78 and all NWPCC regional power plans, including the most recent Seventh Power Plan, use this approach.79 Also discussed in this section is NV Energy’s use of distribution capacity expansion modeling to estimate hosting capacity and locational capacity value. This approach treats energy efficiency, demand response, and other DERs as resource options directly in the capacity expansion modeling process. It allows DERs to compete with conventional resources in the model to determine their impact on system load growth and load shape and thus impact on conventional resource
77 DRIPE is a measurement of the value of demand reductions in terms of the decrease in wholesale energy prices, resulting in lower total expenditures on electricity or natural gas across a given grid. SEE Action Network Industrial Energy Efficiency & Combined Heat and Power Working Group. 2015. State Approaches to Demand Reduction Induced Price Effects: Examining How Energy Efficiency Can Lower Prices for All. 78 https://www.pacificorp.com/energy/integrated-resource-plan.html. 79 https://www.nwcouncil.org/reports/seventh-power-plan.
April 2020 www.seeaction.energy.gov A-2
development and avoided costs for the utility system. In other words, this approach accounts for interactions between DERs and the utility system in which they would be installed.80
New England: The 2018 AESC study for New England used a variation of this approach, assuming no additional energy efficiency impacts on load growth.81 The study provides estimates of avoided costs associated with energy efficiency measures for program administrators throughout New England states for both internal decision-making and regulatory filings. To determine the values of energy efficiency (and other demand-side measures), the study team calculated avoided costs for each New England state in a hypothetical future in which no new energy efficiency measures are installed in 2018 or later years. The study examined avoided costs of energy, capacity, natural gas, fuel oil, other fuels, other environmental costs, and DRIPE. It relied on a combination of models to estimate each one of these costs for each future year.
The 2018 study provided a forecast of avoided energy costs on an hourly basis. This allows users of the report to estimate avoided costs specific to a broad array of active demand response programs, including active load management and peak load shifting programs. Recognizing the limitations of this approach, the study authors note that because the reference case represents a theoretical future in which no new energy efficiency measures are put into place, the study should not be used to infer information about actual future market conditions, energy prices, or resource builds in the region.
PacifiCorp: A vertically integrated utility operating in six western U.S. states,82 PacifiCorp completes an IRP every two years with a 20-year horizon. The process identifies a preferred resource portfolio that represents the best combination of cost and risk from a broad set of potential portfolios. PacifiCorp develops energy efficiency and demand response supply curves to represent the amount of savings (kWh and kW) available across a range of levelized costs. The company then uses System Optimizer, a commercially available capacity expansion model, to develop candidate resource portfolios under a range of assumptions about future conditions.83 System Optimizer determines the cost-effective mix of energy efficiency and demand response for each portfolio and for each scenario by comparing supply-side and demand-side resource options on a consistent and comparable basis. In order to select its preferred resource portfolio, PacifiCorp compares different least-cost portfolios derived from System Optimizer based on relative cost and risk.
Once the System Optimizer model has developed candidate portfolios, PacifiCorp compares those portfolios using its Planning & Risk production cost simulation model to select a preferred portfolio. The Planning & Risk model estimates the production costs and risks of each candidate resource mix portfolio by running 50 simulated scenarios over the 20-year forecast horizon for each portfolio. These scenarios are created by using inputs derived by sampling distributions of stochastic variables (e.g., wholesale prices, thermal unit outages, natural gas prices, and load growth).
80 See Frick et al. 2018 for a more detailed discussion. 81 Synapse Energy Economics et al. 2018. As in previous AESC studies, a group of electric and gas utilities and other efficiency program administrators sponsored the study. The study sponsors, along with other parties (including representatives from state governments, utility consumer representatives, other stakeholders, and consultants) oversaw the design and production of the analysis and report. 82 Operating as Pacific Power in California, Oregon, and Washington and as Rocky Mountain Power in Idaho, Utah, and Wyoming. 83 The most recent version of System Optimizer is ABB’s Ability Capacity Expansion model: https://new.abb.com/enterprise-software/energy-portfolio-management/commercial-energy-operations/capacity-expansion.
April 2020 www.seeaction.energy.gov A-3
PacifiCorp accounts for the risk reduction benefits of energy efficiency and demand response in two ways. First, the utility includes their impacts on load growth when determining the reserve margin. The reduced cost of reserves adds to the value of energy efficiency and demand response resources. Second, PacifiCorp discounts the cost of acquiring energy efficiency through the application of a stochastic risk reduction credit. To establish this credit, the utility uses its Planning & Risk model to produce two production cost dispatch simulations for each resource portfolio: one on a deterministic basis and the other on a stochastic basis. The stochastic risk reduction credit level is the dollar-per-MWh difference between the production costs in the two simulations. The risk credit is then used to reduce the levelized cost of each of the 27 energy efficiency bundles in PacifiCorp’s energy efficiency supply curve.84 PacifiCorp updated the methodology in its 2017 IRP to apply the stochastic risk reduction credit on an hourly basis to better match cost-effectiveness analyses of efficiency programs with hourly resource values. The primary reason the utility includes a risk reduction credit for energy efficiency is because this resource does not have variable fuel costs that would be affected by market volatility.
NWPCC. The NWPCC is an interstate agency charged with developing a regional IRP for four states: Washington, Oregon, Idaho, and Montana. The NWPCC uses its capacity expansion model, the Resource Portfolio Model (RPM),85 to develop the resource strategy for its regional power plans. The RPM is an electric IRP model developed by the NWPCC to identify adaptive, least-cost resource strategies for the region. The model uses a sophisticated and unique risk analysis methodology that involves simulating numerous candidate resource plans across a broad range of possible futures (800 futures in the most recent plan) to identify trade-offs between expected cost and risk. Before energy efficiency resources can be included in an NWPCC regional plan, resources are screened for cost-effectiveness directly in the RPM.
Since its first plan in 1983, the NWPCC has treated energy efficiency as a resource option in its capacity expansion modeling process for cost-effectiveness screening by competing energy efficiency directly with generating resource options in the optimization process. The NWPCC characterizes energy efficiency with parameters that generally mirror those the model uses to describe generating resource options (e.g., levelized cost, energy and capacity output, development lead times, load shape). Specialized logic in the RPM addresses specific characteristics that are unique to deployment of energy efficiency resources. Appendix G: Conservation and Direct Application Renewables86 of the NWPPC’s Seventh Power Plan87 describes the methodology for determining the cost-effectiveness of energy efficiency.
Nevada: The state legislature passed Senate Bill 146 in 2017, requiring utilities to file Distributed Resource Plans (DRPs).88 In 2018, the Public Utilities Commission of Nevada amended its administrative code to require utilities to include a DRP with their IRPs.89 The DRP identifies and assesses the locational benefits and costs of distributed generation, demand response, energy efficiency, electric vehicles, and storage. Utilities must include a Locational Net Benefit Analysis to assess the impact of DERs on long-term system needs in terms of load growth and reliability and inform the process of procuring non-wires solutions; hosting capacity analysis with multiple scenarios and online maps; and a Grid Needs Assessment that compares traditional and distributed resource solutions to forecasted T&D constraints. These analyses inform the utility’s preferred IRP resource mix. The Commission
84 For the 2017 IRP, the risk credit was $5.03/MWh. 85 For a more detailed description of the RPM, see https://www.nwcouncil.org/regional-portfolio-model. 86 https://www.nwcouncil.org/sites/default/files/7thplanfinal_appdixg_consresources_1.pdf. 87 https://www.nwcouncil.org/reports/seventh-power-plan. 88 https://www.leg.state.nv.us/App/NELIS/REL/79th2017/Bill/4982/Text. 89 http://pucweb1.state.nv.us/PDF/AxImages/DOCKETS_2015_THRU_PRESENT/2017-8/33255.pdf.
April 2020 www.seeaction.energy.gov A-4
determines the prudence of the analytical basis for the utility’s DRP recommendations when considering approval of the IRP.
NV Energy’s 2019 DRP filing90 based its Locational Net Benefit Analysis on quantification of Commission-identified benefit and cost variables associated with DERs: the value of deferring, as well as avoiding, upgrades for T&D; avoided energy, generation capacity, and ancillary services costs; and reduced T&D losses. To quantify the value of non-wires solutions, NV Energy uses the Synergi model, simulation software for electrical distribution system power flows. Using Synergi’s Incremental Hosting Capacity Analysis and Engineering Analysis tools, the utility conducted a baseline load flow analysis to estimate hosting capacity limits for individual distribution feeder sections. The utility calculated the Present Worth of Revenue Requirement for location-specific resource options to compare traditional investments and non-wires solutions to determine the most cost-effective option for meeting T&D system needs.
Competitive Bidding/Auctions
This approach uses market mechanisms to determine the economic value of both new and existing resources for providing grid services. Both centrally-organized wholesale electricity markets and vertically integrated utilities use such approaches. For example, ISO-NE and PJM allow demand response to bid into forward capacity, energy, and ancillary services (operating reserves and regulation services) markets, and additional DERs can participate in forward capacity markets.
Beyond establishing the avoided cost (i.e., value) of new capacity, ISO/RTOs use competitive market mechanisms to determine the value of other services, such as ancillary services (frequency and voltage regulation, operating reserves) and transmission capacity deferral. Demand response resources that are dispatchable are fully integrated into the energy and operating reserves markets along with generation resources. Demand response can participate in forward reserve and real-time reserve markets along with generators. Non-dispatchable energy efficiency physically cannot provide regulation or reserves so it cannot participate in those markets.
In each of the examples cited below, the cost of the most expensive resource for which a bid is accepted for a particular grid service establishes its avoided cost. As long as resources are providing comparable grid services, their value is the same whether they are provided by conventional generation, traditional distribution or transmission solutions, or DERs. These same competitive bidding/auction methods, with some minor modification or enhancements, can be used to value DERs that provide demand flexibility for grid services. Clearing prices in organized wholesale markets, however, do not include distribution system locational benefits and may not reflect the value of transmission system deferral.
ISO-NE: ISO-NE holds an annual Forward Capacity Auction to procure capacity resources three years in advance of when the resources must provide service. The ISO uses the bids it receives to build supply curves for the entire New England Control Area and for each capacity zone (i.e., load zones that are geographic sub-regions of the New England Control Area).91
90 http://pucweb1.state.nv.us/PDF/AxImages/DOCKETS_2015_THRU_PRESENT/2019-4/37375.pdf. 91 To build the supply curve, ISO-NE holds a Forward Capacity Auction annually with up to eight rounds per day on up to five consecutive business days. Project sponsors offer incrementally lower bids for energy resources pairing quantity (MW) they can provide and price ($/kW-month) at which they are willing to provide it. (The bid price must be below the start-of-round price or the end-of-round price for the previous round.) The point at which the market clears (i.e., where supply meets demand)
April 2020 www.seeaction.energy.gov A-5
The auction uses a downward-sloping demand curve designed to procure sufficient capacity to maintain resource adequacy and reduce price volatility over time, yielding smaller swings in capacity prices when the market moves from conditions of excess supply to periods when the region or zone needs new capacity resources. The demand curve’s shape is defined by: (1) the estimated gross entry cost, or Cost of New Entry (CONE), for a new capacity resource and (2) the estimated gross entry cost, net of revenues from energy, reserve, and other markets (Net CONE). Net CONE is the levelized capacity revenue that a new resource would need in its first year of operation to be economic, given reasonable assumptions about net revenues. Estimating CONE and Net CONE values accurately for new entrants is an important design criterion to achieve desired reliability objectives. ISO-NE sets a lower bound on the value of capacity in the auction to reduce the potential that suppliers might exercise market power.92
Separate forecast demand curves are created to establish both systemwide capacity needs and capacity needs within distinct capacity zones to reflect whether they are import-constrained, export-constrained, or neither. Further, ISO-NE holds annual and monthly “reconfiguration auctions” that allow capacity suppliers (or the ISO) to sell or buy capacity obligations closer to the delivery period to account for delays in construction or resource buildout, availability of additional supply, changes in demand, and so on.
PJM: Similar to ISO-NE, PJM uses its RPM to procure resources and price-responsive demand through a multi-auction structure consisting of a Base Residual Auction, Incremental Auctions, and bilateral market contracts.93 The Base Residual Auction held three years prior to the delivery year procures resources to meet forecasted future capacity needs. Energy efficiency and demand response resources are eligible. The auction uses a “market clearing optimization” computer model designed to minimize capacity procurement costs. The optimization algorithm in the model determines a clearing price for each of the 27 locational deliverability areas (LDAs) or sub-regions served by PJM, which are individually evaluated for locational constraints. This clearing price, with some adjustment, is the marginal value of system capacity for that LDA.94
New York ISO (NYISO): Energy and capacity markets also can be used to estimate the economic value of transmission system capacity deferrals. For example, like other ISOs/RTOs, NYISO captures the economic value of deferring transmission system capacity by calculating marginal congestion prices based on the cost of relieving congestion in a locale.95 The marginal congestion price is the difference between the marginal cost of energy at the
determines capacity prices for the auction and subsequently the value of peaking capacity for both supply- and demand-side resources. https://www.iso-ne.com/markets-operations/markets/forward-capacity-market/fcm-participation-guide/about-the-fcm-and-its-auctions; https://www.iso-ne.com/static-assets/documents/regulatory/tariff/sect_3/mr1_sec_13_14.pdf (especially Section III.13.2.3.3). 92 See ISO-NE CONE and ORTP Analysis - An evaluation of the entry cost parameters to be used in the Forward Capacity Auction to be held in February 2018 (FCA-12) and forward. Dec. 2, 2016. https://www.iso-ne.com/static-assets/documents/2016/11/a4_cea_cone_ortp_report_clean.docx. 93 In addition to its Base Residual Auction, PJM operates Incremental Auctions to procure additional resources (due to changes in market dynamics known prior to the delivery year). Bilateral market contracts supply any gaps between load obligations and commitments from the auctions. 94 The final resource clearing price in each LDA is the marginal value of system capacity plus Base Capacity Resource (and Demand Resource) Decrements (if any) and a Locational Price Adder (if any are relevant to the LDA). PJM Manual 18: PJM Capacity Market, Revision: 41, Effective Date: Jan. 1, 2019. Prepared by Capacity Market Operations. https://www.pjm.com/~/media/documents/manuals/m18.ashx. 95 Transmission upgrades have historically been driven primarily by reliability, rather than potential economic benefits of reduced congestion.
April 2020 www.seeaction.energy.gov A-6
maximum limit of the transmission line for that location and the marginal cost of the next unit of energy demanded (from the next available generator in the load schedule). NYISO uses its Location Based Marginal Prices—“the cost to provide the next MW of load at a specific location in the grid”—to determine marginal congestion prices, and by inference the value of relieving that congestion through transmission upgrades, adding generation or installing DERs within the congested area. The Location Based Marginal Price consists of three components: the marginal energy price, the marginal loss price (which captures transmission losses), and the marginal congestion price.96
Puget Sound Energy: Some vertically integrated utilities, after completing IRP or other long-range resource planning processes or in some cases as part of these processes, may (or are sometimes required to) issue RFPs to meet any future needs for energy and/or peaking capacity identified. These bids are then used to establish the avoided cost or economic value of individual grid services.
Puget Sound Energy, the largest investor-owned utility in Washington state, acquires new energy resources through an RFP process to obtain competitive prices for purchasing power, acquiring existing generation facilities, and developing new resources, including energy efficiency and demand response.97 The utility updates its IRP every two years. That serves as the basis for determining its future need for energy and capacity to maintain reliability and its renewable energy needs to satisfy the state’s RPS. When the IRP identifies resource needs within the next three years, the utility issues an RFP for resources. The utility screens and ranks responses to the RFP based on costs, risks, and benefits, including comparing both quantitative and qualitative factors of submitted proposals. The five primary criteria include compatibility with resource needs, cost minimization, risk management, public benefits, and strategic and financial considerations.98 Risk analysis evaluates interactions among the resources in potential resource portfolios using the Plexos99 production cost model to “quantify the flexibility value” of resources. The utility creates a short list of submitted resource bids with the lowest reasonable cost and risk and then negotiates with bidders on both price and non-price factors, updating its analysis as needed. The capacity and energy costs of resources secured through the RFP process serve as inputs to the utility’s valuation of energy efficiency and demand response that it might acquire or develop.100
Hawaiian Electric Companies (HECO): Rather than develop planning estimates of the cost of alternative resources to meet grid service needs, HECO simply issues solicitations for grid services from customer-sited DERs.101 The company uses a competitive RFP process to procure grid services including capacity and ancillary services, such as
96 https://www.nyiso.com/documents/20142/3036629/Locational%20Based%20Marginal%20Pricing.pdf/4d9d692b-6fc3-88a9-ba31-5353786d4c58. 97 The utility administers a comprehensive program to acquire energy efficiency identified in its IRP as cost-effective. See https://www.pse.com/-/media/PDFs/001-Energy-Supply/001-Resource-Planning/8a_2017_PSE_IRP_Chapter_book_compressed_110717.pdf. 98 For more, see 2018 All Resource RFP, Ex A Evaluation Criteria: https://www.pse.com/-/media/PDFs/001-Energy-Supply/003-Acquiring-Energy/2018_All_Resources_RFP_Ex_A.PDF?la=en&revision=723a2b04-5f80-418b-b5eb-15e826de30dc&hash=343088D5F642535999D9CF7747801CC58ED413EA. 99 Available from Energy Exemplar: https://energyexemplar.com/products/plexos-simulation-software/. 100 https://www.pse.com/-/media/PDFs/001-Energy-Supply/003-Acquiring-Energy/2018_All_Resources_RFP_Main.pdf?la=en&revision=c6105e1b-8028-434c-bda4-024401adb8e2&hash=8BCE52167CC1F6D74F4715CA0E6341EE90888D7D. 101 https://www.hawaiianelectric.com/products-and-services/demand-response/rfp-for-grid-services-from-customer-sited-distributed-energy-resources.
April 2020 www.seeaction.energy.gov A-7
services to support contingency reserves.102 As part of a renewable resource procurement plan, the Hawaii Public Utilities Commission ordered HECO to issue RFPs with the expectation that the procured resources will replace the capacity, energy, and ancillary services that will be lost with the planned closure of two currently operating fossil-fuel generating plants.103 The RFP process is designed to be consistent with HECO’s Power Supply Improvement Plans for adhering to the state-mandated goal of 100% renewable energy use by 2045. HECO evaluates the competitive bids, ranking and scoring all proposals with a 50/50 weighting for price and non-price criteria. The price criteria consist of a $/kW cost for each grid service on each island. While HECO uses eight non-price criteria, the three most important (weighted doubly) are: (1) conformance with the utility’s Code of Conduct standards; (2) conformance with information assurance policies; and (3) participant acquisition strategy. HECO selects a short list of the highest ranked proposals, then solicits best and final offers from proposers.104
Proxy Resources
This approach uses the cost of a resource that provides comparable grid services to establish their value. For example, the value of energy savings (kWh) might be based on either the stand-alone cost (LCOE), or the cost when integrated into an existing system (LACE), of a new natural gas-fired combined-cycle combustion turbine (CCCGT). Thus, either the turbine’s LCOE or LACE might serve as a proxy for the value of energy savings. Similarly, the cost (LCOE or LACE) of a new simple-cycle gas-fired turbine or reciprocating engine might represent the levelized cost of new peaking capacity (kW) and therefore the value of peak capacity savings. Proxy values for other grid services or benefits also could be used. For example, the average systemwide value of deferred T&D can be based on surveys of the historical cost of adding T&D capacity experienced by utilities within a state or region, rather than a single utility’s experience.
In California, an Avoided Cost Calculator uses the avoided cost of a new CCCGT to determine the long-run energy market price—the avoided cost realized from energy or demand savings. The Calculator establishes the price such that the unit is made whole (i.e., its market revenues and capacity market payments are equal to its fixed, variable and carbon emission allowance costs). The Calculator uses on-peak and off-peak forward market prices for short-term avoided costs. To calculate long-run energy market prices, the methodology uses the implied heat rate from the last year of available forward market data to determine the corresponding carbon emission rates and allowance costs and variable costs in all subsequent years. It sums these costs and, to make the CCCGT whole, adjusts them through an energy market calibration factor.105 If through capacity and energy markets the CCCGT would collect more revenue than it needs to cover costs, the market calibration factor adjusts the price so that
102https://www.hawaiianelectric.com/documents/clean_energy_hawaii/producing_clean_energy/competitive_bidding/20190401_phase_2_draft_rfp_book_3.pdf. 103https://www.hawaiianelectric.com/documents/clean_energy_hawaii/producing_clean_energy/competitive_bidding/order_36187.pdf. 104https://www.hawaiianelectric.com/documents/clean_energy_hawaii/producing_clean_energy/competitive_bidding/20190401_phase_2_draft_rfp_book_3.pdf. 105 The methodology to determine the calibration factor first sets the factor to 100%, then adjusts it by the forecasted increase between a base year annual day-ahead price and the annual day-ahead price for the year of analysis. For capacity costs, the methodology multiplies the adjusted day-ahead price by the real-time hourly price shape, determines revenue based on the results, and adds a set percentage for ancillary services revenue. Subtracting the sum of the price and the ancillary services revenue from the levelized cost of a new combustion turbine, plus O&M costs, yields the capacity value. For energy costs, the methodology multiplies the adjusted annual day-ahead price by the day-ahead hourly price shape. It then calculates the difference between that price and the dispatched revenue of a CCCGT (using levelized cost of a new CCCGT plus fuel and O&M costs) and decreases or increases the calibration factor based on whether the result shows excess or deficient revenue. http://www.cpuc.ca.gov/WorkArea/DownloadAsset.aspx?id=6442454812.
April 2020 www.seeaction.energy.gov A-8
revenue and costs are in line. The Calculator values capacity at the levelized capital cost of a simple-cycle combustion turbine plus carbon emission allowance costs, minus any potential net revenue (i.e., the difference between energy revenues and energy costs) from energy and ancillary services markets.106
Use of proxy resources to establish the value of grid services requires special considerations and has limitations. First, the proxy resource selected should be the most likely competitive alternative for providing the grid service that could be supplied by investments in energy efficiency, demand response, and other DERs. The methodology also requires that the grid service provided by the proxy resource and the resource to which it is being compared provide equivalent grid services. Further, the cost of these proxy resources can be based on their stand-alone mode, rather than their actual cost when integrated into the utility system. Concerns regarding the validity of these assumptions may lead to the development and use of more sophisticated analytical models.
Administrative/Public Policy Determinations
Jurisdictions may simplify compliance with a preferred policy direction by determining administratively the value of benefits listed earlier in this report. This approach relies on legislative or regulatory action to establish the value of these benefits, particularly those that are difficult to quantify analytically. While there may be some analytical basis for the values selected, policy or regulatory considerations largely drive the final determination. Following are examples for two grid benefits from energy efficiency and demand response that have proven difficult to quantify: the value of risk reduction and the value of reduction in greenhouse gas emissions.
Vermont: The Public Utilities Commission (formerly the Public Service Board) approves the avoided costs used to value demand-side energy services (including externality adjustments) for the energy efficiency utilities that provide those services in the state. To account for supply-side risks avoided, in 1990 it approved (and renewed in 2015) a 10% risk adjustment. It is applied as a discount to the cost of non-fuel-switching demand-side measures for screening cost-effectiveness of energy efficiency measures.107 108
California: The California Air Resources Board is responsible for administering the state’s cap and trade program to meet legislative mandates for greenhouse gas emissions. California Air Resources Board sets limits administratively, creating a market that establishes a price (i.e., value) on carbon dioxide by capping the number of available allowances.109 Thus, this approach combines both administrative and market mechanisms to establish the economic value of reduced emissions.
California’s Avoided Cost Calculator breaks out carbon costs from energy costs and uses these market prices to value the avoided cost of carbon. For avoided costs, the methodology uses the mid-case forecast values of Carbon Allowance Price Projections from the California Energy Commission’s Integrated Energy Policy Report. The current forecast (2017) extends to 2030, after which the Calculator uses values from the final five years of the forecast to extrapolate a linear trend for the remaining years. To estimate the marginal rate of emissions, the Calculator assumes the marginal fuel is natural gas (in all hours) and uses the day-ahead market price curve to determine the heat rate (set to equal the difference between the hourly market price and the O&M costs for the plant, divided by the sum of the fuel cost and the carbon price multiplied by the emission factor).110
106 See http://www.cpuc.ca.gov/general.aspx?id=5599 and http://www.cpuc.ca.gov/WorkArea/DownloadAsset.aspx?id=6442454812. 107 The Vermont Public Service Board also established a 15% non-energy benefits adder to the utility system (e.g., energy) in cost-effectiveness analyses of energy efficiency to account for hard-to-quantify benefits that factor into participant decision-making, and an additional 15% adder for low-income benefits. Order No. 5270, 1990. 108 https://puc.vermont.gov/sites/psbnew/files/doc_library/order-re-eeu-avoided-cost-2016-2017.pdf. 109 https://www.arb.ca.gov/cc/capandtrade/capandtrade.htm. 110 http://www.cpuc.ca.gov/WorkArea/DownloadAsset.aspx?id=6442454812.
April 2020 www.seeaction.energy.gov A-9
Special Studies
The quantification and monetization of some utility system benefits from energy efficiency, demand response, and other DERs may be best captured through specifically targeted research and analysis. For example, analysis of environmental regulations and health impacts data might be required to assess the ability of energy efficiency to reduce future environmental damage costs. The value of avoiding distribution or transmission upgrades through the use of non-wires solutions is location- and project-dependent and likely will require targeted analysis. In addition, planning for long-duration power interruptions caused by high-impact, low-probability events requires dedicated approaches to increasing power system resilience. Although DERs offer resilience benefits, determining the value of those benefits is a relatively new endeavor, and methodologies are still under development. The four special studies described below use distributed solar PV to illustrate potential environmental and resilience benefits of DERs.
Minnesota: The Minnesota value of solar methodology111 recognizes the value provided by DERs in avoiding environmental costs, based on externality costs published by the state and EPA. For all pollutants other than carbon dioxide, externality costs are the midpoint of the low and high values for the urban scenario, adjusted to current dollars, converted to a fuel-based value. For example, the average externality cost for particulate emissions less than 10 microns in diameter (PM10) is $8,917 per ton of PM10 emissions in the year 2020.112 The environmental cost is the sum of the costs of all pollutants. This total externality cost is multiplied by the statewide average heat rate for the year, then converted from Btu to MMBtu, to calculate environmental costs in dollars per kWh for each year. The present value of these costs is calculated using the state’s environmental discount factor, which is based on a societal discount rate.
Consolidated Edison: The utility’s Benefit Cost Analysis Handbook examines net avoided sulfur dioxide (SO2) and nitrous oxides (NOx) as an external benefit of DERs.113 It considers the costs of these pollutants as already embedded in energy prices due to the utility’s participation in the regional cap and trade program. Customer-sited generation units under 25 MW do not participate in that program. Therefore, the utility provides a methodology for calculating the value for avoiding environmental damage costs. Each facility’s energy production, adjusted for line losses, is multiplied by the average pollutant emissions rate for the utility system and the estimated cost per ton of monetized damages to society for SO2 and NOx, based on externality costs published by EPA.
National Association of Regulatory Utility Commissioners: NARUC recently released a report that discusses current approaches to valuing resilience for DERs114 and identifies two broad categories of analysis: economy-wide and bottom-up. Each category encompasses a variety of data collection approaches (e.g., stated preference versus revealed preference approaches) and quantitative tools (e.g., ICE Calculator, FEMA BCA, and IMPLAN). Four case studies correspond to four methods that have been used to analyze the resilience value of DERs: contingent valuation, defensive behavior method, damage cost method, and input-output modeling.
The report evaluates the various methods according to usefulness to state utility regulators using four criteria: ease of use, scope of outputs, geographic scalability, and power interruption duration analysis capability. While the
111 https://www.cleanpower.com/wp-content/uploads/MN-VOS-Methodology-2014-01-30-FINAL.pdf. 112 $8,917 per ton of PM10, divided by 2,000 pounds per ton, multiplied by 0.007 pounds of PM10 per million Btu = $0.031 per million Btu. 113 Consolidated Edison 2018. 114 Rickerson et al. 2019.
April 2020 www.seeaction.energy.gov A-10
valuation methodologies examined in the report may be useful in regulatory decision-making, none of the methods reviewed met all four criteria.115
ICE Calculator: Berkeley Lab and Nexant, Inc. developed the ICE Calculator to help utilities, regulators, and other stakeholders value the benefits from investments in power system reliability.116 Many utilities use the ICE Calculator and reference it in regulatory proceedings. For example, Dominion Energy in Virginia used it to monetize benefits to their customers resulting from improved grid reliability. 117 Pepco (Maryland) used the ICE Calculator to monetize resilience benefits of proposed microgrids in Largo and Rockville.118 Oklahoma Gas and Electric used the ICE Calculator as part of an assessment of grid modernization plans in Arkansas.119
The ICE Calculator is a useful tool to estimate short-duration power interruption costs—or the avoided interruption costs from investments in reliability. The tool is based on customer interruption cost survey data that focused on power interruption scenarios lasting 16 hours or less and is limited to the direct costs to customers. For these reasons, Berkeley Lab and other researchers do not recommend using the ICE Calculator to value the avoided direct and indirect economic impacts of longer duration power disruptions (i.e., resilience events).120 The ICE Calculator is based on 37 customer interruption surveys completed by a number of utilities across the country. The surveys asked residential customers what they would be willing to pay to avoid a power interruption and about the direct costs borne by commercial and industrial customers.121
The tool uses econometric modeling of the survey results to construct customer damage functions for residential, small commercial and industrial customers, and medium/large commercial and industrial customers. It provides interruption costs by customer class, expressed as cost per event, cost per average kW, cost per unserved kWh, and total cost of all interruptions. The ICE Calculator also allows users to generate the avoided cost (value) of a hypothetical reliability improvement.
115 In addition to providing resilience value for the utility system, DERs provide resilience value to building owners and occupants. For example, energy-efficient buildings can better maintain temperatures during power outages. Coupled with demand flexibility, these buildings may require smaller and less costly onsite emergency generation or microgrids. Further, demand flexibility might be capable of providing or enhancing priority building services during brownouts. 116 For more on the ICE Calculator, see https://icecalculator.com/home and https://emp.lbl.gov/projects/economic-value-reliability-consumers; for more on utility applications of value-based reliability planning, see https://emp.lbl.gov/projects/utility-applications-value-based. 117 https://www.dominionenergy.com/library/domcom/media/about-us/electric-projects/grid-transformation/gtsa-072418.pdf. 118 The Maryland Public Service Commission ultimately decided that it could not quantify the value of resilience. See https://pubs.naruc.org/pub/531AD059-9CC0-BAF6-127B-99BCB5F02198. 119 http://www.apscservices.info/pdf/18/18-046-FR_34_1.pdf. 120 See https://pubs.naruc.org/pub/531AD059-9CC0-BAF6-127B-99BCB5F02198. Also see Larsen, P., A. Sanstad, K. LaCommare, and J. Eto (eds.). 2019. Frontiers in the Economics of Widespread, Long-Duration Power Interruptions: Proceedings from an Expert Workshop. 121 http://eta-publications.lbl.gov/sites/default/files/interruption_cost_estimate_guidebook_final2_9july2018.pdf
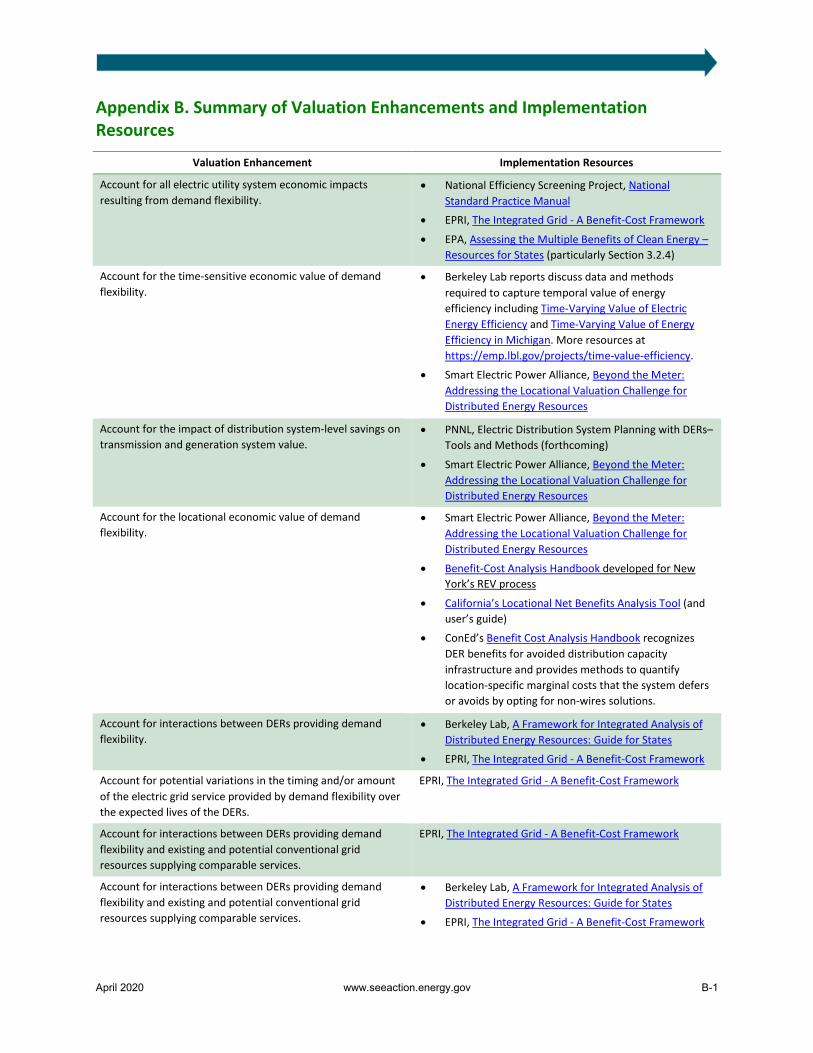
April 2020 www.seeaction.energy.gov B-1
Appendix B. Summary of Valuation Enhancements and Implementation Resources
Valuation Enhancement Implementation Resources
Account for all electric utility system economic impacts resulting from demand flexibility.
• National Efficiency Screening Project, National Standard Practice Manual
• EPRI, The Integrated Grid - A Benefit-Cost Framework
• EPA, Assessing the Multiple Benefits of Clean Energy – Resources for States (particularly Section 3.2.4)
Account for the time-sensitive economic value of demand flexibility.
• Berkeley Lab reports discuss data and methods required to capture temporal value of energy efficiency including Time-Varying Value of Electric Energy Efficiency and Time-Varying Value of Energy Efficiency in Michigan. More resources at https://emp.lbl.gov/projects/time-value-efficiency.
• Smart Electric Power Alliance, Beyond the Meter: Addressing the Locational Valuation Challenge for Distributed Energy Resources
Account for the impact of distribution system-level savings on transmission and generation system value.
• PNNL, Electric Distribution System Planning with DERs–Tools and Methods (forthcoming)
• Smart Electric Power Alliance, Beyond the Meter: Addressing the Locational Valuation Challenge for Distributed Energy Resources
Account for the locational economic value of demand flexibility.
• Smart Electric Power Alliance, Beyond the Meter: Addressing the Locational Valuation Challenge for Distributed Energy Resources
• Benefit-Cost Analysis Handbook developed for New York’s REV process
• California’s Locational Net Benefits Analysis Tool (and user’s guide)
• ConEd’s Benefit Cost Analysis Handbook recognizes DER benefits for avoided distribution capacity infrastructure and provides methods to quantify location-specific marginal costs that the system defers or avoids by opting for non-wires solutions.
Account for interactions between DERs providing demand flexibility.
• Berkeley Lab, A Framework for Integrated Analysis of Distributed Energy Resources: Guide for States
• EPRI, The Integrated Grid - A Benefit-Cost Framework
Account for potential variations in the timing and/or amount of the electric grid service provided by demand flexibility over the expected lives of the DERs.
EPRI, The Integrated Grid - A Benefit-Cost Framework
Account for interactions between DERs providing demand flexibility and existing and potential conventional grid resources supplying comparable services.
EPRI, The Integrated Grid - A Benefit-Cost Framework
Account for interactions between DERs providing demand flexibility and existing and potential conventional grid resources supplying comparable services.
• Berkeley Lab, A Framework for Integrated Analysis of Distributed Energy Resources: Guide for States
• EPRI, The Integrated Grid - A Benefit-Cost Framework