an improvedeeg signal classification using neural …€¦ · an improvedeeg signal classification...
TRANSCRIPT
J Electr Eng Technol Vol. 9, No. ?: 742-?, 2014 http://dx.doi.org/10.5370/JEET.2014.9.?.742
742
An ImprovedEEG Signal Classification Using Neural Network
with the Consequence of ICA and STFT
K. Sivasankari† and K. Thanushkodi*
Abstract – Signals of the Electroencephalogram (EEG) can reflect the electrical background activity of the brain generated by the cerebral cortex nerve cells. This has been the mostly utilized signal, which helps in effective analysis of brain functions by supervised learning methods. In this paper, an approach for improving the accuracy of EEG signal classification is presented to detect epileptic seizures. Moreover, Independent Component Analysis (ICA) is incorporated as a preprocessing step and Short Time Fourier Transform (STFT) is used for denoising the signal adequately. Feature extraction of EEG signals is accomplished on the basis of three parameters namely, Standard Deviation, Correlation Dimension and Lyapunov Exponents. The Artificial Neural Network (ANN) is trained by incorporating Levenberg-Marquardt(LM) training algorithm into the backpropagation algorithm that results in high classification accuracy. Experimental results reveal that the methodology will improve the clinical service of the EEG recording and also provide better decision making in epileptic seizure detection than the existing techniques. The proposed EEG signal classification using feed forward Backpropagation Neural Network performs better than to the EEG signal classification using Adaptive Neuro Fuzzy Inference System (ANFIS) classifier in terms of accuracy, sensitivity, and specificity.
Keywords: Adaptive neuro fuzzy inference system (ANFIS), Backpropagation neural network (BPNN), EEG signal, Epileptic seizure, Independent component analysis (ICA), Levenberg-marquardt algorithm, Neural network classification, Short time fourier transform (STFT), and thresholding.
1. Introduction
Over the past decade myriad researches have been
focusing on automating the examination of EEG signals, recognizing and categorizing the brain diseases. Further, EEG plays a vital role in the detection of epilepsy, which is a chronic disorder due to recurrent seizures varying from muscle jerks on the brain to distinctive convolutions. EEG is a noninvasive technique for probing human brain dynamics, and providing an undeviating measure of cortical action with millisecond temporal resolution. There are two different types of EEG signal depending on where the signal is taken from either the scalp or intracranial based. Electrodes with low impedance are used to provide an accurate detection of the voltage of neuron content. The changes in the voltage are sensed and amplified before being transmitted to a computer program to display the training of EEG recordings. The recorded EEG provides a continuous graphic exhibition of the spatial distribution of the changing voltage fields over time. The epileptic form of EEG includes abnormal electrical activity generated during the occurrence of seizure. In most cases, the presence of
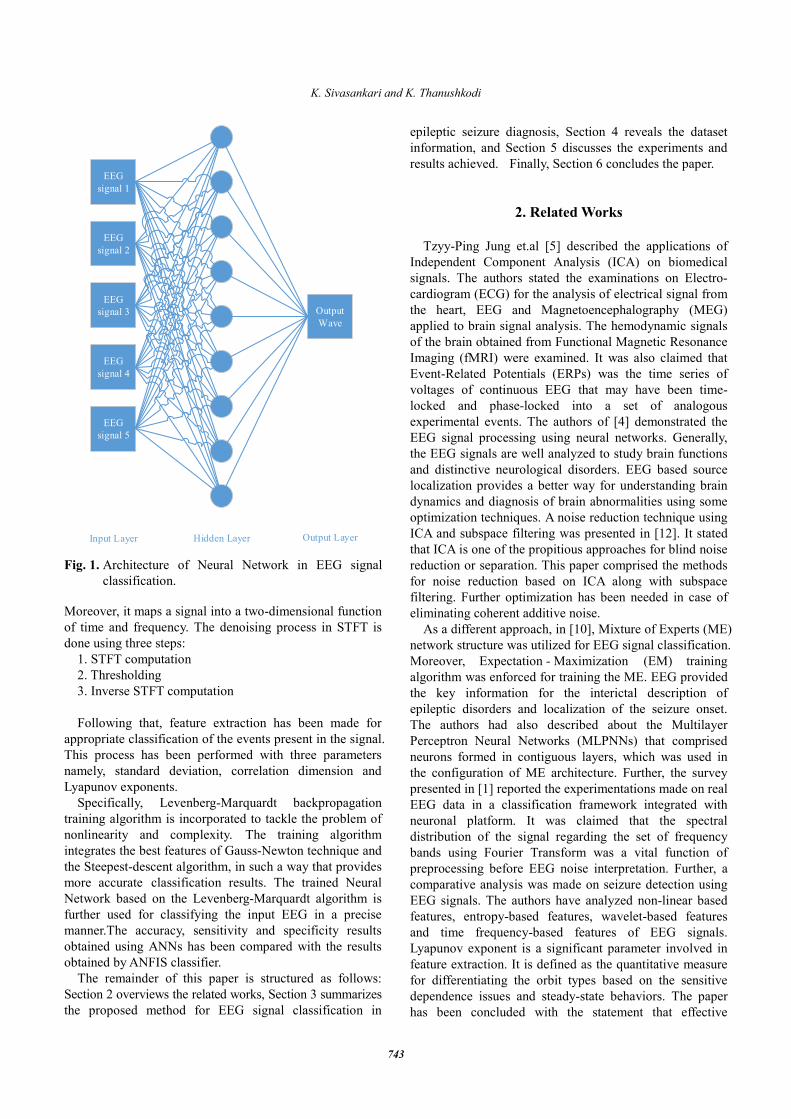
seizures cannot be determined with short period EEG recordings. In such cases, EEG is recorded continuously and its entire length is analyzed to diagnose the epileptic traces. Fig. 1 presented below depicts the Neural Network architecture in an EEG signal classification.
Independent Component Analysis (ICA) is enforced for finding and eliminating the biased artifacts in EEG signals. Generally, the operation of ICA is to relevant individual signal from the mixed signal. In the present work, ICA algorithm has been used as a preprocessing step for faster operation. Without generality loss, the independent original signals that are overlapped under different conditions can be separated effectively through ICA. It overcomes the blind signal separation problem. In other words, it can also be described that ICA processes raw EEG data and finds features related to various persons activities. Hence, ICA overcomes the problems regarding ensemble averaging. Typically, ICA is applied to remove Electroculogram (EOG) noise from EEG data. Nevertheless, EEG signals are always subject to artifacts and noise due to various external agents. These signals may influence the results of the EEG recording procedure. Hence, there is a need for effective denoising methodology.
Short Time Fourier Transform (STFT) has been incorporated here for denoising, which can effectively reject the artifacts originated in the brain. It is utilized for time-frequency analysis of EEG signals on a routine basis.
† Corresponding Author: Department of Electronics and Communica-tions Engineering, Akshaya College of Engineering and Technology, Coimbatore. ([email protected])
* Director, Akshaya College of Engineering and Technology, Coimbatore. ([email protected])
Received: January 19, 2013; Accepted: January 3, 2014
K. Sivasankari and K. Thanushkodi
743
Moreover, it maps a signal into a two-dimensional function of time and frequency. The denoising process in STFT is done using three steps:
1. STFT computation 2. Thresholding 3. Inverse STFT computation Following that, feature extraction has been made for
appropriate classification of the events present in the signal. This process has been performed with three parameters namely, standard deviation, correlation dimension and Lyapunov exponents.
Specifically, Levenberg-Marquardt backpropagation training algorithm is incorporated to tackle the problem of nonlinearity and complexity. The training algorithm integrates the best features of Gauss-Newton technique and the Steepest-descent algorithm, in such a way that provides more accurate classification results. The trained Neural Network based on the Levenberg-Marquardt algorithm is further used for classifying the input EEG in a precise manner.The accuracy, sensitivity and specificity results obtained using ANNs has been compared with the results obtained by ANFIS classifier.
The remainder of this paper is structured as follows: Section 2 overviews the related works, Section 3 summarizes the proposed method for EEG signal classification in
epileptic seizure diagnosis, Section 4 reveals the dataset information, and Section 5 discusses the experiments and results achieved. Finally, Section 6 concludes the paper.
2. Related Works
Tzyy-Ping Jung et.al [5] described the applications of
Independent Component Analysis (ICA) on biomedical signals. The authors stated the examinations on Electro-cardiogram (ECG) for the analysis of electrical signal from the heart, EEG and Magnetoencephalography (MEG) applied to brain signal analysis. The hemodynamic signals of the brain obtained from Functional Magnetic Resonance Imaging (fMRI) were examined. It was also claimed that Event-Related Potentials (ERPs) was the time series of voltages of continuous EEG that may have been time-locked and phase-locked into a set of analogous experimental events. The authors of [4] demonstrated the EEG signal processing using neural networks. Generally, the EEG signals are well analyzed to study brain functions and distinctive neurological disorders. EEG based source localization provides a better way for understanding brain dynamics and diagnosis of brain abnormalities using some optimization techniques. A noise reduction technique using ICA and subspace filtering was presented in [12]. It stated that ICA is one of the propitious approaches for blind noise reduction or separation. This paper comprised the methods for noise reduction based on ICA along with subspace filtering. Further optimization has been needed in case of eliminating coherent additive noise.
As a different approach, in [10], Mixture of Experts (ME) network structure was utilized for EEG signal classification. Moreover, Expectation - Maximization (EM) training algorithm was enforced for training the ME. EEG provided the key information for the interictal description of epileptic disorders and localization of the seizure onset. The authors had also described about the Multilayer Perceptron Neural Networks (MLPNNs) that comprised neurons formed in contiguous layers, which was used in the configuration of ME architecture. Further, the survey presented in [1] reported the experimentations made on real EEG data in a classification framework integrated with neuronal platform. It was claimed that the spectral distribution of the signal regarding the set of frequency bands using Fourier Transform was a vital function of preprocessing before EEG noise interpretation. Further, a comparative analysis was made on seizure detection using EEG signals. The authors have analyzed non-linear based features, entropy-based features, wavelet-based features and time frequency-based features of EEG signals. Lyapunov exponent is a significant parameter involved in feature extraction. It is defined as the quantitative measure for differentiating the orbit types based on the sensitive dependence issues and steady-state behaviors. The paper has been concluded with the statement that effective
Fig. 1. Architecture of Neural Network in EEG signal classification.
EEG signal 1
EEG signal 2
EEG signal 3
EEG signal 4
EEG signal 5
Input Layer Hidden Layer
Output Wave
Output Layer
An ImprovedEEG Signal Classification Using Neural Network with the Consequence of ICA and STFT
744
seizure detection scheme should have less number of false positive results. Mohseni et.al [8] compared the performance of the conventional variance-based techniques and schemes based on entropies, non-linear time series, logistic regression, time-frequency distributions, and discrete wavelet transform, for epileptic seizure detection. The variance based seizure detection method performs better than the other techniques.
As stated earlier, EEG signals are handled in five categories of standard frequency bands. In [9], the methodology for EEG classification based on those bands has been framed. The method of time delay vector construction was also involved in an adept diagnostic process. Finally, the variation present in the chaos related features of the output differentiated the normal and epileptic brain activity.
Kocyigit et.al [15] designed a MLPNN classifier using Fast ICA approach. The Fast ICA approach was used for projection pursuit and the computations were performed in that aspect. In [19], Wavelet analysis and Genetic Algorithm (GA) were used for optimal classification of epileptic seizures. The EEG epochs were disintegrated by fourth-level wavelet packet decomposition approach based on its frequency bands. Genetic Algorithmwas then utilized to determine the sufficient feature subsets, which enhance the classification performance. The classification is performed by a Learning Vector Quantization (LVQ) based EEG classifier. Since the process used GA, feature selection was focused as the significant process. In another aspect, the Wavelet analysis was performed using ME network structure [22]. The EEG signals were decomposed by discrete wavelet transform in accordance with its time-frequency representations. The spectral analysis was made with the selected data and MLPNN for the effective classification. Recurrent Neural Network (RNN) containing Eigenvector
methods was employed in [11] for EEG signal classify-cation. The process composed of two stages:
1. Feature Extraction using Eigenvector methods 2. Classification based on the extracted features The research also demonstrated the power levels of
Power Spectral Density (PSD) that were obtained by Eigenvector methods. The authors of [20] claimed that the Relative Wavelet Energy (RWE) afforded information about the relative energy combined with the frequency bands of EEG signals and its degree of significance. The classification of EEG signals was based on specific energy distribution. Instead of using Neural Networks for EEG signal classification, Ubeyli [17] used Least Square Support Vector Machine (LS-SVM). The spectral analysis of EEG signals was formed using Burg AutoRegressive- AR, AutoRegressive Moving Average- ARMA, and Moving Average-MA methods. Further, a novel approach called Probabilistic Neural Network (PNN) was presented in [18]. In the appropriate decision making, the work was
performed in two stages: 1. Lyapunov exponent computation 2. Classification using the trained classifier Denoising the EEG signal is also considered as a vital
task to be performed before classification. The authors of [2] combined two methods namely, Empirical Mode Decomposition (EMD) and Higher Order Statistics (HOS) for effective signal denoising. The noisy signals were detected by Gaussianity estimators and removed. The maximum suppression of signal noise was performed with thresholding techniques. In [7], the authors performed a comparative analysis on the performance of STFT, Wavelet Transform (WT), Least Mean Square (LMS) and Recursive Least Square (RLS) in the aspect of denoising and concluded the paper with the statement that adaptive algorithms are the best in denoising the signal.
EEG signal preprocessing performed with wavelet transformation has been described in [13]. The computations were completely performed with WT rather than STFT. However, the scope could be improved with STFT denoising mechanism in further implementations. Next to denoising, feature extraction is a significant process for EEG classification. In [14], the feature extraction techniques were applied for specific application named BCI (Brain Computer Interface). The techniques utilized in this paper were frequency analysis using Fast Fourier Transform, Time analysis, Time-frequency analysis using STFT and Time-frequency-space analysis. The MLP Neural Network was trained with Back propagation algorithm for effective classification of extracted EEG features. An alternative approach for EEG signal classification using k-means clustering combined with MLPNN was explained in [16]. The signals were decomposed into sub-bands by Discrete Wavelet Transform (DWT) and clustering was performed with k-means algorithm.
The authors of [21] also presented significant research methodologies on EEG signal classification for epileptic seizures and brain tumor diagnosis. In [6], wavelet based feature extraction algorithm has been utilized to extract features based on energy, inter quartile range and median absolute deviation. The neural network has then been trained with those features to get the appropriate results. Moreover, the authors have claimed that further research could be carried with classifiers having high potential to compute the detection methodology.
3. Proposed Work
Being a non-stable signal, appropriate analysis is
imperative for EEGto discriminate normal EEG signal and epileptic seizures. In the present work ICA is used as a preprocessing step, STFT for denoising the EEG signals and further, feature extraction has been performed based on parameters such as Standard Deviation, Correlation
K. Sivasankari and K. Thanushkodi
745
Dimension and Lyapunov Exponents. Following the parameterization, classification is
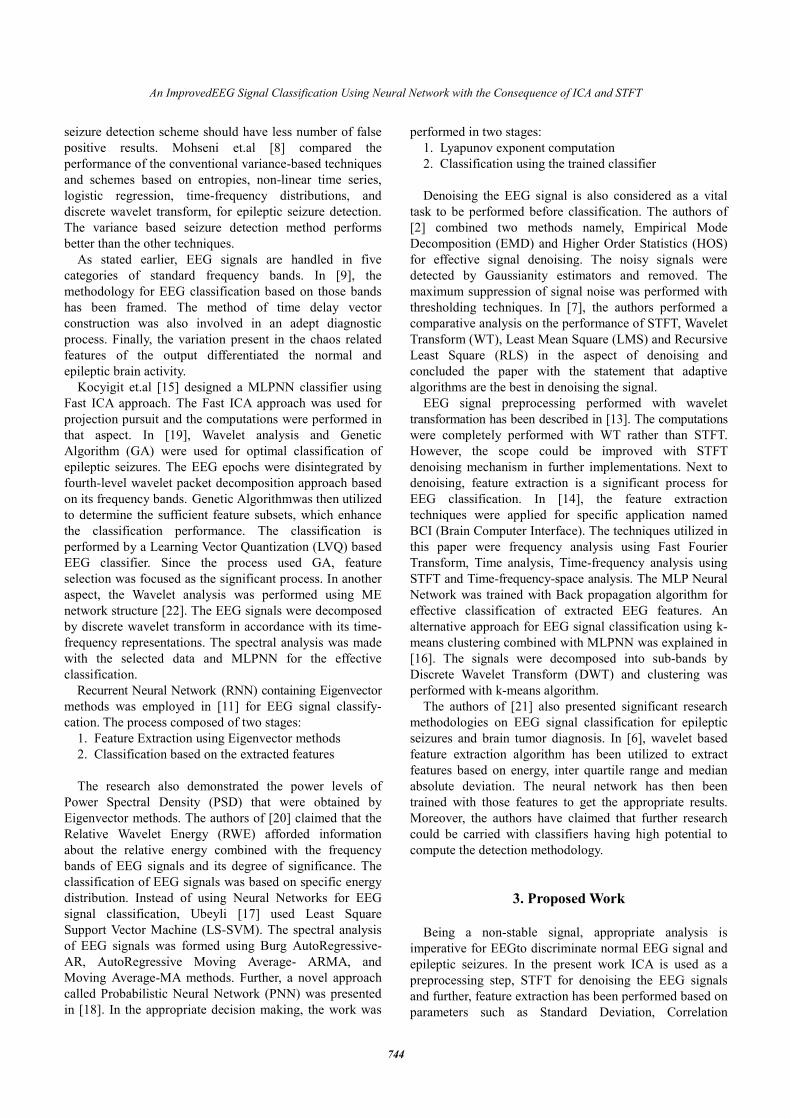
performed using Feed Forward Back-Propagation Neural Network (BPNN) trained using Levenberg-Marquardt algorithm and ANFIS classifier. The overall flow of the proposed work is presented in Fig. 2.
3.1 ICA
ICA is a statistical technique for the determination of
latent variables involved in data generation. It uses the statistical independence among the hidden variables to decompose the multivariate observation data into a linear sum of statistically independent parts. s(t) represents a d x N source vector, with ‘N’ independent realizations of a random variable. ICA uses a linear model where the d x N data vector x(t) is generated by:
x(t)= As(t) (1)
Here, A is an unknown, nonsingular d x d mixing matrix.
The linear model determines a linear transformation with statistically independent basis coefficients. Each column of A corresponds to the basis vector and each element of the source vector corresponds to the basis coefficients. The basis vectors and coefficients are estimated from the data vector. The ICA can recover unknown sources {si(t)} only when x(t) consists of linear mixtures of the source vectors, under a finite number of observations {x(t)}.
3.2 Denoising EEG signal
Short Time Fourier Transforms (STFT) are widely used
for denoising of time dependent signals. STFT of a signal consists of the Fourier transform of crossing windowed blocks of the signal. In general, the Fourier transform is a technique for transforming an input signal from time-domain to frequency-domain in which time information of the signal cannot be found after transformation. However, STFT affords both information contains time-frequency plane. Moreover, it consists of the rectangular window for the purpose of effective signal denoising. The spectrogram values lesser than a specific range are set to zero (thresholding), which results in perfect reconstruction of the spectrogram. After removing noise, inverse STFT is computed to attain the denoised signal. The denoising process consists of three steps, computation of STFT of the noisy signal, thresholding, and inverse STFT computation.
F(τ, ω)=STFT {s(n)} (2)
The STFT is obtained by performing the DTFT
(Discrete-Time Fourier Transform) of each windowed block. DTFT is calculated using Discrete Fourier Transform technique. Eq. (2) states that, like ordinary Fourier transform, the transformed signal F(τ, ω) depends on angular frequency ω and the delay parameter τ. s(n) is represented as the small portion of the signal and it is multiplied with a window function w(n).
Fd (τ, ω)=THR(F(τ, ω)) (3)
������ � �0,|�| ����������,|�| � ���������� (4)
Threshold = (max(orig) - mean(orig)) / abs(min(orig)) (5) Here, THR(a) is the threshold function, Threshold
represents the threshold value, and orig represents the original signal. A threshold value of 0.6 is calculated. All data values (a) less than Threshold in absolute value are set to zero. This type of thresholding is known as hard thresholding, where the detail coefficients greater than Threshold are not affected. It is obvious from the above equations that a set of all frequency sub bands that are less than a particular threshold is equalized to zero. Further, it can be used in the inverse STFT function for effectively obtaining the denoising signal.
���� � �����������, �! (6) Fig. 3 reveals the block diagram of denoising performed
with STFT. The resultant signal is the reconstructed denoised signal that would be given for further operation called feature extraction.
3.3 Feature extraction
In general, feature extraction is the process of eliciting
Fig. 2. Overall Flow of the Proposed Work

An ImprovedEEG Signal Classification Using Neural Network with the Consequence of ICA and STFT
746
significant features from a set of signal collection that tends to appropriate classification and disease diagnosis. A measure that denotes the extent to which the peaks and troughs of a wave differs on an average from the mean voltage is said to be standard deviation. After decomposing the signals, some significant features can be extracted using the standard deviation. For analyzing the statistical feature of a signal, the signal’s mean has to be computed. It can also be claimed that the mean value is the average value of a signal. The signal mean value is determined by:
" � �#∑ �%#��%&' (7)
Here, µ represents the signal mean, where the signal
contained in x0 through xN-1 and i denote an index that goes through these values. Using the above equation, the standard deviation is computed as follows,
( � ) �#��∑ ��% * "�+#��%&' (8)
The signal mean denotes the measured criteria, whereas
the standard deviation represents the noise and other inferences. The results provide two determinations namely; signal to noise (SNR) and coefficient of variation (CV). SNR is calculated by dividing the mean by the standard deviation value.
SNR (dB) = 20 log10(µ/σ) (9)
CV = (σ/µ)* 100 (10) For example, if there is a signal with the CV of 2%, it
may have an approximate SNR of 34 dB. Better signals will be having less CV and high SNR.
Correlation dimension is defined as the measure of dimensionality of the space employed by a set of random points. The number of independent variables is determined by the correlation dimension that is necessary to describe the dynamics of the original system. Correlation dimension is a measure of complexity of the process being investigated and characterizes the distribution of points in
the phase space. Let the N points in am-dimensional space be denoted by x1, x2…xm, and |xi – xj| be the distance between any pair of points. For any positive number ε, the estimate of the correlation integral is calculated as follows,
,-�.� � +#�#���∑ /01 * 2�% * 3425%64 (11)
There is a consideration that the pair of points separated
by lesser distance than distance ∈ is the graphical representation of such close pairs. Here, θ(b) is an unbiased estimation of the correlation integral.
,�.� � ∬"���"�3�/�1 * |� * 3|� �� �3 (12)
The correlation dimension of the EEG signal is
calculated by using the Grassberger-Procaccia algorithm. From the above equations; the correlation dimension of a mean signal is defined as follows,
9 � lim=→'?@A B�=�?@A = (13)
Thus, the result of this section helps in detecting the
deterministic behavior of signals. The Lyapunov exponent of a dynamical system is an
amount that typifies the rate of separation of infinite close curves. It distinguishes various types of orbits in accordance with the sensitive dependence on the initial conditions. Generally, the Lyapunov exponents can be extracted from the observed signals in two different ways: One is from the observed time series and another is from the equations of motion of the dynamic system [3]. In this method, the exponents are estimated based on the motion of a dynamic system that affords the estimation of largest Lyapunov components.
Let (x, y) be the two neighboring points in phase space at time 0 and n respectively. The distance between the point in ith direction are given as ‖D�%�0�‖and ‖D3%���‖ respectively. Then, Lyapunov exponent is defined by,
‖EFG�H�‖‖EIG�'�‖ � 2KGH�� → ∞� (14)
In the above equation λi denotes the average growth rate
of initial distance. It is obvious from the equation that the final states of the dynamic system are much different, even when the initial states are close. For a particular system, the vectors of all Lyapunov exponents are called as Lyapunov spectra.
3.4 Classification
The extracted features are fed into a feedforward ANN
consisting of N inputs, one hidden layer, and K outputs, where N is the size of the feature vector and K is the number of classes. ANN is a classifier containing large
Fig. 3. Block diagram for denoising using STFT
STFT Thresholding
Inverse STFT
s(n)
x(n)
K. Sivasankari and K. Thanushkodi
747
number of simple interconnected neurons which executes a simple numerical computational function. This paper involves the ANN classifier and Adaptive Neuro Fuzzy Inference System (ANFIS) classifier [35].
The Levenberg - Marquardt (LM) algorithm is incorporated here into the Backpropagation algorithm for training the feed forward neural network. The neural network consists of an input layer containing the input variables to the problem and an output layer pertaining solution to the problem. The number of neurons in the hidden layer is chosen as 20. The activation function used in the output layer of the ANN is a linear function and that of the hidden layer is a hyperbolic tangent sigmoid transfer function. LM algorithm caters the numerical solution to the problem of minimizing a nonlinear function and memory limitation of LM training. It also minimizes the sum of squares error based on the maximum neighborhood idea. As stated earlier, the LM algorithm is the combination of the best features of Gauss-Newton algorithm and Steepest descent algorithm. Moreover, it does not suffer from the slow convergence problem and provides good cost function than other training algorithms.
Let w be the weight vector of each signal and E(w) is an error function that has to be minimized. The computation of error function having the error terms ei
2(w) for n individual errors. It is given as,
M�N� � ∑ �%+�N�H%&� (15)
Here, ei
2(w) = (xdi - xi)2, xdi denotes the desired value of
neuron i, whereas xi represents the actual output of that neuron.
Using the LM algorithm, a new weight vector for each signal w(k+1) can be obtained from the previous vectors as follows,
w(k+1) = wk+δwk (16)
Here, δwk is defined as,
δwk =-(Jk+ f(wk)) (Jk
+ Jk+λI)-1 (17)
In the above equation, Jk is the Jacobian of the function f
at wk, λ represents the Marquardt parameter and I is given as the identity matrix. The LM algorithm for training the Neural Network is summarized as follows,
i) Error function computation ii) Assign minimum value to Marquardt parameter O iii) Computation of weight vectors iv) If theM�NPQ�� R M�NP�, increase the O and go
to (iii) v) IfM�NPQ�� S M�NP�, decrease the O vi) Update NP :NP ← NPQ� and go to (iii)
The trained network classifies the test EEG signal into
three categories specifically, normal EEG, seizure-free
EEG, and seizure EEG. Moreover, the Mean Square Error (MSE) value has to be smaller to obtain appropriate results. Thus, it provides a better methodology for seizure detection in clinical practice.
The ANFIS based classifier is a multilayer feed-forward network used to detect epileptic seizures. It is a model which correlates inputs through input Membership Functions (MFs) and affiliated parameters. The ANFIS classifier permits the extraction of fuzzy rules from the numerical data set, used for the adaptive construction of rule base. The model also correlates the outputs through their respective output MFs. The ANFIS classifier learns the features in the dataset and adapts the system parameters as per the error condition. ANFIS classifier is used in biomedical engineering applications for classification, modeling, and controlling of real systems. The ANFIS classifier uses triangular MFs and the number of MFs is equal to 3. The fuzzy if-then rules are based on a Sugeno type Fuzzy Inference System (FIS). A combination of Least-squares and Backpropagation gradient descent method is used for the training the FIS MF parameters.
Five layers are used to develop the inference system. The output signals from previous layer nodes are taken as the input signals in the current layer. The nodes in the first layer generate fuzzy membership grades belonging to the corresponding fuzzy sets by using MFs. The nodes in the second layer multiply the incoming signals and transmit the output product. The output of a node defines the firing strength of a rule. The third layer is an intermediate transmission layer. The nodes in the fourth layer are adaptive nodes. The output of a node in the fourth layer is equivalent to the product of a first order polynomial and the normalized firing strength. The fifth layer consists of a fixed node which calculates the overall output by aggregating all the incoming signals.
The classifier performance is measured by means ofaccuracy, sensitivity, and specificity. These parameters are defined by the following formulae:
Accuracy = (TP + TN) / (TP + FN + FP + TN) (18)
Sensitivity = TP / (TP + FN) (19)
Specificity = TN / (TN + FP) (20) TP (True Positive) is the number of correctly classified
epilepsy cases, FP (False Positive) is the number of incorrectly classified epilepsy cases, FN (False Negative) is the number of incorrectly classified healthy patients, and TN (True Negative) is the number of correctly classified healthy patients. Accuracy is the percentage of correct classification of epilepsy cases and healthy patients. Sensitivity (or) Recall (or) True Positive Rate is the probability of the actual positive classes which are identified correctly. Specificity (or) True Negative Rate is the probability of actual negative classes which are identified correctly.

An ImprovedEEG Signal Classification Using Neural Network with the Consequence of ICA and STFT
748
4. Dataset Information
The dataset utilized in this research is prepared by the
Clinique of Epileptology of Bonn University [23]. Single channel EEGs are noted from people having different brain electrical potential components at a sampling rate of 173.61 Hz for 23.6 seconds. The acquired EEG data contain 3 different cases namely,
1. Data of Healthy people 2. Epileptic people during seizure-free interval
(interictal) 3. Epileptic people during seizure interval (ictal) Each case has five data segments: (Z, O, N, S, F ). Sets
Z and O are attained from healthy people under the condition of eyes open and closed with respect to the external surface electrodes. The sets N and F are obtained from interictal people. The set F has been taken from epileptogenic sections of the brain that represent the focal intellectual activity, whereas set N has been taken from the hippocampal pattern of the brain that indicates non-focal interictal activity. The set S has been obtained from an epileptic subject during seizure interval. Each dataset contains 100 single channel EEG segments and each segment constitutes N=4096 samples. All these segments are noted for the subjects with the 128-channel amplifier that includes 12 A/D convertors at a bit rate of 12 and sampling frequency of 173.61 Hz.
5. Experimental Results and Discussion
The proposed work has been tested by acquiring the
dataset given in the previous section in three patterns: (Z, S), (Z, N, S), and (Z, O, N, S, F). All the computations are implemented using MATLAB V 7.9. The EEG signals are decomposed and preprocessed using ICA. The EEG signals and the consequences of ICA are given in Fig. 4.
Fig. 4. Original EEG signals and EEG signals after ICA
Here, the EEG signals are denoised by computing STFT. The spectrogram of the signal using STFT after thresholding is shown in Fig. 5. The SNR values for the ZONSF dataset is given in Fig. 6.
The denoised signal is then subjected to parameter-zation. The significant features are extracted using Standard Deviation, Correlation Dimension and Lyapunov Exponent, which are being randomly distributed before training. Here, the trained network is simulated with normal and epileptic data. Moreover, the performance of classification is determined in terms of accuracy, sensitivity, and specificity. In this experiment, the classifier is trained with Levenberg - Marquardt training function for appropriate classification of EEG signals under normal, seizure- free and seizure classes.
5.1 Analysis of datasets
Three datasets (Z, S), (Z, N, S), and (Z, O, N, S, F) are
analyzed using the Feed Forward BPNN in terms of Performance characteristics, Regression analysis, and Receiver operating characteristic (ROC).
Fig. 5. Spectrogram of the signal using STFT afterthresholding
Fig. 6. SNR values for the ZONSF dataset
K. Sivasankari and K. Thanushkodi
749
The analysis has been made with 200 EEG segments (Z, S) and their results in signal discrimination are presented below.
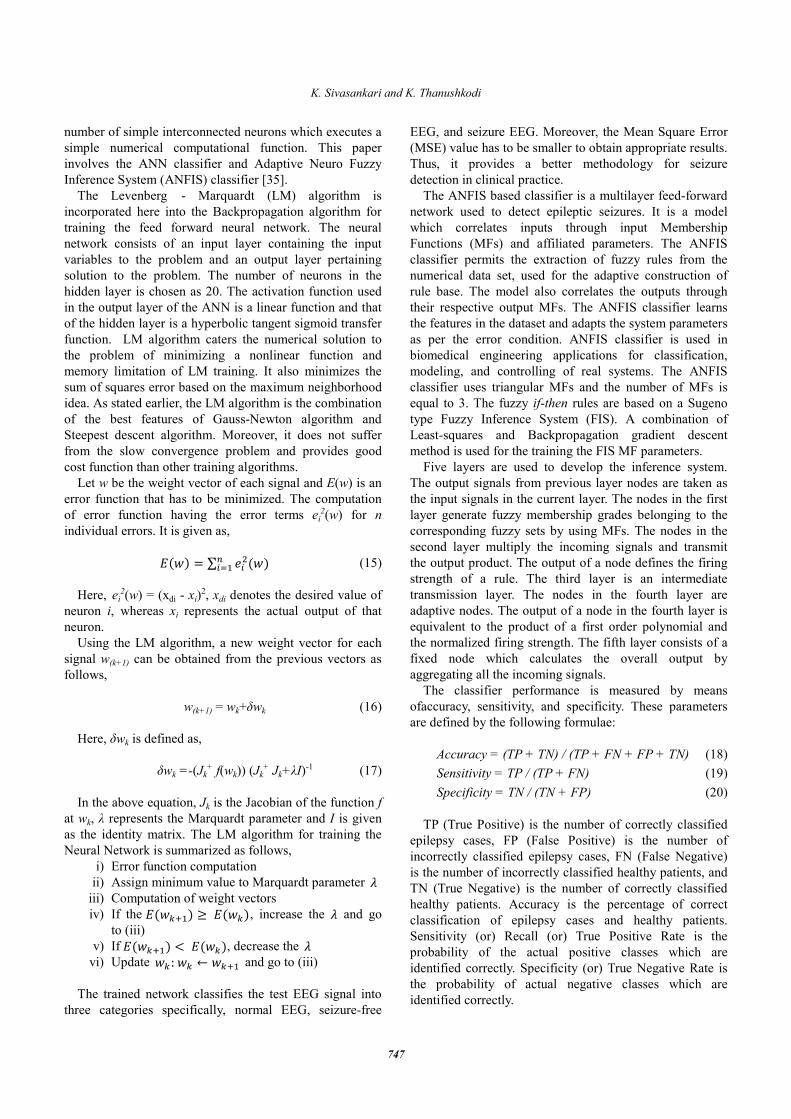
The performance of the neural network classifier with respect to training, validation, and test performances is analyzed and the best characteristic is estimated. The training data are used recursively to estimate the weights of the candidate solutions. The validation data are used recursively to estimate the performance error of the non-training individuals, stop the training when the non-training validation error estimate inhibits decreasing and avoid overfitting. The percentage of data used for training is 70%, test is 15%, and validation is 15%. The training data are used to train the classification algorithm, the validation data are used to decide the data values based on the performances of training data, and the test data are used to obtain the performance characteristics. Fig.7. reveals the graphical representation over the number of epochs needed
for attaining the best performance validation and the Mean Square Error rate (MSE) at the phase of neural network classification of the dataset (Z, S). The best validation rate obtained here is 5.9456e-8 at 21 epochs with minimal MSE.
Fig. 8 represents the regression analysis of the proposed approach at the phase of neural network classification of the dataset (Z, S). The unit regression value (R) indicates an exact linear relationship between the outputs and targets.
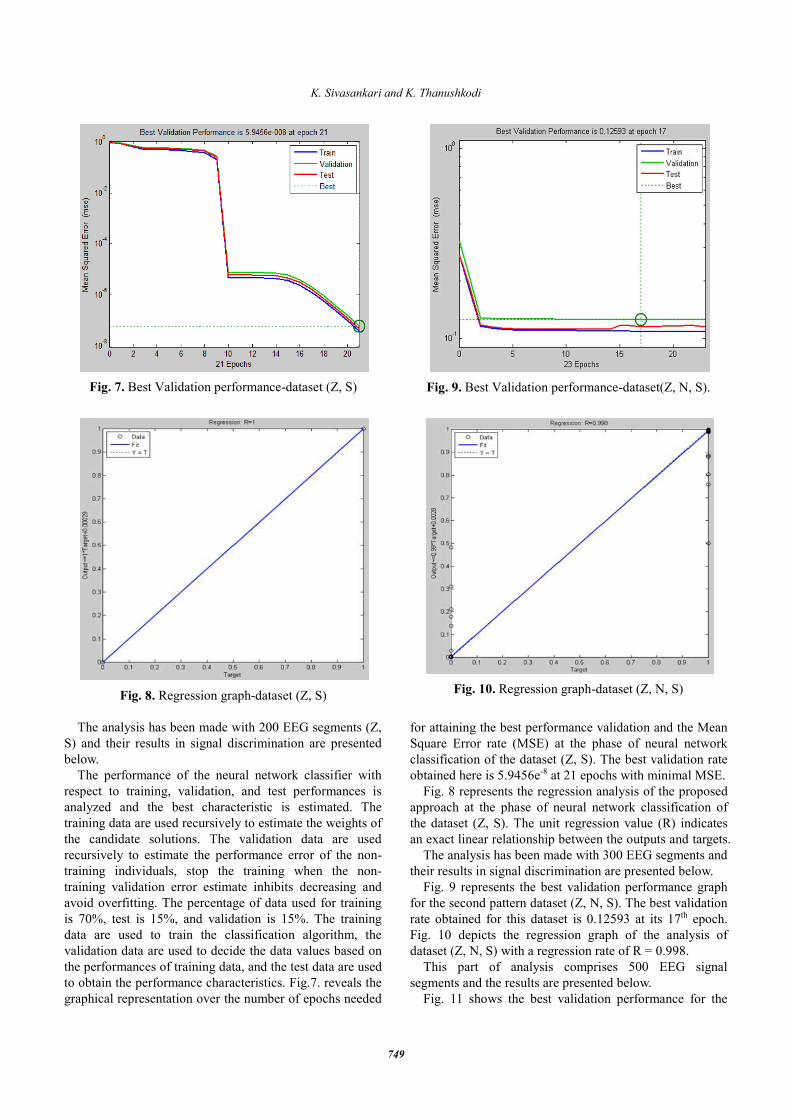
The analysis has been made with 300 EEG segments and their results in signal discrimination are presented below.
Fig. 9 represents the best validation performance graph for the second pattern dataset (Z, N, S). The best validation rate obtained for this dataset is 0.12593 at its 17th epoch. Fig. 10 depicts the regression graph of the analysis of dataset (Z, N, S) with a regression rate of R = 0.998.
This part of analysis comprises 500 EEG signal segments and the results are presented below.
Fig. 11 shows the best validation performance for the
Fig. 7. Best Validation performance-dataset (Z, S)
Fig. 8. Regression graph-dataset (Z, S)
Fig. 9. Best Validation performance-dataset(Z, N, S).
Fig. 10. Regression graph-dataset (Z, N, S)
An ImprovedEEG Signal Classification Using Neural Network with the Consequence of ICA and STFT
750
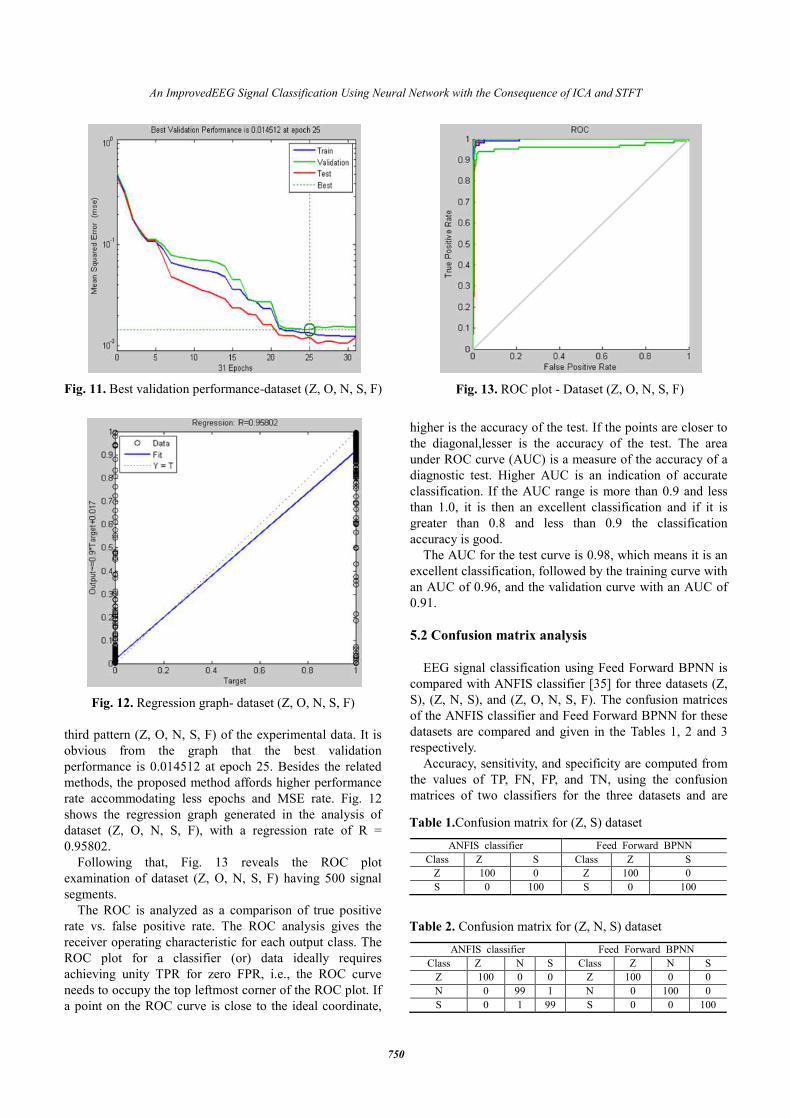
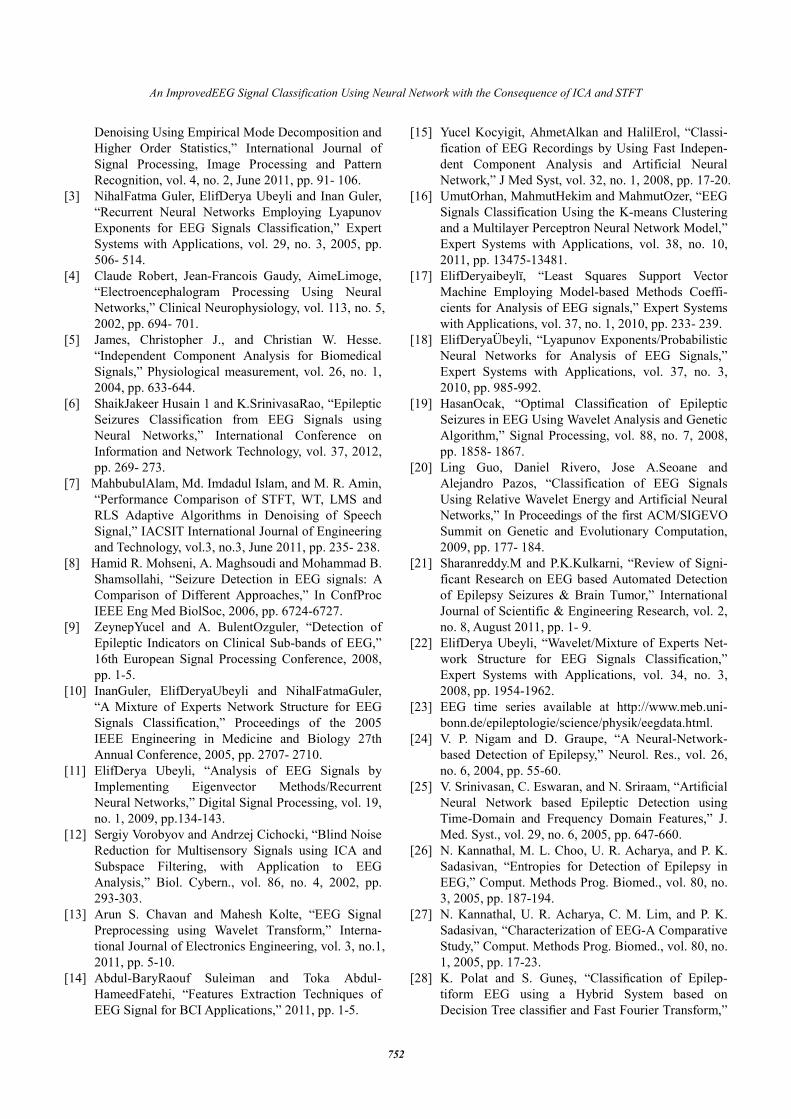
third pattern (Z, O, N, S, F) of the experimental data. It is obvious from the graph that the best validation performance is 0.014512 at epoch 25. Besides the related methods, the proposed method affords higher performance rate accommodating less epochs and MSE rate. Fig. 12 shows the regression graph generated in the analysis of dataset (Z, O, N, S, F), with a regression rate of R = 0.95802.
Following that, Fig. 13 reveals the ROC plot examination of dataset (Z, O, N, S, F) having 500 signal segments.
The ROC is analyzed as a comparison of true positive rate vs. false positive rate. The ROC analysis gives the receiver operating characteristic for each output class. The ROC plot for a classifier (or) data ideally requires achieving unity TPR for zero FPR, i.e., the ROC curve needs to occupy the top leftmost corner of the ROC plot. If a point on the ROC curve is close to the ideal coordinate,
higher is the accuracy of the test. If the points are closer to the diagonal,lesser is the accuracy of the test. The area under ROC curve (AUC) is a measure of the accuracy of a diagnostic test. Higher AUC is an indication of accurate classification. If the AUC range is more than 0.9 and less than 1.0, it is then an excellent classification and if it is greater than 0.8 and less than 0.9 the classification accuracy is good.
The AUC for the test curve is 0.98, which means it is an excellent classification, followed by the training curve with an AUC of 0.96, and the validation curve with an AUC of 0.91.
5.2 Confusion matrix analysis
EEG signal classification using Feed Forward BPNN is
compared with ANFIS classifier [35] for three datasets (Z, S), (Z, N, S), and (Z, O, N, S, F). The confusion matrices of the ANFIS classifier and Feed Forward BPNN for these datasets are compared and given in the Tables 1, 2 and 3 respectively.
Accuracy, sensitivity, and specificity are computed from the values of TP, FN, FP, and TN, using the confusion matrices of two classifiers for the three datasets and are
Fig. 11. Best validation performance-dataset (Z, O, N, S, F)
Fig. 12. Regression graph- dataset (Z, O, N, S, F)
Fig. 13. ROC plot - Dataset (Z, O, N, S, F)
Table 1.Confusion matrix for (Z, S) dataset
ANFIS classifier Feed Forward BPNN Class Z S Class Z S Z 100 0 Z 100 0 S 0 100 S 0 100
Table 2. Confusion matrix for (Z, N, S) dataset
ANFIS classifier Feed Forward BPNN Class Z N S Class Z N S Z 100 0 0 Z 100 0 0 N 0 99 1 N 0 100 0 S 0 1 99 S 0 0 100

K. Sivasankari and K. Thanushkodi
751
given in Table 4(percentage values). Results obtained in Table 4 shows that the present work
results in a potential classification. Table 5 presents a comparison between our approach and the other existing methods that have used the same dataset for the same application. For the first and second classification problems, accuracy of 100% is obtained which is better than the other results. In the case of the third classification problem, the accuracy of our approach is 96.20% and the decrease in accuracy is due to misclassifications.
6. Conclusion
In this paper, a method has been proposed for effective
classification of EEG recordings as normal and seizure. ICA is used as a preprocessing step and STFT has been incorporated for signal denoising. It is followed by the feature extraction process on the basis of three parameters that is, standard deviation, correlation dimension and Lyapunov exponents. Parameterization excerpts the significant features of the EEG signals that are given to the trained neural network for classification. Initially the neural network has been trained with an effective LM training algorithm to obtain the results in an optimal number of
epochs. EEG signal classification using Feed Forward BPNN performs better than to theEEG signal classification using Adaptive Neuro Fuzzy Inference System (ANFIS) classifier in terms of accuracy, sensitivity, and specificity. Three datasets (Z, S), (Z, N, S), and (Z, O, N, S, F) were tested to validate the performance of the proposed approach for EEG signal classification. The results showed that both Feed Forward BPNN and ANFIS classifiers resulted in satisfactory classification accuracy percentages, although the influence of Feed Forward BPNN was a little better than that of ANFIS classifier. This method affords reliable computerized methodology for appropriate EEG signal classification and better decision making for epileptic seizure diagnosis in clinical practice.
References
[1] Frederic, Alexandre, KerkeniNizar, Ben Khalifa
Khaled, Bedoui Mohamed Hedi, Bougrain Laurent, and Dogui Mohamed, “Supervised Neuronal Ap-proaches for EEG Signal Classification: Experi-mental Studies,” Artificial Intelligence and Soft Computing. ACTA Press, vol. 29, 2006, pp. 1-6.
[2] George Tsolis and Thomas D. Xenos, “Signal
Table 3. Confusion matrix for (Z, O, N, S, F) dataset
Class ANFIS classifier Feed forward BPNN
Z O N S F Z O N S F Z 100 0 0 0 0 96 4 0 0 0 O 0 97 3 0 0 1 92 4 3 0 N 0 0 100 0 0 0 2 97 1 0 S 0 0 0 100 0 0 0 1 96 3 F 0 0 0 100 0 0 0 0 0 100
Table 4. Performance measures computed from the confusion tables
Parameter ANFIS classifier Feed forward BPNN
Z,S Z,N,S Z,O,N,S,F Z,S Z,N,S Z,O,N,S,F Accuracy 100 99.33 79.4 100 100 96.2 Sensitivity 100 100 100 100 100 99.05 Specificity 100 100 100 100 100 96.2
Table 5. Comparison of classification accuracy of the present work with that obtained by other researchers
AUTHORS METHOD DATASET ACCURACY (%)
Nigam et al, [24] Non-linear Preprocessing filter-Diagnostic Neural Network Z,S 97.2 Srinivasan et al, [25] Time and Frequency Domain features- Recurrent Neural Network Z,S 99.6 Kannathal et al, [26] Entropy Measures- Adaptive Neuro fuzzy inference method Z,S 92.22 Kannathal et al, [27] Chaotic Measures-Surrogate data- analysis Z,S 90
Polat et al, [28] Fast Fourier Transform-Decision tree Z,S 98.72 Subasi [29] Discrete Wavelet transform- Mixture of expert model Z,S 95
Tzallas et al [34] Time Frequency analysis-Artificial neural network Z,S 100 M. S. Mercy [36] Performance Analysis of Epileptic Seizure Detection Using DWT & ICA with
Neural Networks Z,S 98
S. Hosseini, et al. [37] Qualitative and Quantitative Evaluation of EEG Signals in Epileptic Seizure Recognition
Z,S 96.9
Our Work EEG Signal Classification using ICA, STFT& Feed Forward BPNN Z,S 100
Guler et al. [30] Lyapunov exponents-Recurrent neural network Z,N,S 96.79 Sadati et al, [31] Discrete Wavelet Transform-Adaptive neural fuzzy network Z,N,S 85.9 Tzallas et al [34] Time Frequency analysis-Artificial neural network Z,N,S 100
Our Work EEG Signal Classification using ICA, STFT & Feed Forward BPNN Z, N,S 100
S. Hosseini, et al. [37] Qualitative and Quantitative Evaluation of EEG Signals in Epileptic Seizure Recognition
Z,O, N,S, F 97.4
Guler et al. [32] Wavelet transform- Adaptive Neuro fuzzy inference method Z,O,N,S,F 98.68 Ubayel et al, [33] Eigen Vector method- Modified of mixture of expert models Z,O,N,S,F 98.60 Tzallas et al [34] Time Frequency analysis-Artificial neural network Z,O,N,S,F 89
Our Work EEG Signal Classification using ICA, STFT& Feed Forward BPNN Z,O,N, S, F 96.20
An ImprovedEEG Signal Classification Using Neural Network with the Consequence of ICA and STFT
752
Denoising Using Empirical Mode Decomposition and Higher Order Statistics,” International Journal of Signal Processing, Image Processing and Pattern Recognition, vol. 4, no. 2, June 2011, pp. 91- 106.
[3] NihalFatma Guler, ElifDerya Ubeyli and Inan Guler, “Recurrent Neural Networks Employing Lyapunov Exponents for EEG Signals Classification,” Expert Systems with Applications, vol. 29, no. 3, 2005, pp. 506- 514.
[4] Claude Robert, Jean-Francois Gaudy, AimeLimoge, “Electroencephalogram Processing Using Neural Networks,” Clinical Neurophysiology, vol. 113, no. 5, 2002, pp. 694- 701.
[5] James, Christopher J., and Christian W. Hesse. “Independent Component Analysis for Biomedical Signals,” Physiological measurement, vol. 26, no. 1, 2004, pp. 633-644.
[6] ShaikJakeer Husain 1 and K.SrinivasaRao, “Epileptic Seizures Classification from EEG Signals using Neural Networks,” International Conference on Information and Network Technology, vol. 37, 2012, pp. 269- 273.
[7] MahbubulAlam, Md. Imdadul Islam, and M. R. Amin, “Performance Comparison of STFT, WT, LMS and RLS Adaptive Algorithms in Denoising of Speech Signal,” IACSIT International Journal of Engineering and Technology, vol.3, no.3, June 2011, pp. 235- 238.
[8] Hamid R. Mohseni, A. Maghsoudi and Mohammad B. Shamsollahi, “Seizure Detection in EEG signals: A Comparison of Different Approaches,” In ConfProc IEEE Eng Med BiolSoc, 2006, pp. 6724-6727.
[9] ZeynepYucel and A. BulentOzguler, “Detection of Epileptic Indicators on Clinical Sub-bands of EEG,” 16th European Signal Processing Conference, 2008, pp. 1-5.
[10] InanGuler, ElifDeryaUbeyli and NihalFatmaGuler, “A Mixture of Experts Network Structure for EEG Signals Classification,” Proceedings of the 2005 IEEE Engineering in Medicine and Biology 27th Annual Conference, 2005, pp. 2707- 2710.
[11] ElifDerya Ubeyli, “Analysis of EEG Signals by Implementing Eigenvector Methods/Recurrent Neural Networks,” Digital Signal Processing, vol. 19, no. 1, 2009, pp.134-143.
[12] Sergiy Vorobyov and Andrzej Cichocki, “Blind Noise Reduction for Multisensory Signals using ICA and Subspace Filtering, with Application to EEG Analysis,” Biol. Cybern., vol. 86, no. 4, 2002, pp. 293-303.
[13] Arun S. Chavan and Mahesh Kolte, “EEG Signal Preprocessing using Wavelet Transform,” Interna-tional Journal of Electronics Engineering, vol. 3, no.1, 2011, pp. 5-10.
[14] Abdul-BaryRaouf Suleiman and Toka Abdul-HameedFatehi, “Features Extraction Techniques of EEG Signal for BCI Applications,” 2011, pp. 1-5.
[15] Yucel Kocyigit, AhmetAlkan and HalilErol, “Classi-fication of EEG Recordings by Using Fast Indepen-dent Component Analysis and Artificial Neural Network,” J Med Syst, vol. 32, no. 1, 2008, pp. 17-20.
[16] UmutOrhan, MahmutHekim and MahmutOzer, “EEG Signals Classification Using the K-means Clustering and a Multilayer Perceptron Neural Network Model,” Expert Systems with Applications, vol. 38, no. 10, 2011, pp. 13475-13481.
[17] ElifDeryaibeylï, “Least Squares Support Vector Machine Employing Model-based Methods Coeffi-cients for Analysis of EEG signals,” Expert Systems with Applications, vol. 37, no. 1, 2010, pp. 233- 239.
[18] ElifDeryaÜbeyli, “Lyapunov Exponents/Probabilistic Neural Networks for Analysis of EEG Signals,” Expert Systems with Applications, vol. 37, no. 3, 2010, pp. 985-992.
[19] HasanOcak, “Optimal Classification of Epileptic Seizures in EEG Using Wavelet Analysis and Genetic Algorithm,” Signal Processing, vol. 88, no. 7, 2008, pp. 1858- 1867.
[20] Ling Guo, Daniel Rivero, Jose A.Seoane and Alejandro Pazos, “Classification of EEG Signals Using Relative Wavelet Energy and Artificial Neural Networks,” In Proceedings of the first ACM/SIGEVO Summit on Genetic and Evolutionary Computation, 2009, pp. 177- 184.
[21] Sharanreddy.M and P.K.Kulkarni, “Review of Signi-ficant Research on EEG based Automated Detection of Epilepsy Seizures & Brain Tumor,” International Journal of Scientific & Engineering Research, vol. 2, no. 8, August 2011, pp. 1- 9.
[22] ElifDerya Ubeyli, “Wavelet/Mixture of Experts Net-work Structure for EEG Signals Classification,” Expert Systems with Applications, vol. 34, no. 3, 2008, pp. 1954-1962.
[23] EEG time series available at http://www.meb.uni-bonn.de/epileptologie/science/physik/eegdata.html.
[24] V. P. Nigam and D. Graupe, “A Neural-Network-based Detection of Epilepsy,” Neurol. Res., vol. 26, no. 6, 2004, pp. 55-60.
[25] V. Srinivasan, C. Eswaran, and N. Sriraam, “Artificial Neural Network based Epileptic Detection using Time-Domain and Frequency Domain Features,” J. Med. Syst., vol. 29, no. 6, 2005, pp. 647-660.
[26] N. Kannathal, M. L. Choo, U. R. Acharya, and P. K. Sadasivan, “Entropies for Detection of Epilepsy in EEG,” Comput. Methods Prog. Biomed., vol. 80, no. 3, 2005, pp. 187-194.
[27] N. Kannathal, U. R. Acharya, C. M. Lim, and P. K. Sadasivan, “Characterization of EEG-A Comparative Study,” Comput. Methods Prog. Biomed., vol. 80, no. 1, 2005, pp. 17-23.
[28] K. Polat and S. Guneş, “Classification of Epilep-tiform EEG using a Hybrid System based on Decision Tree classifier and Fast Fourier Transform,”
K. Sivasankari and K. Thanushkodi
753
Appl. Math. Comput., vol. 32, no. 2, 2007, pp. 625-631.
[29] A. Subasi, “Signal Classification using Wavelet Feature Extraction and Mixture of Expert Model,” Exp. Syst. Appl., vol. 32, no. 4, 2007, pp. 1084-1093.
[30] N. F. Guler, E. D. Ubeyli, and I. Guler, “Recurrent Neural Networks Employing Lyapunov Exponents for EEG Signals Classification,” Exp. Syst. Appl., vol.29, no. 3, 2005, pp. 506-514.
[31] N. Sadati, H. R. Mohseni, and A. Magshoudi, “Epileptic Seizure Detection Using Neural Fuzzy Networks,”inProc .IEEE Int.Conf. FuzzySyst.,Jul.16– 21, 2006, pp. 596-600.
[32] I. Guler and E. D. Ubeyli, “Adaptive Neuro-Fuzzy Inference System for Classification of EEG Signals using wavelet coefficients,” J. Neurosci. Methods, vol. 148, no. 2, 2005, pp. 113-121.
[33] E. D. Übeyli and I. Guler, “Features Extracted by Eigenvector Methods for Detecting Variability of EEG Signals,” Pattern Recognit. Lett., vol. 28, no. 5, 2007, pp. 592-603.
[34] T. Tzallas, “Epileptic Seizure Detection in EEGs using Time-Frequency Analysis,” in IEEE trans-actions on Information Technology, vol. 13 no. 5, September 2009, pp. 703-710.
[35] M. Hosoz, et al., “An Adaptive Neuro-Fuzzy Inference System Model for Predicting the Perfor-mance of a Refrigeration System with a Cooling Tower,” Expert Systems with Applications, vol. 38, no. 11, 2011, pp. 14148-14155.
[36] M. S. Mercy, “Performance Analysis of Epileptic Seizure Detection Using DWT & ICA with Neural Networks,” International Journal Of Computational Engineering Research, vol. 2, no. 4, 2012, pp. 1109-1113.
[37] S. Hosseini, et al., “Qualitative and Quantitative Evaluation of EEG Signals in Epileptic Seizure Recognition,” International Journal of Intelligent Systems and Applications (IJISA), vol. 5, no. 6, 2013, pp. 41-46.
K. Sivasankari ?????? K. Thanushkodi ??????