an indicator to evaluate the thermodynamic maturity of industrial ... · be of interest for...
TRANSCRIPT
F O RU M
An Indicator to Evaluate theThermodynamic Maturityof Industrial Process Unitsin Industrial EcologyAnita Zvolinschi and Signe Kjelstrup
Keywords
entropy productionequipartitionexergy balanceexergy efficiencyoptimizationprocess units
Summary
The article suggests a measure to evaluate the thermodynamicmaturity of industrial systems at the level of single process units.The measure can be quantified with reasonable confidenceon the basis of entropy production as defined by irreversiblethermodynamics theory. It quantifies, for one process unit, thedistance between its actual state of operation and its state withminimum entropy production or optimum exergy efficiency,when the two states are constrained with a fixed productioncapacity of the process unit. We suggest that the minimumentropy production state is a mature state, or that processesthat operate at this state are mature. We propose to call themeasure “the thermodynamic maturity indicator” (π), and wedefine it as the ratio between the minimum entropy produc-tion and the actual entropy production. We calculated π onthe basis of literature data for some examples of industrialprocess units in the chemical and process industry (i.e., heatexchanger, chemical reactor, distillation column, and paper dry-ing machine). The proposed thermodynamic measure shouldbe of interest for industrial ecology because it emerges fromthe entropy production rate, a dynamic function that can beoptimized and used to understand the thermodynamic limitto improving the exergy efficiency of industrial processes. Al-though not a tool for replacing one process with another orcomparing one technology to another, π may be used to as-sess actual operation states of single process units in industrialecology.
Address correspondence to:Signe KjelstrupDepartment of ChemistryNorwegian University of Science andTechnology—NTNUNO-7491 Trondheim, [email protected]
c©2008 by Yale UniversityDOI: 10.1111/j.1530-9290.2008.00024.x
Volume 12, Number 2
www.blackwellpublishing.com/jie Journal of Industrial Ecology 159
F O RU M
Introduction
Attempts have been made throughout scien-tific history to find universal principles that woulddetermine the development of a system. A cer-tain success was achieved in optics (the Fermat’sprinciple) and mechanics (the principle of leastaction). The minimum entropy production prin-ciple (or the Prigogine theorem) was introducedin 1931 and used to describe irreversible, dissipa-tive processes (Onsager 1931a, b; Prigogine 1947,1955, 1961). In the last 2 decades, energy ef-ficiency problems in design and optimization ofthermal and power systems (i.e., heat exchangers,power plants) have been solved via the entropygeneration minimization method (Bejan 1996a,b; Bejan et al. 1996). Chemical and separationsystems have also been studied (Tondeur andKvaalen 1987; Tondeur 1990; Johannessen andKjelstrup 2004; de Koeijer et al. 2004; Røsjordeand Kjelstrup 2005; Kjelstrup et al. 2006; Zvolin-schi et al. 2006). The entropy concept was firstproposed as a measure in industrial ecology byLowenthal and Kastenberg (1998). Their per-spective was intended to assign an entropy valueto stages in a product’s life cycle, a value thatcould be seen as a cost, like a negative monetarycost or an externality of the product (Lowenthaland Kastenberg 1998). Other authors proposedentropy production as a thermodynamic measurefor resource use (Goßling et al. 2001; von Gleichet al. 2007), waste generation (Baumgartner andde Swaan Arons 2003), and the ultimate ecotox-icity of economic systems (Ayres and Martinas1995). As a continuation of these efforts, thisarticle aims to bring knowledge on irreversiblethermodynamics and minimum entropy produc-tion into industrial ecology.
Ideally, a process should be operated re-versibly to achieve a maximum second-law ther-modynamic efficiency of 100%. Such a process,however, would be uneconomical because ofexcessive capital investment in equipment,which would have to be infinite in size. Thereversible processes are characterized by negli-gible transport gradients and a zero lost exergy orzero entropy production. In order to determinehow far a process or a system is from its maxi-mum thermodynamic performance, the availabil-ity or exergy concept and method were developed
(Keenan 1951; Rant 1956; Reistad 1970). Avail-ability changes of simple processes were com-puted and illustrated to show the impact ofthe change in entropy (Sussman 1980; Moranand Shapiro 1993; Seider et al. 2004). Amongother applications, the availability or exergyconcept was used to compare and scale differ-ent energy forms, determine exergy losses andthermodynamic efficiencies (Kotas 1985; Szargutet al. 1988; Brodynasky et al. 1994), assess ther-moeconomic costs (Sciubba 2004), account forresources (Bosch et al. 2006), and allocate envi-ronmental impacts of industrial processes (Doneset al. 2003).
Our emphasis is also on the second-law ther-modynamic efficiency as given by the exergy ef-ficiency and, more precisely, on a replacementof the maximum limit of 100%. This article in-troduces an additional measure to the exergy effi-ciency in an effort to improve the thermodynamicperformance of industrial process units. We namethis measure the thermodynamic maturity indica-tor (π). It is defined below as the ratio betweenminimum and actual total entropy productionfor a given production capacity in a given systemboundary of one process unit. To calculate π it isnot necessary to define the environmental refer-ence state as in the exergy efficiency calculationsand exergy accounting (Ayres and Masini 2004).This may be seen as an advantage. More infor-mation about the process is needed to calculatethe thermodynamic maturity indicator than tocalculate the exergy efficiency, however.
To illustrate and assess the thermodynamicmaturity indicator, we use process units such asheat exchangers, chemical reactors, distillationcolumns, and a paper-drying machine. Literaturedata are available on these units (de Koeijer et al.2004; Johannessen and Kjelstrup 2004; Røsjordeet al. 2004; Zvolinschi et al. 2006). By a processunit we mean a device or piece of equipment thatprocesses, assembles, applies, blends, or otherwiseuses material inputs to produce or store an inter-mediate or a completed product. In our opinion,the performance of single process units should beof interest for industrial ecology because from thislevel emerges the resource exergy loss and corre-sponding emissions of all industrial activities.
We first give a theoretical background of ex-ergy and irreversible thermodynamics. We then
160 Journal of Industrial Ecology
F O RU M
define and illustrate the thermodynamic maturityindicator for the cases mentioned above. Finally,we address the meaning of the indicator.
Theoretical Background
The Exergy Balance and Exergy Efficiency
Research efforts in industrial ecology are re-lated to accounting, analyzing, and optimizingthe use of resources in industrial processes or sys-tems. Wall (1977, 1988) has proposed a ther-modynamic concept for accounting any type ofresource stocks and flows in society and indus-try. Wall’s proposal was based on the measurecalled l’energie utilizable by French academicians(Carnot, Navier, and Poncelet) in the 18th cen-tury, availability by American scientists, and ex-ergy by researchers in Europe. The exergy balancewas then proposed as a method to evaluate the useand transformation of resources in any engineer-ing system. The following equation represents theexergy balance of a system:
Ein = Eout + Eloss (1)
where Ein is the input exergy of the resourcesof the system; Eout is the output exergy of theproducts, by-products, and wastes; and Eloss is thetotal exergy lost or dissipated as dictated by thesecond law of thermodynamics.
The method of exergy analysis was developedin response to the request to determine the max-imum thermodynamic potential for work and forlost work or exergy loss in our engineering sys-tems. This is generally measured with the exergyefficiency (ε), as given by
ε = Eout
Ein= Ein − Eloss
Ein(2)
One can determine the value of the exergy loss(Eloss) without using the exergy balance, equa-tion (1). This is possible if the correspondingtotal entropy production is known. The Gouy–Stodola’s theorem is here useful (Gouy 1889;Stodola 1898), because it expresses the relationbetween the total exergy loss and the total en-tropy production as
Eloss = T0(dS/dt)irr (3)
where Eloss is the total exergy loss in the system—the same quantity as in equation (1), T0 is thestandard value of the environmental temperature
(T0 = 298 K), and (dS/dt)irr is the total entropyproduction.
Using equation (3) in equations (1) and (2),one can have another formulation of the exergybalance and the exergy efficiency, respectively:
Ein = Eout + T0(dS/dt)irr (4)
and
ε= Ein−T0(dS/dt)irr
Ein=1− T0(dS/dt)irr
Ein(5)
Equation (4) tells us that the higher the rateof total entropy production is, the higher is theamount of input resource exergy required to sus-tain the same output exergy from the system. Thiswas stated by Tolman and Fine in 1948. Theirwork supplemented the earlier work of Onsager(1931a, 1931b), and of Prigogine (1947, 1955,1961) on the entropy production in stationarystate systems.
As we can see from equation (5), knowl-edge of entropy production has the advantagethat the exergy efficiency can be calculatedwithout information about the outlets of a sys-tem (i.e., by-products, wastes); only informa-tion about the main product must be known.This may be seen as an advantage, as the in-formation about chemical compositions of manyindustrial outlets is not easily available (thisinformation is needed to compute the chemi-cal exergy). The information about the entropyproduction of the system requires more local in-formation about every process in that system,however. As we show, this information can beobtained from irreversible thermodynamics, a dis-cipline of science that relates the thermodynamicforces and fluxes with the local entropy produc-tion, dating back to Onsager (1931).
The Local and Total Entropy Production
A process unit in its stationary operating statecan be characterized by its total entropy produc-tion, (dS/dt)irr. Any change of operating con-ditions determines a new state for the processand a new value for the total entropy produc-tion. The total entropy production can be cal-culated either as an entropy balance applied tothe incoming (Js, in) and outgoing (Js,out) entropyflows throughout the cross area of the system(A) or through integration of the local entropy
Zvolinschi and Kjelstrup, Evaluating the Thermodynamic Maturity of Industrial Processes 161
F O RU M
production rate (σ ) over the volume (V) of thesystem; see equation (6).
(dS/dt)irr = A(J s ,out − J s ,i n) =∫V
σd V > 0(6)
The entropy balance, the first equality in equa-tion (6), gives a black box description of the pro-cess unit, whereas the integral of the local en-tropy production, the latter equality in equation(6), gives more information. The local entropyproduction contains information on all trans-port phenomena that take place within a systemboundary of a process unit. One can gain infor-mation on fluxes and forces along the unit inthe actual state of operation and in the state ofminimum entropy production. The disadvantageis that more information is needed on the pro-cess. We assume here that such information isavailable.
The total entropy production can be indepen-dently calculated, via either the exergy balancein combination with the Gouy–Stodola theorem(equations [1] and [2]), or the entropy balance(equation [6]), and/or the integral of the localentropy production (equation [6]). The answermust be the same and be a positive value. Each ofthese methods for calculating the total entropyproduction has its own advantages and range ofapplicability. For example, it is possible to checkfor the consistency of the mathematical modelsthat are used to model and simulate processes ofa single process unit. This is done by checkingwhether the local entropy production is positivein all points of that unit.
Irreversible thermodynamics (Onsager 1931a,b; de Groot and Mazur 1962; Førland et al. 2001)defines the function of the local entropy produc-tion by equation (7),
σ =∑
i
J i Xi (7)
Here, Ji is the local flux of any entity i consideredto model the process, and Xi is the conjugatethermodynamic driving force. Each flux (Ji) is alocal linear combination of all thermodynamicdriving forces by means of the phenomenologicalcoefficients (Lij):
J i =∑i , j
Li j X j (8)
For example, for a system with two fluxes and twothermodynamic driving forces, the following re-lations can be written to characterize the process:
J1 = L11 X1 + L12 X2
J2 = L21 X1 + L22 X2(9)
Onsager’s (1931a, 1931b) reciprocal relation,Lij = Lji, gives a relationship between the phe-nomenological coefficients. Defining the totalentropy production from the local entropy pro-duction rather than from the entropy balancegives us more information about the local dissi-pation of exergy. Therefore, it gives more insightinto how exergy loss or entropy production de-velops within the boundary of the system. Thecalculation of the total entropy production fromthe integral of local entropy production is oftendifficult, however, because of our limited knowl-edge of the phenomenological coefficients, Lij.
To give an example of the local entropy pro-duction, we give the expression for a plug flowreactor (Nummedal et al. 2005). Normally in areactor, there are three phenomena that produceentropy: the reactions that take place, the heattransfer between the reaction mixture and thecooling/heating agent, and the pressure drop dueto the material flows throughout the reactor. Thelocal entropy production per unit area of the re-actor (σ in W/K/m), becomes (Nummedal et al.2005)
σ = Aρ∑
j
[r j
(−�r G j
T
)]+ π D J ′
q �
(1T
)
+Aυ
(− 1
TdPdz
)(10)
where A is the cross-sectional area of the reac-tor (in m2), ρ is the catalyst density (in kg cata-lyst/m3 reactor), D is the reactor diameter (in m),�rGj is the Gibbs energy of reaction j (in J/mol),and T is the temperature of the volume element(in K).
Equation (10) was used to study the totaland local entropy production in a tubular steamreformer (Nummedal et al. 2005). It containsproducts of fluxes and their conjugate thermody-namic forces. The first term is due to all reactionsin the reactor; the flux is the reaction rate ofreaction j, rj, and the chemical force is –�rGj/T.The second term is due to heat transfer; the flux
162 Journal of Industrial Ecology
F O RU M
is the measurable heat flux, J ′q , and the thermal
force is �(1/T) across the reactor walls. The lastterm is due to the pressure drop; the flux is thefluid velocity, v, and the thermodynamic forceis –(1/T)(dP/dz), where P is the total pressureof reaction mixture and z is the length of thereactor tubes.
Equipartition as a Feature of the State ofMinimum Entropy Production
Work over the last 20 years on process unitswith a prescribed production has shown that theone important feature of the state of minimumentropy production is its equipartition (Tondeurand Kvaalen 1987; Tondeur 1990; Andresen andGordon 1992; Sauar et al. 1996; Sauar et al. 1997;Bedeaux et al. 1999; Kjelstrup et al. 1999; Kjel-strup et al. 2000; Nummedal and Kjelstrup 2001;Sauar et al. 2001; Johannessen et al. 2002; deKoeijer et al. 2004; Johannessen and Kjelstrup2004; Johannessen and Kjelstrup 2005; Zvolin-schi et al. 2006). Tondeur and Kvaalen (1987)proposed that the total entropy produced in acontracting or separating device (e.g., heat ex-changer, distillation column) is minimal whenthe local rate of local entropy production is uni-formly distributed (equipartitioned) along thestate space and/or time variables. This theo-rem was called equipartition of entropy production(EoEP), and it was demonstrated for globally lin-ear flux–force relations obeying Onsager’s recip-rocal relations (Tondeur and Kvaalen 1987). Ina further study of applications of the EoEP the-orem, Tondeur (1990, 185) argued that “mini-mal dissipation for a specified duty correspondsto equipartition of flux, driving force and entropyproduction along the time and space variables ofthe process.” This statement was linked to theflow configuration in heat exchangers, sorptionand distillation columns, and other separationdevices. Using some assumptions, Tondeur alsomade a link between equipartition of entropy pro-duction and economic optimization. The optimalsize distribution in an economic sense is that inwhich the cost of energy quality degradation inany element is equal to the amortized propor-tional investment cost in that element. In morepopular terms, EoEP means that “the heat trans-
fer area should be concentrated in that region ofthe heat exchanger where heat transfer (regard-less of direction) is most intense” (Bejan 1982,149). Other authors have found related theo-rems in different ways and for different conditions(Andresen and Gordon 1992).
The work by Sauar and colleagues (1996) gavethe theorem of equipartition of forces (EoF), whichstates that a production system in the state ofminimum entropy production can be character-ized by constant thermodynamic driving forces.The theorem was proven via irreversible ther-modynamics for stationary processes where alltransfer paths were parallel. No conservationequations were considered in the proof. TheEoF theorem was proposed as a design criterionfor heat exchangers (Nummedal and Kjelstrup2001), chemical reactors (Sauar et al. 1997; Be-deaux et al. 1999; Kjelstrup et al. 1999; Kjelstrupet al. 2000), and distillation columns (Sauar et al.2001). Vulnerability of the EoF theorem ap-peared when difficulties were met in obtainingthe minimum entropy production rate in a reac-tor system (Kjelstrup et al. 2000) and in obeyingconservation equations in a diabatic distillation(Sauar et al. 1997).
A more convincing formulation of the op-timization problem, to find minimum entropyproduction for a process unit with constant pro-duction, was given by Johannessen and Kjelstrup(2005) using optimal control theory (Bryson andHo 1975). This theory emphasizes the number ofcontrol variables that can be used to change thesystem, versus the number of state variables in thesystem itself. Conservation equations and otherconstraints can be properly taken into account.Johannessen and Kjelstrup (2005) revealed thenature of the state of minimum entropy produc-tion when there are fewer control variables thanstate variables in the system. Taking the plugflow reactor as an example, they found that theoperating path with minimum entropy produc-tion followed a highway in state space, to a largeror smaller degree, depending on the systems’boundary conditions. The following chemical re-actors were investigated: sulfur dioxide oxidation,ammonia synthesis, steam reforming, methanolsynthesis, and propane dehydrogenation. The re-sults obtained were concluded as a hypothesis,
Zvolinschi and Kjelstrup, Evaluating the Thermodynamic Maturity of Industrial Processes 163
F O RU M
which stated that the “EoEP, but also EoF, isa good approximation to the state of minimumentropy production in the parts of an optimallycontrolled system that have sufficient freedom”(Johannessen and Kjelstrup 2005, 3358).
Knowledge of the nature of the state of min-imum entropy production is thus accumulating,and industrial ecology might take advantage ofthis. It seems that a thermodynamically efficientsystem should possess certain characteristics; itshould follow a highway in state space for energy-efficient operation, operate with equipartition ofentropy production, or have relatively constantdriving forces. Technological systems that incor-porate processes operating at minimum entropyproduction states can be called mature. In keepingwith Tondeur (1990), this may also, under favor-able conditions, lead to economic advantages.
Therefore, we propose as a measure for ther-modynamic maturity the state in which the pro-cess operates with minimum entropy production,with the aim of producing the product J. Thisstate of minimum entropy production has the re-alistic highest exergy efficiency that is possible toobtain for this particular production (of J). Theindicator has as its limit value unity (or 100%), asit can be well achieved for a finite production.
Defining the ThermodynamicMaturity Indicator
So far, exergy efficiency has been used in in-dustrial ecology as an indicator to evaluate thethermodynamic performance of industrial pro-cesses and systems. Through the exergy efficiencyconcept, many industrial processes have been im-proved. The upper limit of the exergy efficiencyof any process in steady-state operation of one(or 100%) is unrealistic to compare with, how-ever, as it is an unphysical limit attainable only byreversible processes, which has zero entropy pro-duction. In our opinion, it may be useful to useanother limit to show how far a process in a cer-tain state of operation is from the thermodynam-ically ideal state, namely the state of minimumentropy production.
On the basis of this background, we propose ameasure that indicates how far a process is operat-ing from its state of minimum entropy production.We name this measure the thermodynamic matu-
rity indicator (π). The π is defined as the ratioof the minimum entropy production to the ac-tual entropy production in a process, which takesplace in the same system boundary and with thesame operating conditions, as
π = (dS/dt)minirr
(dS/dt)actualirr
(11)
The indicator uses the result of the followingconstrained optimization:
Find (dS/dt)minirr for a given J (12)
where (d S/d t)minirr is the minimum total entropy
production. A given sizable production capacityJ must occur in a finite time for the industrialprocess to be of practical interest.
The minimum total entropy production forthe constrained production capacity of the pro-cess unit is thus a finite and realistic reference forthe actual value. This proposal for a new indica-tor therefore introduces a new and more realisticlimit than is attained by the maximum exergyefficiency.
The indicator shows how far a particular pro-cess is from its thermodynamic maturity level.We suggest here that a process with a given pro-duction capacity is mature if it is operated withminimum entropy production. This state of op-eration has the lowest possible rate of resourceexergy dissipation, and therefore it contributes toa longer preservation of natural resource reser-voirs (e.g., the nonrenewable fossil fuels).
When π is low, it means that the processis wasting resource exergy unnecessarily. Such aconclusion cannot be reached on the basis of in-formation on exergy efficiency (ε) alone. A low π
means that there is a real potential for thermody-namic improvement. The indicator approachesunity when the process is operated in the stateof minimum entropy production. The process isthen mature, and nothing can be done to improvethis particular process. Different patterns of op-eration for a process with the same productioncapacity rate can be evaluated and compared bytheir thermodynamic maturity indicator (π), aswell as by their exergy efficiency (ε). By changingthe number of system variables or system bound-aries, we change the unit, and a new referencemust be established and optimized.
164 Journal of Industrial Ecology

F O RU M
A mathematical relation can be obtained be-tween the exergy efficiency, equation (5), andthe thermodynamic maturity indicator, equation(11), if the amount of the input exergy of re-sources is kept constant in the two states ofthe actual and minimum entropy production rate(Eactual
in = Eoptimin = Ein). Using equation (11) and
the relations of the exergy efficiency written forthe actual state and the optimum state of opera-tion in a system, namely
εactual = 1 − T0(dS/dt)actualirr
Eactualin
(13)
and
εoptim = 1 − T0(dS/dt)minirr
Eoptimin
(14)
one can find the following correlation betweenthe thermodynamic maturity indicator and theexergy efficiency
π = 1 − εoptim
1 − εactual(15)
which is equivalent to
εoptim = 1 − π(1 − εactual) (16)
From equation (15), the limit of 1 for π can beobtained when the εactual equals εoptim. In the casethat π is unity, the actual path of operation forthe process unit is the path with minimum totalentropy production. Because the value of εoptim
cannot be unity for any real process, the lowerlimit of π differs from zero. Note that εoptim isnot the same as the maximum exergy efficiency,which is unity (or 100%).
Calculations
We calculate below π for several processunits, where data can be found in the litera-ture. These are the processes of heat exchange intwo heat exchangers, catalytic oxidation of sulfurdioxide (SO2) in two reactors, two-componentseparation in an adiabatic distillation column,and a paper-drying process in a steam-heatedmulticylinder machine. The data for the cal-culations were obtained from Nummedal andKjelstrup (2001), de Koeijer and colleagues(2004), Johannessen and Kjelstrup (2004), andZvolinschi and colleagues (2006), respectively.
The results of the calculations are given intable 1. The table lists the actual entropy produc-tion rate, (d S/d t)actual
irr , and the minimum entropyproduction rate, (d S/d t)min
irr , for the selected pro-cesses, as well as their thermodynamic maturityindicators.
The heat exchange processes were calculatedbecause they are simplest to understand. Theresults are given in the two first lines of thetable. Both exchangers were geometrically iden-tical and exchanged the same heat (60 kW). Thefollowing conditions were also the same: the heattransfer coefficient (340 W/m2/K), the mass flowof hot and cold streams (1 and 0.28 kg/s, respec-tively), and the inlet and outlet temperatures ofthe hot stream (400 and 370 K, respectively). Thethermodynamic maturity indicators (π) were 0.8and 0.98 in the cocurrent and countercurrentheat exchangers, respectively. The first case hada low maturity indicator, indicating that an im-provement potential exists. In the second case,the EoF theorem was approximately fulfilled atthe outset, and the thermodynamic maturity in-dicator was high, almost unity. We conclude thatthere is not much to do to improve the counter-current heat exchanger from the way it is oper-ated now. The heat exchange process in a coun-tercurrent heat exchanger is a mature process, asis already well known by engineers.
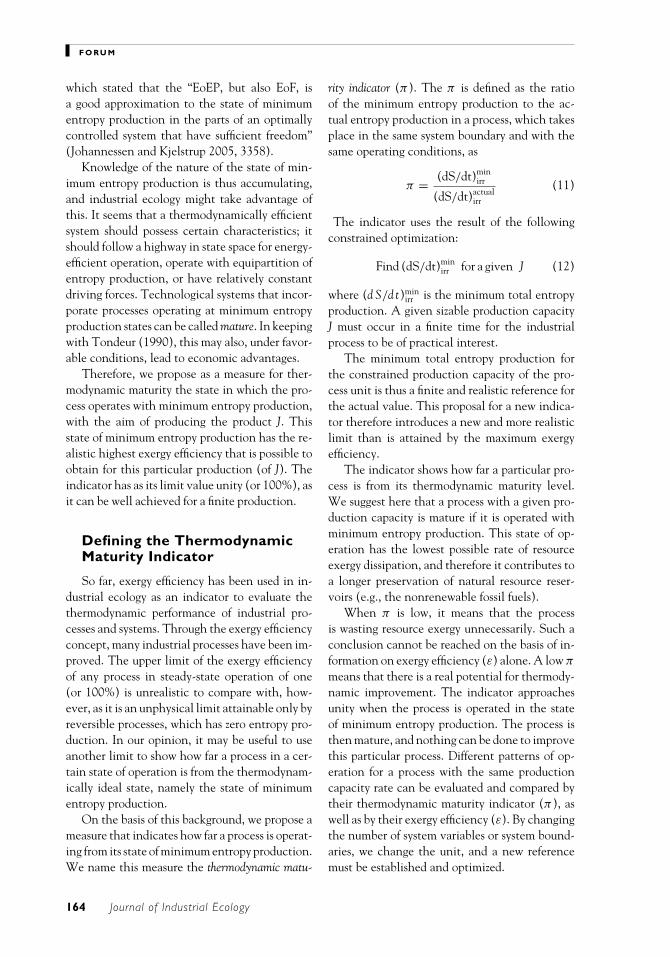
The thermodynamic maturity indicators fortwo chemical reactors for SO2 oxidation areshown in the third and fourth lines of table 1.One process is well established in industry, hav-ing been used since the 1950s, whereas the otheris newer. De Koeijer and colleagues (2004) cal-culated the total entropy production for the firstreactor from the entropy balance over the systemthat comprised a four-bed reactor and five inter-mediate heat exchangers (figure 1). The systemwas an industrial-scale reactor, and the total en-tropy production was minimized by constraintson the inlet and outlet parameters of the reac-tion mixture, with exception of the outlet reac-tion mixture pressure. A savings of 16.7% in thetotal entropy production was reported (de Koei-jer et al. 2004); the reduction of total entropyproduction was from 4.7 kW/K in the referencesystem to 4.1 kW/K in the second-law optimalone, for a total heat transfer area of 4,000 m2
and an input molar flow rate of 480 mol/s. This
Zvolinschi and Kjelstrup, Evaluating the Thermodynamic Maturity of Industrial Processes 165
F O RU M
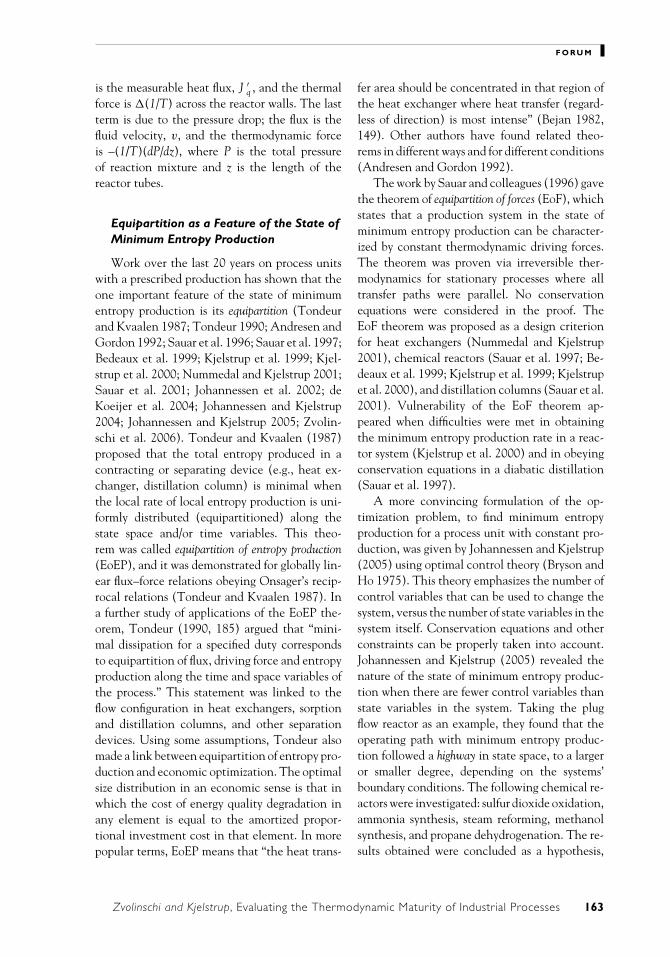
Table 1 The actual and minimum entropy production and the thermodynamic maturity indicator (π ) ofsome processes/process units.
Process \ process unit (dS/dt)actualirr (dS/dt)min
irr π
Heat exchangeb in:Co-current HE 0.48 0.38 0.80Counter-current HE 0.48 0.47 0.98SO2 oxidation in:Four-bed reactorc 122.4 106.7 0.87Tubular reactord 60.3 53.8 0.89Separation in:Adiabatic DCe 8.1 7.7 0.95HIDiCf 37.5 24.6 0.65Paper drying in:Conventional PMg 2400 2300 0.96
aFU is functional unit; and = actual and minimum entropy production, respectively (in J/K per FUa).bFU is kJ heat duty in heat exchanger (HE) (Nummedal and Kjelstrup 2001).cFU is one mole of SO3 produced in reactor (de Koeijer et al. 2004).dFU is one mole of SO3 produced in reactor (Johannessen and Kjelstrup 2004).eFU is one mole of a propylene-propane mixture (50:50 vol.%) separated in distillation column (DC) (Røsjorde andKjelstrup 2005).f FU is one mole of benzene-toluene mixture (50:50 vol%), separated in heat-integrated distillation column (HDiC)(Røsjorde et al. 2004).gFU is one kg of dry paper produced in paper machine (Zvolinschi et al. 2006).
savings was possible without a change in the re-actor design, or the total area available for heatexchange. The thermodynamic maturity indica-tor was 0.87 for the reactor, a relatively low num-ber, considering that the reactor has been in usesince the 1950s. The absolute value of the mini-mum entropy production of this reactor was high,however (4.7 kW/K).
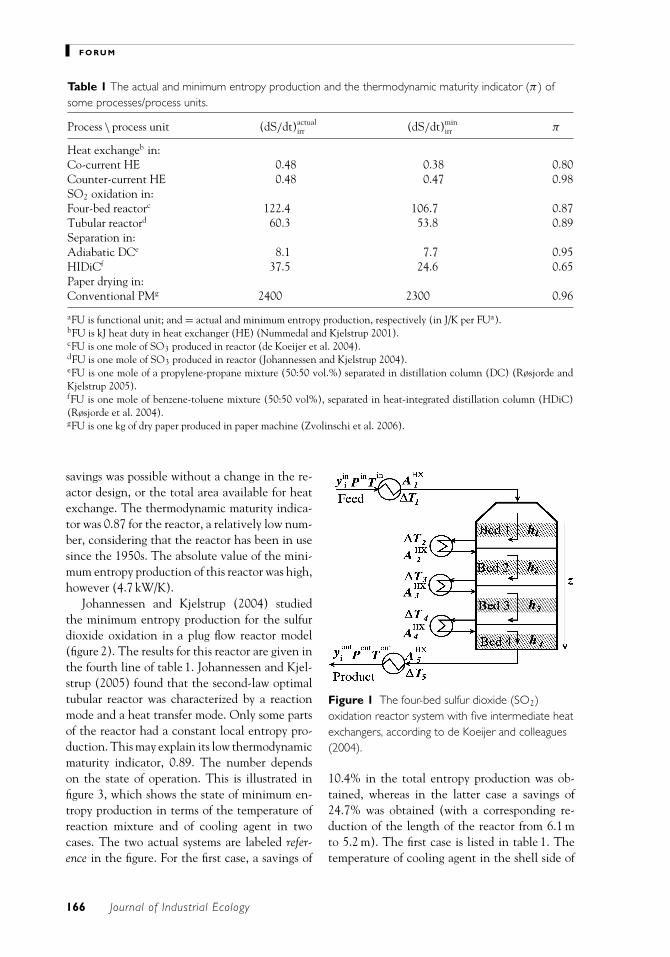
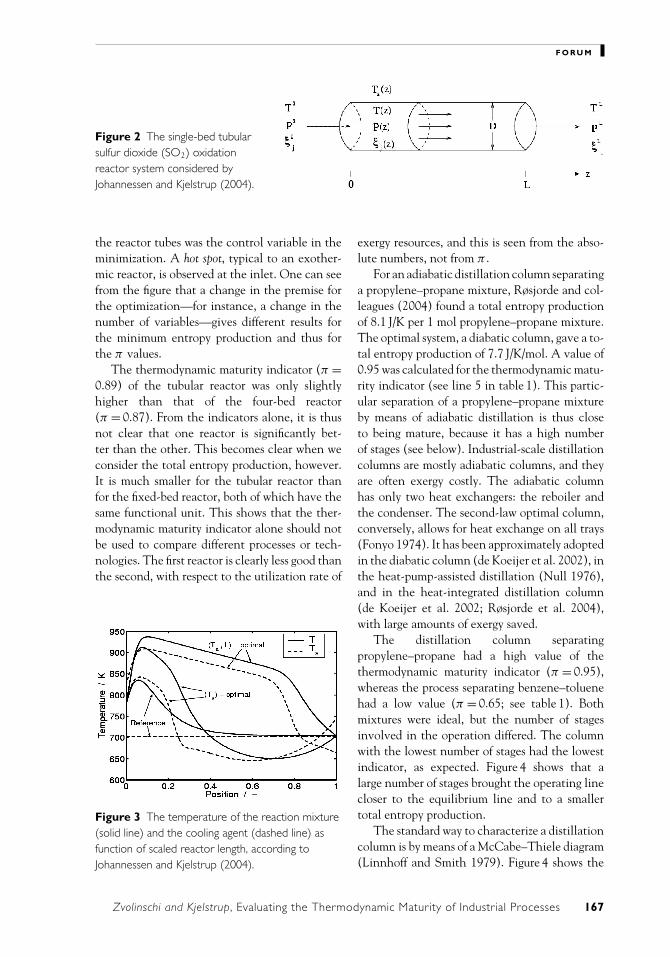
Johannessen and Kjelstrup (2004) studiedthe minimum entropy production for the sulfurdioxide oxidation in a plug flow reactor model(figure 2). The results for this reactor are given inthe fourth line of table 1. Johannessen and Kjel-strup (2005) found that the second-law optimaltubular reactor was characterized by a reactionmode and a heat transfer mode. Only some partsof the reactor had a constant local entropy pro-duction. This may explain its low thermodynamicmaturity indicator, 0.89. The number dependson the state of operation. This is illustrated infigure 3, which shows the state of minimum en-tropy production in terms of the temperature ofreaction mixture and of cooling agent in twocases. The two actual systems are labeled refer-ence in the figure. For the first case, a savings of
Figure 1 The four-bed sulfur dioxide (SO2)oxidation reactor system with five intermediate heatexchangers, according to de Koeijer and colleagues(2004).
10.4% in the total entropy production was ob-tained, whereas in the latter case a savings of24.7% was obtained (with a corresponding re-duction of the length of the reactor from 6.1 mto 5.2 m). The first case is listed in table 1. Thetemperature of cooling agent in the shell side of
166 Journal of Industrial Ecology
F O RU M
Figure 2 The single-bed tubularsulfur dioxide (SO2) oxidationreactor system considered byJohannessen and Kjelstrup (2004).
the reactor tubes was the control variable in theminimization. A hot spot, typical to an exother-mic reactor, is observed at the inlet. One can seefrom the figure that a change in the premise forthe optimization—for instance, a change in thenumber of variables—gives different results forthe minimum entropy production and thus forthe π values.
The thermodynamic maturity indicator (π =0.89) of the tubular reactor was only slightlyhigher than that of the four-bed reactor(π = 0.87). From the indicators alone, it is thusnot clear that one reactor is significantly bet-ter than the other. This becomes clear when weconsider the total entropy production, however.It is much smaller for the tubular reactor thanfor the fixed-bed reactor, both of which have thesame functional unit. This shows that the ther-modynamic maturity indicator alone should notbe used to compare different processes or tech-nologies. The first reactor is clearly less good thanthe second, with respect to the utilization rate of
Figure 3 The temperature of the reaction mixture(solid line) and the cooling agent (dashed line) asfunction of scaled reactor length, according toJohannessen and Kjelstrup (2004).
exergy resources, and this is seen from the abso-lute numbers, not from π .
For an adiabatic distillation column separatinga propylene–propane mixture, Røsjorde and col-leagues (2004) found a total entropy productionof 8.1 J/K per 1 mol propylene–propane mixture.The optimal system, a diabatic column, gave a to-tal entropy production of 7.7 J/K/mol. A value of0.95 was calculated for the thermodynamic matu-rity indicator (see line 5 in table 1). This partic-ular separation of a propylene–propane mixtureby means of adiabatic distillation is thus closeto being mature, because it has a high numberof stages (see below). Industrial-scale distillationcolumns are mostly adiabatic columns, and theyare often exergy costly. The adiabatic columnhas only two heat exchangers: the reboiler andthe condenser. The second-law optimal column,conversely, allows for heat exchange on all trays(Fonyo 1974). It has been approximately adoptedin the diabatic column (de Koeijer et al. 2002), inthe heat-pump-assisted distillation (Null 1976),and in the heat-integrated distillation column(de Koeijer et al. 2002; Røsjorde et al. 2004),with large amounts of exergy saved.
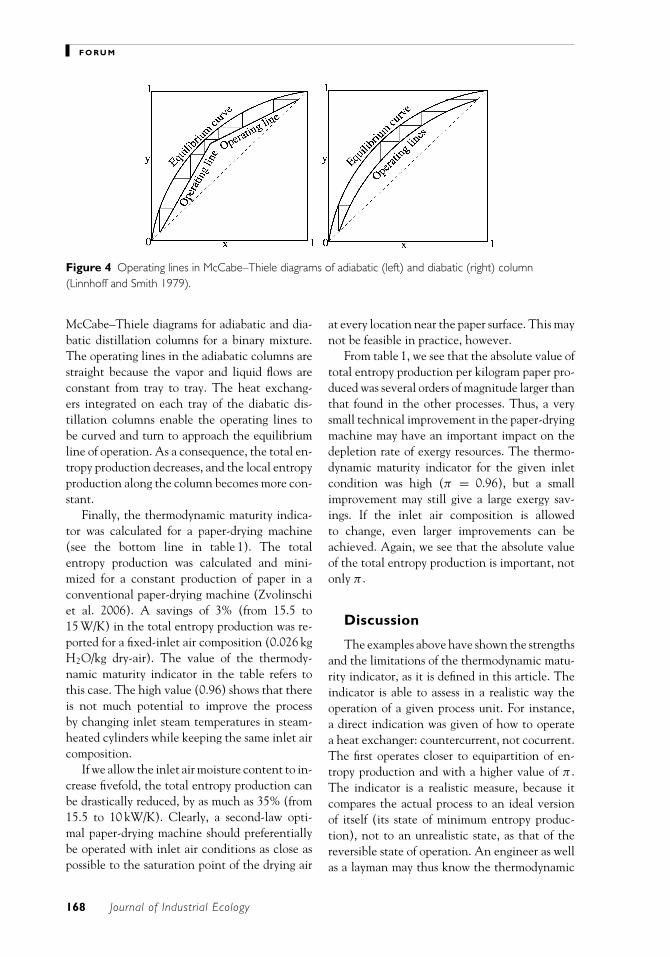
The distillation column separatingpropylene–propane had a high value of thethermodynamic maturity indicator (π = 0.95),whereas the process separating benzene–toluenehad a low value (π = 0.65; see table 1). Bothmixtures were ideal, but the number of stagesinvolved in the operation differed. The columnwith the lowest number of stages had the lowestindicator, as expected. Figure 4 shows that alarge number of stages brought the operating linecloser to the equilibrium line and to a smallertotal entropy production.
The standard way to characterize a distillationcolumn is by means of a McCabe–Thiele diagram(Linnhoff and Smith 1979). Figure 4 shows the
Zvolinschi and Kjelstrup, Evaluating the Thermodynamic Maturity of Industrial Processes 167
F O RU M
Figure 4 Operating lines in McCabe–Thiele diagrams of adiabatic (left) and diabatic (right) column(Linnhoff and Smith 1979).
McCabe–Thiele diagrams for adiabatic and dia-batic distillation columns for a binary mixture.The operating lines in the adiabatic columns arestraight because the vapor and liquid flows areconstant from tray to tray. The heat exchang-ers integrated on each tray of the diabatic dis-tillation columns enable the operating lines tobe curved and turn to approach the equilibriumline of operation. As a consequence, the total en-tropy production decreases, and the local entropyproduction along the column becomes more con-stant.
Finally, the thermodynamic maturity indica-tor was calculated for a paper-drying machine(see the bottom line in table 1). The totalentropy production was calculated and mini-mized for a constant production of paper in aconventional paper-drying machine (Zvolinschiet al. 2006). A savings of 3% (from 15.5 to15 W/K) in the total entropy production was re-ported for a fixed-inlet air composition (0.026 kgH2O/kg dry-air). The value of the thermody-namic maturity indicator in the table refers tothis case. The high value (0.96) shows that thereis not much potential to improve the processby changing inlet steam temperatures in steam-heated cylinders while keeping the same inlet aircomposition.
If we allow the inlet air moisture content to in-crease fivefold, the total entropy production canbe drastically reduced, by as much as 35% (from15.5 to 10 kW/K). Clearly, a second-law opti-mal paper-drying machine should preferentiallybe operated with inlet air conditions as close aspossible to the saturation point of the drying air
at every location near the paper surface. This maynot be feasible in practice, however.
From table 1, we see that the absolute value oftotal entropy production per kilogram paper pro-duced was several orders of magnitude larger thanthat found in the other processes. Thus, a verysmall technical improvement in the paper-dryingmachine may have an important impact on thedepletion rate of exergy resources. The thermo-dynamic maturity indicator for the given inletcondition was high (π = 0.96), but a smallimprovement may still give a large exergy sav-ings. If the inlet air composition is allowedto change, even larger improvements can beachieved. Again, we see that the absolute valueof the total entropy production is important, notonly π .
Discussion
The examples above have shown the strengthsand the limitations of the thermodynamic matu-rity indicator, as it is defined in this article. Theindicator is able to assess in a realistic way theoperation of a given process unit. For instance,a direct indication was given of how to operatea heat exchanger: countercurrent, not cocurrent.The first operates closer to equipartition of en-tropy production and with a higher value of π .The indicator is a realistic measure, because itcompares the actual process to an ideal versionof itself (its state of minimum entropy produc-tion), not to an unrealistic state, as that of thereversible state of operation. An engineer as wellas a layman may thus know the thermodynamic
168 Journal of Industrial Ecology
F O RU M
improvement potential of a particular processunit, by knowing the thermodynamic maturityindicator.
The rate of dissipation of exergy resources isalso a form of environmental damage. Diminish-ing the resource dissipation rate by operating atthe state of minimum entropy production mayreduce the environmental damage of that oper-ation. As a consequence, the (exergy) emissionsper unit of time, if not in total, can be reduced.We thus advocate a slower use of resources, witha rate of consumption that is real. The reversiblelimit for production cannot be used in thismanner.
We cannot conclude from the thermodynamicmaturity indicator, however, that we should pre-fer one process to an alternative one or one tech-nology to an alternative one. For instance, almostthe same thermodynamic maturity indicator wasobtained for the two chemical reactors in table 1.We saw that information about the absolute val-ues of the losses was necessary to know whichreactor to prefer from an exergy efficiency pointof view. A high value for the thermodynamicmaturity indicator also does not necessarily indi-cate that improving the process is meaningless.The case of paper machine drying showed that.This process is very exergy intensive, so even asmall improvement may make a large reductionin exergy loss and thus large savings in exergyresources.
In spite of its limitations, the indicator hassome interesting properties. Researchers such asAyres and colleagues (1998), Kuemmel and col-leagues (1997), and von Spakovski and col-leagues (1991) have suggested that a system canbest be related to its environment by means ofthe exergy function. The exergy measures directlythe departure of the state of a system from thatof the environment. The departure is zero onlywhen the system is in equilibrium with its envi-ronment. Such an equilibrium is, however, neveravailable in a real process. A state of minimumentropy production is, as we have already dis-cussed, obtainable and directly connected to theactual operating state of the process. The thermo-dynamic maturity indicator has a reference statethat is independent of the environment. Thereis no need to define an environmental state with
this reference, and an absolute comparison can bemade on the process unit’s thermodynamic per-formance between different localities. Togetherwith the exergy efficiency, the thermodynamicmaturity indicator can be used by industry to setthermodynamic criteria for second-law optimaloperations of industrial processes. It can also beused to defend chosen designs for the same pro-cess task in the public sector. The next step isto apply the thermodynamic maturity indicatorfor connected/integrated process units (see, e.g.,the study by Røsjorde and his colleagues [2007] tominimize the entropy production of 21 connectedprocess units). The application of π also may beextended to higher levels of integrated and com-plex industrial processes through the functionalunit employed in a life cycle assessment frame-work. More work is needed to bring it to an ag-gregated level.
Conclusions
We have proposed using a thermodynamicmaturity indicator to evaluate the performanceof process units. The indicator brings knowledgefrom irreversible thermodynamics and the state ofminimum entropy production to a level of inter-est for industrial ecology. It introduces the stateof (constrained) minimum entropy production inassessing single process units. This state is real-izable. The indicator is a pure thermodynamicindicator, which does not depend on the envi-ronment. It indicates a way in which we shouldproceed in setting up industrial processes, possiblyby paying more attention to equipartition theo-rems for process units. The π may give an argu-ment for industrial ecology to implement into in-dustrial practice (operation and design) the stateof minimum entropy production as a possibleway to reduce the exergy loss in energy-intensivesystems. It is only one of several indicatorsfor evaluating optimal operation and/or design,however.
The thermodynamic maturity indicator can-not be used to argue, on thermodynamic grounds,that one process should be replaced by another.For this, we need to compare the total en-tropy production of the competing technologies,among other things.
Zvolinschi and Kjelstrup, Evaluating the Thermodynamic Maturity of Industrial Processes 169
F O RU M
Acknowledgements
We would like to thank the Research Councilof Norway for funding this research.
References
Andresen, B. and J. M. Gordon. 1992. Optimal pathsfor minimizing entropy production in a commonclass of finite-time heating and cooling processes.International Journal of Heat and Fluid Flow 13(3):294–299.
Ayres, R. U. and K. Martinas. 1995. Waste potentialentropy: The ultimate ecotoxic? Economie Ap-pliquee XLVIII(2): 95–120.
Ayres, R. U. and A. Masini. 2004. Exergy: Referencestates and balance conditions. In Encyclopedia ofenergy, Vol. 2, edited by C. Cleveland et al. Am-sterdam: Elsevier.
Ayres, R. U., L. W. Ayres, and K. Martinas. 1998.Exergy, waste accounting, and life-cycle analysis.Energy 23(5): 355–363.
Baumgartner, S. and J. de Swaan Arons. 2003. Neces-sity and inefficiencies in the generation of waste:A thermodynamic analysis. Journal of IndustrialEcology 7(2): 113–123.
Bedeaux, D., F. Standaert, K. Hemmes, and S. Kjel-strup. 1999. Optimization of processes by equipar-tition. Journal of Non-Equilibrium Thermodynamics24(3): 242–259.
Bejan, A. 1982. Entropy generation through heat and fluidflow. New York: Wiley.
Bejan, A. 1996a. Entropy generation minimization: Themethod of thermodynamic optimization of finite-sizesystems and finite-time processes. New York: CRCPress.
Bejan, A. 1996b. Models of power plants that gener-ate minimum entropy production while operatingat maximum power. American Journal of Physics64(8): 1054–1059.
Bejan, A., G. Tsatsaronis, and M. Moran. 1996. Ther-mal design and optimization. New York. John Wiley& Sons, Inc.
Bosch, M. E., S. Hellweg, M. Huijbregts, and R.Frischknecht. 2006. Applying cumulative exergydemand (CExD) indicators to the ecoinventdatabase. International Journal of Life Cycle Assess-ment. http://www.scientificjournals.com/sj)lca/Abstract/Artikelid/8527 Accessed 9 May 2007.
Brodynasky, V. M., M. V. Sorin, and P. Le Goff. 1994.The efficiency of industrial processes: Exergy analysisand optimization. Amsterdam: Elsevier.
Bryson, A. and Y. Ho. 1975. Applied optimal controltheory: Optimization, estimation and control. NewYork: Wiley.
de Groot, S. R. and P. Mazur. 1962. Non-equilibriumthermodynamics. Amsterdam: North-Holland.
de Koeijer, G., S. Kjelstrup, H. J. van der Kooi, B.Gross, K. F. Knoche, and T. R. Andersen. 2002.Positioning heat exchangers in binary tray distil-lation using isoforce operation. Energy Conversion& Management 43(9–12): 1571–1581.
de Koeijer, G., E. Johannessen, and S. Kjelstrup.2004. The second-law optimal path of a four-bedSO2 converter with five heat exchangers. Energy29(4): 525–546.
Dones, R., C. Bauer, R. Bollinger, B. Burger, M.Faist, R. Frischknecht, T. Heck, N. Jungbluth,and A. Roder. 2003. Life cycle inventories ofenergy systems: Results of current systems inSwitzerland and other UCTE countries, 2003.http://www.ecoinvent.org/publications/ecoinvent-reports/ Accessed 18 September 2006.
Fonyo, Z. 1974. Thermodynamic analysis of rectifica-tion: Reversible model of rectification. Interna-tional Journal of Chemical Engineering 14(1): 18–27.
Førland, K. S., T. Førland, and S. Kjelstrup. 2001. Ir-reversible thermodynamics: Theory and applications.Trondheim, Norway: Tapir Academic Press.
Gouy, M. 1889. Sur l’energie utilizable [On availableenergy]. Journal de Physique 8: 501–518.
Goßling, S., H. Spitzer, and A. Von Gleich. 2001. En-tropy production as a measure for resource use:Method development and application to metal-lurgical processes. Paper presented at the inau-gural International Society for Industrial Ecol-ogy (ISIE) Conference, 12–14 November, Leiden,The Netherlands.
Johannessen, E. and S. Kjelstrup. 2004. Minimum en-tropy production in plug flow reactors: An optimalcontrol problem solved for SO2 oxidation. Energy29(12–15): 2403–2423.
Johannessen, E. and S. Kjelstrup. 2005. Numerical ev-idence for a “highway in state space” for reactorswith minimum entropy production. Chemical En-gineering Science 60(5): 1491–1495.
Johannessen, E., L. Nummedal, and S. Kjelstrup. 2002.Minimizing the entropy production in heat ex-change. International Journal of Heat and MassTransfer 45(13): 2649–2654.
Keenan, J. H. 1951. Availability and irreversibility inthermodynamics. British Journal of Applied Physics2(7): 183–192.
Kjelstrup, S., E. Sauar, D. Bedeaux, and H. van derKooi. 1999. The driving force distribution forminimum lost work in a chemical reactor closeto and far from equilibrium. I. Theory. Indus-trial Engineering Chemistry Research 38(8): 3046–3050.
170 Journal of Industrial Ecology
F O RU M
Kjelstrup, S., E. Johannessen, A. Røsjorde, L.Nummedal, and D. Bedeaux. 2000. Minimizingthe entropy production for the methanol produc-ing reaction in a methanol reactor. InternationalJournal of Applied Thermodynamics 3(4): 147–153.
Kjelstrup, S., D. Bedeaux, and E. Johannessen. 2006. El-ements of irreversible thermodynamics for engineers.Trondheim, Norway: Tapir Academic Press.
Kotas, T. J. 1985. The exergy method of thermal plantanalysis. London: Butterworths.
Kuemmel, B., S. Kruger Nielsen, and B. Sørensen.1997. Life-cycle analysis of energy systems. Roskilde,Denmark: Roskilde University Press.
Linnhoff, B. and R. Smith. 1979. The thermodynamicefficiency of distillation. Institution of Chemical En-gineers Symposium Series 56: 47–73.
Lowenthal, M. D. and W. E. Kastenberg. 1998. In-dustrial ecology and energy systems: A first step.Resources, Conservation & Recycling 24(1): 51–63.
Moran, M. J. and H. N. Shapiro. 1993. Fundamentals ofengineering thermodynamics. New York: John Wi-ley & Sons, Inc.
Null, H. R. 1976. Heat pumps in distillation. ChemicalEngineering Progress 72(7): 58–64.
Nummedal, L. and S. Kjelstrup. 2001. Equipartition offorces as a lower bound on the entropy productionin heat exchange. International Journal of Heat andMass Transfer 44(15): 2827–2833.
Nummedal, L., A. Røsjorde, E. Johannessen, and S.Kjelstrup. 2005. Second law optimization of atubular steam reformer. Chemical Engineering andProcessing 44(4): 429–440.
Onsager, L. 1931a. Reciprocal relations in irreversibleprocesses I. Physical Review 37(4): 405–426.
Onsager, L. 1931b. Reciprocal relations in irreversibleprocesses II. Physical Review 38(12): 2265–2279.
Prigogine, I. 1947. Etude thermodynamique desphenomenes irreversibles [Thermodynamic study ofirreversible phenomena]. Paris: Dunod.
Prigogine, I. 1955. Introduction to thermodynamics ofirreversible processes. Springfield, IL: Charles C.Thomas.
Prigogine, I. 1961. Thermodynamics of irreversible pro-cesses. New York: Wiley.
Rant, Z. 1956. Exergie, Ein Neues Wort Fur TechnischeArbeitfahigkeit [Exergie, a new word for technicalwork capability]. Forschung Ing-Wes 22(1): 6–37.
Reistad, G. M. 1970. Availability: Concepts and applica-tions. PhD thesis, University of Wisconsin, Madi-son, WI.
Røsjorde, A. and S. Kjelstrup. 2005. The second lawoptimal state of a diabatic binary tray distilla-tion column. Chemical Engineering Science 60(5):1199–1210.
Røsjorde, A., M. Nakaiwa, K. Hauang, K. Iwakabe,and S. Kjelstrup. 2004. Second law analysis ofan internal heat-integrated distillation column.In Proceedings of “Efficiency, Cost and Optimi-sation of Energy Systems” (ECOS) Conference,edited by R. Rivero, L. Monray, R. Pulido, andG. Tsatsaronis. Guanajuato, Mexico: Institute ofPetroleum.
Røsjorde, A., S. Kjelstrup, E. Johannessen, and R.Hansen. 2007. Minimizing the entropy produc-tion in a chemical process for dehydrogenation ofpropane. Energy 32(4): 335–343.
Sauar, E., S. Kjelstrup, and K. M. Lien. 1996. Equipar-tition of forces: A new principle for process designand operation. Industrial Engineering Chemistry Re-search 35(11): 4147–4153.
Sauar, E., R. Rivero, S. Kjelstrup, and K. M. Lien. 1997.Diabatic column optimization compared with iso-force columns. Energy Conversion and Management38(15): 1777–1783.
Sauar, E., G. Siragusa, and B. Andresen. 2001. Equalthermodynamic distance and equipartition offorces principles applied to binary distillation.Journal of Physical Chemistry A 105(11): 2312–2320.
Sciubba, E. 2004. From engineering economics to ex-tended exergy accounting: A possible path frommonetary to resource based costing. Journal of In-dustrial Ecology 8(4): 19–40.
Seider, W. D., J. D. Seader, and D.R. Lewin. 2004.Product & process design principles: Principles, anal-ysis and evaluation. New York: John Wiley & Sons,Inc.
Stodola, A. 1898. Die Kreisprozesse der Gasmaschine[The cycle processes of the gas turbine]. Journal ofEngineer (39): 1086–1091.
Sussman, M. V. 1980. Availability (exergy) analysis—Aself instruction manual. Medford, MA: Tufts Uni-versity.
Szargut, J., D. R. Moris, and F. R. Steward. 1988. Ex-ergy analysis of thermal, chemical and metallurgicalprocesses. New York: Hemisphere.
Tolman, R. C. and P. C. Fine. 1948. On the irreversibleproduction of entropy. Reviews of Modern Physics20(1): 51–77.
Tondeur, D. 1990. Equipartition of entropy production:A design and optimisation criterion in chemicalengineering. In Advances in Thermodynamics, Vol.4, edited by S. Sieniutycz and P. Salamon. NewYork: Taylor & Francis.
Tondeur, D. and E. Kvaalen. 1987. Equipartition ofentropy production. An optimality criterion fortransfer and separation processes. Industrial Engi-neering and Chemistry Research 26(1): 50–56.
Zvolinschi and Kjelstrup, Evaluating the Thermodynamic Maturity of Industrial Processes 171
F O RU M
von Gleich, A., R. U. Ayres, and S. Goßling-Reisemann. 2007. Entropy as a measure ofresource consumption—Application to primaryand secondary copper production. In Sustainablemetals management, Vol. 19. Eco-efficiency in in-dustry and science. New York: Springer.
von Spakovski, M. R., D. Fravat, and M. Betato. 1991.A global second law approach to the evalua-tion of energy-conversion systems taking into ac-count economic and environmental factors. En-tropie (164–165): 35–44.
Wall, G. 1977. Exergy—A useful concept within resourceaccounting. Report no. 77-42. Institute of Theo-retical Physics, Goteborg, Sweden.
Wall, G. 1988. Exergy flows in industrial processes.Energy 13(2): 197–208.
Zvolinschi, A., E. Johannessen, and S. Kjelstrup. 2006.The second-law optimal operation of a paper dry-ing machine. Chemical Engineering Science 61(11):3653–3662.
About the Authors
Anita Zvolinschi was a doctoral student inthe Industrial Ecology Programme at the Nor-wegian University of Science and Technology(NTNU) in Trondheim, Norway, at the time thisarticle was written. She is now working as a seniorprocess engineer at StatoilHydro ASA, Norway.Signe Kjelstrup is a professor in the ChemistryDepartment, also at NTNU.
172 Journal of Industrial Ecology