an integrated an integrated approach for data, … to develop more concrete recommendations to...
TRANSCRIPT
An Integrated Approach for Data, Policy, Financing
Report
An integrated approach to leaving no one behindOverview and methodology
December 2016
Overseas Development Institute203 Blackfriars RoadLondon SE1 8NJ
Tel. +44 (0) 20 7922 0300 Fax. +44 (0) 20 7922 0399 E-mail: [email protected]
www.odi.org www.odi.org/facebook www.odi.org/twitter
Readers are encouraged to reproduce material from ODI Reports for their own publications, as long as they are not being sold commercially. As copyright holder, ODI requests due acknowledgement and a copy of the publication. For online use, we ask readers to link to the original resource on the ODI website. The views presented in this paper are those of the author(s) and do not necessarily represent the views of ODI.
© Overseas Development Institute 2016. This work is licensed under a Creative Commons Attribution-NonCommercial Licence (CC BY-NC 4.0).
Cover photo: A Samburu warrior observes a road far below him from the top of Ololokwe Mountain, Kenya. © Frederic Courbet/Panos.
Acknowledgements
This report has been contributed to and written by an international and multidisciplinary team of researchers comprising: Tanvi Bhatkal, Catherine Blampied, Soumya Chattopadhyay, Maria Ana Jalles D’Orey, Romilly Greenhill, Tom Hart, Tim Kelsall, Cathal Long, Shakira Mustapha, Emma Samman, Moizza Binat Sarwar, Catherine Simonet, Elizabeth Stuart, Olivia Tulloch and Joseph Wales (Overseas Development Institute).
We are most grateful to all the interview participants we learnt from during the course of the work and to the following individuals for their support and facilitation of the research process: Sarah Parker (ODI) and Gideon Rabinowitz (Oxfam GB); in Kenya: Njeru Kirira, Rose Muriithi and Maundu Pius (Geific); Lilian Otiso and Jessica Kizungu (LVCT Health); Felister Kioko and Abraham Kisumbat (Kenya Red Cross); in Nepal: Sambriddhi Khare (Institute of Advance Communication, Education and Research), and the DFID Nepal team. Peer review for this and the underlying case study reports was provided by Louisa Dennison, Mikaela Gavas, Jackie Makaaru Arinaitwe, Rozalind McCollum, Deepak Paudel, Karen Rono, Bishnu Thapa, Momodou Touray, Samburu Wa-Shiko and Leni Wild. The authors are grateful for their carefully considered comments. Sophy Kershaw and Aaron Griffiths provided editorial support. Any mistakes, however, remain the authors’ own.
This material has been funded by UK Aid from the UK Government. However, the views expressed do not necessarily reflect the UK Government’s official policies.
An integrated approach to leaving no one behind 3
Key messages
• Leaving no one behind is a key commitment of the Sustainable Development Goals (SDGs). What this means in practice remains open to interpretation, and there is a danger this ambition will not be implemented or monitored effectively.
• To tackle this challenge, ODI has piloted stocktake exercises to understand the leave no one behind agenda, in Kenya and Nepal in the health and roads sectors. This paper summarises what we have learnt.
• We aimed to develop an integrated approach to understanding who is left behind and how data, policy, finance and institutions are influencing efforts to deliver services and infrastructure to these groups.
• The main challenge was accessing disaggregated time-series data on service and infrastructure delivery to those left behind. The availability of formal or informal data should be a key criterion for future case selection.
• Overall our pilot stocktakes suggest that an integrated approach adds value, and that additional cases would enable us to develop more concrete recommendations to ensure no one is left behind by 2030.
4 ODI Report
An integrated approach to leaving no one behind 5
Contents
Acknowledgements 3
Key messages 4
Executive summary 7
1. Introduction 9
1.1 Rationale for the study 9
1.2 What are the SDGs? What does it mean to Leave No One Behind? 9
1.3 The SDGs and health 11
1.4 The SDGs and roads 11
2. Conceptual framework, case selection, and methodology 12
2.1 Definitions 12
2.2 The centrality of politics 12
2.3 Conceptual framework and research methods 13
2.4 Case selection (national and sub-national) 14
3. What do the case studies suggest about who is being left behind? 17
3.1 Access to healthcare in Kenya: who is left behind? 17
3.2 Access to healthcare in Nepal: who is left behind? 19
3.3 Access to roads in Kenya: who is left behind? 20
4. How well did our methodology on data, policy and financing work, and what does it tell us? 22
4.1 Data: Is data on who is being left behind available and is it being used? 22
4.2 Policy: Do the countries have constitutional and policy frameworks that support those left behind? 23
4.3 Finance: To what extent are resources allocated and delivered to progressive and inclusive activities? 24
4.4 How well are data, policy and financing translating into effective delivery of services and infrastructure? 27
5. Conclusions and reflections on the methodology 31
References 33
List of boxes and figures
Boxes
Box 1. SDG Goal 3, its targets and means of implementation 10
Box 2. Case studies: Kenya and Nepal 15
Box 3. Local fieldwork in Kenya: Narok and West Pokot 15
Box 4. Local fieldwork in Nepal: Kapilvasthu and Pyuthan 16
Box 5. The Composite Coverage Index (CCI) of reproductive, maternal, newborn
and child-health (RMNCH) service delivery 18
Box 6. Focus-group discussions in Nepal: key findings 27
Box 7. Focus-group discussions in Kenya: key findings 28
Figures
Figure 1. A working causal model 14
Figure 2. Health access in Kenya by income level, average CCI in counties 19
Figure 3. Health access in Kenya by geographic location, average CCI in counties 19
Figure 4. Health access in Nepal by geographic location, average CCI in clusters of districts 20
Figure 5. Health access in Nepal by geographic location and ethnicity, average CCI in clusters of districts 21
Figure 6. Correlation between health development spending per capita
and percentage of population in bottom wealth quintile, by county, Kenya 25
6 ODI Report
An integrated approach to leaving no one behind 7
Executive summary
The commitment to ‘leave no one behind’, part of the United Nations (UN) Sustainable Development Goals (SDGs), is a much-lauded yet elusive agenda. In spite of making multiple references to this ambition, the outcome document for the SDGs remains open to interpretation on what precisely is meant by ‘leaving no one behind’. There is a danger that, while the achievement of this ambition is pivotal to the success of Agenda 2030, it will not be implemented or monitored in the same way as other aspects of the SDGs.
This report summarises the methodology and main findings of an initial set of stocktakes on what leaving no one behind really means in Kenya and Nepal. The aim of the stocktakes is to explore the specific circumstances and needs of marginalised communities at the national and sub-national levels in the health sector in both countries, and in the roads sector in Kenya.
One purpose of the case studies is to understand the existing data on access to healthcare and roads, and what these tell us about who is left behind. An equally important objective is to explore the possibility of developing a multi-faceted methodology, that brings together an assessment of who is left behind, the extent to which policies and financing focus on those left behind, and how well this translates into effective delivery of infrastructure and services. The methodology, which has been piloted in the initial case studies, brings together analysis of quantitative data, key informant interviews, reviews of secondary literature and, crucially, focus-group discussions with those left behind at national level and in two sub-national regions in each country.
The main findings of these initial studies are as follows:
• Data on who is left behind in terms of access to healthcare and roads are not sufficiently disaggregated or timely. Lack of accurate time-series data broken down to the appropriate administrative level makes it difficult to track the contribution of data, policy and financing to improving access over time.
• The data that are available suggest that those left behind in terms of access to healthcare are those with low incomes, in rural areas, and, in Kenya, those living in households where women have low levels of formal education. Ethnicity appears to be correlated with access in Nepal and some areas of Kenya. Households with more than one of these characteristics are particularly affected. In the Kenyan roads sector, it is not possible
to disaggregate access by group, but on average households in poor and remote counties live much further away from roads than those in other counties.
• In both Kenya and Nepal, there are progressive policy commitments that should support efforts towards leaving no one behind. Kenya has a commitment to ‘eventually provide all-season roads within 2 km for all Kenyans’, although this is the lowest of six priorities in the roads sector. In the health sector, in both countries, there is a commitment to accelerate progress towards universal health coverage. In Nepal, essential health services are free for all, a Vulnerable Community Development Plan has been established to ensure that principles and procedures relating to marginalised groups are integrated in the health sector and there is strong coordination with development partners supporting a range of inclusive health policies.
• The two sectors differ when it comes to aggregate budget allocations to leave no one behind. In Nepal’s health sector, spending is focused on preventative and primary healthcare, which is most likely to benefit those left behind. In Kenya, the devolution of health spending to district level has led to an increase in spending and a shift towards lower tiers of healthcare, which should also help those left behind. However, in the Kenya roads sector, national level spending is skewed away from those left behind, in line with the degree of policy prioritisation placed on this issue. Across both sectors and countries, finance remains insufficient and is not always efficiently spent.
• In Kenya, finance is relatively equitable when it comes to the allocations across counties. Poorer counties receive larger transfers per capita and appear to spend more of these funds on health and roads. However, it is unclear whether spending within countries is similarly progressive. In Nepal, lack of data makes it difficult to conduct similar quantitative analysis, but allocations across districts do not appear to be well justified on measures of exclusion.
• Lack of disaggregated time-series data makes it difficult to assess the extent to which data, policy and financing is translating into access to roads and healthcare. However, our research suggests that in both countries there are technical and political factors that impede progress.
• Access to disaggregated and recent data remains a key challenge, and future case selection could consider screening for availability of official or unofficial data.
• However, our overall assessment of our approach is that bringing together data, policy, financing and political analyses adds value. We hope that these pilot
stocktakes can be used as the basis for additional research, by ourselves and others, to help governments, international partners, researchers, civil-society organisations and others to understand better how we can ensure no one is left behind by 2030.
8 ODI Report
An integrated approach to leaving no one behind 9
1. Introduction
1.1 Rationale for the studyThe commitment to leave no one behind, part of the United Nations (UN) Sustainable Development Goals (SDGs), is a much-lauded yet elusive agenda. In spite of making multiple references to this ambition, the outcome document for the SDGs remains open to interpretation on what precisely is meant by ‘leaving no one behind’. There is a danger that, while the achievement of this ambition is pivotal to the success of Agenda 2030, it will not be implemented or monitored in the same way as other aspects of the SDGs.
In this paper, we begin to develop a methodology for a stocktake of what leave no one behind means for two countries: Kenya and Nepal. We explore the specific circumstances and needs of marginalised communities at the national level and in two sub-national communities in each country. We focus on targets within two goal areas: health and roads, analysing health in both countries, and roads only in Kenya.1 Our objective is to move towards a more comprehensive and detailed understanding of what it means to be left behind, and to begin to identify context-specific solutions to its correction, as well as complementing the work of others exploring analogous aspects of the ambition to leave no one behind.2
The purpose of these case studies is two-fold. Firstly, to understand the state of existing data on access to healthcare and roads, and what, if anything, these tell us about who is left behind. Secondly, to explore the possibility of developing a multi-faceted methodology – one that brings together an assessment of who is left behind, how well public finance is allocated to these people, how well finance is translated into effective service delivery, and the political and technical bottlenecks that undermine progress. We also sought, by using focus-group discussions at sub-national level, to start to understand what marginalised people themselves say they want and need, as well as what they experience. Once we have a ‘proof of concept’, we hope that this can be replicated in other countries and over time.
This overview paper does not aim to be a ‘synthesis’ report, as only two case studies have been undertaken so far, and only one in the roads sector. We also don’t explicitly aim to compare the two case studies, which were not selected for that purpose. Rather, we hope to bring out some early
lessons from the research, and to discuss the extent to which the methodology is ‘fit-for-purpose’, identifying lessons for future iterations.
1.2 What are the SDGs? What does it mean to Leave No One Behind?The 17 Sustainable Development Goals with their 169 targets, which were approved by all 193 UN Member States, paint an inspiring vision of what the world could look like in 2030. Unlike for the Millenium Development Goals that preceded them, a fundamental principle of the SDGs – also known as Agenda 2030 – is to leave no one behind. The SDGs focus on reducing inequities and inequality both between and within countries, by tackling marginalisation and ensuring that the needs of the poorest are central to the achievement of all goals. Indeed, the SDGs outcome document explicitly specifies that the goals should be met for all segments of society, with an aim to reach those furthest behind first (UN, 2015). Goal 10 – the inequality goal – includes the specific target to: ‘By 2030, empower and promote the social, economic and political inclusion of all, irrespective of age, sex, disability, race, ethnicity, origin, religion or economic or other status’ (Target 10.2). In short, this is an affirmative action agenda.
The SDG Declaration (UN, 2015) is also clear that the term ‘left behind’ refers to particular people whose identity – their membership of one or more groups – means that they face specific discrimination and lack both voice and power. It states: ‘Those whose needs are reflected in the Agenda include all children, youth, persons with disabilities (of whom more than 80 per cent live in poverty), people living with HIV/AIDS, older persons, indigenous peoples, refugees and internally displaced persons and migrants’ (para 23). Elsewhere it states: ‘We emphasize the responsibilities of all States… to respect, protect and promote human rights and fundamental freedoms for all, without distinction of any kind as to race, colour, sex, language, religion, political or other opinion, national or social origin, property, birth, disability or other status.’
It also stresses that efforts to leave no one behind are inclusive of poor people, and extend to the concept of multi-dimensional poverty. Paragraph 24 reads: ‘We are committed to ending poverty in all its forms and
1 Section 5 outlines why we focused on roads in one country only.
2 This includes the civil-society group Civicus and the think-tank Development Initiatives.
dimensions, including by eradicating extreme poverty by 2030.’ The paragraph on partnerships in the document’s preamble emphasises the needs of the ‘poorest’ as well as the most vulnerable (UN, 2015).
The leave no one behind concept is about whether a person’s characteristics (inherent or perceived) exclude them from the opportunities enjoyed by others. These characteristics may overlap and fuel each other. A woman with disabilities who lives in a rural area, for example, may suffer from multiple and intersecting forms of inequality. In this report, we refer to poor and marginalised (or excluded) people to capture the above concepts, while recognising that not all marginalised people are poor.3
If this vision to leave no one behind becomes a reality, it will correct the course of the current trajectory of development, which has been one of extraordinary progress but deepening inequality (Vandemoortele, 2009). Too great a
focus on average progress at national level has masked major disparities within countries: between urban and rural areas, men and women, and ethnic, language and caste groups (UN ESCAP, 2013), among others. For example, of the estimated 780 million illiterate adults worldwide, nearly two-thirds are women (World Bank (WB), 2016). Children are also disproportionately living in poverty: in 2013 they had twice the poverty rate of adults (19.5% vs 9.2%) and their share of overall extreme poverty is 50.2%, despite comprising only a third of the world population (Newhouse et al., 2016).
Clearly, this has obscured the true trajectories of individuals and the ways in which membership of marginalised groups intersect (Kabeer, 2010). The SDGs have recognised that the lack of disaggregated data, especially at sub-national levels, has furthered a focus on national-level average progress, thus hampering construction of strategies to address issues faced by marginalised groups.
Box 1. SDG Goal 3, its targets and means of implementation4
Goal 3: Ensure healthy lives and promote well-being for all at all ages
3.1 By 2030, reduce the global maternal mortality ratio to less than 70 per 100,000 live births
3.2 By 2030, end preventable deaths of newborns and children under 5 years of age, with all countries aiming to reduce neonatal mortality to at least as low as 12 per 1,000 live births and under-5 mortality to at least as low as 25 per 1,000 live births
3.3 By 2030, end the epidemics of AIDS, tuberculosis, malaria and neglected tropical diseases and combat hepatitis, water-borne diseases and other communicable diseases
3.4 By 2030, reduce by one third premature mortality from non-communicable diseases through prevention and treatment and promote mental health and well-being
3.5 Strengthen the prevention and treatment of substance abuse, including narcotic drug abuse and harmful use of alcohol
3.6 By 2020, halve the number of global deaths and injuries from road traffic accidents
3.7 By 2030, ensure universal access to sexual and reproductive health-care services, including for family planning, information and education, and the integration of reproductive health into national strategies and programmes
3.8 Achieve universal health coverage, including financial risk protection, access to quality essential health-care services and access to safe, effective, quality and affordable essential medicines and vaccines for all
3.9 By 2030, substantially reduce the number of deaths and illnesses from hazardous chemicals and air, water and soil pollution and contamination
3.a Strengthen the implementation of the World Health Organization Framework Convention on Tobacco Control in all countries, as appropriate
3.b Support the research and development of vaccines and medicines for the communicable and non-communicable diseases that primarily affect developing countries, provide access to affordable essential medicines and vaccines, in accordance with the Doha Declaration on the TRIPS Agreement and Public Health, which affirms the right of developing countries to use to the full the provisions in the Agreement on Trade-Related Aspects of Intellectual Property Rights regarding flexibilities to protect public health, and, in particular, provide access to medicines for all
3.c Substantially increase health financing and the recruitment, development, training and retention of the health workforce in developing countries, especially in least developed countries and small island developing States
3.d Strengthen the capacity of all countries, in particular developing countries, for early warning, risk reduction and management of national and global health risks
Source: https://sustainabledevelopment.un.org/sdg3.
3 See page 12 for a more extensive description of how we have defined ‘marginalised’ in the context of this exercise.
4 While the means of implementation (MoI) across the goals are reflected in Goal 17, and the Addis Ababa Action Agenda (www.un.org/esa/ffd/wp-content/uploads/2015/08/AAAA_Outcome.pdf), the specific MoIs for each goal are listed by letters underneath the relevant target set. So for Goal 3, there are four MoI listed, 3a-3d.
10 ODI Report
An integrated approach to leaving no one behind 11
1.3 The SDGs and healthFor this stocktake we have primarily chosen to focus on health. The SDG that directly relates to health is Goal 3: ‘Ensure healthy lives and promote well-being for all at all ages.’ There are 13 targets associated with the goal (see Box 1).
In this report we focus our attention on Sub-Goal 3.8: universal health coverage. We chose this because it underpins efforts to leave no one behind across the other sub-goals and targets. Furthermore, one of the most challenging aspects of achieving this universal health coverage is delivering services to those most in need, more specifically to those who are hardest to reach (Wong, 2015). We could have chosen a wider range of targets to focus on, including some that are more outcome-based, but we felt the focus needed to be relatively narrow in order to keep the scope of the analysis manageable (see Section 5 below for further reflections on target selection.)
For those left behind health outcomes will also be affected by other factors, including overall income, infrastructure, education and so on (World Health Organization (WHO), 2015; Tangcharoensathien et al., 2015; WHO, 2016). Ideally, any leave no one behind stocktake would take into account the impact of progress in these wider dimensions when considering public policy and financing to support better health for those left behind. However, this would have widened considerably the scope and ambition of the exercise. Future stocktakes should consider whether a narrow focus on public healthcare provision provides an adequate picture of how to leave no one behind in the health sector.
1.4 The SDGs and roadsThe roads sector and, more broadly, transport systems, are specifically referenced by the SDGs in both Goal 95 and Goal 11:6
Goal 9.1: ‘Develop quality, reliable, sustainable and resilient infrastructure, including regional and transborder infrastructure, to support economic development and human well-being, with a focus on affordable and equitable access for all’.
Goal 11.2: ‘By 2030, provide access to safe, affordable, accessible and sustainable transport systems for all, improving road safety, notably by expanding public transport, with special attention to the needs of those in vulnerable situations, women, children, persons with disabilities and older persons’.
These goals highlight the fact that roads are primarily important, both to the SDGs and the LNOB agenda, because of their contribution to other outcomes – specifically economic development and human well-being. Having a road within a certain distance will influence poverty by supporting incomes, and by enabling poor and marginalised people to access public services more easily. As these goals highlight, most of these outcomes will require roads as well as accessible and affordable transport. We chose in this report to focus on average distance from an all-weather road as the key access indicator, even though it is not a specific SDG target, as distance from a road impacts on both incomes and access to services.
There is inevitably a trade-off between investing in roads in rural/marginalised areas, which will make a direct contribution to leaving no one behind, and investing in roads that will support economic growth and hence indirectly impact on those left behind (through the generation of additional tax revenues or additional incomes.) The focus of this study is on policies to target directly those left behind, while recognising that indirect impacts can also be important.
5 Goal 9 is entitled ‘Build resilient infrastructure, promote inclusive and sustainable industrialisation and foster innovation’.
6 Goal 11 is entitled ‘Make cities and human settlements inclusive, safe, resilient and sustainable’.
2. Conceptual framework, case selection, and methodology
2.1 DefinitionsDefining those left behind is a crucial element in determining how to ensure inclusion and allow us to map the current state of, and progress towards, achieving Agenda 2030.
Across countries, regardless of their macroeconomic condition, certain groups have been historically left behind from the benefits of development programmes and practices. Some demographic characteristics of these marginalised groups are country-specific.7 However, there are markers of excluded groups that are nearly universal across countries – those in chronic poverty for example, those living in rural locations, those engaged in agriculture, women, the children and elderly, ethnic and religious minorities and indigenous populations, and those with minimal formal education. The propensity of marginalisation is even more acute for sub-groups meeting multiple conditions of exclusion – poor rural women, for example, and uneducated indigenous communities.8
In this study, we identified those left behind in the health sector in the following way: first, we created a list of marginalised groups on the basis of (i) groups identified in the SDGs as being vulnerable to marginalisation; and (ii) marginalised groups identified in the Kenyan and Nepali context. We then assessed the extent to which these groups are left behind in terms of access to health care, as measured by the Composite Coverage Index (CCI) of reproductive, maternal, new-born and child-health (RMNCH) service delivery. Data were drawn from the latest Demographic and Health Surveys (DHS).
The key drivers of exclusion that we evaluate are household income, geographic location of the household, age and education level of women receiving RMNCH health services, and whether households belong to minorities. In doing so, we benchmark the degree of
marginalisation in Kenya to international levels determined by the WHO from similar exercises in other developing countries using the same 2014 Kenya Democratic and Health Survey (KDHS) database.9
In the roads sector, lack of data availability meant that we could only assess who is left behind based on geographical area: we were only able to assess the average distance to a nearest road by county, rather than by groups within counties. This is a weakness in the methodology that needs to be considered for future stocktakes.
2.2 The centrality of politicsKnowing who is left behind in a country is one thing, actually doing something about it is another. Insofar as politics is about ‘who gets what, when and how’ (Laswell, 1936), creating policies to improve the lives of marginalised people is an inherently political process.
As we have seen, one of the goals of ‘leaving no one behind’ in the field of health is universal health coverage. However, no country has ever succeeded in making affordable health care available to all without either employing progressive rates of taxation or pooling resources and risks for health insurance (or some combination of the two). In the first scenario, to put it simply, the rich subsidise the poor, and in the second the healthy subsidise the sick (and sometimes the poor as well) (Bump, 2010). To get to the desirable end-state of universal coverage usually requires an arduous political process of building an imagined community and confronting vested interests.
Further, to provide a healthcare system capable of reaching all, hard choices have to be made about the package of services on offer. Are sophisticated forms of curative care affordable? If not, resources have to be
7 See ODI series Who is Being Left Behind in sub-Saharan Africa, Asia and Latin America? www.odi.org/publications/10288-left-behind-africa-asia-latin-america-sdgs.
8 See www.healthypeople.gov/2020/about/foundation-health-measures/Disparities for a summary of common drivers of disparities in health-benefit access and CDC Health Disparities and Inequalities Report. www.cdc.gov/MMWR/pdf/other/su6203.pdf.
9 ‘RMNCH composite coverage index: latest situation and change over time’. www.who.int/gho/health_equity/services/rmnch_composite_coverage_index_text/en/.
12 ODI Report
An integrated approach to leaving no one behind 13
diverted from these kinds of care, and into preventative and primary care for the poorer majority. And if the percentage of national resources spent on health is to increase, money must be taken away from something else, for example defence, or consumption. All are political choices.
Even if an increased level of resources can be allocated to the right forms of health care, there is no guarantee that these resources will be well spent. Different branches of the administration and different types of health providers need to be coordinated effectively to ensure that resources are used efficiently. Money has to be managed well. Healthcare professionals need to be incentivised to do their jobs well. Indeed, getting health workers to take up posts in some of the remote areas where the most marginalised people live is often a challenge in developing countries (WB, 2003). In some cases, communities have to be incentivised to seek modern health care or to allow vulnerable sub-groups to receive treatment, and health workers need to be sensitised to issues of access to ensure that health services are open to all. Health services are also improved when ordinary people are consulted about their healthcare needs and about how they experience the healthcare system. Monitoring, motivating, supervising and consulting – activities inextricably bound up with health governance – are all inherently political.
Similar arguments can be made for roads. For example, extending roads into areas where the gains are not obvious in economic cost-benefit terms, implies transferring resources from the ‘infrastructure-rich’ areas of the country, which typically generate higher levels of taxable economic activity, to the ‘infrastructure-poor’ areas. Building roads can increase land value but also permits access to previously inaccessible areas including environmentally sensitive ones. As with healthcare initiatives, there are winners and losers in road construction and maintenance.
All of this implies that any study of a country’s readiness for tackling problems of exclusion must take political factors into account. Indeed, even the generation of data that allows us to identify those left behind and monitor their progress has a political dimension, insofar as resources have to be found for data collection, data agencies need to be managed, choices must be made about what categories of person to collect data on, and so forth. Thus in asking: ‘What do we know about who in Kenya and Nepal is being left behind, why, and what can be done about it?’, this study takes an explicitly political focus.
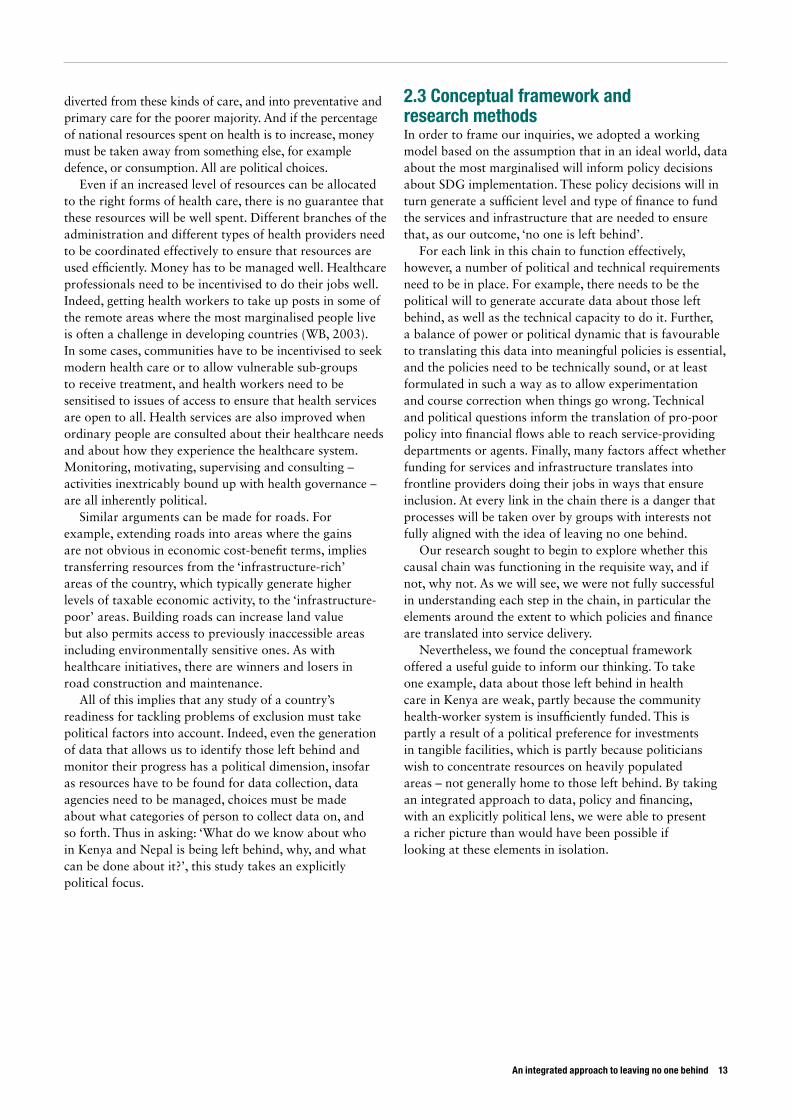
2.3 Conceptual framework and research methods In order to frame our inquiries, we adopted a working model based on the assumption that in an ideal world, data about the most marginalised will inform policy decisions about SDG implementation. These policy decisions will in turn generate a sufficient level and type of finance to fund the services and infrastructure that are needed to ensure that, as our outcome, ‘no one is left behind’.
For each link in this chain to function effectively, however, a number of political and technical requirements need to be in place. For example, there needs to be the political will to generate accurate data about those left behind, as well as the technical capacity to do it. Further, a balance of power or political dynamic that is favourable to translating this data into meaningful policies is essential, and the policies need to be technically sound, or at least formulated in such a way as to allow experimentation and course correction when things go wrong. Technical and political questions inform the translation of pro-poor policy into financial flows able to reach service-providing departments or agents. Finally, many factors affect whether funding for services and infrastructure translates into frontline providers doing their jobs in ways that ensure inclusion. At every link in the chain there is a danger that processes will be taken over by groups with interests not fully aligned with the idea of leaving no one behind.
Our research sought to begin to explore whether this causal chain was functioning in the requisite way, and if not, why not. As we will see, we were not fully successful in understanding each step in the chain, in particular the elements around the extent to which policies and finance are translated into service delivery.
Nevertheless, we found the conceptual framework offered a useful guide to inform our thinking. To take one example, data about those left behind in health care in Kenya are weak, partly because the community health-worker system is insufficiently funded. This is partly a result of a political preference for investments in tangible facilities, which is partly because politicians wish to concentrate resources on heavily populated areas – not generally home to those left behind. By taking an integrated approach to data, policy and financing, with an explicitly political lens, we were able to present a richer picture than would have been possible if looking at these elements in isolation.
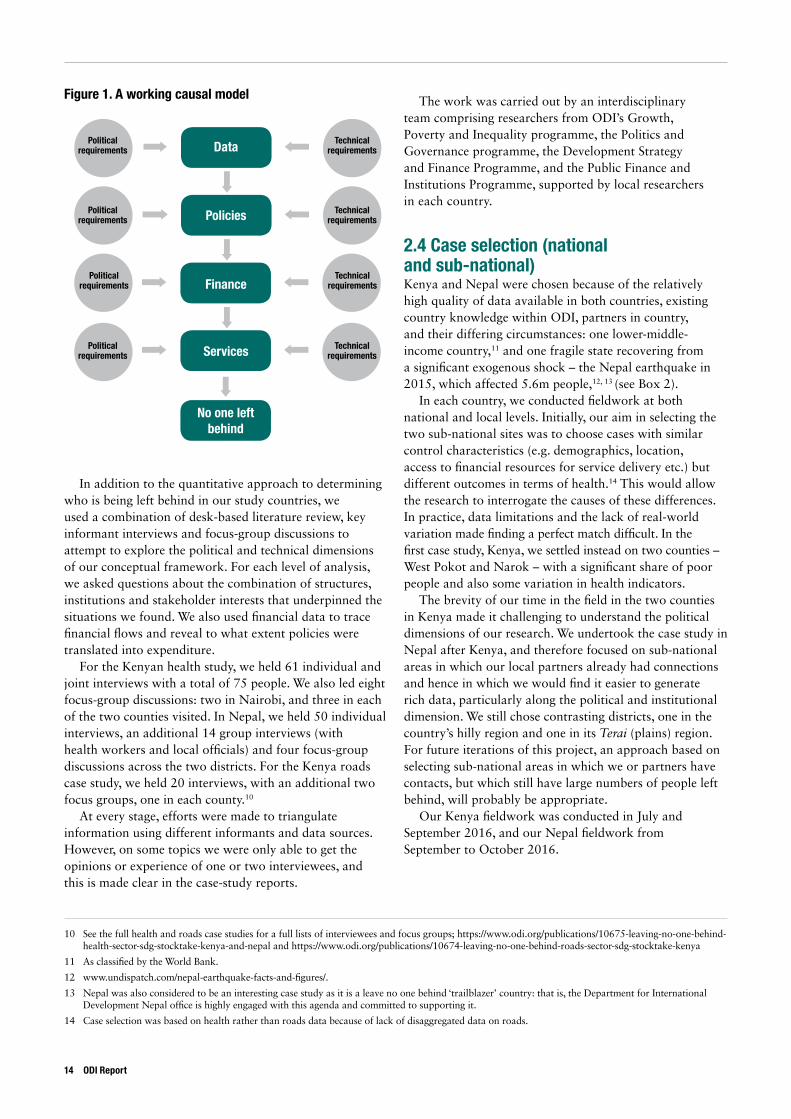
Figure 1. A working causal model
In addition to the quantitative approach to determining who is being left behind in our study countries, we used a combination of desk-based literature review, key informant interviews and focus-group discussions to attempt to explore the political and technical dimensions of our conceptual framework. For each level of analysis, we asked questions about the combination of structures, institutions and stakeholder interests that underpinned the situations we found. We also used financial data to trace financial flows and reveal to what extent policies were translated into expenditure.
For the Kenyan health study, we held 61 individual and joint interviews with a total of 75 people. We also led eight focus-group discussions: two in Nairobi, and three in each of the two counties visited. In Nepal, we held 50 individual interviews, an additional 14 group interviews (with health workers and local officials) and four focus-group discussions across the two districts. For the Kenya roads case study, we held 20 interviews, with an additional two focus groups, one in each county.10
At every stage, efforts were made to triangulate information using different informants and data sources. However, on some topics we were only able to get the opinions or experience of one or two interviewees, and this is made clear in the case-study reports.
The work was carried out by an interdisciplinary team comprising researchers from ODI’s Growth, Poverty and Inequality programme, the Politics and Governance programme, the Development Strategy and Finance Programme, and the Public Finance and Institutions Programme, supported by local researchers in each country.
2.4 Case selection (national and sub-national) Kenya and Nepal were chosen because of the relatively high quality of data available in both countries, existing country knowledge within ODI, partners in country, and their differing circumstances: one lower-middle-income country,11 and one fragile state recovering from a significant exogenous shock – the Nepal earthquake in 2015, which affected 5.6m people,12, 13 (see Box 2).
In each country, we conducted fieldwork at both national and local levels. Initially, our aim in selecting the two sub-national sites was to choose cases with similar control characteristics (e.g. demographics, location, access to financial resources for service delivery etc.) but different outcomes in terms of health.14 This would allow the research to interrogate the causes of these differences. In practice, data limitations and the lack of real-world variation made finding a perfect match difficult. In the first case study, Kenya, we settled instead on two counties – West Pokot and Narok – with a significant share of poor people and also some variation in health indicators.
The brevity of our time in the field in the two counties in Kenya made it challenging to understand the political dimensions of our research. We undertook the case study in Nepal after Kenya, and therefore focused on sub-national areas in which our local partners already had connections and hence in which we would find it easier to generate rich data, particularly along the political and institutional dimension. We still chose contrasting districts, one in the country’s hilly region and one in its Terai (plains) region. For future iterations of this project, an approach based on selecting sub-national areas in which we or partners have contacts, but which still have large numbers of people left behind, will probably be appropriate.
Our Kenya fieldwork was conducted in July and September 2016, and our Nepal fieldwork from September to October 2016.
10 See the full health and roads case studies for a full lists of interviewees and focus groups; https://www.odi.org/publications/10675-leaving-no-one-behind-health-sector-sdg-stocktake-kenya-and-nepal and https://www.odi.org/publications/10674-leaving-no-one-behind-roads-sector-sdg-stocktake-kenya
11 As classified by the World Bank.
12 www.undispatch.com/nepal-earthquake-facts-and-figures/.
13 Nepal was also considered to be an interesting case study as it is a leave no one behind ‘trailblazer’ country: that is, the Department for International Development Nepal office is highly engaged with this agenda and committed to supporting it.
14 Case selection was based on health rather than roads data because of lack of disaggregated data on roads.
Data
Policies
Finance
Services
No one left behind
Political requirements
Technical requirements
Political requirements
Technical requirements
Political requirements
Technical requirements
Political requirements
Technical requirements
14 ODI Report
An integrated approach to leaving no one behind 15
Box 2. Case studies: Kenya and Nepal
Kenya is home to over 60 ethnic groups or ‘tribes’, of which the largest are the Kikuyu, Luhya, Kalenjin, Luo and Kamba. It has a Christian majority, with sizeable minorities of Muslims and followers of traditional religion. It comprises a mixture of well-watered highlands suitable for cash-crop agriculture and low-lying arid and semi-arid lands (ASAL) better suited to pastoralism.
Kenya has achieved fairly impressive aggregate growth over the past five years, averaging above 5% p.a.; its gross national income (GNI) per capita was US$1,125 in 2015. However, the distribution of wealth continues to be highly uneven by African standards. Despite recently graduating to lower-middle-income status, Kenya still has large numbers of very poor people, with an estimated 45% below the poverty line in 2009. Moreover, government policy to date has not been particularly effective in addressing these problems: in terms of progress towards meeting the MDGs, it was 13th from the bottom out of 77 low-income countries in 2013.
Nepal is a low-income and least-developed country – the second poorest in Asia, with GNI per capita of US$730 in 2015. Nepal made impressive progress on the MDGs, especially in poverty reduction and basic health and education. However, 15% of the population still live in extreme poverty and 25% fall below the national poverty line. Achieving the SDGs will demand an acceleration of economic growth from current levels of roughly 4%–5% annually, as well as addressing entrenched dynamics of marginalisation.
Nepal has a richly diverse society; the most recent census listed 125 different caste and ethnic groups, which are distributed relatively heterogeneously across the country. However, historically there has been pervasive discrimination and inequality based on ethnicity, caste, religion and gender. Nepal successfully transitioned out of post-conflict status following the end of a decade-long civil war in 2006, and last year promulgated a much-delayed new constitution, which will provide the basis for future democratic elections under a federal system. However, the terms of the political resettlement are still highly contested by some political parties and minority groups.
Data source: World Bank World Development Indicators (WB WDI), 2016 and United Nations Development Programme (UNDP), 2014.
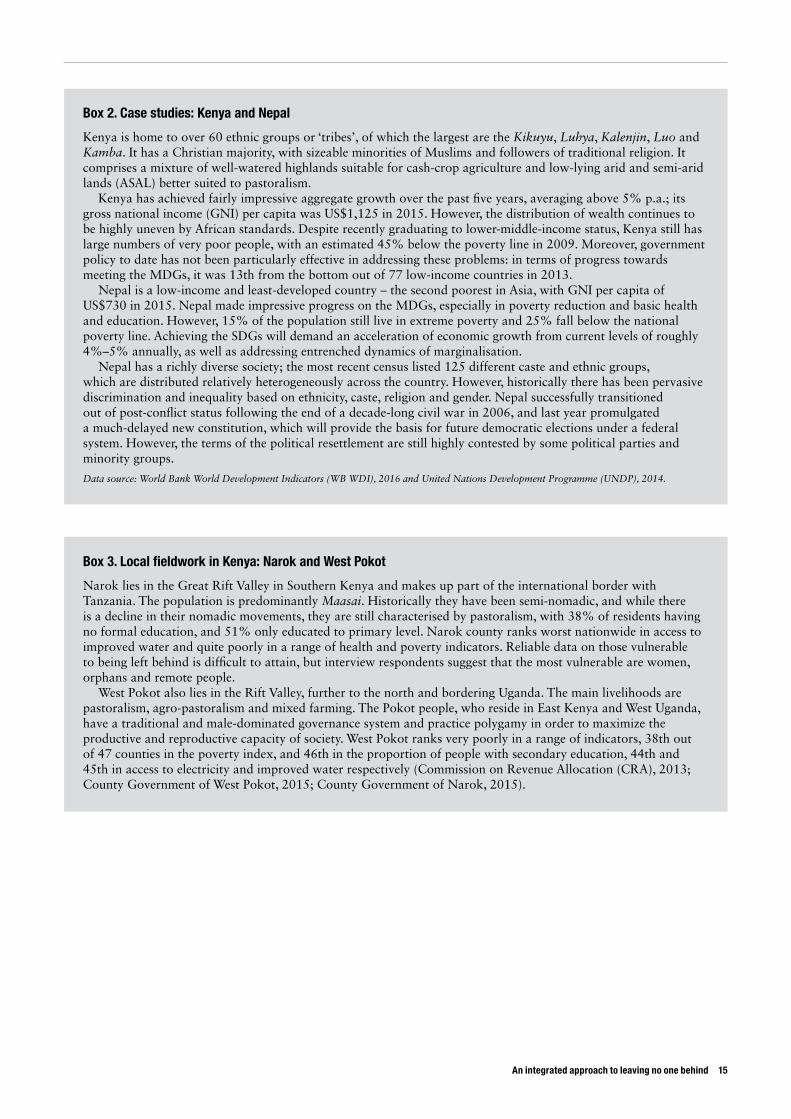
Box 3. Local fieldwork in Kenya: Narok and West Pokot
Narok lies in the Great Rift Valley in Southern Kenya and makes up part of the international border with Tanzania. The population is predominantly Maasai. Historically they have been semi-nomadic, and while there is a decline in their nomadic movements, they are still characterised by pastoralism, with 38% of residents having no formal education, and 51% only educated to primary level. Narok county ranks worst nationwide in access to improved water and quite poorly in a range of health and poverty indicators. Reliable data on those vulnerable to being left behind is difficult to attain, but interview respondents suggest that the most vulnerable are women, orphans and remote people.
West Pokot also lies in the Rift Valley, further to the north and bordering Uganda. The main livelihoods are pastoralism, agro-pastoralism and mixed farming. The Pokot people, who reside in East Kenya and West Uganda, have a traditional and male-dominated governance system and practice polygamy in order to maximize the productive and reproductive capacity of society. West Pokot ranks very poorly in a range of indicators, 38th out of 47 counties in the poverty index, and 46th in the proportion of people with secondary education, 44th and 45th in access to electricity and improved water respectively (Commission on Revenue Allocation (CRA), 2013; County Government of West Pokot, 2015; County Government of Narok, 2015).
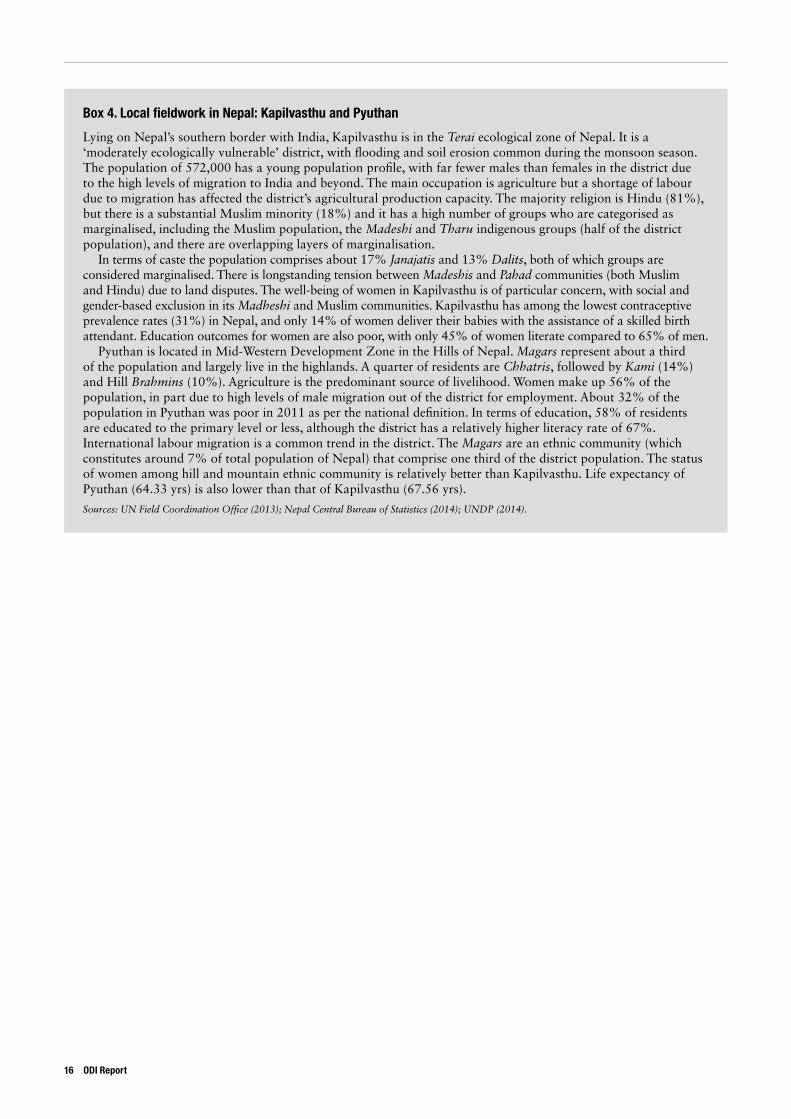
Box 4. Local fieldwork in Nepal: Kapilvasthu and Pyuthan
Lying on Nepal’s southern border with India, Kapilvasthu is in the Terai ecological zone of Nepal. It is a ‘moderately ecologically vulnerable’ district, with flooding and soil erosion common during the monsoon season. The population of 572,000 has a young population profile, with far fewer males than females in the district due to the high levels of migration to India and beyond. The main occupation is agriculture but a shortage of labour due to migration has affected the district’s agricultural production capacity. The majority religion is Hindu (81%), but there is a substantial Muslim minority (18%) and it has a high number of groups who are categorised as marginalised, including the Muslim population, the Madeshi and Tharu indigenous groups (half of the district population), and there are overlapping layers of marginalisation.
In terms of caste the population comprises about 17% Janajatis and 13% Dalits, both of which groups are considered marginalised. There is longstanding tension between Madeshis and Pahad communities (both Muslim and Hindu) due to land disputes. The well-being of women in Kapilvasthu is of particular concern, with social and gender-based exclusion in its Madheshi and Muslim communities. Kapilvasthu has among the lowest contraceptive prevalence rates (31%) in Nepal, and only 14% of women deliver their babies with the assistance of a skilled birth attendant. Education outcomes for women are also poor, with only 45% of women literate compared to 65% of men.
Pyuthan is located in Mid-Western Development Zone in the Hills of Nepal. Magars represent about a third of the population and largely live in the highlands. A quarter of residents are Chhatris, followed by Kami (14%) and Hill Brahmins (10%). Agriculture is the predominant source of livelihood. Women make up 56% of the population, in part due to high levels of male migration out of the district for employment. About 32% of the population in Pyuthan was poor in 2011 as per the national definition. In terms of education, 58% of residents are educated to the primary level or less, although the district has a relatively higher literacy rate of 67%. International labour migration is a common trend in the district. The Magars are an ethnic community (which constitutes around 7% of total population of Nepal) that comprise one third of the district population. The status of women among hill and mountain ethnic community is relatively better than Kapilvasthu. Life expectancy of Pyuthan (64.33 yrs) is also lower than that of Kapilvasthu (67.56 yrs).
Sources: UN Field Coordination Office (2013); Nepal Central Bureau of Statistics (2014); UNDP (2014).
16 ODI Report

An integrated approach to leaving no one behind 17
15 The notion of RMNCH continuum of service delivery for mothers and children is explained at: www.who.int/pmnch/about/continuum_of_care/en/. The details of the index composition and computation are at: http://apps.who.int/gho/indicatorregistry/App_Main/view_indicator.aspx?iid=4489.
16 www.who.int/gho/health_equity/en/.
3. What do the case studies suggest about who is being left behind?
We measured health-services coverage through the Composite Coverage Index (CCI) of reproductive, maternal, newborn and child-health (RMNCH) service delivery devised by the WHO. The index is an average of eight health interventions spanning family planning, maternal and newborn care, immunisation, and management of sick children.15 We believe that the ability of a health system to deliver high CCI scores across social groups will be highly correlated with its ability to achieve universal health coverage, understood in the SDGs as access to quality essential health care services and access to safe, effective, quality and affordable essential medicines and vaccines for all. Thus we believe it is a reasonable proxy for a country’s performance when it comes to leaving no one behind in health.
We deliberately use a health-access indicator, rather than looking at outcomes, because access to healthcare is more directly influenced by government policy and financing. Considering health access also enables us to focus more directly on the varying levels of health access experienced by different groups (rural/urban, income-based etc.) which is less visible from available health outcomes data.
Despite its strengths, the CCI only measures one target within the health SDG and makes an assumption that improving access to healthcare is the best (or one of the best) ways of improving health outcomes for those left behind. Any discussion linking this to public-policy decisions would also need to consider the importance of other targets within the health SDG and the role of other policies – such as education or roads – in contributing to better health outcomes for those left behind (see Kharas et al., 2014), but that wider analysis was outside the scope of this exercise.
The data presented below provide only a snapshot of the most recent levels of access to healthcare as measured by the CCI, due to a lack of time-series data. As noted below, lack of these time-series data became an important constraint in the analysis, and future stocktake work may need to screen for time-series data.
Using the metric of CCI, we compared the overall levels of access to health services in the two countries to international levels reported by WHO comparative data.16 For within-country assessment of those who might be left behind, we compared the degree of access between groups that we expected to be prone to marginalisation versus the rest of the population across counties (in Kenya) or clusters of districts (in Nepal).
3.1 Access to healthcare in Kenya: who is left behind? Kenya in 2014 had an overall CCI index of 76%. This places Kenya among the top half of 70 low- and middle-income countries analysed by the WHO; the median CCI for such countries was 70.2%. We found four important drivers of disparity in access from among the main dimensions of exclusions that we investigated.
a. Income: nationally, the poor households (the bottom 40% of the household-income distribution) on average lag behind the wealthier ones by more than 10 percentage points, and this gap in health-service access expands in counties that have poor levels of overall access – making the problem of health access acute for the marginalised there.
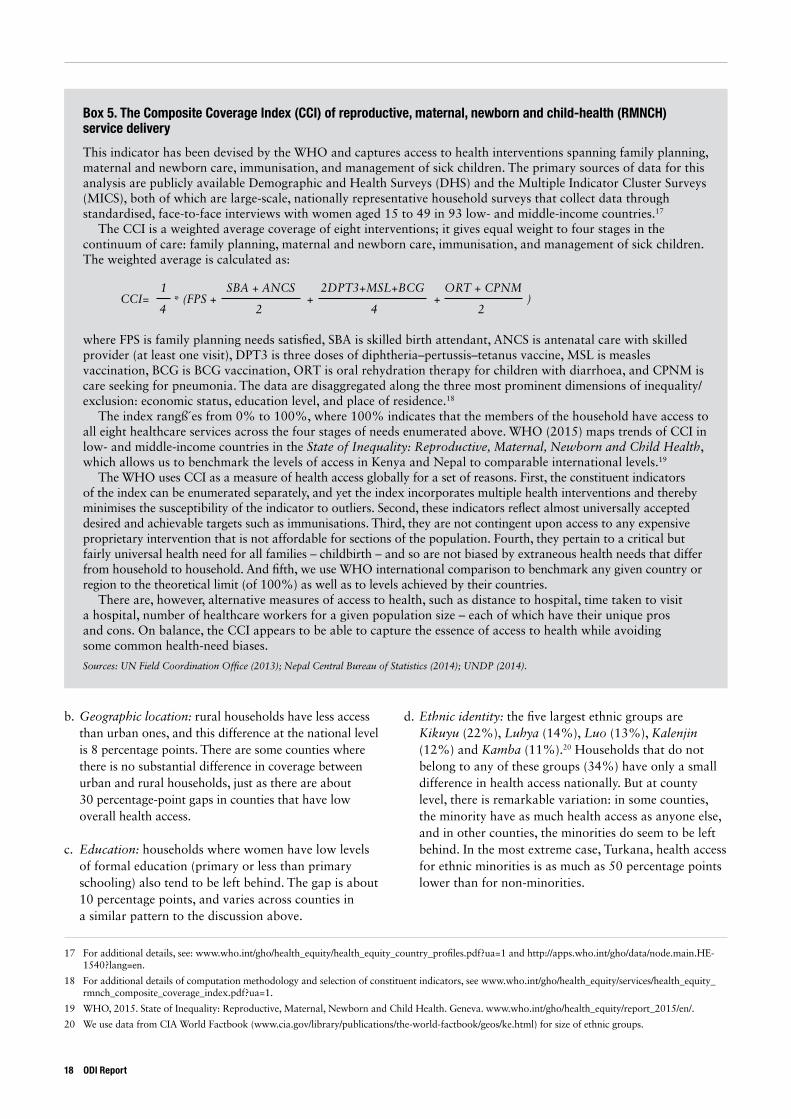
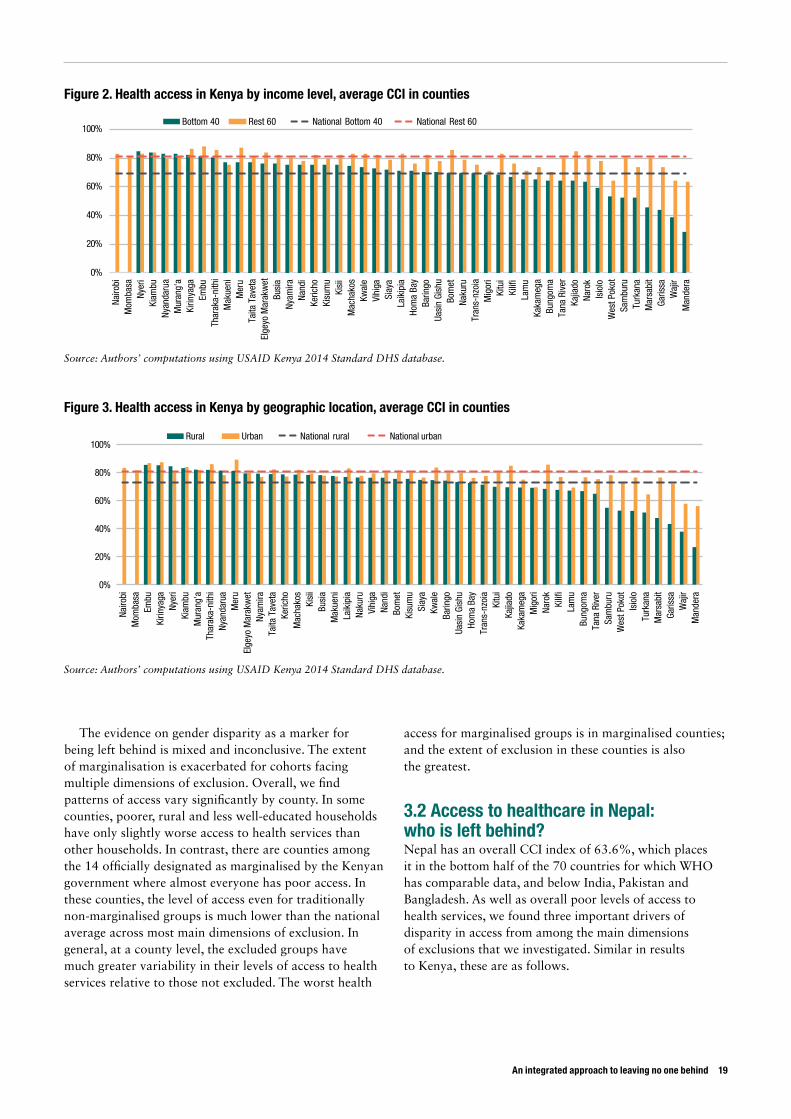
b. Geographic location: rural households have less access than urban ones, and this difference at the national level is 8 percentage points. There are some counties where there is no substantial difference in coverage between urban and rural households, just as there are about 30 percentage-point gaps in counties that have low overall health access.
c. Education: households where women have low levels of formal education (primary or less than primary schooling) also tend to be left behind. The gap is about 10 percentage points, and varies across counties in a similar pattern to the discussion above.
d. Ethnic identity: the five largest ethnic groups are Kikuyu (22%), Luhya (14%), Luo (13%), Kalenjin (12%) and Kamba (11%).20 Households that do not belong to any of these groups (34%) have only a small difference in health access nationally. But at county level, there is remarkable variation: in some counties, the minority have as much health access as anyone else, and in other counties, the minorities do seem to be left behind. In the most extreme case, Turkana, health access for ethnic minorities is as much as 50 percentage points lower than for non-minorities.
Box 5. The Composite Coverage Index (CCI) of reproductive, maternal, newborn and child-health (RMNCH) service delivery
This indicator has been devised by the WHO and captures access to health interventions spanning family planning, maternal and newborn care, immunisation, and management of sick children. The primary sources of data for this analysis are publicly available Demographic and Health Surveys (DHS) and the Multiple Indicator Cluster Surveys (MICS), both of which are large-scale, nationally representative household surveys that collect data through standardised, face-to-face interviews with women aged 15 to 49 in 93 low- and middle-income countries.17
The CCI is a weighted average coverage of eight interventions; it gives equal weight to four stages in the continuum of care: family planning, maternal and newborn care, immunisation, and management of sick children. The weighted average is calculated as:
where FPS is family planning needs satisfied, SBA is skilled birth attendant, ANCS is antenatal care with skilled provider (at least one visit), DPT3 is three doses of diphtheria–pertussis–tetanus vaccine, MSL is measles vaccination, BCG is BCG vaccination, ORT is oral rehydration therapy for children with diarrhoea, and CPNM is care seeking for pneumonia. The data are disaggregated along the three most prominent dimensions of inequality/exclusion: economic status, education level, and place of residence.18
The index rangß´es from 0% to 100%, where 100% indicates that the members of the household have access to all eight healthcare services across the four stages of needs enumerated above. WHO (2015) maps trends of CCI in low- and middle-income countries in the State of Inequality: Reproductive, Maternal, Newborn and Child Health, which allows us to benchmark the levels of access in Kenya and Nepal to comparable international levels.19
The WHO uses CCI as a measure of health access globally for a set of reasons. First, the constituent indicators of the index can be enumerated separately, and yet the index incorporates multiple health interventions and thereby minimises the susceptibility of the indicator to outliers. Second, these indicators reflect almost universally accepted desired and achievable targets such as immunisations. Third, they are not contingent upon access to any expensive proprietary intervention that is not affordable for sections of the population. Fourth, they pertain to a critical but fairly universal health need for all families – childbirth – and so are not biased by extraneous health needs that differ from household to household. And fifth, we use WHO international comparison to benchmark any given country or region to the theoretical limit (of 100%) as well as to levels achieved by their countries.
There are, however, alternative measures of access to health, such as distance to hospital, time taken to visit a hospital, number of healthcare workers for a given population size – each of which have their unique pros and cons. On balance, the CCI appears to be able to capture the essence of access to health while avoiding some common health-need biases.
Sources: UN Field Coordination Office (2013); Nepal Central Bureau of Statistics (2014); UNDP (2014).
CCI= * (FPS + + + )1 SBA + ANCS 2DPT3+MSL+BCG
4 2 4
ORT + CPNM
2
17 For additional details, see: www.who.int/gho/health_equity/health_equity_country_profiles.pdf?ua=1 and http://apps.who.int/gho/data/node.main.HE-1540?lang=en.
18 For additional details of computation methodology and selection of constituent indicators, see www.who.int/gho/health_equity/services/health_equity_rmnch_composite_coverage_index.pdf?ua=1.
19 WHO, 2015. State of Inequality: Reproductive, Maternal, Newborn and Child Health. Geneva. www.who.int/gho/health_equity/report_2015/en/.
20 We use data from CIA World Factbook (www.cia.gov/library/publications/the-world-factbook/geos/ke.html) for size of ethnic groups.
18 ODI Report
An integrated approach to leaving no one behind 19
The evidence on gender disparity as a marker for being left behind is mixed and inconclusive. The extent of marginalisation is exacerbated for cohorts facing multiple dimensions of exclusion. Overall, we find patterns of access vary significantly by county. In some counties, poorer, rural and less well-educated households have only slightly worse access to health services than other households. In contrast, there are counties among the 14 officially designated as marginalised by the Kenyan government where almost everyone has poor access. In these counties, the level of access even for traditionally non-marginalised groups is much lower than the national average across most main dimensions of exclusion. In general, at a county level, the excluded groups have much greater variability in their levels of access to health services relative to those not excluded. The worst health
access for marginalised groups is in marginalised counties; and the extent of exclusion in these counties is also the greatest.
3.2 Access to healthcare in Nepal: who is left behind? Nepal has an overall CCI index of 63.6%, which places it in the bottom half of the 70 countries for which WHO has comparable data, and below India, Pakistan and Bangladesh. As well as overall poor levels of access to health services, we found three important drivers of disparity in access from among the main dimensions of exclusions that we investigated. Similar in results to Kenya, these are as follows.
0%
20%
40%
60%
80%
100%
Nairo
bi
Mom
basa
Ny
eri
Kiam
bu
Nyan
daru
a M
uran
g'a
Kirin
yaga
Em
bu
Thar
aka-
nith
i M
akue
ni
Mer
u Ta
ita T
avet
a El
geyo
Mar
akw
et
Busi
a Ny
amira
Na
ndi
Keric
ho
Kisu
mu
Kisi
i M
acha
kos
Kwal
e Vi
higa
Si
aya
Laik
ipia
Ho
ma
Bay
Barin
go
Uasi
n Gi
shu
Bom
et
Naku
ru
Tran
s-nz
oia
Mig
ori
Kitu
i Ki
lifi
Lam
u Ka
kam
ega
Bung
oma
Tana
Riv
er
Kajia
do
Naro
k Is
iolo
W
est P
okot
Sa
mbu
ru
Turk
ana
Mar
sabi
t Ga
rissa
W
ajir
Man
dera
Bottom 40 Rest 60 National Bottom 40 National Rest 60
Figure 2. Health access in Kenya by income level, average CCI in counties
Source: Authors’ computations using USAID Kenya 2014 Standard DHS database.
0%
20%
40%
60%
80%
100%
Nairo
bi
Mom
basa
Em
bu
Kirin
yaga
Ny
eri
Kiam
bu
Mur
ang'
a Th
arak
a-ni
thi
Nyan
daru
a M
eru
Elge
yo M
arak
wet
Ny
amira
Ta
ita T
avet
a Ke
richo
M
acha
kos
Kisi
i Bu
sia
Mak
ueni
La
ikip
ia
Naku
ru
Vihi
ga
Nand
i Bo
met
Ki
sum
u Si
aya
Kwal
e Ba
ringo
Ua
sin
Gish
u Ho
ma
Bay
Tran
s-nz
oia
Kitu
i Ka
jiado
Ka
kam
ega
Mig
ori
Naro
k Ki
lifi
Lam
u Bu
ngom
a Ta
na R
iver
Sa
mbu
ru
Wes
t Pok
ot
Isio
lo
Turk
ana
Mar
sabi
t Ga
rissa
W
ajir
Man
dera
Rural Urban National rural National urban
Figure 3. Health access in Kenya by geographic location, average CCI in counties
Source: Authors’ computations using USAID Kenya 2014 Standard DHS database.
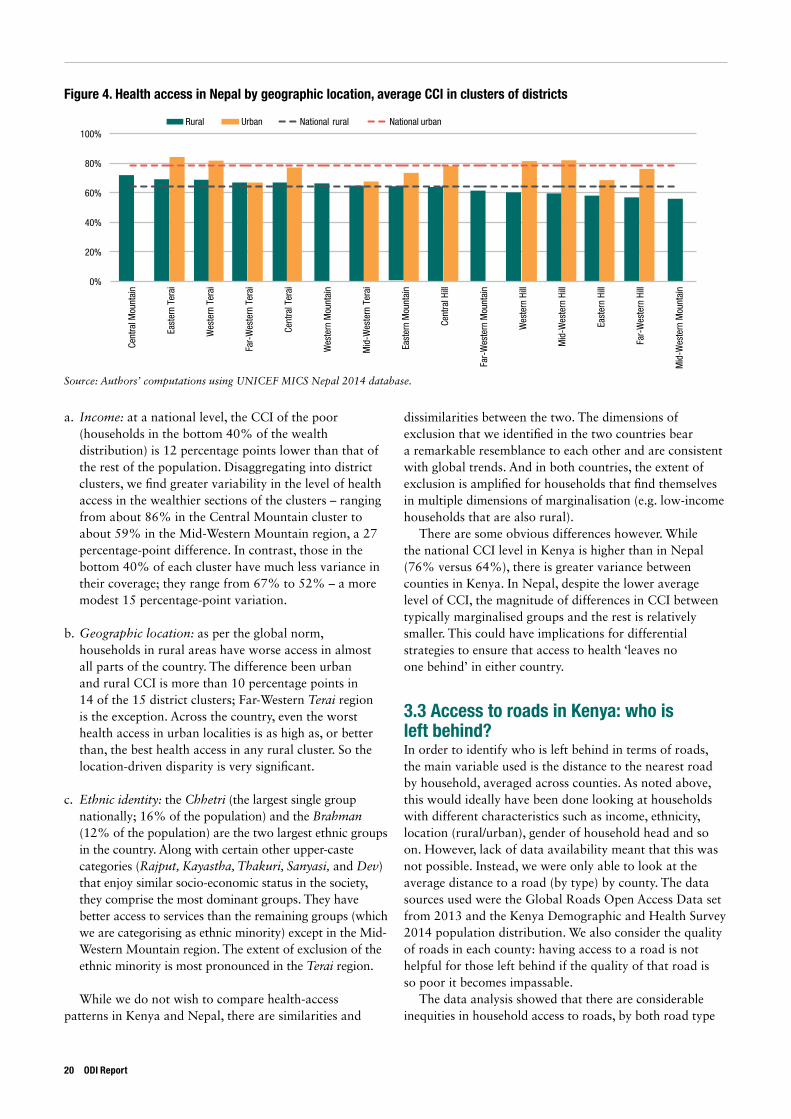
a. Income: at a national level, the CCI of the poor (households in the bottom 40% of the wealth distribution) is 12 percentage points lower than that of the rest of the population. Disaggregating into district clusters, we find greater variability in the level of health access in the wealthier sections of the clusters – ranging from about 86% in the Central Mountain cluster to about 59% in the Mid-Western Mountain region, a 27 percentage-point difference. In contrast, those in the bottom 40% of each cluster have much less variance in their coverage; they range from 67% to 52% – a more modest 15 percentage-point variation.
b. Geographic location: as per the global norm, households in rural areas have worse access in almost all parts of the country. The difference been urban and rural CCI is more than 10 percentage points in 14 of the 15 district clusters; Far-Western Terai region is the exception. Across the country, even the worst health access in urban localities is as high as, or better than, the best health access in any rural cluster. So the location-driven disparity is very significant.
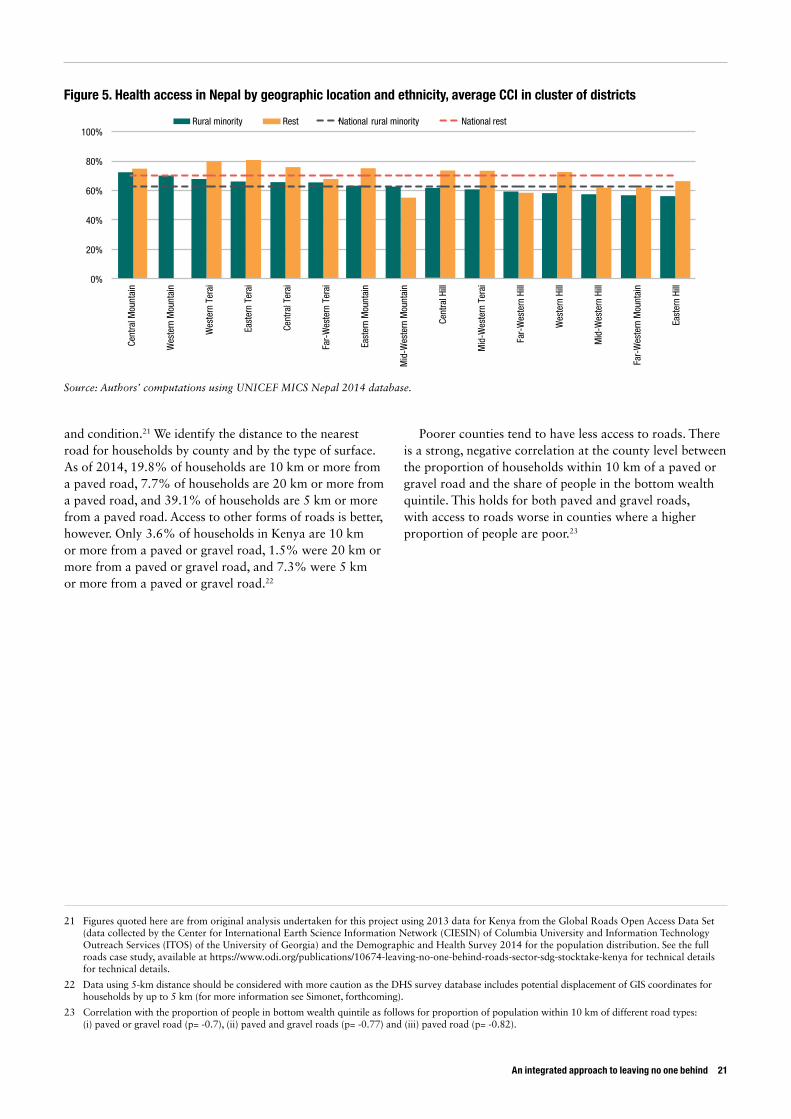
c. Ethnic identity: the Chhetri (the largest single group nationally; 16% of the population) and the Brahman (12% of the population) are the two largest ethnic groups in the country. Along with certain other upper-caste categories (Rajput, Kayastha, Thakuri, Sanyasi, and Dev) that enjoy similar socio-economic status in the society, they comprise the most dominant groups. They have better access to services than the remaining groups (which we are categorising as ethnic minority) except in the Mid-Western Mountain region. The extent of exclusion of the ethnic minority is most pronounced in the Terai region.
While we do not wish to compare health-access patterns in Kenya and Nepal, there are similarities and
dissimilarities between the two. The dimensions of exclusion that we identified in the two countries bear a remarkable resemblance to each other and are consistent with global trends. And in both countries, the extent of exclusion is amplified for households that find themselves in multiple dimensions of marginalisation (e.g. low-income households that are also rural).
There are some obvious differences however. While the national CCI level in Kenya is higher than in Nepal (76% versus 64%), there is greater variance between counties in Kenya. In Nepal, despite the lower average level of CCI, the magnitude of differences in CCI between typically marginalised groups and the rest is relatively smaller. This could have implications for differential strategies to ensure that access to health ‘leaves no one behind’ in either country.
3.3 Access to roads in Kenya: who is left behind? In order to identify who is left behind in terms of roads, the main variable used is the distance to the nearest road by household, averaged across counties. As noted above, this would ideally have been done looking at households with different characteristics such as income, ethnicity, location (rural/urban), gender of household head and so on. However, lack of data availability meant that this was not possible. Instead, we were only able to look at the average distance to a road (by type) by county. The data sources used were the Global Roads Open Access Data set from 2013 and the Kenya Demographic and Health Survey 2014 population distribution. We also consider the quality of roads in each county: having access to a road is not helpful for those left behind if the quality of that road is so poor it becomes impassable.
The data analysis showed that there are considerable inequities in household access to roads, by both road type
Rural Urban National rural National urban
0%
20%
40%
60%
80%
100% Ce
ntra
l Mou
ntai
n
East
ern
Tera
i
Wes
tern
Ter
ai
Far-
Wes
tern
Ter
ai
Cent
ral T
erai
Wes
tern
Mou
ntai
n
Mid
-Wes
tern
Ter
ai
East
ern
Mou
ntai
n
Cent
ral H
ill
Far-
Wes
tern
Mou
ntai
n
Wes
tern
Hill
Mid
-Wes
tern
Hill
East
ern
Hill
Far-
Wes
tern
Hill
Mid
-Wes
tern
Mou
ntai
n
Figure 4. Health access in Nepal by geographic location, average CCI in clusters of districts
Source: Authors’ computations using UNICEF MICS Nepal 2014 database.
20 ODI Report
An integrated approach to leaving no one behind 21
21 Figures quoted here are from original analysis undertaken for this project using 2013 data for Kenya from the Global Roads Open Access Data Set (data collected by the Center for International Earth Science Information Network (CIESIN) of Columbia University and Information Technology Outreach Services (ITOS) of the University of Georgia) and the Demographic and Health Survey 2014 for the population distribution. See the full roads case study, available at https://www.odi.org/publications/10674-leaving-no-one-behind-roads-sector-sdg-stocktake-kenya for technical details for technical details.
22 Data using 5-km distance should be considered with more caution as the DHS survey database includes potential displacement of GIS coordinates for households by up to 5 km (for more information see Simonet, forthcoming).
23 Correlation with the proportion of people in bottom wealth quintile as follows for proportion of population within 10 km of different road types: (i) paved or gravel road (p= -0.7), (ii) paved and gravel roads (p= -0.77) and (iii) paved road (p= -0.82).
and condition.21 We identify the distance to the nearest road for households by county and by the type of surface. As of 2014, 19.8% of households are 10 km or more from a paved road, 7.7% of households are 20 km or more from a paved road, and 39.1% of households are 5 km or more from a paved road. Access to other forms of roads is better, however. Only 3.6% of households in Kenya are 10 km or more from a paved or gravel road, 1.5% were 20 km or more from a paved or gravel road, and 7.3% were 5 km or more from a paved or gravel road.22
Poorer counties tend to have less access to roads. There is a strong, negative correlation at the county level between the proportion of households within 10 km of a paved or gravel road and the share of people in the bottom wealth quintile. This holds for both paved and gravel roads, with access to roads worse in counties where a higher proportion of people are poor.23
0%
20%
40%
60%
80%
100% Ce
ntra
l Mou
ntai
n
Wes
tern
Mou
ntai
n
Wes
tern
Ter
ai
East
ern
Tera
i
Cent
ral T
erai
Far-
Wes
tern
Ter
ai
East
ern
Mou
ntai
n
Mid
-Wes
tern
Mou
ntai
n
Cent
ral H
ill
Mid
-Wes
tern
Ter
ai
Far-
Wes
tern
Hill
Wes
tern
Hill
Mid
-Wes
tern
Hill
Far-
Wes
tern
Mou
ntai
n
East
ern
Hill
Rural minority Rest National rural minority National rest
Figure 5. Health access in Nepal by geographic location and ethnicity, average CCI in cluster of districts
Source: Authors’ computations using UNICEF MICS Nepal 2014 database.
4. How well did our methodology on data, policy and financing work, and what does it tell us?
4.1 Data: Is data on who is being left behind available and is it being used?
Overall we found that assessing the ‘data ecosystem’ in each country was fairly straightforward, and this is something that should be continued in future stocktakes. It is inevitably more difficult to assess coverage of the existing data: as we note below, those missing from the data are more likely to be those left behind, but there is no straightforward way of determining this. As discussed further below, more extensive use of citizen-generated or other ‘informal’ data might have helped to overcome this problem.
4.1.1 Data availability To ensure inclusion, countries require the resources, technical capacity and political will to collect and analyse data about who is left behind, and to use this data to inform policy-making and provide services at both national and sub-national levels.
In both Kenya and Nepal, the main sources of data are the census; sector-specific surveys such as the Kenya Demographic and Health Survey (KDHS), Multiple Indicator Cluster Survey (MICS), and Roads Inventory and Condition Survey (RICS); and information collected by practitioners. In the health sector this is done through the Health Management Information System (HMIS).
Kenya and Nepal are making some progress towards collecting the necessary data and raising awareness of the importance of data. In Nepal, the Central Bureau of Statistics undertakes regular censuses and surveys. Administrative health data collected as part of Nepal’s Health Management Information System (HMIS) are comprehensive, and are now disaggregated according to six social groups. Overall, the HMIS is recognised to have played an important role in helping to drive progress on the MDGs. In Kenya, the HMIS system is leading the
continent, while the Kenya Health Data Collaboration aims to improve health data and decision-making data for health that is easy to access, analyse and use.
However, technical and capacity issues also undermine effective data collection in both countries. In Kenya, the census data have gaps, and are not collected regularly. Sample sizes are large, and data collection and processing takes considerable resources, which possibly disincentivises frequent data collection. Some populations are under-represented in the census, and these are more likely to be groups that are left behind, such as pastoralists, especially in the remote northern and north-eastern parts of the country, and slum households. This is caused by the insecurity and inaccessibility of these areas (itself partly a consequence of lack of investment in roads), mobility of pastoralist populations, and by fears from some of the groups that government-collected data could be used against them, particularly in areas of local and international conflict. The frequency and quality of surveys is also undermined by lack of capacity in the Kenya National Bureau of Statistics (WB, 2015).
Sector-specific surveys are irregular in Kenya, and, in the case of roads, do not measure the access of marginalised groups to roads. The last Road Inventory and Condition Survey (RICS) was conducted in 2007–2009 (Kenya Ministry of Roads and Public Works (MoRPW, 2010), and is likely to be seriously out of date given that government expenditure on the roads sector has increased almost three-fold over the past 10 years. Moreover, though this survey was designed to guide the Government of Kenya’s (GoK) road-investment programme, which is supposed to form the basis for annual funds allocation, the survey does not seek to identify the distinct challenges faced by certain groups such as people living with disabilities.
In Nepal, sector-specific survey data are collected more regularly than in Kenya but are not disaggregated to district level, only to national level and larger sub-national
22 ODI Report
An integrated approach to leaving no one behind 23
units, the 15 so-called ‘eco-development regions’. However, these units are clusters of districts with no administrative status, whereas Nepal’s 75 districts are its key administrative units. The lack of disaggregation of data to these levels means that districts have no detailed information on outcomes within their boundaries, either in general or according to specific marginalised groups.
Administrative data collected in both countries also suffer from gaps as a result of technical and infrastructural problems. In the Kenyan health sector, poor internet coverage and electricity have undermined efforts to develop an online system for data collection. Relying on health-facility data also says nothing about the health of populations who are not accessing facilities, a similar challenge in Nepal.
In the Kenya roads sector, interviews revealed there is poor data-sharing between national and county levels, and little support provided to help county data-gathering capacity. There is a lack of indicators or data collection that could aid in the targeting of roads to groups that are left behind. As an example, although there is a commitment to ensuring that all Kenyans are within 2 km of an all-season road (Kenya MoRPW, 2006), no institution appears to be in charge of monitoring progress towards this target, and the data that are available are not provided in ways that enable progress to be monitored. In the Nepal health sector, a lack of guidance and adequate protocols on data verification has resulted in patchy coverage and poor capacity at lower levels.
Some of these problems could potentially be mitigated by non-governmental data: a number of non-governmental organisations (NGOs) in Kenya have been involved in bottom-up or citizen-generated data. However, these have generally been pilot projects and not able to reach scale.
4.1.2 Data useThere are also challenges in translating data into policy-making in both countries. In Kenya, there are sometimes low levels of data demand and use by policy-makers as decisions on projects respond to other variables such as political pressure from stakeholders at the national and local level and/or the demands of a well-populated and significant constituency. In Nepal, despite the time taken by health workers and civil servants to collect and report data, there is limited focus on actual data use or feedback from central level to local level. Local actors work predominantly as data collectors and aggregators, reporting upwards, rather than analysing and using this data systematically in their own planning, according to interviewees and the secondary literature (Development Gateway, 2014).
More broadly, in both Kenya and Nepal, political priorities appear to be much more significant drivers of resource allocation, reducing the incentives to collect and utilise data on those who are left behind. In Nepal, central-government resource allocations are based more on
historical patterns of provision, on issues or programmes driven by current political priorities, the personal priorities of politicians or lobbying by specific interest groups, rather than data (Development Gateway, 2014). In Kenya, road-project selection and siting within counties are driven primarily by political priorities, which makes the collection of formal data on groups that are left behind in many ways a secondary consideration (Kramon and Postner, 2011; Booth et al., 2013).
4.2 Policy: Do the countries have constitutional and policy frameworks that support those left behind?
Overall we found it relatively straightforward to assess the extent to which countries have inclusive constitutional and policy frameworks, and the key drivers of both.
Both Kenya (GoK, 2010) and Nepal (Constitution of Nepal, 2015) have progressive constitutional frameworks which should support efforts to leave no one behind. Kenya’s constitution explicitly states that one of the objectives of devolution is ‘to protect and promote the interests and rights of minorities’, while Article 56 enjoins the state to enact ‘affirmative action programmes’ to ensure, among other things, that these groups ‘are provided special opportunities in educational and economic fields… access to employment… [a]nd have reasonable access to water, health services and infrastructure’. Article 21 also enjoins public officials to address the needs of vulnerable groups within society. Devolution in Kenya appears to have been positive for LNOB, at least according to early indications, as discussed further below.
The concept of leaving no one behind in Nepal should be seen in the context of recent efforts to ensure fuller economic, political and social inclusion, against a long historical backdrop of exclusion and division which resulted in a decade-long civil war (1996–2006). Nepal’s 2015 Constitution, which emerged out of nine years of political contestation following the 2006 peace accord, sets out a series of rights and state policies relating to inclusion, both generally and with respect to health. It declares that Nepal will protect ‘equitable society based on plurality and equality, and inclusive representation and identity’. It recognises a right to social justice, specifically for certain identified social groups. There are also a series of rights of specific vulnerable groups, including the right to health.
In the health sector in both countries, there are progressive and inclusive policy commitments. The Kenya Health Policy (2014–2030), informed by the overarching Vision 2030, includes a number of policy commitments relating to access, demand and quality of healthcare, including a commitment that everyone should live within 5 km of a health-service provider, where feasible, financial
barriers hindering access should be minimised or removed, and socio-cultural barriers hindering access to services identified and addressed. There is also a flagship project to expand health coverage to the most vulnerable groups, called the Health Insurance Subsidy Programme for the Poor. User fees have been removed for primary healthcare and maternal-health services.
In Nepal, equitable access is the first of four pillars under the new Nepal Health Sector Strategy (Nepal MoH, 2015). The past 30 years have seen a firm commitment from Nepal to primary healthcare as a key to ‘health for all’. Universal free healthcare was introduced to all health posts in 2008, and there is a specific focus on reducing maternal and infant mortality rates, improving family planning, and increasing the number of health institutions and health workers. There is a Collaborative Framework between the Ministry of Health and the ministry responsible for local development, which aims to improve access to and coverage of quality health services, focusing on poor and marginalised groups in particular.
In the Kenyan roads sector, there are also progressive policy commitments, such as upgading urban arterial roads to tarmac, once they have been assessed as economically viable by the MoRPW. The commitment applies especially where they serve low-income neighbourhoods. There is also a commitment to ‘work towards eventually providing all-season road access within 2 kms for Kenyans’ (MoRPW, 2006). However, the formal criteria for road-project selection emphasise economic rather than social considerations, and the two commitments above are ranked lowest out of six priorities. Although there have been some efforts to shift the criteria used to determine the viability of roads-maintenance projects to incorporate social indicators, the overall trend to prioritise economic considerations is likely to continue.
In both countries, the wider political environment has been an important driver of the progressive constitutional and health-policy commitments. In Nepal, successive governments have competed to expand access to rural health services in response to a belief that poor services contributed to the alienation from the state that lay behind support for the Maoist insurgency (Jones, 2012). In Kenya, the new constitution was designed, at least in part, to tackle the causes of the political violence of 2007, which was attributed, among other things, to a top-heavy, winner-takes-all political system.
Another driver in Nepal has been external development partners (EDPs), who have been instrumental in pushing for inclusivity and equity in health policies and programmes. EDPs have also provided technical assistance and coordinated support to those policy commitments
that support inclusion of marginalised groups. This emerged less strongly in Kenya, where Vision 2030 and the new constitution pre-date the SDGs. However, EDPs, as well as influencing government directly through technical and financial support, significantly shape NGO and civil-society agendas, both of which fed into the aforementioned documents.
4.3 Finance: To what extent are resources allocated and delivered to progressive and inclusive activities?
The assessment at the national level of how well finance is allocated across counties to those left behind was relatively straightforward. However, it was hindered by lack of time-series data on financing and access, as discussed below. Further, we found it very challenging to get a detailed breakdown of how sub-national administrations are allocating resources, which would have enabled a more granular analysis of the relationship between finance and service delivery at the local level.
4.3.1 Positive trends on financing allocation In Kenya, the constitution enshrines the principle that the public-finance system shall promote an equitable society. The constitution states that expenditure should ‘promote the equitable development of the country, including by making special provision for marginalised groups and areas’ (Government of Kenya, 2010). The ‘Equitable Share’, which is a large unconditional transfer through which at least 15% of revenues collected nationally are allocated from the central government to county governments, has a significant poverty weighting (of 20%).24 It is disproportionately weighted to poorer counties and is more likely to benefit the poor. Our analysis suggests that there is indeed a positive correlation between the per capita equitable share allocation to each county and the percentage of the population in each county living in the bottom wealth quintile.25 There are also other mechanisms for addressing regional disparities including the recently introduced ‘Equalisation Fund’, targeting the 14 most marginalised counties, which will receive 0.5% of all revenue collected by the national government.
In Kenya, there has been an increase in health spending overall. Health allocations in 2015/16 increased by around 70%, over the previous (very low) year, a rise that appears to be driven by counties allocating a larger share of their budgets to health than does central government (Kenya, Office of the Controller of the Budget, 2015). We also found some evidence that
24 The rest of the parameters and their corresponding weights are as follows: basic equal share (25%), population (45%), land area (8%) and fiscal responsibility (2%).
25 With a correlation coefficient of 0.6 statistically significant at the 1% level, based on data for the fiscal year 2014/15.
24 ODI Report
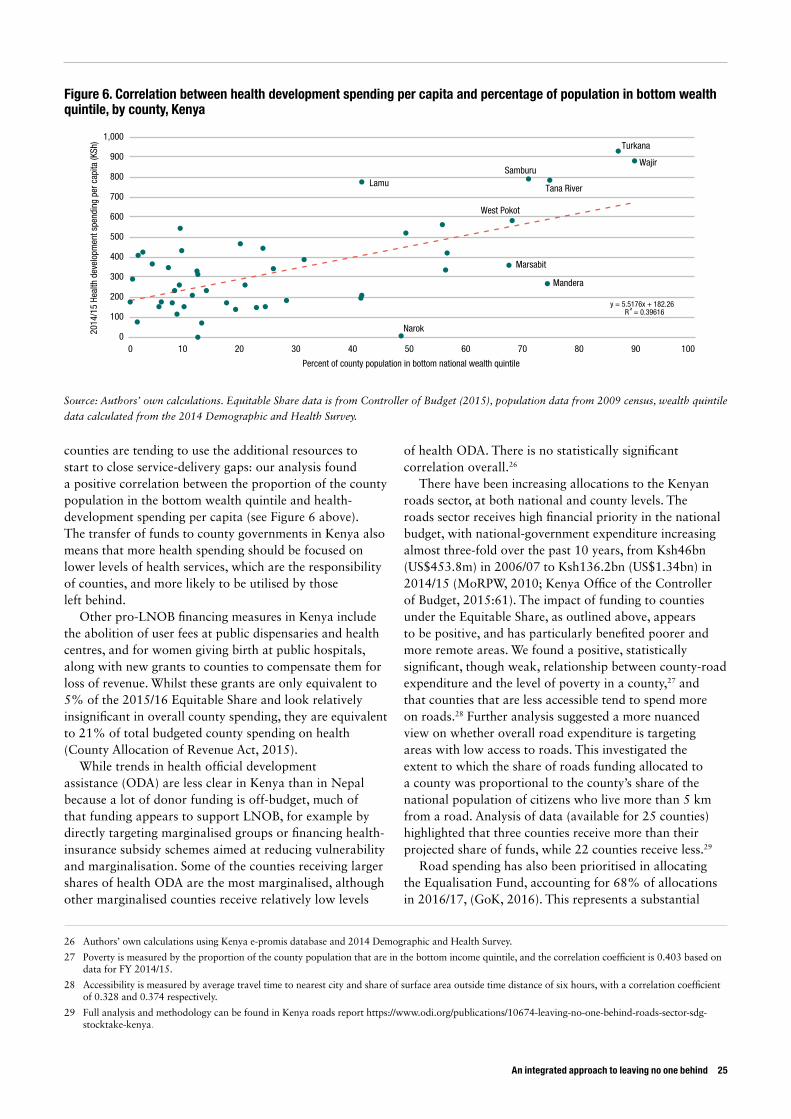
An integrated approach to leaving no one behind 25
26 Authors’ own calculations using Kenya e-promis database and 2014 Demographic and Health Survey.
27 Poverty is measured by the proportion of the county population that are in the bottom income quintile, and the correlation coefficient is 0.403 based on data for FY 2014/15.
28 Accessibility is measured by average travel time to nearest city and share of surface area outside time distance of six hours, with a correlation coefficient of 0.328 and 0.374 respectively.
29 Full analysis and methodology can be found in Kenya roads report https://www.odi.org/publications/10674-leaving-no-one-behind-roads-sector-sdg-stocktake-kenya.
counties are tending to use the additional resources to start to close service-delivery gaps: our analysis found a positive correlation between the proportion of the county population in the bottom wealth quintile and health-development spending per capita (see Figure 6 above). The transfer of funds to county governments in Kenya also means that more health spending should be focused on lower levels of health services, which are the responsibility of counties, and more likely to be utilised by those left behind.
Other pro-LNOB financing measures in Kenya include the abolition of user fees at public dispensaries and health centres, and for women giving birth at public hospitals, along with new grants to counties to compensate them for loss of revenue. Whilst these grants are only equivalent to 5% of the 2015/16 Equitable Share and look relatively insignificant in overall county spending, they are equivalent to 21% of total budgeted county spending on health (County Allocation of Revenue Act, 2015).
While trends in health official development assistance (ODA) are less clear in Kenya than in Nepal because a lot of donor funding is off-budget, much of that funding appears to support LNOB, for example by directly targeting marginalised groups or financing health-insurance subsidy schemes aimed at reducing vulnerability and marginalisation. Some of the counties receiving larger shares of health ODA are the most marginalised, although other marginalised counties receive relatively low levels
of health ODA. There is no statistically significant correlation overall.26
There have been increasing allocations to the Kenyan roads sector, at both national and county levels. The roads sector receives high financial priority in the national budget, with national-government expenditure increasing almost three-fold over the past 10 years, from Ksh46bn (US$453.8m) in 2006/07 to Ksh136.2bn (US$1.34bn) in 2014/15 (MoRPW, 2010; Kenya Office of the Controller of Budget, 2015:61). The impact of funding to counties under the Equitable Share, as outlined above, appears to be positive, and has particularly benefited poorer and more remote areas. We found a positive, statistically significant, though weak, relationship between county-road expenditure and the level of poverty in a county,27 and that counties that are less accessible tend to spend more on roads.28 Further analysis suggested a more nuanced view on whether overall road expenditure is targeting areas with low access to roads. This investigated the extent to which the share of roads funding allocated to a county was proportional to the county’s share of the national population of citizens who live more than 5 km from a road. Analysis of data (available for 25 counties) highlighted that three counties receive more than their projected share of funds, while 22 counties receive less.29
Road spending has also been prioritised in allocating the Equalisation Fund, accounting for 68% of allocations in 2016/17, (GoK, 2016). This represents a substantial
Narok
West Pokot
Mandera
Wajir
Turkana
Samburu
Tana River
Marsabit
Lamu
y = 5.5176x + 182.26 R = 0.39616
0
100
200
300
400
500
600
700
800
900
1,000
0 10 20 30 40 50 60 70 80 90 100
2014
/15
Heal
th d
evel
opm
ent s
pend
ing
per c
apita
(KSh
)
Percent of county population in bottom national wealth quintile
Figure 6. Correlation between health development spending per capita and percentage of population in bottom wealth quintile, by county, Kenya
Source: Authors’ own calculations. Equitable Share data is from Controller of Budget (2015), population data from 2009 census, wealth quintile
data calculated from the 2014 Demographic and Health Survey.
increase in road financing for these counties, equivalent to half of the previous year’s non-Equalisation Fund allocations for road projects in the most marginalised counties. It should be noted, however, that the Equalisation Fund has not yet been disbursed, due to a combination of technical issues and political disputes over national versus local control.
There will be an additional conditional grant from the Road Maintenance Fuel Levy Fund, being introduced from 2015/16, which will use the same formula as the ‘Equitable Share’ and hence channel further resources to the poorest counties.
In Nepal, the health budget is heavily focused on primary and preventative healthcare, the types of services that most benefit poor and vulnerable groups. Over the period of the second Nepal Health Sector Programme (Nepal MoH, 2010), essential healthcare services accounted for more than 70% of the budget, and rose in absolute terms every year except for 2012/13 (which was not a normal budget year).30 The recurrent budget is executed effectively, providing a strong supporting architecture for the stable provision of primary healthcare services at local level. Nepal has also received an increasing volume of ODA to the health sector which is focused heavily on the areas that tend to support those left behind: 50% of health ODA went into basic healthcare in 2014.
4.3.2 Challenges in resource allocation to leave no one behindDespite these positive trends, all the case studies reveal challenges in the volume and allocation of funding to the sub-national regions and sub-sectors which are important for leaving no one behind. There are also inefficiencies in the ways funds are spent.
In the Kenya health sector, while funding is allocated in a way that broadly aligns with ambitions to leave no one behind, it remains insufficient. Average health spending at county level is well below the estimate of US$86 per capita deemed necessary to deliver an essential set of health interventions for all, made by the Centre on Global Health Security Working Group on Health Financing. The county with the highest per capita health budget in 2014/15 was Lamu, at Ksh5,587 (around US$57 per capita), and most counties spend much less.
Kenya appears to have limited scope to raise additional tax revenues31 or to borrow more, and hence any additional progressive spending will need to come from reallocations within the budget or from further grant aid, which is unlikely given Kenya’s recent graduation to lower-middle-income status. Indeed, it is likely that ODA to Kenya will fall given rising income levels overall.
There are also inefficiencies in the way that funding is spent. There is some evidence that curative care continues to be prioritised despite policy statements to the contrary. In some cases there is a mismatch between recurrent (wages, drugs etc.) and development (infrastructure) spending although this appears to move in different directions in different counties. Fieldwork indicated that some new health centres lack staff and equipment and so were standing idle, whereas other informants suggested some counties were prioritising staff, to the detriment of drugs, infrastructure and equipment. This suggests a need for health expenditure to be better planned and coordinated. There has also been limited interest to date in health insurance by counties, even while counties are taking increasing responsibility for health provision.
In the Kenya roads sector, while allocations to counties are pro-poor, national-level allocations within the roads sector are not. Less than 1% of funding in Phase 1 of the Roads Sub-Sector Investment Plan (RSIP) was allocated to projects prioritised on the basis of economic and social criteria rather than purely economic or technical factors (Kenya, MoRPW, 2010). Standard cost-benefit analysis would tend to prioritise road investments in areas of fairly dense existing, or potentially generated, traffic. Almost by definition, servicing remote and/or sparsely populated communities will require relatively heavy weights to be added to the analysis to cover social criteria, or alternative models such as the Roads Economic Decision (RED) model – which allows for the incorporation of costs and benefits related to non-motorised vehicles or social-service delivery – or Multi-Criteria analysis (MCA) to be used. The RSIP explicitly states that road-development projects related to priorities for leaving no one behind would not be proposed for financing in Phase 1 due to budgetary constraints (Kenya, MoRPW, 2010).
Allocations to counties do not appear to be sufficient to overcome the challenges faced by the poorest counties in building and maintaining roads. The most remote and marginalised counties have particular constraints in terms of geography and climate, and so expanding and maintaining the road network in these areas will require more work and funding than in other areas. Standard cost-benefit analysis would tend to deprioritise projects targeted at these areas, given the additional costs. The funding for road maintenance is also particularly inadequate, meaning that roads are often poorly maintained once built, which does not help those left behind.
Donor support is aligned with government priorities, meaning that the vast majority of the funding is prioritised based on economic viability (according to standard
30 In 2012/13, a lack of political consensus meant that the entire year elapsed without a full budget being passed; instead an ‘expenditure budget’ was passed i.e. based on the expenditure of 2011/12, and hence much lower than usually, particularly for capital spending.
31 Kenya’s revenues are at around 20%, similar to other middle-income sub-Saharan African countries (International Monetary Fund, 2016).
26 ODI Report
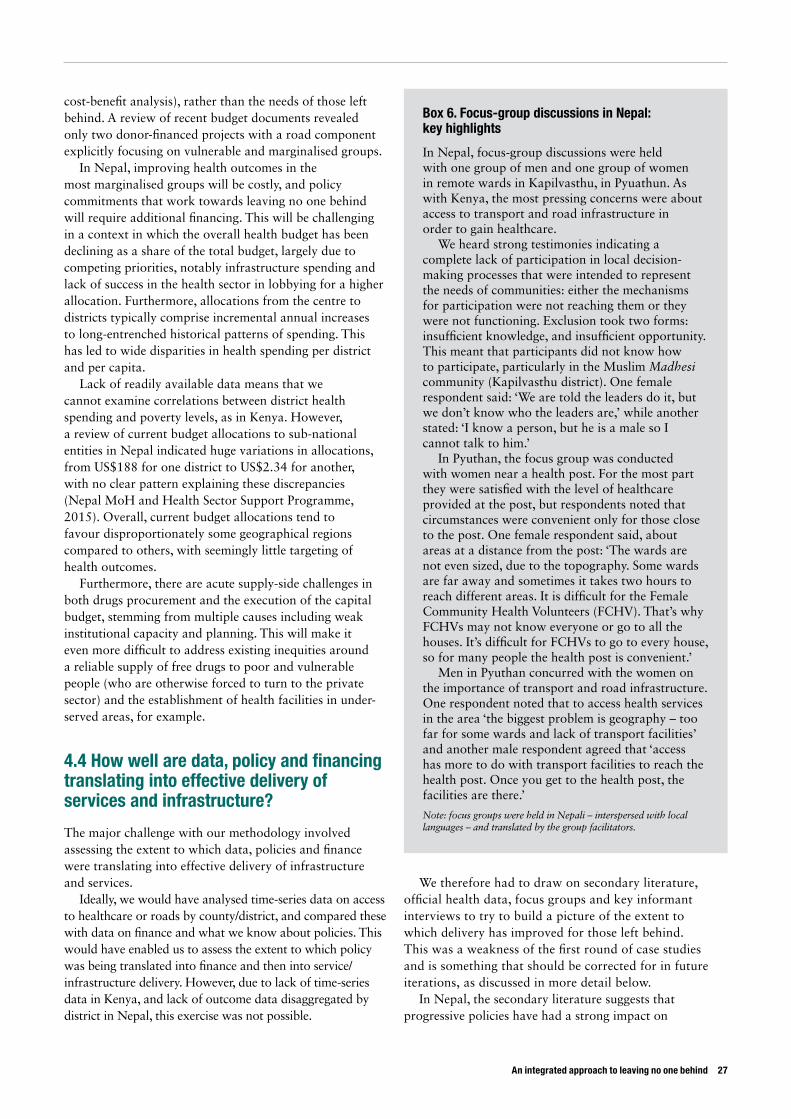
An integrated approach to leaving no one behind 27
cost-benefit analysis), rather than the needs of those left behind. A review of recent budget documents revealed only two donor-financed projects with a road component explicitly focusing on vulnerable and marginalised groups.
In Nepal, improving health outcomes in the most marginalised groups will be costly, and policy commitments that work towards leaving no one behind will require additional financing. This will be challenging in a context in which the overall health budget has been declining as a share of the total budget, largely due to competing priorities, notably infrastructure spending and lack of success in the health sector in lobbying for a higher allocation. Furthermore, allocations from the centre to districts typically comprise incremental annual increases to long-entrenched historical patterns of spending. This has led to wide disparities in health spending per district and per capita.
Lack of readily available data means that we cannot examine correlations between district health spending and poverty levels, as in Kenya. However, a review of current budget allocations to sub-national entities in Nepal indicated huge variations in allocations, from US$188 for one district to US$2.34 for another, with no clear pattern explaining these discrepancies (Nepal MoH and Health Sector Support Programme, 2015). Overall, current budget allocations tend to favour disproportionately some geographical regions compared to others, with seemingly little targeting of health outcomes.
Furthermore, there are acute supply-side challenges in both drugs procurement and the execution of the capital budget, stemming from multiple causes including weak institutional capacity and planning. This will make it even more difficult to address existing inequities around a reliable supply of free drugs to poor and vulnerable people (who are otherwise forced to turn to the private sector) and the establishment of health facilities in under-served areas, for example.
4.4 How well are data, policy and financing translating into effective delivery of services and infrastructure?
The major challenge with our methodology involved assessing the extent to which data, policies and finance were translating into effective delivery of infrastructure and services.
Ideally, we would have analysed time-series data on access to healthcare or roads by county/district, and compared these with data on finance and what we know about policies. This would have enabled us to assess the extent to which policy was being translated into finance and then into service/infrastructure delivery. However, due to lack of time-series data in Kenya, and lack of outcome data disaggregated by district in Nepal, this exercise was not possible.
We therefore had to draw on secondary literature, official health data, focus groups and key informant interviews to try to build a picture of the extent to which delivery has improved for those left behind. This was a weakness of the first round of case studies and is something that should be corrected for in future iterations, as discussed in more detail below.
In Nepal, the secondary literature suggests that progressive policies have had a strong impact on
Box 6. Focus-group discussions in Nepal: key highlights
In Nepal, focus-group discussions were held with one group of men and one group of women in remote wards in Kapilvasthu, in Pyuathun. As with Kenya, the most pressing concerns were about access to transport and road infrastructure in order to gain healthcare.
We heard strong testimonies indicating a complete lack of participation in local decision-making processes that were intended to represent the needs of communities: either the mechanisms for participation were not reaching them or they were not functioning. Exclusion took two forms: insufficient knowledge, and insufficient opportunity. This meant that participants did not know how to participate, particularly in the Muslim Madhesi community (Kapilvasthu district). One female respondent said: ‘We are told the leaders do it, but we don’t know who the leaders are,’ while another stated: ‘I know a person, but he is a male so I cannot talk to him.’
In Pyuthan, the focus group was conducted with women near a health post. For the most part they were satisfied with the level of healthcare provided at the post, but respondents noted that circumstances were convenient only for those close to the post. One female respondent said, about areas at a distance from the post: ‘The wards are not even sized, due to the topography. Some wards are far away and sometimes it takes two hours to reach different areas. It is difficult for the Female Community Health Volunteers (FCHV). That’s why FCHVs may not know everyone or go to all the houses. It’s difficult for FCHVs to go to every house, so for many people the health post is convenient.’
Men in Pyuthan concurred with the women on the importance of transport and road infrastructure. One respondent noted that to access health services in the area ‘the biggest problem is geography – too far for some wards and lack of transport facilities’ and another male respondent agreed that ‘access has more to do with transport facilities to reach the health post. Once you get to the health post, the facilities are there.’
Note: focus groups were held in Nepali – interspersed with local languages – and translated by the group facilitators.
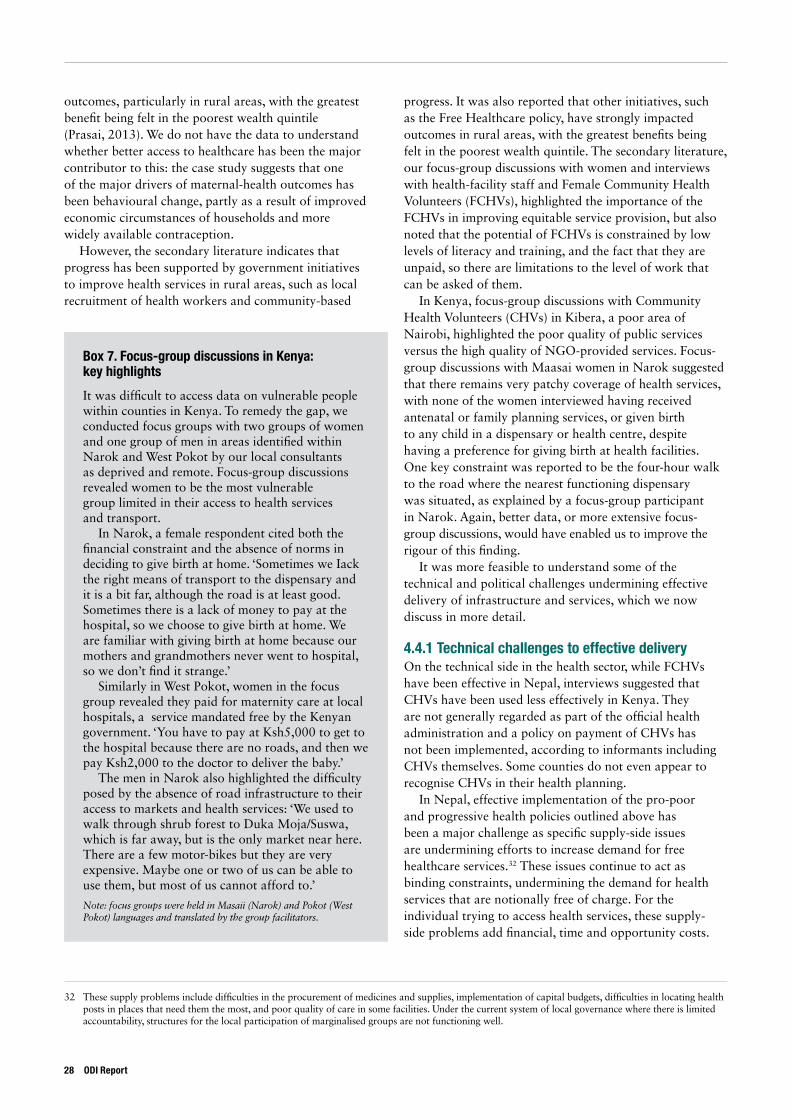
outcomes, particularly in rural areas, with the greatest benefit being felt in the poorest wealth quintile (Prasai, 2013). We do not have the data to understand whether better access to healthcare has been the major contributor to this: the case study suggests that one of the major drivers of maternal-health outcomes has been behavioural change, partly as a result of improved economic circumstances of households and more widely available contraception.
However, the secondary literature indicates that progress has been supported by government initiatives to improve health services in rural areas, such as local recruitment of health workers and community-based
progress. It was also reported that other initiatives, such as the Free Healthcare policy, have strongly impacted outcomes in rural areas, with the greatest benefits being felt in the poorest wealth quintile. The secondary literature, our focus-group discussions with women and interviews with health-facility staff and Female Community Health Volunteers (FCHVs), highlighted the importance of the FCHVs in improving equitable service provision, but also noted that the potential of FCHVs is constrained by low levels of literacy and training, and the fact that they are unpaid, so there are limitations to the level of work that can be asked of them.
In Kenya, focus-group discussions with Community Health Volunteers (CHVs) in Kibera, a poor area of Nairobi, highlighted the poor quality of public services versus the high quality of NGO-provided services. Focus-group discussions with Maasai women in Narok suggested that there remains very patchy coverage of health services, with none of the women interviewed having received antenatal or family planning services, or given birth to any child in a dispensary or health centre, despite having a preference for giving birth at health facilities. One key constraint was reported to be the four-hour walk to the road where the nearest functioning dispensary was situated, as explained by a focus-group participant in Narok. Again, better data, or more extensive focus-group discussions, would have enabled us to improve the rigour of this finding.
It was more feasible to understand some of the technical and political challenges undermining effective delivery of infrastructure and services, which we now discuss in more detail.
4.4.1 Technical challenges to effective delivery On the technical side in the health sector, while FCHVs have been effective in Nepal, interviews suggested that CHVs have been used less effectively in Kenya. They are not generally regarded as part of the official health administration and a policy on payment of CHVs has not been implemented, according to informants including CHVs themselves. Some counties do not even appear to recognise CHVs in their health planning.
In Nepal, effective implementation of the pro-poor and progressive health policies outlined above has been a major challenge as specific supply-side issues are undermining efforts to increase demand for free healthcare services.32 These issues continue to act as binding constraints, undermining the demand for health services that are notionally free of charge. For the individual trying to access health services, these supply-side problems add financial, time and opportunity costs.
32 These supply problems include difficulties in the procurement of medicines and supplies, implementation of capital budgets, difficulties in locating health posts in places that need them the most, and poor quality of care in some facilities. Under the current system of local governance where there is limited accountability, structures for the local participation of marginalised groups are not functioning well.
Box 7. Focus-group discussions in Kenya: key highlights
It was difficult to access data on vulnerable people within counties in Kenya. To remedy the gap, we conducted focus groups with two groups of women and one group of men in areas identified within Narok and West Pokot by our local consultants as deprived and remote. Focus-group discussions revealed women to be the most vulnerable group limited in their access to health services and transport.
In Narok, a female respondent cited both the financial constraint and the absence of norms in deciding to give birth at home. ‘Sometimes we Iack the right means of transport to the dispensary and it is a bit far, although the road is at least good. Sometimes there is a lack of money to pay at the hospital, so we choose to give birth at home. We are familiar with giving birth at home because our mothers and grandmothers never went to hospital, so we don’t find it strange.’
Similarly in West Pokot, women in the focus group revealed they paid for maternity care at local hospitals, a service mandated free by the Kenyan government. ‘You have to pay at Ksh5,000 to get to the hospital because there are no roads, and then we pay Ksh2,000 to the doctor to deliver the baby.’
The men in Narok also highlighted the difficulty posed by the absence of road infrastructure to their access to markets and health services: ‘We used to walk through shrub forest to Duka Moja/Suswa, which is far away, but is the only market near here. There are a few motor-bikes but they are very expensive. Maybe one or two of us can be able to use them, but most of us cannot afford to.’
Note: focus groups were held in Masaii (Narok) and Pokot (West Pokot) languages and translated by the group facilitators.
28 ODI Report
An integrated approach to leaving no one behind 29
As well as the specific challenges relating to procurement and implementation of capital budgets described above, the quality of healthcare is another major issue, with weak or non-existent institutionalisation of quality-of-care standards and processes. In addition, localised problems are undermining the provision of health services to vulnerable and marginalised groups.
Respondents attributed many of these local-level implementation problems to the broader challenge of Nepal’s highly centralised system (as it waits to move to a fully federalised system), which gives insufficient power and discretion to local-level actors, in the context of long delays in carrying out local elections. Local-level actors are then hampered from resolving context-specific issues, such as land use, required upgrades to facilities, and tackling challenges of vulnerability or marginalisation as they manifest in specific localities.
There have also been teething problems with devolution in Kenya, which have impacted on both the health and roads sectors. In the health sector, counties are now responsible for paying the salaries and superannuation of health workers, and overseeing career progression. However, in some counties, health workers are paid late, and in other counties they feel that opportunities for career progression and training have been disrupted as a result of devolution, according to interviewees. Health workers were on strike in three counties at the time of our research. According to some of our informants, issues around procurement, systems for vaccination and disease control have been weakened by devolution. In the roads sector, strong political involvement in actual project selection creates incentives for expanding the road network, particularly at the county level. However, this also contributes to policy incoherence and inefficiency, due to a combination of rent-seeking and poor alignment between political priorities and effective allocation of funding for road construction and maintenance. The extent to which this benefits ‘left behind’ groups will also depend on how politically influential and mobilised they are. Unclear mandates following decentralisation have also resulted in struggles between county and national governments over control of decisions over roads, as well as a lack of clarity on roles and responsibilities between different road agencies, as well as national and local governments. These result in a lack of coordination and co-operation, leading to inefficiencies and delays in project implementation.
4.4.2 Political bottlenecks impeding effective deliveryService and infrastructure delivery to those left behind has also been affected by political dynamics, which have played out in different ways in each country. In Kenya, devolution has created a new set of political dynamics in which a plethora of actors compete for resources at
both national and local levels (Cheeseman et al., 2016). Simplifying somewhat, at county level, county governors have an incentive to concentrate resources on heavily populated ‘swing’ areas, where those left behind tend not to live. This is mitigated to some extent by the tendency of members of county assemblies (MCAs) to lobby for a roughly equal share of resources for their wards, which has led to some previously neglected areas receiving roads and health infrastructure for the first time, according to interviewees.
However, to make rapid progress on the LNOB agenda, the most marginalised wards within counties need a disproportionate share of resources. This ‘affirmative action’ agenda, found, as outlined above, at the national level, is not evident at county level, so that while poorer counties need more resources, it is not clear that within counties more marginalised wards are receiving a greater share of funding. Furthermore, while spending may be spread more evenly across counties, as a result of devolution, it is unlikely that it will target those groups left behind within those counties, which tend to have little political power and influence.
Resources also need to be spent well to contribute to leaving no one behind, for example with an appropriate balance between construction and maintenance, which will not necessarily be achieved by a simple effort to spread spending across wards. Political incentives around the need to create more visible projects in constituencies tend to prioritise some areas of spending, for example visible road construction rather than less visible maintenance.
The politics of some counties has been highly conflicted, with a tug of war between the governor and MCAs, leading to paralysis: not a good outcome for those left behind. In the roads sector, there are also conflicts between county and national governments over control of decisions over roads, and a lack of clarity on roles and responsibilities, as between different road agencies, and national and local governments, leading to inefficiencies and delays in implementation.
In Kenya, the expansion of the roads network in areas with significant nomadic populations is also complicated by the ambiguous relationship these groups have with the national government. County officials in some areas consider them a lower priority for road access, and in some cases attempts to expand the road network have been hampered by community reluctance in the areas bordering Turkana and Uganda because of their distrust of the government. As noted above, these groups are also less willing to engage with government institutions or census data-collection. This means that road access for these groups is given a lower priority, and the implementation of projects faces a range of challenges in practice.
A different set of political dynamics is at play in Nepal, which is still awaiting transition to a new political system. The lack of local elections for almost two decades,
and the fact that local bodies have been in stasis waiting for the transition to an elected system, were regarded by interviewees as fundamental obstacles to leaving no one behind. Nearly all respondents argued that the lack of local democracy and accountability was a fundamental obstacle to driving forward real reforms that would truly reach those left behind. This is because centrally situated
or centrally appointed government officials cannot be responsive to the highly context-specific local dynamics of marginalisation; they are implementers of centrally designed nationwide programmes. Neither can they wield the local legitimacy, trust and accountability needed to tackle pervasive low-level corruption.
30 ODI Report
An integrated approach to leaving no one behind 31
5. Conclusions and reflections on the methodology
One of the objectives of the stocktake exercise was to develop a methodology that could be applied to the same countries again in future (to review progress), and to other sectors and countries. Having conducted two stocktakes, it is therefore appropriate to reflect on the methodology and what could be done differently in the next phase of the project.
One of the first methodological challenges was to identify the appropriate scope of the interventions to be examined. We opted to take a narrow focus on the health and roads sectors, and within those two sectors, fairly narrow indicators, i.e. access to a sub-set of health interventions and distance to an all-weather road. This was a decision we took in order to make the analysis manageable. However, it does not reflect the fact that other factors can be as important for those left behind as direct policy and financing in the particular sectors: for example, rising incomes or access to roads can be as important a driver of progress in health outcomes as access to health services (see Kharas et al., 2014).
Partly as a consequence of this focus, we also did not consider the indirect contributions of policies and financing leaving no one behind: for example, the fact that investing in national or international roads could help to support economic growth and hence raise incomes and tax revenues overall. Looking at these detailed interconnections was outside the scope of this study, but is something that could be considered in future iterations.
Another major challenge of the research was the lack of accurate, time-series data on who is left behind. In Nepal’s case, data were not broken down to the district level. As noted above, this made it very difficult to assess the impacts of policy and financing on service delivery over time. Better time-series data on CCI, disaggregated to the relevant administrative unit, would also have enabled us to refine county/district selection, such that we would have been able to compare a county/district that had made faster progress in service delivery, with one that had made slower progress. We sought to mitigate the lack of data with the focus-group discussions, but ideally the findings
from these groups would have been combined with quantitative analysis to get a fuller picture.
One option to improve this would be to pre-select case studies that already have accurate, disaggregated time-series data. This would have biased the sample to some extent, certainly when assessing data on those left behind. We could also have sought to collect the data ourselves, through surveys. This would have entailed considerably more time and resources than we had available. Finally, we could make better use of NGO, researcher and citizen-generated data. This latter option probably has the best merit going forward.
More investment in the early stages of the project in determining which data are available, of what quality, and how those data interact with and complement official data, would help to facilitate this in future stocktakes. We may want to focus case selection towards countries with more easily available unofficial data, although noting that this is also likely to lead to bias. Better sequencing of the data, finance and political analysis would also improve the richness of the analysis and our understanding of the links between them, with a longer period of data collection and analysis required upfront.
Local-level case selection was also a challenge. We originally sought to select two local areas in each country with similar background characteristics (in terms of geography, rural/urban, economy, financing and so on) but different levels of service delivery. This would have enabled a more granular analysis of how and why some areas had managed to improve service delivery, but others had not. We made an attempt with such an exercise in Kenya, but found three challenges. The first was that it was not possible to identify two counties with similar characteristics but very different levels of service delivery. The second is that, even had we done so, this would have led us to focus on one county that was not necessarily left behind (i.e. the county that had better-than-average levels of service delivery.)
The main challenge, however, was that understanding the detailed political dynamics at local level required to identify the linkages between data, policy, financing and
service delivery, requires good access to decision-makers and understanding of the local context. For the Nepal case study, we chose to focus on districts in which we had pre-existing contacts and so were able to generate a richer level of data in consequence. For future stocktake exercises, we would recommend either having the same approach, or investing considerably more time in local fieldwork, possibly including sub-contracting more to local consultants or NGOs.
The financing analysis was more straightforward, but this is very dependent on the degree to which information on spending is available at the sub-national level. In Kenya and Nepal it was relatively straightforward to obtain data about aggregate spending by counties/districts but not a detailed breakdown. In Kenya, data on roads spending at the local level were difficult to obtain, particularly in the county of Narok. Experience in other countries may also be variable. This could be tackled through country case-selection. One option that was considered, but not taken forward, was to conduct beneficiary incidence analysis. This would have helped to clarify how health spending is distributed by group at local level. Further stocktakes could consider allocating more time and resources to do this.
The other challenge with the financing methodology was understanding the political dynamics informing decision-making on budget allocation and execution: the more informal ‘rules of the game’, as opposed to the formal ones typically stated in official documentation and secondary literature. Again, selecting cases in which we had contacts and potentially pre-existing knowledge would have facilitated this. We couldn’t fully investigate issues such as corruption and resource leakages because this kind of information is unlikely to be shared in interviews. Better data on service delivery and financing would have
helped to facilitate this by identifying more clearly where financing was not translating into effective service delivery, and this would have enabled more probing questions.
Our initial research in Kenya suggested that it was too challenging to consider two sectors, which have very different institutions, policy and financing frameworks. Further stocktakes could either consider looking at one sector only, as we did in Nepal, or increase resource allocation per stocktake.
Overall, however, while methodological challenges remain, these early stocktakes have shown how adopting an integrated approach to assessing data, policy, financing and service delivery, with an explicitly political focus, can add value. Politics can explain why the collection of data is prioritised – or otherwise – and why data may not always drive decision-making. Politics can also explain why some groups – such as pastoralists in remote areas of Kenya – may actively seek to keep themselves out of official statistics. In some cases data drive policy and financing choices: for example in Kenya, where a positive relationship exists between allocations to counties and the number of people on low incomes living in those counties. In other cases, the relationship is much less clear. Finally, while we have not been able to ascertain clearly how policy and finance translate into infrastructure and service delivery, our detailed, granular analysis has identified some of the technical and political bottlenecks that undermine progress.
In conclusion, we hope that these initial stocktakes can be used as the basis for additional research, by ourselves and others, to help governments, international partners, researchers, civil-service organisations and others to understand better how we can ensure no one is left behind by 2030.
32 ODI Report
An integrated approach to leaving no one behind 33
References Booth, D., Cooksey, B., Golooba-Mutebi, F. and Kanyinga, K. (2013) East African Prospects: An Update on the Political
Economy of Kenya, Rwanda, Tanzania and Uganda. London: ODI.Bump, Jesse B. (2010) The Long Road to Universal Health Coverage: A Century of Lessons for Development Strategy.
Seattle: PATH.Cheeseman, N., Lynch, G. and Willis, J. (2016) ‘Decentralisation in Kenya: the Governance of Governors’. JMAS. Volume
54/Issue 01, pp 1–35. Commission on Revenue Allocation (2013) Policy on the Criteria for Identifying Marginalised Areas and Sharing of the
Equalisation Fund. Available at www.crakenya.org/wp-content/uploads/2013/10/CRA-Policy-on-marginalisation-driteria.pdf.
The Constitution of Nepal. 2015. Official translation from Ministry of Law, Justice and Parliamentary Affairs. www.constitutionnet.org/vl/item/constitution-nepal-2015-official-english-translation-ministry-law-justice-and-parliamentary County Allocation of Revenue Act (2015) Available at http://kenyalaw.org/kl/fileadmin/pdfdownloads/Acts/CountyAllocationofRevenueAct10of2015.pdf.
County Government of Narok (2015) County Integrated Development Plan. 2016–2017. County Government of West Pokot, (2015) County Integrated Development Plan. 2016–2017. Finance and Economic
Planning.Development Gateway (2014) Understanding Use of Government Data in Nepal.Government of Kenya (2010) ‘The Constitution of Kenya’. Nairobi: National Council for Law Reporting. Government of Kenya (2016) ‘2016/17 Estimates of Revenue to/and Expenditure from the Equalisation Fund of the
Government of Kenya for the year ending 30th June, 2017’.Government of Nepal Central Bureau of Statistics (2014) ‘National Population and Housing Census 2011: Social
Characteristics Table.’ Kathmandu: Government of Nepal. IMF (2016b) ‘Kenya: Second Review under the Stand-By Arrangement and The Arrangement under the Standby Credit
Facility, and Requests for a New Twenty-Four Month Stand-By Arrangement, and a New Twenty-Four Month Arrangement under the Standby Credit Facility’, IMF Country Report No. 16/85.
Jones, S. (2012) ‘The Politics of Social Rights: Social Protection and Free Health Care in Nepal’ in Public Management Review. Vol. 14. No. 2: 239–254.
Kabeer, N. (2010) ‘Can the MDGs Provide a Pathway to Social Justice? The Challenge of Intersecting Inequalities’. Child Poverty and Inequality, 57.
Kenya Ministry of Roads and Public Works (2006) ‘Sessional Paper of 2006 on the Development and Management of the Roads Sub-Sector for Sustainable Economic Growth’.
Kenya Ministry of Roads (2010) Road Sector Investment Programme & Strategy: 2010 - 2024. Available at www.krb.go.ke/our-downloads/RSIP.pdf.
Kenya Office of the Controller of Budget (2015) ‘Annual County Governments Budget Implementation Review Report’Kenya Ministry of Roads and Public Works (2010). Road and Bridge Inventory and Condition Survey Report.
Government of Kenya. Available at www.krb.go.ke/our-downloads/Road%20&%20Bridge%20Inventory%20&%20Condition%20Survey%20Report%20July%202010.pdf.
Kharas, H., Rogerson, A. and Prizzon, A. (2014) Financing the Post-2015 Sustainable Development Goals: a Rough Roadmap. London: ODI.
Kramon, E. and Posner, D.N. (2011) ‘Kenya’s New Constitution’. Journal of Democracy 22.2: 89–103.Laswell, H. D. (1936) Politics: Who gets What, When, How. New York: Whittlesey House. Nepal Central Bureau of Statistics (2014) National Population and Housing Census 2011:Social Characteristics Tables. Kathmandu: Government of Nepal. Available at http://cbs.gov.np/image/data/Population/
District%20Level%20Detail%20Report/Volume05Part02.pdf.Nepal Ministry of Health (2010) Nepal Health Sector Programme II (NHSP2) 2010–15. Kathmandu: Government
of Nepal.Nepal Ministry of Health (2015) Nepal Health Sector Strategy 2015–20. Kathmandu: Government of Nepal. Nepal Ministry of Health and Nepal Health Sector Support Programme (2015) Budget Analysis of Nepal Health Sector
Programme-2: FY 2010/11 to 2014/15. Kathmandu: Government of Nepal.Newhouse, D.; Suarez-Becerra, P., Evans, M. and Data for Goals Group (2016) New Estimates of Extreme Poverty for
Children. Washington DC: World BankPrasai, P. (2013) A Review of Studies on Nepal’s National Free Health Care Programme. Kathmandu: MoH. Simonet, C. (Forthcoming) Road access analysis. Background analysis. ODI.
Tangcharoensathien, V., Mills, A., and Palu, T. (2015) ‘Accelerating Health Equity: the Key Role of Universal Health Coverage in the Sustainable Development Goals’. BMC Medicine, 13(1), 1.
UN (2015) Transforming Our World: The 2030 Agenda for Sustainable Development. New York, NY: United Nations.UN ESCAP (2013) Economic and Social Survey of Asia and the Pacific 2013: Forward-looking Macroeconomic Policies
for Inclusive and Sustainable Development. Sales No E13.II.F.2.UN Field Coordination Office (2013) District Profile: Kapilvasthu. Kathmandu: Nepal. Available at http://un.org.np/sites/
default/files/kapilvasthu_district_profile.pdf.UNICEF MICS Nepal 2014 database. UNDP and Government of Nepal (2014) Nepal Human Development Report 2014. Kathmandu: UNDP and Government
of Nepal. United Nations Nepal Information Platform (2013) District Profile: Kapilvasthu. Available at http://un.org.np/sites/
default/files/kapilvastu_district_profile.pdf.USAID Kenya 2014 Standard DHS database. Vandemoortele, J. (2009) ‘The MDG Conundrum: Meeting the Targets Without Missing the Point’, Development Policy
Review, 27 (4) 355: 371.WHO (2015) State of Inequality: Reproductive, Maternal, Newborn and Child Health. Geneva: WHO. Available at
www.who.int/gho/health_equity/report_2015/en/.WHO (2016) World Health Statistics 2016: Monitoring Health for the SDGs. Geneva: WHO.Wong, J. (2015) ‘Achieving Universal Health Coverage’, Bulletin of the World Health Organization 93(9): 663–664.World Bank (2003) World Development Report 2004: Making Services Work for Poor People. Washington DC:
World Bank.World Bank (2015) ‘World Bank Supports Better Statistics in Kenya’. Press release. September 10, 2015. Available at
www.worldbank.org/en/news/press-release/2015/09/10/world-bank-supports-better-statistics-in-kenya.World Bank (2016) World Development Indicators available at http://data.worldbank.org/data-catalog/
world-development-indicators.
34 ODI Report

ODI is the UK’s leading independent think tank on international development and humanitarian issues.
Readers are encouraged to reproduce material from ODI Reports for their own publications, as long as they are not being sold commercially. As copyright holder, ODI requests due acknowledgement and a copy of the publication. For online use, we ask readers to link to the original resource on the ODI website. The views presented in this paper are those of the author(s) and do not necessarily represent the views of ODI.© Overseas Development Institute 2016. This work is licensed under a Creative Commons Attribution-NonCommercial Licence (CC BY-NC 4.0).
All ODI Reports are available from www.odi.org
A Samburu warrior observes a road far below him from the top of Ololokwe Mountain, Kenya. © Frederic Courbet/Panos.
Overseas Development Institute203 Blackfriars Road London SE1 8NJTel +44 (0) 20 7922 0300 Fax +44 (0) 20 7922 0399
odi.org
This material has been funded by UK aid from the UK Government, however the views expressed do not necessarily reflect the UK Government’s official policies.