an introduction to the complexity of refinery …an... · an introduction to the complexity of...
TRANSCRIPT

AN INTRODUCTION TO THE COMPLEXITY OF REFINERY BUSINESS INTERRUPTION
Prepared for
OPERA
26 May 2009

Topics of this presentation
Definition of the problem
Refinery configuration as a factor of profitability
The importance of location and access to markets
A case study based on a refinery LP model
Conclusions

Refineries turn crude oil into products. The refining margin is determined by yields and prices.
Product Yields
Gross Revenue
Gross Margin
Variable Margin
Net Cash Margin
Multiplied by
Product Prices
Minus
Feedstock costs
Minus
Variable Refinery
Costs
Minus
Fixed Refinery
Costs
The complexity of the problem originates from the need to marry the technical knowledge needed to understand the yields with market knowledge and awareness of how refineries operate commercially.

Higher profitability exposes the insurer to larger BI claims. What makes a refinery profitable?
PerformancePerformance
Location & Logistics
Location & Logistics
ConfigurationConfiguration
SizeSize
€€Outside the scope of this presentation
Reduces fixed costs. Not relevant for BI
This presentation will focus on configuration, location and logisticsWill show the impact of these factors on profitability

Topics of this presentation
Definition of the problemDefinition of the problemDefinition of the problem
Configuration as a factor of profitability
The importance of location and access to marketsThe importance of location and access to marketsThe importance of location and access to markets
A case studyA case studyA case study
ConclusionsConclusionsConclusions

Most refineries can be classified as simple (topping, hydroskimming), VGO cracking or deep conversion
VACUUMDISTILLATION
DIS
TILL
ATI
ON
HYDROTREATERS
VGO CRACKING
ISOMERIZATION/REFORMER
DEEP CONVERSION
Gasoline
Residue
Middle distillates
Crude Oil
Refinery Fuel and LPGTOPPING/HYDROSKIMMING
Naphtha
Kero/gasoil
VGO CRACKING

Different refineries have different yields and, hence, different margins
3313 9
3945 56
2538 31
0
20
40
60
80
100
Hydroskimming FCC Hydrocracking
Fuel oil Middle distillates Naphtha+gasoline LPG
Refinery Yields from North Sea crude, weight %
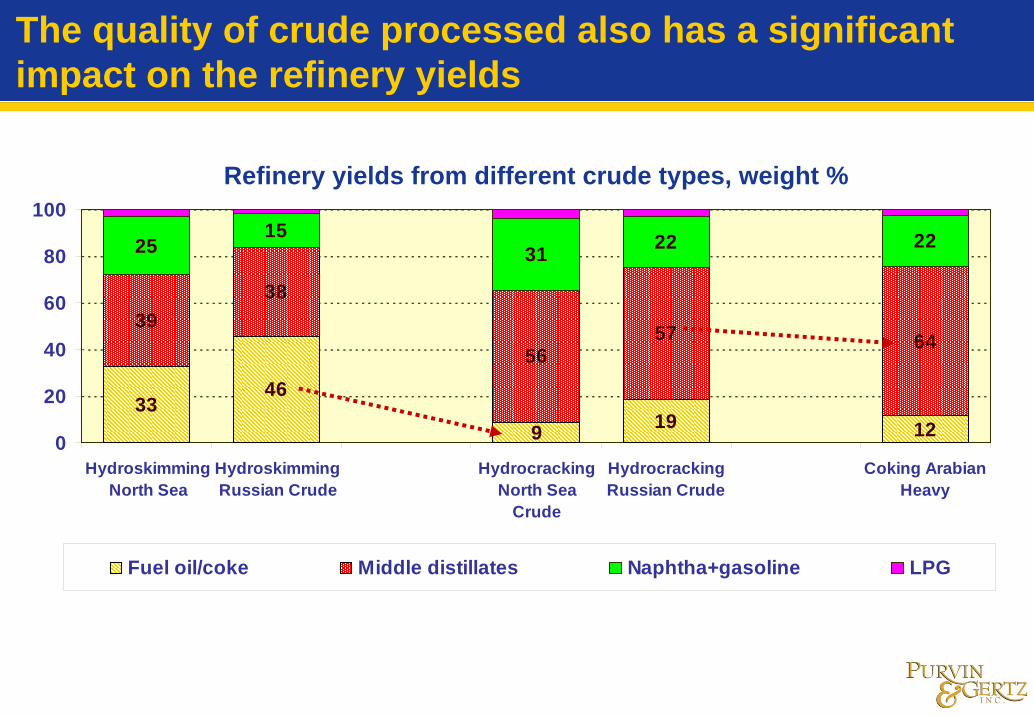
The quality of crude processed also has a significant impact on the refinery yields
3346
9 19 12
3938
5657 64
2515
31 22 22
0
20
40
60
80
100
HydroskimmingNorth Sea
HydroskimmingRussian Crude
HydrocrackingNorth Sea
Crude
HydrocrackingRussian Crude
Coking ArabianHeavy
Fuel oil/coke Middle distillates Naphtha+gasoline LPG
Refinery yields from different crude types, weight %

Processing different crudes requires different process capacities
33.042.0 39.4
49.9
26.0 25.0 27.0 29.517.6
28.2
0102030405060
Hydrocracking North SeaCrude
Hydrocracking RussianCrude
Coking Arabian Light Coking Arabian Heavy
Vacuum Distillation VGO hydrocracking Deep conversion
Capacity needed to process different crudes as % of crude capacity
A typical 200,000 B/D coking refinery needs 35,000 B/D of coking capacity to coke crudes like Arabian Light or Urals
However, 56,000 B/D are needed to coke Arabian Heavy
Turn it the other way: the refinery with 56,000 B/D of coking capacity can convert a much heavier crude to light products. This provides higher profitability.
More conversion capacity generally leads to higher profitability

Hydroskimming capacity barely breaks even. All of the margin is made by the conversion units
-2
0
2
4
6
8
10
12
1990 1995 2000 2005 2010
Hydroskimming FCC Hydrocracking
(Dollars per Barrel)
A conversion refinery can be seen as the sum of two halves:
an hydroskimming refineryconversion units added downstream of the hydroskimming block
The hydroskimming block makes a very small contribution to profitability.
Most of the margin is made by the conversion units
A statement that has remained true over 3 different business environments
Hydrocrackng margins now stronger than FCC margins
Due to market trends
PGI benchmark refining margins for sales at CIF ARA prices

To make matters complicated, different types of capacity can be nested in the same refinery. For example…
-1.0
1.0
3.0
5.0
0
160
200Crude runs, B/D
FCC yields
Hydroskimming yields
A refinery has crude distillation capacity of 200,000 B/D and FCC capacity of 40,000 B/DIts typical crude slate yields 25vol% of FCC feed. The refinery fills up the FCC with 160,000 B/D of crude. Crude processed in excess of 160,000 B/D is with hydroskimming yields.This situation defines two tranches of capacity
The initial 160,000 B/D is cracking capacityThe incremental 40,000 B/D is simple capacity
The capacity needed to fill up the FCC is base load capacity. The remaining capacity is incremental marginal capacity
Base load capacity is normally profitable. The refinery would typically plan to utilize it and may have supply contracts wrapped around itMarginal capacity is normally utilized when margins allow it. Normally relies on spot markets.
Variable Cost margin, $/bbl
N.B.: This is for illustration and does not represent the situation of any specific refinery or location

Simple data on configuration and a bit of judgement can reveal several things relevant to profitability
Process A B
11030-
15-
kB/DkB/DkB/DkB/D
Visbreaking kB/D 35 - 25 25
C D
25
E
1006530-
3808560-
15065-
60
F
Crude Distillation 210 210
Hydrocracking - 20
Vacuum Distillation 70 70FCC 40 30
A and B are cracking refineries with incremental hydroskimming capacityRefinery C has an oversized hydrocracker. It is likely to have a high profitability on a ‘per barrel’ basisD and F can process medium gravity crudes with incremental hydroskimming capacity or can balance on light crudeRefinery E is the opposite. It would struggle to fill up conversion capacity from light crude, but is balanced with heavy crude

Topics of this presentation
Definition of the problemDefinition of the problemDefinition of the problem
Configuration as a factor of profitabilityConfiguration as a factor of profitabilityConfiguration as a factor of profitability
The importance of location and access to markets
A case studyA case studyA case study
ConclusionsConclusionsConclusions

The same crude oil is available at different prices to different refineries located along the supply chain
Cost item $/barrel
Forties, FOB Hound Point 98.00
Inland price 99.30 + x
Cost of delivery to Rotterdam 1.30Forties Price at Rotterdam 99.30Pipeline tariff/cost x
Refineries can be located at different points along the crude supply chain and can pay different prices for the same crudeCrude delivery costs are significant in relation to refining margins and have a significant impact on refinery profitabilityThese refineries may compete in the same market
The costs shown in the table are representative of 2008 average
CIF prices (e.g. Rotterdam)
Inland prices
FOB Prices

Refineries serve a multitude of sales channels that offer various degrees of flexibility in case of an outage
Refinery Retail (Own Brand)
Bulk sales
Own affiliates
Independent Wholesalers/Resellers Commercial fuels
Aviation fuelsDomestic heatingIndustrial fuelsMarine bunker fuels
Retail (Third Party)
Wholesale
RetailVery often
under supply contracts
Very often one-off transactions with no on-going commitments
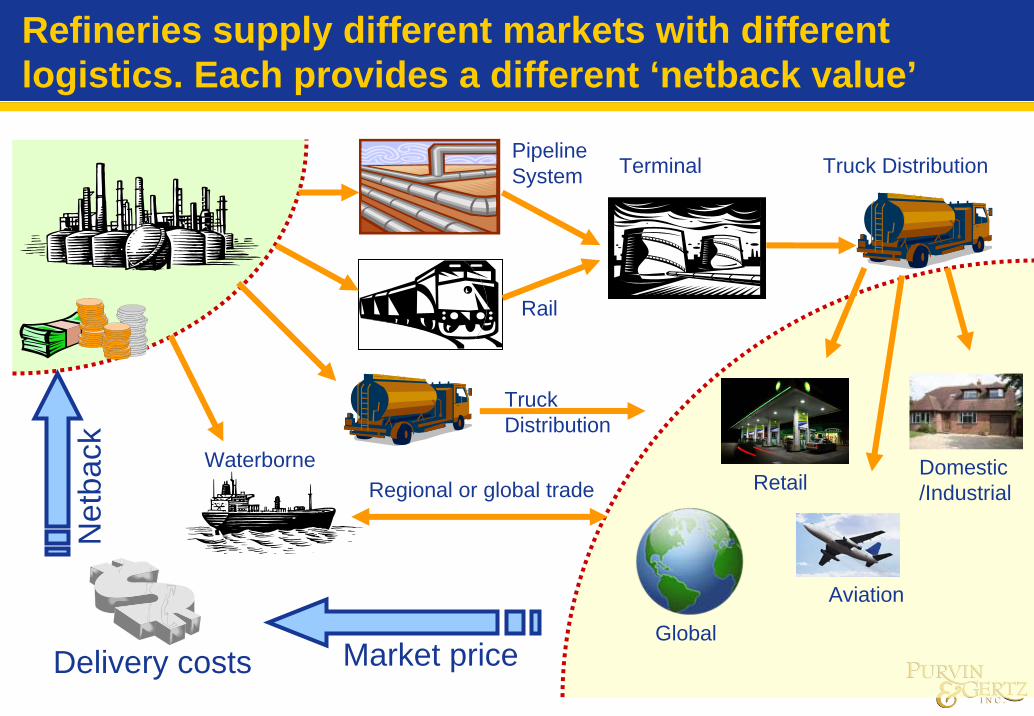
Refineries supply different markets with different logistics. Each provides a different ‘netback value’
Rail
Truck Distribution
Domestic/Industrial
Terminal Truck DistributionPipeline System
WaterborneRegional or global trade Retail
Aviation
Market price
Net
back
Delivery costsGlobal

Access to markets can also influence the break-down between profitable base load and marginal capacity
700
725
750
775
800
825
0 55 80 90 100Sales volume %
Local sales by truck
Sales via Pipe
Sales via Barge
Export cargoes
Gasoline
700
725
750
775
800
825
0 59 91 100Sales volume %
Local Rack Sales Sales via Pipe
Sales via Barge
DieselNetback Price $/t Netback Price $/t
In this example, the refinery sells 55% of its gasoline in the local market by truck. The last 10% is sold as export cargoes at a lower netback than the tranche sold by truckThe least profitable tranche of demand is also served by the least profitable tranche of refining capacity
N.B.: This is for illustration and does not represent the situation of any specific refinery or location

How do we understand what price level a refinery might be able to achieve?
Rotterdam prices for any given product are assessed and published by various independent organizationsThe variety of published assessments reflect the different types of trades and parcelsCargoes can be traded on a “delivered basis” to a named location (CIF cargoes)Alternatively, a refinery could make product available for loading on a cargo (Free on Board, or FOB)Smaller parcels are traded by barge along the Rhine and other associated waterwaysRefineries can sell the same product in different markets at different pricesThe assessment of CIF Cargoes, FOB cargoes or FOB barges is also used in the pricing formulae of supply contracts
Import (CIF) cargoes
Export (FOB) cargoes
FOB Barges
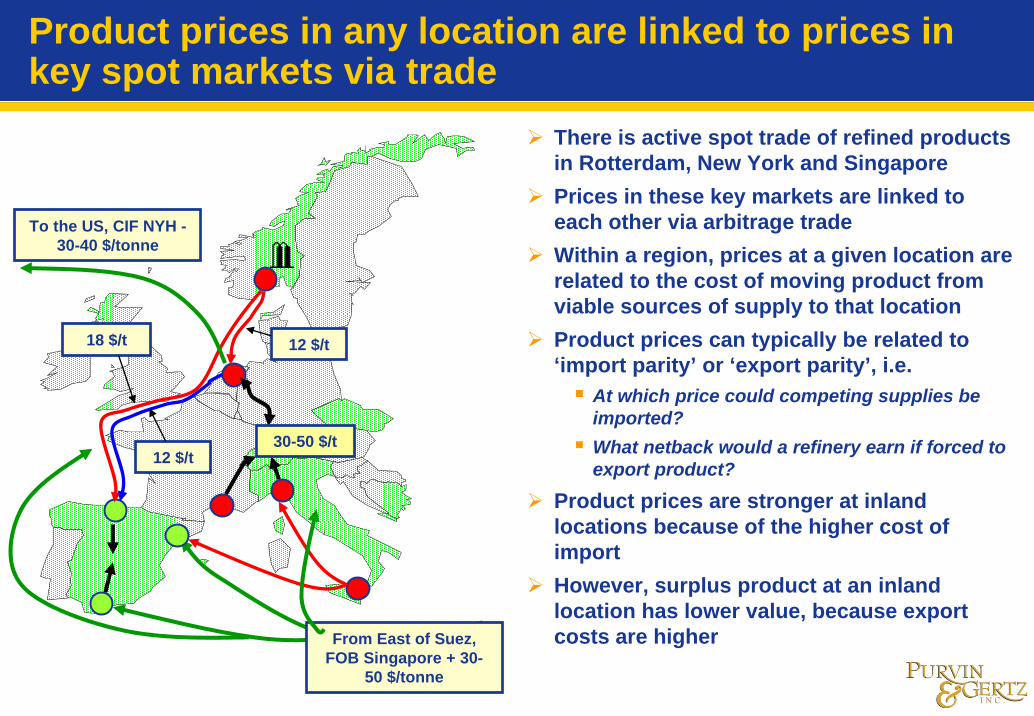
Product prices in any location are linked to prices in key spot markets via trade
There is active spot trade of refined products in Rotterdam, New York and SingaporePrices in these key markets are linked to each other via arbitrage tradeWithin a region, prices at a given location are related to the cost of moving product from viable sources of supply to that locationProduct prices can typically be related to ‘import parity’ or ‘export parity’, i.e.
At which price could competing supplies be imported?What netback would a refinery earn if forced to export product?
Product prices are stronger at inland locations because of the higher cost of importHowever, surplus product at an inland location has lower value, because export costs are higher
12 $/t
18 $/t 12 $/t
To the US, CIF NYH -30-40 $/tonne
From East of Suez, FOB Singapore + 30-
50 $/tonne
30-50 $/t

In summary, the two factors that matter are good access to supplies of crude and to markets for products
Linked to oil fields by pipeline
Coastal refinery with deep water
port
Inland refinery with pipeline
connection to a deep water port
No pipeline, no deep
water port
Inland refinery selling into the local inland market
Coastal refinery selling into the local market
Export from a coastal location
Refinery supplying into a market best served by another refinery
Export from an inland location
Most Competitive
Least Competitive
Cost of delivery of crude oil reduces
Valu
e of
pro
duct
s in
crea
ses

Which factor prevails? Refining closer to the point of consumption is generally more profitable
-3
-2
-1
0
1
2
3
4
5
6
7
1990 1995 2000 2005
Sweet HSK, CIF ARA Sweet FCC, FOB ARASweet FCC, CIF ARA
(Margins, Dollars per Barrel) Crude can be delivered in very large parcels at relatively low cost
$1-2/bbl from an export terminal to a regional refinery in 70-140kT parcels$2-4/bbl to long haul destinations in 100-300kT parcels
Products are traded in much smaller parcels, which are delivered at higher costs
The benefit of higher ‘import parity’ product prices typically outweighs crude delivery costs
Note that the FOB FCC benchmark still outperforms the CIF Hydroskimmingbenchmark
Configuration remains a more important driver of profitability

Topics of this presentation
Definition of the problemDefinition of the problemDefinition of the problem
Configuration as a factor of profitabilityConfiguration as a factor of profitabilityConfiguration as a factor of profitability
The importance of location and access to marketsThe importance of location and access to marketsThe importance of location and access to markets
A case study
ConclusionsConclusionsConclusions

Definition of the case study
Process Capacity
250
100
18
38
140
55
45
30
80
kB/D
kB/D
kB/D
kB/D
Middle distillate HDT kB/D
Mild hydrocracker kB/D
Delayed coker kB/D
Hydrogen plant Nm3/hr
kB/D
Crude Distillation
Vacuum Distilation
Isomerization
CCR reforming
FCC
The FCC crack paraffinic atmospheric residue, up to a concarbon limit and is designed for high yield of propylene
The MHC conversion is 40wt%
At 30,000 B/D the coker is undersized
Minimum production of 95 Unleaded is 1,500 kT/y
Minimum jet fuel is 550kT/y
Sells up to 1,000 t/d of bitumen No obligation to produce fuel oil
All diesel blended to EN590, with option to produce heating gasoil
We have run a simple LP model to simulate the impact on the variable margin of a number of events
Prices are 2007 average

Base case simulation: with appropriate crude selection the refinery achieves zero fuel oil yield
CDU
VDU
Delayed Coker30,000 B/D
MHC (40% Conv)55,000 B/D
FCC45,000 B/D
Diesel HDT
Kero HDT
CCR Reforming38,000 B/D
ISOMERIZATION18,000 B/D
MTBE/Alkylation
Diesel
Jet Fuel
95 Unleaded
Hydrogen Plant
Asphalt
28.6%
5.9%
45.6%
22,000 B/D
6,300 B/D
30,000 B/D
9,700 B/D
250,000 B/D

What happens if the refinery loses some crude distillation capacity?
0
5
10
15
20
25
30
35
40
250 230 210 190 170 150 130
Middle Eastern BTC Blend Urals CPC Blend
Crude intake, kT/day
The figures show the results of LP runs at progressively reducing crude capacity
The LP model changes the crude slate to maximize utilization of conversion capacity. and continues to fill-up cracking capacity.
Only when conversion capacity can’t be filled, losses become significant
0
20
40
60
80
100
120
250 230 210 190 170 150 1300.0
0.4
0.8
1.2
1.6
2.0
2.4
Loss Crude IsomMHC FCC Coker
Capacity utilization,% Loss, M$/d

Feedstocks can be purchased to bypass crude distillation and keep conversion capacity full
Cases are in pair: for each case at a given crude capacity there is a case where the refinery purchases feedstocks to fill up conversion capacity
Assuming that a sufficient volume of feedstocks is available, the refinery can lose half of its distillation capacity and margin losses are still moderate
Large losses materialize when the refinery is unable to utilize conversion capacity
0
5
10
15
20
25
30
35
40
250 210 210 170 170 130 130
Sour crude BTC Blend CPC Blend SRFO/VGO
0
20
40
60
80
100
120
250 210 210 170 170 130 1300.0
0.4
0.8
1.2
1.6
2.0
2.4
Loss MHC FCC Coker
Crude intake, kT/day Capacity utilization,% Loss, M$/d

The outage of any conversion unit can lead to losses in excess of $1 million per day
If the entire conversion capacity is down, the refinery may not make a positive marginIt might be better to take a total shut-down!Another option would be to run at minimum technical capacity to meet supply contracts
Distillate upgrading units (e.g. reforming, isomerization and hydrotreaters) make lower incremental contributions to margins, but beware of interdependencies
The CCR shut down has left the refinery short of hydrogenLosing the hydrotreater has forced a switch to low sulfur crude
-0.50.00.51.01.52.02.53.03.54.0
Base Coker FCC MHC CCR 60KB/D HDT Isom Allconversion
Residual margin Loss versus base case

Simulation of a recovery plan from an outage of all of the conversion capacity and 100kB/D of crude capacity
Each step brings a process unit back on stream. When the coker comes on stream, crude capacity is still limited to 150kB/DBy the time all of the conversion capacity is on stream, the refinery has almost restored full profitability, even though 100kB/D of crude capacity is outAfter such an event, the refinery should be expected to initiate actions that allow restarting conversion capacity as soon as possible
-0.5
0.00.5
1.0
1.52.0
2.5
3.03.5
4.0
Base Case After event VDU MHC FCC Coker
Residual margin Loss versus base case

The assessment of losses would also need to consider how incremental product would have been sold
0%10%20%30%40%50%60%70%80%90%
100%
Base Afterevent
VDU MHC FCC Coker
As production capacity is restored, supply to the most profitable markets is resumed firstMeanwhile, there may be a dilemma:
Withdraw from the market and maximize margins or defend market share by supplying at a loss?Easy to withdraw from the spot market, but would have to invoke force majeure - and upset a customer – to withdraw from a contract
Without the 100kB/D of crude capacity the refinery has restored profitability, but is still short of 25% gasoline and diesel
Assessing the loss would take a review of product disposition because that would likely be the least profitable market tranche available to the refinery
0%10%20%30%40%50%60%70%80%90%
100%
Base Afterevent
VDU MHC FCC Coker
Gasoline production Diesel production

Topics of this presentation
Definition of the problemDefinition of the problemDefinition of the problem
Configuration as a factor of profitabilityConfiguration as a factor of profitabilityConfiguration as a factor of profitability
The importance of location and access to marketsThe importance of location and access to marketsThe importance of location and access to markets
A case studyA case studyA case study
Conclusions
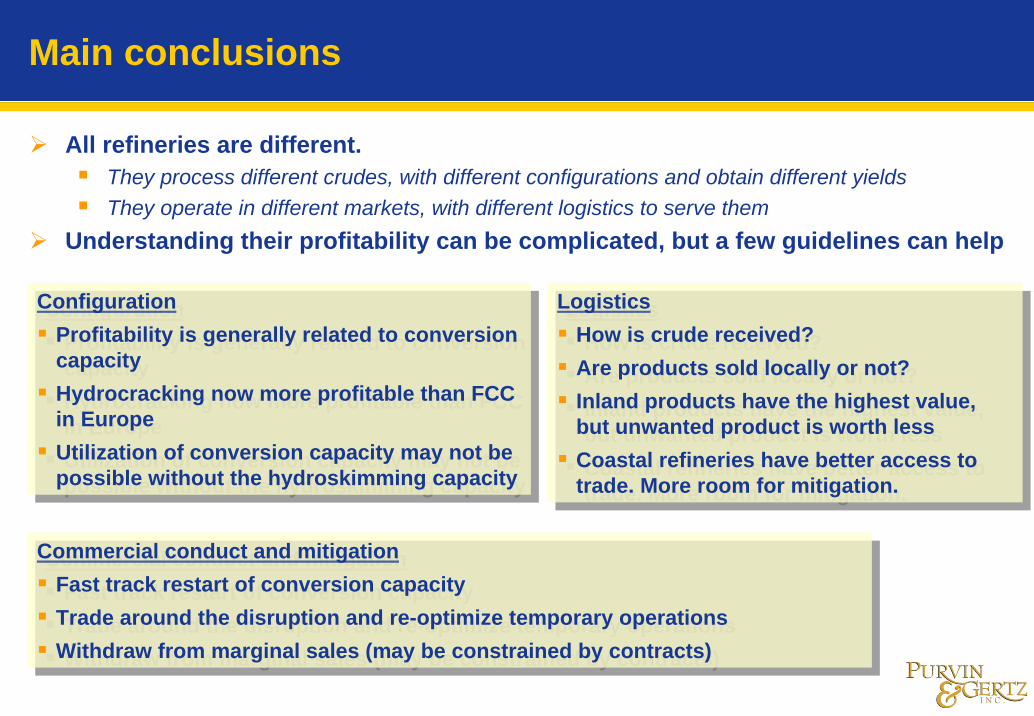
Main conclusions
All refineries are different. They process different crudes, with different configurations and obtain different yieldsThey operate in different markets, with different logistics to serve them
Understanding their profitability can be complicated, but a few guidelines can help
LogisticsHow is crude received?Are products sold locally or not?Inland products have the highest value, but unwanted product is worth lessCoastal refineries have better access to trade. More room for mitigation.
LogisticsHow is crude received?Are products sold locally or not?Inland products have the highest value, but unwanted product is worth lessCoastal refineries have better access to trade. More room for mitigation.
ConfigurationProfitability is generally related to conversion capacityHydrocracking now more profitable than FCC in EuropeUtilization of conversion capacity may not be possible without the hydroskimming capacity
ConfigurationProfitability is generally related to conversion capacityHydrocracking now more profitable than FCC in EuropeUtilization of conversion capacity may not be possible without the hydroskimming capacity
Commercial conduct and mitigationFast track restart of conversion capacityTrade around the disruption and re-optimize temporary operationsWithdraw from marginal sales (may be constrained by contracts)
Commercial conduct and mitigationFast track restart of conversion capacityTrade around the disruption and re-optimize temporary operationsWithdraw from marginal sales (may be constrained by contracts)

Just two additional remarks….
-113579
1995 1996 1997 1998 1999 2000 2001 2002 2003 2004 2005 2006 2007
USGC Coking Singapore HydrocrackingNWE Hydrocracking
(Net margins after cash costs, Dollars per Barrel)
1. This presentation has used examples based on Europe, but several concepts discussed in this presentation are generally valid where refineries operate in liberalized markets
Refining is a truly global business. Prices at different locations are linked by trade and margins in various regions track each other
2. Without diminishing the importance of understanding individual refineries, their profitability is hugely affected by the prevailing prices in the international market
Awareness of where the global market might be going comes before everything else!

33
About This Presentation
This presentation has been prepared for the sole benefit of OPERA. Any third party in possession of this presentation may not rely upon its conclusions without the written consent of Purvin & Gertz. Possession of the presentation does not carry with it the right of publication.
Purvin & Gertz conducted this analysis and prepared this presentation utilizing reasonable care and skill in applying methods of analysis consistent with normal industry practice. All results are based on information available at the time of review. Changes in factors upon which the review is based could affect the results. Forecasts are inherently uncertain because of events or combinations of events that cannot reasonably be foreseen including the actions of government, individuals, third parties and competitors. NO IMPLIED WARRANTY OF MERCHANTABILITY OR FITNESS FOR A PARTICULAR PURPOSE SHALL APPLY.
Some of the information on which this presentation is based has been provided by others. Purvin & Gertz has utilized such information without verification unless specifically noted otherwise. Purvin & Gertz accepts no liability for errors or inaccuracies in information provided by others.