an investigation of fine coal grinding kinetics
TRANSCRIPT

AN INVESTIGATION OFFINE COAL GRINDING KINETICS
by
_ Michael Duane Brown
Thesis submitted to the Faculty of theVirginia Polytechnic Institute and State University
in partial fulfillment of the requirements for the degree of
MASTER OF SCIENCE
in
Mining and Minerals Engineering
APPROVED:
AC &\ [R7 Ü ^
G. T. Adel, hairmanq R. H. Yoon/
so / ,„ /7*„" ""' °
,Ü.J. R. Lucas WM. E. Foreman
L1
June, 1986Blacksburg, Virginia „

AN INVESTIGATION OFFINE COAL GRINDING KINETICS
by
Michael Duane Brown
Commitee Chairman: Dr. Greg T. AdelMining and Minerals Engineering
(ABSTRACT)
In recent years, a great deal of interest has been
shown in developing methods for preparing super—clean
coal containing less than 2% ash and 0.5% sulfur. New
techniques for recovering fine coal, such as
micro—bubble flotation, can achieve the desired result
provided mineral matter is sufficiently liberated. To
achieve sufficient liberation, however, it is often
necessary to grind to a mean particle size finer than
10 microns. Since conventional ball mills are highly
inefficient in this fine size range, the stirred ball
mill has been proposed as a more suitable means for
ultrafine grinding.
A five inch diameter mill has been designed and
constructed to investigate the milling characteristics
of stirred ball mill grinding using an Elkhorn seam
coal. A study of particle size distributions produced
under various operating conditions and constant energy
input revealed that slow shaft speeds and small ball
sizes improved grinding efficiency. Feed percent

solids in the range of 20% to 60% had no effect on
grinding efficiency below 100 kwh/ton of energy input.
Breakage parameters were also determined in order
to model the ginding process using a population balance
technique. The grinding model was found to accuratly
predict particle size distribution for short grind
times but to deviate from actual data over longer
grinding periods.

ACKNOWLEDGEMENTS
I would like to express my sincere gratitude to Dr.
Greg T. Adel and Dr. Roe-Hoan Yoon for their guidance and
support throughout this investigation. Special thanks
are also extended to Dr. J. Richard Lucas and Dr. William
E. Foreman for their patience and assistance in arranging
for the final completion of this thesis.
Final thanks are extended to my parents, who have
supported my interests and been an inspiration during the
entire term of my college career.
iv

TABLE OF CONTENTS
PageAbstract ........................................... iiAcknowledgments .................................... ivList of Figures .................................... viiList of Tables ..................................... xi
CHAPTER 1. Introduction.............................. 11.1 Need for Fine Coal Grinding................... 11.2 Grinding Techniques........................... 31.3 Related Studies............................... 6
1.3.1 Stirred Ball Mill Grinding............... 61.3.2 Grinding Kinetics........................ 101.3.3 Population Balance Model................. 12
1.4 Scope of Present Investigation................. 15
CHAPTER 2. Experimental Techniques................... 162.1 Coal Sample................................... 162.2 Grinding Equipment............................ 172.3 Sizing Equipment.............................. 232.4 Torque Measurement............................ 262.5 Experimental Procedure........................ 302.6 Product Sampling.............................. 31
CHAPTER 3. Experimental Results...................... 363.1 General Operating Characteristics............. 363.2 Equal Energy Testing.......................... 41
3.2.1 Percent Solids........................... 413.2.2 Dry Grinding............................. 463.2.3 Shaft Speed.............................. 493.2.4 Ball Size................................ 52
3.3 Analysis of Breakage Parameters............... 603.3.1 Selection Function....................... 623.3.2 Breakage Function........................ 65
CHAPTER 4. Discussion of Operating Conditions........ 694.1 Percent Solids...............·................. 694.2 Rotor Speed................................... 714.3 Ball Size ..................................... 744.4 Energy—Size Relationship...................... 79
CHAPTER 5. Grinding Simulation....................... 83
CHAPTER 6. General Conclusions and Suggestionsfor Future Work........................ 88
6.1 Conclusions................................... 88' 6.2 Recommendations............................... 89
REFERENCES............................................ 91Appendix A............................................ 94Appendix B............................................ 99
v

Appendix C............................................102
VITA..................................................108
vi

LIST OF FIGURES”
PageFigure 1.1 Comparison of different types of
grinding machines (Davis et al.,1980) .................. 5
Figure 1.2 Comparison of the effectiveness ofvarious grinding devices for theultrafine grinidng of a chalcopyriteconcentrate (Herbst and Sepulveda,1978) ................. . 7
Figure 2.1 Three dimensional schematic of batchstirred ball mill ............ 18
Figure 2.2 Front view of 5-inch diameter stirred‘
ball mill ................ 20
Figure 2.3 Top view of 5-inch diameter stirredball mill ................ 21
Figure 2.4 Schematic of mill mounted to drillpress (Mankosa, 1986) .......... 22
Figure 2.5 Schematic of size measuring techniqueemployed by Elzone 80-XY particle sizeanalyzer (Davis, 1986) ......... 25
Figure 2.6 Comparison of sampling techniques for1—minute grind ............. 33
Figure 3.1 Effect of media load on torquerequirement ............... 38
Figure 3.2 Effect of stirring speed on torquerequirement (Mankosa, 1986) ....... 39
Figure 3.3 Effect of ball diameter on torquerequirement ............... 40
Figure 3.4 Effect of percent solids on productsize distribution at 94 kwh/ton ..... 44
Figure 3.5 Effect of percent solids on productsize distribution at 280 kwh/ton .... 45
Figure 3.6 Effect of dry grinding on product sizedistribution .............. 48
vii

hPage
Figure 3.7 Effect of shaft speed on product sizedistribution .............. 50
Figure 3.8 Effect of shaft speed on median productdiameter at 63.5 kwh/ton ........ 51
Figure 3.9 Effect of ball size on product sizedistribution .............. 54
Figure 3.10 Effect of ball size on product sizedistribution after a 10-minute grind(100 x 150 mesh feed) .......... 56
Figure 3.11 Effect of ball size on product sizedistribution after a 1-minute grind(100 x 150 mesh feed) .......... 58
Figure 3.12 Effect of ball size on product sizedistribution after a 5-minute grind(100 x 150 mesh feed) .......... 59
Figure 3.13 Change in mediam product diameter over30-minute grind time for 1/16-, 3/32-and 1/8-inch balls ........... 61
Figure 3.14 Feed disappearance plots for varioussize fractions using 1/4-inch media .. . 63
Figure 3.15 Breakage rate function versus feedparticle diameter using 1/4-inch media . 64
Figure 3.16 Selection function versus geometricmean size using 1/4-inch media ..... 66
Figure 3.17 Cumulative breakage function versusnormalized size variable ........ 68
Figure 4.1 Diagram of parabolic depressionoccuring in the batch mill at highershaft speeds .............. 73
Figure 4.2 Feed disappearance plots for 100 x 150mesh feed using various ball sizes . .. 76
Figure 4.3 Breakage rate function versus balldiameter ................ 77
Figure 4.4 Charles Law plot for stirred ballmilling of Elkhorn seam coal ...... 80
viii

PageFigure 5.1 Comparison of experimental and
predicted size distributions after1-minute grind ............. 86
Figure 5.2 Comparison of experimental andpredicted size distributions after5—minute grind ............. 87
ix

LIST OF TABLES
Page
Table 1. Comparison of sampling techniques fora l—minute grinding period................. 34
Table 2. Standard milling conditions for comparisonof feed percent solids...................... 42
Table 3. Products produced at 64 kwh/ton andvaried shaft speeds........................ 53
x

CHAPTER 1.
Introduction
1.1 Need for Fine Coal Grinding
The primary purpose of grinding coal is the liberation
of finely dispersed shale particles which cannot be
separated by conventional cleaning techniques. It appears
that nearly complete liberation of coal and ash occurs wheno
the ground product has a mean size less than ten microns.
The needed mean size may, however, be as little as one or
two microns. The liberation provided by grinding to these
small sizes can assist in producing super—clean coals which
contain less than 1% ash and 1% sulfur. New separation
techniques, such as the microbubble flotation process, are
now being developed at Virginia Tech to produce these high
quality coals at a high recovery, provided the feed coal is
sufficiently liberated. The recent economic pressures for
maximizing coal recovery, and current concerns about
limiting SO2 emissions through government acid rain
legislation, make super-clean coals, and coal grinding,
particularly important.
Fine coal is also needed in many newly developed
processes such as the preparation and burning of coal-water
fuels and other liquid coal mixtures. Liquid—coa1
1

2
technology has advantages over current solid coal
processing and burning techniques since a liquid fuel can
be pumped, stored in tanks, transported via pipes, and
injected into furnaces and boilers. Furthermore, less
capital is required to convert a furnace from oil to a
pumpable coal—liquid fuel than is required to convert to a”
solid fuel. Finally, the use of coal—liquid fuels makes it
possible for utilities to become less dependent on foreign
raw materials, particularly oil.
It is important in transportation and storage of
liquid-coal fuels, that the mixture is both pumpable and
stable. Ultrafine coal enhances the stability of a liquid
coal mixture. Depending on the requirements of a
particular application, varying the degree of coal grinding
may be a useful technique for controling the stability of a
mixture. Department of Energy research has demonstrated
that a median particle size of about 15 microns will give
good slurry stability without the need for stabilizing
additives.
In processes in which coal is mixed with liquids and
burned in engines, a primary concern is wear on valves and
other internal machine parts. It appears that wear could
be reduced by grinding to ultrafine sizes (Atlantic
Research Corp.,1984). Fine coal may be less abrasive on
pumps and piping than larger sized coal. Provided it can
3
be ground inexpensively, ultrafine coal may prove
economically beneficial in reducing wear and extending the
life of coal burning machinery.
lt is apparent that fine coal grinding will be
important in producing superclean coals and coal mixtures.
Economic conditions in today's coal industry require that
size reduction occur at the lowest possible cost. For this
reason, it is important to examine the coal grinding
process and to determine the operating characteristics
which influence its energy efficiency. It is equally
important to be able to describe mathematically the
breakage process in terms of the rate of size reduction and
the size distribution of the final product in order that
these fine grinding devices may be properly designed.
1.2 Grinding Techniques
There are several grinding techniques which may be
employed to produce fine and ultrafine products. Ball
milling is the most commonly used technique in the mineral
processing industry today. Although it is the most common,
it is not necessarily the most energy efficient method of
grinding. Conventional ball milling cannot achieve a minus
ten micron product without requiring extremely long
retention times and very large energy inputs. Other

4
approaches to ultrafine grinding include vibratory, impact,
ultrasonic, and attrition milling. Past studies conducted
by the United States Bureau of Mines indicate that of these
methods, attrition milling may be the most promising for
producing micronized material in a fast and energy
efficient manner (Davis,et.a1.,1980).
The Bureau—developed attrition process grinds through
intense agitation of a mixture consisting of the material
to be ground, a grinding media, and a suspending fluid.
This is also true of the stirred ball mill process
described by Herbst and Sepulveda (1978). Breakage in this
process is thought to occur by a shearing action as
particles are captured between balls, between balls and the
impeller, and between balls and the vessel wall.
The USBM data, shown in Figure 1.1, indicates that the
attrition process is far superior to other grinding methods
for reducing coarse kaolin to a product size below 2
microns. Studies done by Herbst and Sepulveda (1978) have
further demonstrated that a stirred ball mill, similar to
the USBM attrition mill, is also more efficient in particle
reduction than the conventional ball mill and the vibratory
mill. Their study demonstrates that particle size
reduction continues in a stirred ball mill after large
energy inputs, while conventional ball milling appears to
slow and eventually reach a limiting product size at which

5
¤¤
O;_
E9:.,
E
JK
cx
an
hl
E
5*:
-5
E';"
3~
~<e*1
*—•
,.4
0*0
cn
äé
2:T:E
1;
o
E§‘%’°°
“’
:
sgofg
GJ
Ui
.;.1
Mg
an
5
"ääf
~
ui
C
5*9*9
Egg:
gg
O5.'2
PS-·
8
O-S
°§;;
g‘°
2**l:
,
-A-J
#2uiggsé-5
geo
sa!
UE
•i°g6l
~<<v»-·:=¤=
°r-4
¤·

6
additional energy input has little effect on size
reduction. This is shown graphically in Figure 1.2.
With the reported success of these systems, it is
apparent that the stirred ball mill process should be
further quantified in terms of its energy requirements and
rate of size reduction for grinding of coal.
1.3 Related Studies
1.3.1 Attrition and Stirred Ball Mill Grinding
The first attrition grinder was adapted from a device
developed by the United States Bureau of Mines for
scrubbing glass sand to remove iron oxide stain (Dasher and
Ralston,1941). In the original scrubbing device, designed
by J.E. Norman and O.C. Ralston (1938), the slurried
material was scrubbed without grinding media. By simply
adding a granular grinding media, along with a suspending
liquid, the scrubber was modified to a grinding device.
Full introduction of the attrition grinder was‘
presented several years later by I.L Feld, T.N McVay, H.L.
Gilmore and B.H. Clemmons (1960). This work presented
diagrams showing the design characteristics of the mill and
data for grinding of coarse kaolin. All testing was done
in a batch mode using a 5 and a 10—inch diameter mill.

7
8
*\
E7
Vibrotory
6
LIJfl] 5U)
4ä— Conventdonol WETUJ
2 umStirred
1
0 100 200 300 400 500
SPECIFIC ENERGY INPUT (kwh/Ion)
Figure 1.2 - Comparison of the effectiveness of variousgrinding devices for the ultrafine grinidng ofa chalcopyrite concentrate (Herbst andSepulveda, 1978).

8
M.H. Stanczyck and I.L. Feld further studied the
operation of the attrition mill in an open circuit, a
closed circuit and a batch mode (1963;l965). Using a 5
inch diameter mill, they determined that the most important
operating characteristics in the attrition grinding of
kaolin were type, size and shape of grinding media,
grinding media to clay weight ratio, rotor speed, pulp
density, degree of pulp dispersion, and the angular
arrangement of rotor and stator bars. The reported
operating characteristics which had little effect on
grinding efficiency were pulp temperature, design of rotor
cage, rotor clearance, rotor—stator bar interval, addition
agents and chamber liners. Their report also indicated
that spherical media is preferable to sharp angular or long
bladed media with respect to media degradation, machine
abrasion and grinding efficiency (1968). The first
attempts to quantify the milling process were done while
studying the grinding of ceramic oxides in a 5 inch mill
(Stanley,et.al.,1974). Milling rate constants calculated
for 45x5O mesh dolomite were obtained under a variety of
operating conditions and reported to follow first—order
kinetics.
Continuing the initial mathematical study of the
attrition process, Sadler and Stanley (1975) further
verified the assumption of first-order kinetics for coarse

9
sizes using Ottowa sand as a grinding media. They
determined that for the size range studied, grinding
efficiency was constant regardless of power input to the
mill.
Another more recent study by the Bureau of Mines
(Davis,et.al.,1980) examines the attrition grinding process
for several minerals. An initial qualitative presentation
shows attrition milling to be superior to other methods of
grinding for producing -2 micron material. Preliminary
results are also reported on autogenous grinding of olevine
and mica. The majority of data presented in the literature
has concentrated on the basic ability of the attrition mill
to reduce material to fine sizes. Grinding performance, ,
therefore, is often stated in terms of the ability of the
mill to rapidly reduce a coarse material to extremely fine
sizes. Very little has been published which presents·
specific data describing energy requirements and breakage
rate values particulary for grinding of coal. Sepulveda
and Herbst (1982) have presented data for grinding of
several types of materials in a stirred ball mill similar
to that used in this research. Aside from their
verification of the high efficiency levels of the stirred
ball mill in comparison with more conventional grinding
methods, they demonstrated that a simplified modeling
approach using the Charles Equation produced good results

1O
in predicting the median diameter size of products for
different energy inputs to the mill. Mill operating
conditions were shown to have little effect on the energy
efficiency of the grinding process leading to the
conclusion that product size distributions are generally a
function of energy input alone. A generalized grinding
model based on the concept of distributed strength for the
material being ground was developed and an analytical
solution was obtained for batch grinding conditions.
1.3.2 Grinding Kinetics
The first attempts to relate breakage energy to the
performance of grinding devices were formulated as
empirical energy-size reduction relationships. These “laws
of comminution" proposed by Rittinger (1867), Kick (1885),
and Bond (1952) have been used for many years to estimate
mill capacity and power requirements. The laws are based
on work indices which are related to surface area, particle
volume or crack length. Since the relationships are
empirically based, they only fit experimental data for a
limited range of variables and in specific circumstances
(Hukki,1962). None of the laws is capable of defining the
ground product in terms of its particle size distribution.
In contrast to the empirically developed relationships of

11
Bond, Kick, and Rittinger, the population balance model isl
capable of predicting a product size distribution when the
initial feed distribution is known. Epstein (1947)
established the probabalistic approach to modeling the
comminution process. His major contribution to the
development of a population balance model was describing
the comminution process in terms of a selection function
and a breakage function. The selection function, S¤(y),
was defined as the probability that a particle of size y
would break during the nth step of the breakage process.
The breakage function B(x,y) was defined as the cumulative
weight distribution of particles appearing in or below size
class x as a result of breakage from a unit mass of size y,
Broadbent and Callcott (1956) used Epstein's selection
and breakage functions to introduce a matrix approach for
representation of the breakage process. The terms of the
feed matrix were obtained from either simple relationships
with particle size or from experimental data. The
selection and breakage approach was furthur modified by
Gardner and Austin (1962) who derived a size-mass balance
equation in differential terms to construct a breakage
model for batch grinding. A radioactive tracer technique
was employed to determine the breakage parameters and _
computer analysis provided an iterative solution to their
equation.

12
Using the techniques introduced by the previously
mentioned researchers, several investigators have been able
to present convincing cases for the use of population
balance models as an alternate to the empirical laws of
comminution (Herbst,et.al,1971,1972,1973;Austin,1973).
1.3.3 Population Balance Model
Several authors have discussed the formulation of
population balance models (Herbst,1971;Kim,1974;Reid,1965).
The most useful form of these models is generally agreed to
be the size-discretized, time continuous description. This
model completely describes the breakage process through
size- discretized selection and breakage functions which
may be obtained experimentally. The derivation of the
model is briefly described below.
The distribution of material in a batch mill can be
described in terms of incremental size intervals with a
maximum size, xi, and a minimum size x¤+i. The mass in the
size fraction, ml(i) will therefore be defined as the
fraction bounded above by xi and below by xi+l. Each size
increment can be defined through screening by establishing W
the xi to xi+i size ranges such that they correspond to the
geometric progression of a standard sieve series.
·To describe the time changes in the original

13
distribution of fractions m(i) through m(n) it is necessary
to track the material which is broken out of and into each
individual mass fraction. Most size—mass balance models
use the "first-order hypothesis" which states that the rate
of breakage of any size is proportional to the amount of
that size present in the mill. In this instance, the rate
of breakage is represented by the equation
Rate of Breakage = Si mi(t) H (1)
where Si is the fractional rate of breakage of size i
(time'l) and H is the total mass of material being ground.
The materiai which enters into a size fraction as a
result of the breakage of larger particles must be counted
to complete the mass balance. The breakage function, bij,
is defined as the fraction of primary breakage products of
material in the jth size interval which appears in the ith
size interval. Using this value, the rate of appearance fo
material in the ith interval from the jth interval can be
expressed as
biijSj mj(t) H (2)
To describe the full breakage of particles from the j
size into smaller intervals, a cumulative breakage function
can be defined as follows: _
14
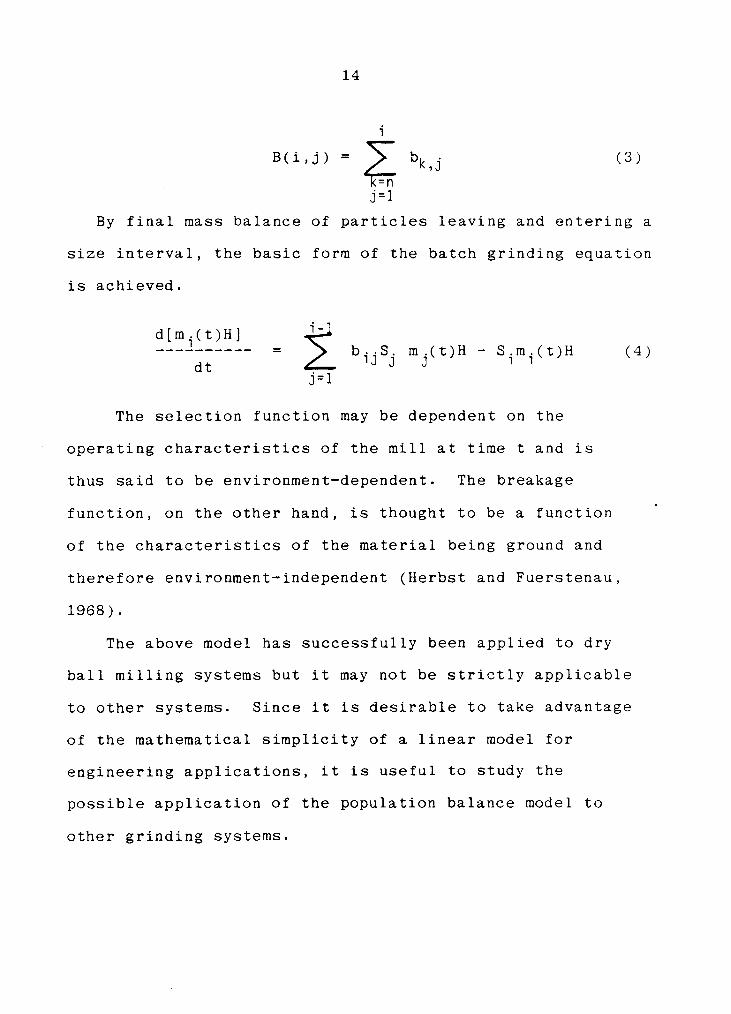
i
B(i„J) = ;- bkk, (3)=n
j=l
By final mass balance of particles leaving and entering a
size interval, the basic form of the batch grinding equation
is achieved.
(4)dt _ 1J J J T l
3=l
The selection function may be dependent on the
operating characteristics of the mill at time t and is
thus said to be environment-dependent. The breakage
function, on the other hand, is thought to be a functionI
of the characteristics of the material being ground and
therefore environment-independent (Herbst and Fuerstenau,
1968).
The above model has successfully been applied to dry
ball milling systems but it may not be strictly applicable
to other systems. Since it is desirable to take advantage
of the mathematical simplicity of a linear model for
engineering applications, it is useful to study the
possible application of the population balance model to
other grinding systems.

15
1.4 Scope of the Present Investigation
Previous studies on the stirred ball mill process have
focused on the grinding of many different types of
materials. Little work has been done which specifically
concentrates on coal. In this investigation, the stirred
ball mill grinding process is examined as it relates to
producing ultrafine coal products with a mean particle
size less than 10 microns. A primary interest in this
investigation is to determine the effect of the
controllable variables in the milling process on grinding
rate and energy consumption. Contollable variables
include media size, weight percent solids of the slurry,
rotational speed of the central shaft, and grind time.
The population balance technique for grinding simulation
is also applied for the stirred milling process to
determine its ability to represent product distributions
over short and long grind periods.

CHAPTER 2
Experimental Techniques
The experimental portion of this research consisted
mainly of grinding experiments performed on one coal,
using one stirred ball mill, operated in a batch mode.
Standard sizing techniques were used on coarse material
while sub·sieve material was measured using a particle
size analysis system similar to the familiar Coulter
Counter. Power input to the mill was measured using a
torque sensor mounted on the central shaft of the stirred
ball mill.
2.1 Coal Sample
The coal used during this investigation was obtained
from United Coal Company's Wellmore operation in
Southwestern Virginia. The raw product was a bituminous
coal, typical of the Appalachian region, which was mined
from the Elkhorn seam. Approximately two hundred pounds
were removed from a raw coal stockpile and stored in
barrels at the lab.
The large coal was reduced below 20 mesh by passing it
through laboratory roll crushers. This product was then
cleaned in a heavy media Suspension at a specific gravity
16

17
of 1.30 to reduce the ash level to approximately 6.5%. A
large portion of the cleaned coal was hammer milled and
wet screened at various sizes to produce monosized feeds
for determining grinding rates. The sized products were
split into 350 gram lots and stored for grinding
experiments. Other portions of the cleaned coal were
passed through a small hammer mill and stored for
subsequent testing.
2.2 Grinding Equipment
All experiments conducted during this investigation
were performed in a batch mode using a stirred ball mill
designed and constructed specifically for this research.
The mill, shown in Figure 2.1, was designed for effective
swirling action of the media and material to be ground.
Rounded shafts, chambers, and pins were used to minimize
the the amount of internal wear and to provide for easy
construction.
In order to eliminate rust problems, the mill shell,
impeller pins, and impeller shaft were all constructed
from stainless steel. The mill shell consisted of a
1/8—inch thick stainless steel tube having inside
dimensions of 5 inches in diameter and 6 inches in length

1 8
ßÄ,
\
Q‘’
I
©
Figure 2.1 — Three dimensional schematic of batch stirredball mill.

19
as shown in Figures 2.2 and 2.3. The shell was surrounded
by a larger tube to create a cooling jacket for the mill.
The sealed jacket was fitted with two small steel tubes
which were used to circulate cooling water across the
inner vessel as tests were conducted.
The central shaft consisted of a 3/4-inch diameter
stainless steel rod with six, 3/8-inch diameter pins to
provide stirring. The pins were 4 inches long and were
offset by 90 degrees at 1-inch increments along the length
of the shaft. The mill lid was allowed to rest on top of
the mill in most cases; however, for very high stirring
speeds the lid was strapped in place. A-teflon bearing
was used to provide a seal between the lid and the central
shaft.
The entire mill assembly was mounted on a variable
speed drill press with a 1 horsepower drive motor as shown
schematically in Figure 2.4. A series of belts and
pulleys enabled the stirring speed to be varied from 200
to 3500 rpm. A movable support platform allowed the mill
to be raised or lowered for easy loading and unloading of
the sample and media.
A Teledyne Model A-05 torque transducer with a
rotational speed pick-up was used to provide a measurement
of power input and rpm. The signal from the transducer was
amplified on a Brewer Engineering Model DDJ-335A/2 signal

20
28 a
1lDIA.-2;- .1. I·~~S- **=* { {I_—l —I—I W
..„ I I 1%¤{A. _}-
«—» — { —T’
-l---V-
•-äo•{ n{,‘QJ- ‘I""; i" {”“_—I
I {I -ä—D|A-TYP.’f··—I ”{I
„-
--L--— {
_
'l I I
I __— — {{ {Ä I I..;
•"V—I—-_.I..
‘NOTE= ALL DIMENSIONS
GIVEN IN INCHES
Figure 2.2 — Front view of 5-inch diameter stirred ball
mill.

21
/2%3
X. 8// 11
1 11 / 1 11 1 *1 \ 1
1—-1-___—
111 11
1 1 1 11 1 //
. 1 11
1Figure2.3 - Top _view of 5-inch diameter stirred ball mill.

22
§ 1———
.
— —}=
vumoton_•
1
imsnn unn .
Ä—‘ä .•
{I
roncnue /
-
{ ® •1¤l~C.NO LC. SENSOR{
I
I :SHAFT
= =counnnai =IMPELLER / ..2..
'snur •Emu.-——+ E
.=
. „!
tgAmusune /nnen IglIIIII
—
Figure 2.4 — Schematic of mill mounted to drill press(Mankosa, 1986).

23
amplifier to provide a digital readout of torque in
inch—pounds, rotational speed in rpm, and energy input in
horsepower. The torque transducer was mounted above the
mill on the central shaft. Grinding media consisted of
l/4- inch, l/8—inch, 3/32-inch, and 1/16-inch steel
burnishing media obtained from Pioneer Steel Ball Company.
The media were formed from a hard carbon steel and were
thus prone to rusting. Stainless steel media are more
desirable if one can afford the added expense. The carbon
steel balls required a great deal of care to prevent
rusting. Especially in the small sizes, these balls
retained a significant amount of water and had to be dried
immediately after use.
2.3 Sizing Equipment
Sizing of the raw feed and the product was carried out
using 8" diameter Tyler series sieves ranging from 20 to
500 mesh. A mechanical sieve shaker, manufactured by
Ro—Tap, was used for preliminary separation of dry coal,
followed by manual wet screening to insure proper size
segregation. An Electrozone 8OXY particle size analyzer
manufactured by Particle Data Inc. was used to determine
the size distribution of sub·sieve particles appearing in
both the product and feed samples.

24
The Electrozone analyzer uses a measurement principle
in which particles suspended in an electrolyte flow
between two electrodes through a small orifice contained
in a glass tube. As particles pass through the orifice,
electrical pulses are generated at rates from a few
thousand to a few hundred per second, depending on flow
velocity, orifice size, and particle concentration. When
the particle concentration is kept low, individual
particles can be counted and sized. The amplitude of each
pulse is directly proportional to the volume of the
particle. By assuming the particle to be roughly
spherical, the volume can be converted to an "equivalent
spherical diameter" as is often used in sedimentation
measurements. Size distribution data obtained by
measuring particle pulses is digitized and stored in
computer memory. A schematic drawing of the particle
measuring circuit is shown in Figure 2.5.
Ground products from the stirred ball mill often had
size distributions which spanned the range from screenable
sizes to sub—sieve sizes. In all cases, the products from
the mill were carefully wet screened to capture any
material larger than 500 mesh. Two chambers, each
containing a different sized measuring orifice, were
available for sub—sieve size analysis. Each orifice
allowed acquisition of distribution data within a specific

25
I U
•
D
MANOMETER • • VACUUM
ELECTRODES ORIFICETUBE
STIRRER
ORIFICESAMPLE
8ELECTROLYTE
Figure 2.5 — Schematic of size measuring technique employedby Elzone 80-XY particle size analyzer (Davis,1986).

26
size range. Because the ground product size distributions
often occured across a broader size range than either
orifice was capable of counting, both orifice tubes were
required for complete analysis. The distribution data
from each tube was collected and stored through an on—line
link up with a Perkin Elmer mini-computer. A program was
written which combined the distributions from each tube
along with any size data which may have been obtained
through wet screening. The resulting solution was a table
showing the complete product size distribution by weight
over a chosen range of size classes. The program also
calculated a cumulative weight percent passing for each
size fraction. The complete program along with an example
of the computer generated size distribution curves appears
in Appendix A.
2.4 Torque Measurement
The torque applied to the central shaft of the batch
mill was measured to accurately define the power drawn by
the mill during grinding. The Teledyne Model A-05 torque
transducer, attached directly to the shaft, contained
strain gauges which measured torque deflection and
transmitted an output signal to an amplifier manufactured
by Brewer Engineering. The amplifier converted the analog

27
signal into a digital display of torque in inch—pounds.
The transducer also monotored rotational speed of the
shaft which was similarly displayed by the amplifier.
The displayed torque and shaft speed were used to
calculate the power applied to the shaft using the
following formula:
P = (2 $1 n) T. (5)
where
P = power input by the shaft (in—lb/min)
T = torque (in-lb.)
n = rotational Velocity (rpm).
By converting power into Kilowatts, the equation becomes
-5P = 1.182 x 10 Tn. (6)
If the specific energy of grinding, E, is defined as the
amount of energy consumed during grinding in Kwh/Ton, an
equation for specific energy can be derived from the power-
torque-relationship:

28
Pt (2 $1 n) Tt
E = ·——·—— = ——··—·——·—— (7)
W W
where
t = time (sec)
W = weight of material ground (tons).
Applying the conversions
51 ton = 9.0703 x 10 grams
and 1 hour = 3600 sec
and combining equation (5) with equation (7)
( 1.182 x 10 )(9.0703 x 10 ) Ttn
E = ——·———·——————·———·—·———·——··—————— (8)
3600 w
E = 2.978 x 10 Iäg-(9)
where
E = specific energy of grinding (kwh/ton)

29
t = time (sec)
T = torque (in—lb)
n = rotational Velocity (rpm)
w = weight of material being ground (grams).
The digital display of torque was generally constant
across the time period used for each test. Initial
readings on torque appeared slightly higher than readings
occurring later during the testing. These higher readings
can most likely be attributed to the torque sensing
equipment since they occur in the absence as well as the
presence of grinding media and material regardless of the
test conditions. Values displayed by the amplifier were _
observed regularly in 15 second intervals and recorded.
The values were numerically averaged to determine the
torque applied over the test period. This procedure is
similar to that used by SepulVeda(1982) after he
determined that the minor Variation in torque readings
could accurately be approximated by assuming a linear
relationship in torque change throughout the duration ofthe test.

30
2.5 Experimental Procedure
Initial tests on the 5—inch stirred ball mill were
conducted by charging the mill with media such that the
vessel was 50% filled by volume. An amount of coal slurry
which corresponded to 100 % filling of void spaces was
blended with the media as it was loaded in the mill. In
the tests involving very short grind times, it was
particularly critical to load the media and coal slurry so
as to obtain good blending and filling. This was
accomplished by carefully measuring the quantities of
coal, water, and media necessary for the test and then
layering the inner vessel alternately with the media,
coal, and water.
The original ball charge at 50% mill filling was
weighed to establish the general weight of media which
would be used during all subsequent tests. The ball
charge consisted of an equal mixture of 1/4-inch, "
1/8—inch, and 3/32—inch balls and weighed 3610 grams.
Rather than constantly changing the amount of the
monosized media to correspond to 50% mill filling, the
media weight for each test was held constant for all ball
sizes to allow accurate comparison of torque and energy
requirements.

31
Similarly, the original calculations on void filling at
43% solids indicated that 150 grams of coal would be an
appropriate sample size for grinding. All subsequent
tests were conducted on the same weight of material,
unless otherwise noted, reqardless of particle size or
size distribution. The amount of water used during the
testing was adjusted to achieve the desired percent solids
of the feed. No compensation was made in the weight of
media or coal to account for the increased or decreased
volume of water in the grinding chamber.
2.6 Product Sampling
The first test results were obtained by charging the
mill, grinding, and then discharging the entire mill
contents for media separation and sizing. The ground
product was then discarded and the entire process repeated
to obtain product sizing at the next time increment. This
process required extensive sample preparation and a great
deal of lab time.
To reduce the time requirements, a product sampling
technique was developed. The technique involved halting
the grinding process at various time increments and
withdrawing a sample of the product. A scoop sampler was
used to withdraw approximately 20 grams of material from

32
the mill. The withdrawn material consisted of both ground
coal slurry and media with the slurry fraction weighing 4
to 5 grams. An equal weight of clean dry media was placed
back into the mill prior to additional grinding. This
process was repeated over the entire testing period; thus,
several data points could be obtained without discharging
the mill. Great care was taken to obtain a representative
sample by withdrawing material from several areas of the
mill at each time increment.
A comparison of size analysis data obtained by totally
discharging the mill and by using the sampling technique
shows good agreement between the product distributions.
Figure 2.6 shows a comparison of cumulative percent
passing versus size for a hammer mill feed ground for one
minute. Comparison of the actual point values of these
distributions, shown in Table l, demonstrates that there
is no more than 5 percent variance in the calculated
passing values at each size increment. After only one
minute of grinding, the potential for variance in the two
product distributions should be greater than most tests
done in this research. After longer periods of time, the
mill material becomes more fluid and homogeneous and the
sample is thus more likely to be representative of theu
entire mill contents. lt is important to remove both coal
and media in order to fully account for material which may

33
**1 2r-Q •
2 2 6 6Q- E
•
lgu.
· L.C ab
<un Q
E
L"‘ —·•
'v-1H1 D
I
es(IH
IÄ E 14I ¤•• Q')._ c. eu O ¤0
·r·•L ¤"Emu Ö U
··—•;.·. ·•-•m ev 07 c
I-M E •1"* ,4:· E U
~ QJcc
U) Sm -• Q2
G)_·—• S•!‘ L)·•-1 L4
.;.» o¤ L<¤ Sl w
·•-4Lcd¤.E¤0u
©
c> o o NO U) *1 41;*1 L.
SLÖU‘[SS9d 'lUSDJSd S/\[1E'[V|ll]nQ Q

34
Q)O
8-,cdI I I I I I I
>EQ
Q.)O:cd
II:6 OOO-Q-COOOOO> I I I I I I |‘
210:Q>-,-4,-4(DO,
(OE6-*Q,:0
-4•-4,-4·-4·CDCOO _
CD hf/J _5 GJ0* D--,-4:S! CDU
>·-‘
CD .,-4,-4-4-*;(5 ••.,.,„.•.•••...•.•.
GJ,-4-4:-4Q
E-4 ,-4,-4,-4,-4E :55ct! OE!-•
C/J‘+-4
CDO N
-,-4: mwO(ß
Q) • • • • • •~
• • • • • • • • • • • • •
-,-4S-4OOgd
-,-4-,-4 t~L¤c¤N,-4,-4Q, +-*2E $.60 ct!U D-4
I
" 3%<1>·,-Icd,-6
03,-4O
cdE

35
be coated around the balls or trapped in void spaces. At
very high percent solids concentration, or during dry
grinding, it may be necessary to evaluate product size by
discharging the entire mill contents since there appears
to be severe coating of material which would be difficult
- to sample using the scoop technique.

CHAPTER 3
Experimental Results
Several operating variables have been examined in terms
of their effect on energy requirements and rate of size
reduction. These include media size, rotor speed, weight
percent solids, feed size and grinding time. Previous
investigations concentrated on extended grinding times and
very large energy inputs. The data presented in this
section represents coal grinding at grind times generally
less than 50 minutes and energy inputs below 100
kilowatt-hours per ton. For those tests conducted under
conditions of constant energy input, the time of grinding
was varied depending upon the measured torque values.
3.1 General Operating Characteristics
To establish a preliminary understanding of the energy
requirements for operating the stirred ball mill, torque
measurements were recorded under a variety of operating
conditions. In all cases, the feed coal had a natural
size distribution produced after hammer milling 1/4—inch
material. Typically, this coal was 60% passing 100 mesh
and contained 14% mineral matter. The torque
relationships are important since shaft torque is
’36

37
proportional to energy input during grinding. This data
is shown in Figures 3.1 through 3.3.
Contrary to conventional ball mill grinding, no maximum
is observed in the plot of torque vs. media load shown in
Figure 3.1. Instead, a continuous increase in torque can
be seen as media load is increased up to 100% filling (7.6
kg) at constant stirring speed. Since there is no
cascading or centrifuging of material in a stirred ball
mill, the torque is always seen to increase as the mill
load increases regardless of how that increased load is
achieved.
Figure 3.2 demonstrates the effect of increased shaft
speed on shaft torque using a constant weight of media.
It is observed that as the stirring speed increases the
torque value also increases. This relationship is true
for all ball sizes. The addition of coal to the mill has
little additional effect on the measured torque since this
extra load is only a fraction of the load created by the
grinding media. In fact, tests were conducted with up to
300 grams of coal at 43% solids with little effect on the
torque readings.
In examining the effect of ball size on measured
torque, the overall weight of material in the mill was
held constant. Figure 3.3 indicates that as the ball size
decreased the measured shaft torque also decreased. It

38
40
-1/6 u~.6ALLs-43% SOLIDS-350 RPM
30
GEEE 20DOCZOI-
10 0 WITHOUT COAL•
100% INTERSTIALFILLING
.
0 1.0 2.0 3.0 4.0 5.0 6.0 7.0 8.0
GRINDING MEDIA LOAD(kg)
Figure 3.1 — Effect of media load on torque requirement.

39
40
1/4 nu. BALLS °30
Ign
./20 AA
„ A WITH COAL
·· O WITHOUT COAL10
30
1/a1u.aALLs _ °20
°A
10”'*
Q 0
EE 30
Lu __ 3/32 1~. aAL).s3 20O „0:O 10I-
0
· 3610 GRAMS MEDIA
- 150 GRAMS COALQQ — 43 % SOLIDS
1/16 IN. BALLS20
Q 0
10 °A
Q
00 100 200 300 400 500 600 700 800 900 1000
SPEED (rpm)
Figure 3.2 - Effect of stirring speed ou torque requirememt(Mankosa, 1986).

M
—· é< CD
gg 8 8 8 2Q I-
O s-•
2 82 El
I IU"
E E 2E 3 O)
O€ N ¤
6 E»·~ OC
JJ
: 1:. 6E
2 W E;:5 J" ¤>Lu äE 2;
<Q ES
cg .1Q
S2—· 2
50O
U4-¤
U) WQw‘J-4¤§ö‘E 2 2
Gwmm Q E
QoxmO 2 u
wmmߢ")«—¢<"7$0
'nrncg
O QO
°"‘
v m 2 Q QCu
($GI‘U!) 30050;

41
appears that it is easier for the impeller to move through
the smaller balls than through the larger balls. This is
indicated by the observed fluctuations which occur on the
torque sensing equipment as well as by the noise created
during mill operation. During torque measurements using
the 1/4 —inch balls, the displayed values of torque changed
rapidly within 0.5 in—lbs of the mean. As the smaller
balls were tested, the degree of fluctuation about the
mean decreased. At the smallest size the fluctuation was
below the measurable limits of the sensing equipment. The
amount of noise produced from interaction between the
media, chamber walls and impeller followed a similar
pattern with the noise decreasing as the balls became
smaller.
3.2 Equal Energy Testing
3.2.1 Feed Percent Solids
To examine the effects of Variations in the feed
percent solids, the stirred ball mill was operated under
the conditions given in Table 2. During this series of
tests the initial weight of the coal sample remained the
same, but the amount of water was varied for each test to
achieve the desired feed slurry.

42
Table 2 - Standard Conditions for comparison of FeedPercent Solids
Sample Weight .................... 150 grams
Feed Size ........................ 60% -100 mesh
Rotor Speed ...................... 335 rpm
Media Weight ..................... 3800 grams
Media Size ....................... 1/4,1/8,3/34 mix
Coal Type ........................ Elkhorn Seam,13.7% Ash

43
The relationship between feed percent solids and
product size was investigated by grinding at solids
concentrations of 20, 43, and 60 percent by weight while
holding the energy input to the mill constant. This was
accomplished by adjusting the time of grinding based on
the measured torque on the central shaft during the
milling process. Within the range of solids
concentrations investigated, the 20% mixture required the
least amount of torque. The torque requirement increased
with an increase in solids concentration.
Figure 3.4 demonstrates the results of grinding at an
energy input of 94 kwh/ton. At this level of energy
input, the product distributions are identical with a
median size of 5.2 microns. This indicates that at low
energy levels, the grinding efficiency is unaffected by
solids concentration. The time requirements, on the other
hand, favor a higher solids concentration since it will
allow equal energy efficiency at higher mill throughput.
For example, the 60% solids mixture was ground for only 10
minutes while the 43% and 20% mixtures were ground for
14.2 and 20.5 minutes respectivly.
To further examine the effect of solids concentration,
grinding was continued with a larger energy input. Figure
3.5 shows the resulting product distributions obtained
after 280 kwh/ton of energy was input to the mill. After

44
en _ m 0*:2 z E 2
°’LU
hc ze‘·‘·
3 = Q 33
-«-4U)
O
C3 E EE 6 Q
a- C•
_' CO U) O E<1· .. C "märz:O""
L., n mu U ···‘ -¤m an
·—‘ 3wma
0°·’
¤>+-=gg
CD o.> ¤·. · CLC|Il1_ an
O3
OL
CL EU@3 q Q1
CO
CDL*3tm
E2O G OO CV') <'*<-1
I ÖU§SSECj 3,U33„J8d 8/\T§l9{f1lJ.H'1[_°)

45
W IDcn3 : E EI «—1
LL]g (E) In ä Q LL;ae
I tl gg LL(DO } 0NÜJ
Q ·r-JQ U2Ü
uO(U :5
Q 15c m Lo ai Q'Q ä =ä 6 °-• U') U') -5 :O E C -•-I C)Q Q ••
O ,.4 JJ(-U L (UL U) ,..Il 0 ';u.1 mE\
sa
=> GOCD I. O1
\x
Ö CDx,
· ·*" cg•|
U] ¤-4Ä\"Q
°°O
ä°° x '"‘cp +->xE"
S~\+-7 +.> ·«-*
‘~„_
L L) ¢-·~„_(U Q)
Ü.“‘~-__
Ed "C~:I *9 I
LÜ:0
¤.>I.:6ao•v—4G Cr-•Q Q
0 m‘_°
6-1
Iöupssed quaoaad S^11@I¤w¤3_

46
this considerably larger energy input, the 60% solids
mixture produced a product with a median particle diameter
of 7 microns and the 20% and 43% solids mixtures produced
a product with a median particle diameter of 3.8 microns.
This indicates that after an extended grinding period, the
grinding efficiency is influenced by solids concentration.
A higher solids concentration seems to adversly effect the
ability of the stirred ball mill to efficently reduce the
feed to extremely fine sizes. Again, the time of grinding
was significantly shorter for the higher percent solids
feeds.
It is interesting to note that an additional 186
kwh/ton energy input was required to further reduce the
5.2 micron product to 3.8 microns. This large amount of
additional energy which was necessary to reduce the end
product by only 1.4 microns in diameter demonstrates the
significance of a small change in the median particle size
of a ground product in the ultrafine size ranges.
3.2.2 Dry Grinding
As an extension of the investigation of feed percent
solids, the mill was charged with 150 grams of dry coal
and run using conditions similar to those used for wet
grinding. The feed consisted of the same Elkhorn seam

47
coal at 6.5% ash. The mill water jacket was used to cool
the inner vessel during the dry test since there was
considerable heating of the inner chamber. The mill was
again operated in a batch mode. There was no air sweeping
of the inner chamber during the dry grind to attempt to
remove ultrafine material.
Figure 3.6 demonstrates the product size distributions
attained for wet and dry grinding after an equal energy
input of 90 kwh/ton. The product distributions indicate
that the addition of water enhances the grinding
efficiency of the mill. A median product diameter of 8.5
microns was measured for the dry grind which compares to a
median product diameter of 5.2 microns in the wet grind.
It was apparent during this test that there may be some
error in the measured particle sizes of the dry
distribution. This is suspected since there was a heavy
coating of fine coal on the balls and central shaft. This
indicates that there may have been particle breakage
followed by melting and agglomeration of fine particles.
Since a particle agglomerate would be counted as a large
diameter particle in the size analyzer, the true particle
distribution may be misrepresented. Testing at higher
energy inputs seemed inadvisable after the results of the
initial testing.

48
U)U
"".
'3 g E gg°° ca Q .„,
4->3_Q
O ""—· I:gg U}vd --4\ 'U1-•
·O.)(U¢:mO
\u m
di 4->§ > O ¤— O
•• E äm r. 2 E L
um“ (23 Q Qwm! ··"* ::‘ E oll. " ·
& ho. GJ„ 2 ~ S
.-4 CU3 ··-<
$4¢ E Q) OO
•-Q
u Üc ¤
·•*•-¤
4:¤-4
: : (U O¤- 4->
O
a : 3ü-4BJ
I
C9
CO
0 0 0 3"‘ am
EÖUFSSQÖ Z}U83„J3d 8/\II'J,Q{I'Il1.|fIf)

49
3.2.3 Shaft Speed
By varying the belts and pullies on the power drive,
it was possible to investigate the effects of rotor speed
on grinding efficiency. The lowest attainable speed was
216 rpm and the highest speed investigated was 830 rpm.
All mill conditions were held constant during the tests
and a ball mixture was used to minimize any potential
effects of ball size. The feed consisted of Elkhorn seam
coal containing 13.8% ash and having a natural size
distribution resulting from one pass through a hammer
mill.
In Figure 3.7 the product size distributions for
grinding at 216, 521, and 830 rpm are plotted. Each
product was attained after grinding at a fixed energy
input of 63.5 kwh/ton. The test results indicate that for
low energy inputs, slower shaft speeds provide more energy
efficient grinding than faster shaft speeds. In this
particular instance, the 216 rpm test reduced the 65
micron feed to a median product diameter of 6 microns
while the products produced at 521 and 830 rpm had median
diameters of 7.4 and 9.0 microns respectively.
The relationship between shaft sppeed and median
particle diameter shown in Figure 3.8 indicates that there
is a linear relationship between the size produced and the

50
ä ä ä -L L L ä ELD -• o LU .:6-• Cu cn LL ,__,CU LO G3 S
.-O-6-4
' L+0U)
-6-6X
lo
C·•·•
O E Q)JJ N-\ UI .6-6
" 'E o UI LX(DOnngga
° ^ «»«| •«-J cn U) I5
m o .. C ~¤LD ua 63 O 0;•• ¤¤ gg E E. ’Luv E ···* CI E
IIN4
GJ\‘B 4 ""
_'_, Q,
CDU)
I¢ E 4 (D"'
EC.)c : < ·•·—4 In
4-J
g "Sö B 4 0- U
OCD
¢+-6‘+-4
EJ
I
P-
CO
G.)O O O LG (Ü *'* 5*'I bb
-I-ICr-6
ÖUIQSSQÖ IIUBCIJEICI EI/\§1Q[UI1IfI[)

51
+-¤ct?
+-JC CD
" S-•-1gp O 1;*<"•
G\ Q) 1->
C“
äO (XI -g
\ \ Q
xusuiG•!-O aä
_r_;
m .. Gengen r\ä¤gg 5.; E
ww: G li3 U
GJ U. (D Q)
:2“’ ä-I-J*4- :1FU GS ·.C .c: :
·=r CD @3¤.« .O;
Ö 3G 4-hät(Ü U
umN 1
C')
o ca co r~ co no" Q,"‘:.15bi)
. ·v·*J813lLIQ§(] Z'|,CJÜDOJd UECDBN cz.

52
shaft speed between 200 and 900 rpm at low energy inputs.
Although it appears beneficial in terms of energy
efficiency, the longer time requirements for grinding at
slower shaft speeds may be prohibitive. As can be seen in
Table 3, the grind time required at 216 rpm was over 10
times that of the 830 rpm test at equal energy input. By
extending the energy input over a longer period of time,
however, the product size was reduced by an additional 3
microns.
3.2.4 Ball Size
Product size comparisons were done using balls of 1/4-
inch, 1/8—inch, 3/32-inch, and 1/16-inch diameter at 216
rpm and 43% solids concentration. The energy input was
again held constant by adjusting the time of grinding
based on the torque values measured on the central shaft.
Since the smaller balls required less shaft torque, the
time of grinding during the tests with the small balls was
longer at equal energy input.
Figure 3.9 demonstrates the relationship between ball
size and product size distribution for grinding a coal
feed at an energy input of 90 kilowatt-hours per ton. It
is apparent from the diagram that at equal energy input
the smallest particle sizes are produced with the

53
Table 3 - Products produced at 64 kwh/ton and variedshaft speeds
Median ProductRPM Time (min) Diameter (microns)
216 23.4 6.0'
521 5.0 7.4
830 2.14 9.0

54
ID-•\"* .E E 5 5 ni ;
C C C c G') Z Q·•·• «·• _" _„ \ •
2 ä Q 3 E g> E ·— —•
>Z!j.,‘ .¤1: ···‘
Ö :.„Ö +->*" an·•-
T7
G)N.-IU}
C 4->\ ¢> G *53 Ö Oxs: O L
¤~
I " 226 · E ¤*7 LLICÜQ (D
a cu_“
ZI
Q) Cß
„ E . ‘-J ··—t n ·.__~‘
EO
: gg OCL Ü
a: ·I
C3
CG
G)S-
O O O 5O U') ~·•
¤0“LZ
ÖUFSSECI QUSOJSCI 8A'II'J,9[TIlUVlf_“)

55
1/16—inch balls. It was also found that as the media size
increased, the product size also increased. A ball
mixture consisting of equal weights of 1/8-inch,
3/32-inch, and 1/16-inch balls produced a product
distribution falling very near the average of the products
produced from the monosized media tests. Table 3 lists
the median particle sizes of the products corresponding to
each ball size after 90 kilowatt—hours per ton energy'
input as well as the grinding time required to input 90
kwh/ton.
Figure 3.10 demonstrates the product size
distributions attained when different ball sizes are used
to grind a 100x150 mesh monosized feed. In this test, the
time of grinding was held constant at 10 minutes while the
media size was varied. The size distributions of the
ground products appeared to be nearly indentical with a
median particle diameter of 8 microns. The energy input
required for grinding to this size varied with media
diameter. Again it was found that the most efficient
grinding occured when the smallest balls were used. This
test indicates that with 1/16—inch media it is possible to
reduce a feed with a median particle size of 128 microns
to a median size of 8 microns with an energy input of only
35.1 kwh/ton.
Grind times of 1 minute and 5 minutes were also

56
5 E 5E E Ü :'·¤ N Q
,, +->^·-• m O EVU·r-*0 DÄ),
vl BL,1;;..••-15/7um
G(DE
LO NC· -1-11.**:
Ujv-4
._'
E cn gc,E m E): UO4 0 ·¤
C>·—‘q-4 .,-4 L S-•~/
·|¤ E•—• L) Q.ll QD .,-4 UÜLUI E CC
.4,, ama‘*’ O':
-•-1t'¤¤’!1-mv CD QMÄ·•·> " E EB
" ¤¤ ZE1** 451U 0
1;*Ö ·P'*‘*5""
-1-JL
<1 E as;<-«+»Q—4‘4-4
mx10r-l
m
*· 2C) *"‘ gg
C> LD¤‘• gg
¤·*| .,.4nz.
ÜL|IÄSSEd ‘.}U8DJ8d 8/\‘[1E”[T]l1|T]Q

57
examined using each ball charge. In the case of these
short grind times the product size distributions produced
with the different sized media were not the same. In
Figure 3.11 a 100x150 mesh monosized feed is shown after
grinding for 1 minute. This figure shows that the finest
product distribution is produced with the larger 1/8—inch
balls. A slightly larger product is produced as the balls
become smaller. As grinding progresses to 5 minutes, the
product distributions begin to become closer together as
can be seen in Figure 3.12. This seems particularly true
in the coarser ends of the product distributions. At this
stage of grinding it is apparent that the smallest balls
produced a slightly finer product than the larger
3/32-inch and 1/8—inch balls. The 1/8—inch balls have
nearly the same product size as the 1/16—inch balls, but
the mid sized 3/32—inch balls did not grind the coal as
fine as either of the other two sizes.
At the 10 minute stage of grinding, all distributions
fall together, as was previously indicated, with a median
size of 8 microns. This series of tests, conducted on a
100x150 mesh feed, presents evidence that there is a
relationship between the rate of particle size reduction
and ball size. The tests also indicate that particle size
of the feed infuences the rate of grinding.
To examine the effect of ball size on the rate of size

58
E E 5C C C-«-n ·•-1 _"
2 Ä 3 §
t'2'U
[ -«-«<1J«•u 9 g"‘
If.:«• u ¤ lgmwé
J ¤ c O _§CLI') mu':
1 mU)
C gxO
<¤ a «-• E t. UCE- w E2IIQO , OLen
"‘ —··"{0 0 Q) E
EIDPQ"’
CU··-—•mm O:
<¤ c °'m° cu gfN wm
<¤ ¢ «—• (.0 ww
zu-‘=
Ä ·~· Q?L 0%(U .
+->C1. OLEU
JJ¤.4=J-4EG!
I•—4•—4
Ä1-1
O O Q GJc LO „-• ‘”‘
¤1** I5
bß-•-4
ÖU§SSQd IILISOJBCI 8/\I§1E{VIll1V1[) cz.

59
E 5 EC C C-:-1
ELD (D N OQ ; Q ·-<•-1 gr) +—* •D Zw-O .¤"¤1*I ·:-I Q)
P CD+.><6-4U).,..;_g'U C!)D CDLO CD EN.,.4C)4UELD-1•gi_5, Q gw
E Q 0 woI LD -:-1 L OGum 5:-:II
QD .;-4*"‘/
' L U'} E‘”... ¤"¤|••
4 ELDR Q :.,..4
O N M aos~! 4 "*_,_, -I-«cn mf
•—‘ Z5Ü} < Q) ,-.4 ::-1 cd--40 Q?
¢ E <'•"I
am—‘—·‘ cE td
ca ~1 *"Q) L:
.:1 “-•“-·E US
IN-1CO"‘cuO O D <'I PD LO *'ISD-1
ÖUILSSQCI QUQOJBCI 8/\'§lE[NlUH[)E

60
reduction, the median product diameter was traced as it
changed through a 30 minute grind time. This plot appears
in Figure 3.13. As indicated by the product
distributions, the smaller balls do not grind the 100x150
mesh monosized feed as quickly as the larger balls over
the first 3 to 4 minutes of grinding. After 3.5 minutesA
of grinding, the median particle diameter produced using
the 1/16—inch balls is the same as that produced by the
3/32—inch balls. The median diameter produced by each
ball becomes equal after 10 minutes of grinding.
3.3 Analysis of Breakage Paramaters —
To quantify the process of particle size reduction in
greater detail it is necessary to determine the breakage
paramaters which were discussed in Chapter 2. There are
several techniques which may be employed to determine the
selection and breakage functions for use in the population
balance model. Two experimental techniques involve: 1)
grinding a series of monosized feeds, and 2) using
radioactive tracers. In this investigation, monosize
feeds were prepared and tested for those size ranges which
could be prepared through screening. The values for sizes
which were below 500 mesh could not be tested and thus
were projected through techniques developed by Herbst and

61
4: 1.: _:
In O N Ö Ü Q;D J-> ••• m U;
*4 M z: «-A·•-4 •—a
E GS• .¤Q‘CG J:
o m s-GJ ·—a
>< ua >'Q Ü O ®
o ~•-• \-•E
r-• L •—<
• • 13E nn ae "' g §an 01 m N,LL M V __I
I
07 +->_I¤_-} g ¤-:5O •
_„·°_.•' _•° _" L CD
-· E°"“‘
__••‘ _•' _•°C v-4
·¤Q-1 •P1
Eg-{
__.-'° _•°° ,•° C.,-4 „,-4
: :: :cx:
L• .· U bbQ S
-•‘°•:0
O O O O O O O O O O Ö O Ö O Ö EfV M OJ *4 O O1 G I\ LD LC) V O') CU *4 :Q'! V'! 71 I'! V"! bo
·¤-4
inJS‘l9lUE”§Q ÄÜÜDOJÖ UECDSW

62
Fuerstenau (1968).
3.3.1 Selection Function
The selection functions for the screenable size
fractions were determined by plotting the feed
disappearance curves of each monosize as it was ground at
335 rpm and 43% solids using l/4—inch media. A typical
disappearance plot obtained for a series of monosized
feeds is shown in Figure 3.14. Over the time period
plotted, first order breakage kinetics were observed.
This finding has also been reported elsewhere (Sadler,
Stanley and Brooks, 1975; Herbst and Sepulveda, 1978). In
this case it was necessary to use very short grinding
times since the feed disappeared so quickly in the coarse
size range.
A steeper slope on the feed disappearance plot
indicates a higher value for Siand thus a higher rate of
size reduction. Contrary to the typical disappearance
plots presented by prior investigators, the slopes do not
continually decrease with particle size. In this case,
the rate of breakage of the largest fraction, 28x35 mesh,
does not appear to be as fast as that for the next smaller
size fraction. This observation lead to the preparation
of Figure 3.15 which demonstrates the relationship between

63
o O OÜ
° ua>< O >< EJ >< G IZ -X- >< O >< I :Q ID G ln O OON m Q WJ-?
OGL4, Q-4
v-•cbN-„-I
U23O-„-JL-
LD cd. <• u >G CD
gl
Q) u-44-J
¤ EC o••"'*-« „' Z mc:
·«-4· ·• ¤ “"
- 22;%O 2 CEG.,-4L:
I- cduua Q2:E ä'“
äg as;¢.o1CDU}
Cu ZS
I
· VJ-J„ •
o o o °°O O') "•cp"' EbbÜU§U§ElI13[j 8Z'§S [388;] }0 1U8OJ8d g:

64
S-C)
4-*CI)EC'3
~-4'U
CD•—•U-•-4
4-*S-C6Q
U)"C5.„ „ E gg'¤«-·•
L „_,
ESS U.,-4 U)E$° Z g•
66: 8 -‘·
U')Q-• U') L gCD
-6-J cCD O C;.„-• __
40.,.6···• ääQ 5 E¤-1
CD .:"‘B2-2 sv‘*·’
<:·Q L <1:\C IO 39**
ct'! CQ)··-4$-4 CD
CQ 3
I
LO4-«
° gv
UOFÄCJUTH 6125 8ÜQ>|€8«JQ gbCr-

65
feed particle size and rate of size reduction using
1/4-inch balls. This figure shows that the rate of
grinding increases as the particle size increases to a
maximum at the 35x48 mesh size class. After this maximum,
there is a decrease in grinding rate as the particle size
becomes smaller.
The selection functions for sub-sieve size fractions
were determined by plotting the known values of S against
the normalized size function as has been previously done
by Herbst and Fuerstenau (1968). Figure 3.16 shows that
the experimentally determined selection values fall along
a straight line on a log-log plot. The sub-sieve
selection values were extrapolated from the curve under
the assumption of first order breakage kinetics. The
resulting values are presented in matrix form in Appendix
B.
3.3.2 The Breakage Function
The cumulative breakage distribution functions were
estimated from a relationship between the breakage
function and the selection function presented by Herbst
and Fuerstenau (1968). The relationship is presented as
follows:

66
bbC
·»-IU}Z
Q)
EO
U)Q E
~ ä<—•
LE + Eo
gw X ~«-¤-¤
·f'\ Le. 4.>
ESEX Q)
COC; E··‘•fDL QQ -
G)Äää c> °° °°~—•·<rm -• N
U? U)
r: S3CO >CDE 3
O g S.‘ c3LO L gw"’
E3ä EO C
·-ICDO-S
LD e.>CU·r4
m mg,E:
I
$3O LD O ID •
-
•
-
• cf)
CUv‘• <—* O Q)
saC
um 'g ‘u0;10un;4 uorqoayag ¤„-I-ICu

67
where Fi is the fines production rate which can be
determined from the slope of a plot of the cumulative
fraction finer than Xiversus grinding time. Several
investigators have reported that the breakage distribution
function is normalizable for many different
materials(Herbst and Fuerstenau, 1968; Klimpel 1964;
Austin et al., 1971). This means that particles of all
sizes for a particular material will break down to the
same fractional distribution. Thus, a l0g—log plot of QJ
against the relative size Xi/%j%+qshould result in a
straight line. This type of plot, shown in Figure 3.17
did not result in a single straight line for the data
prepared in this investigation. Instead, a series of
lines can be drawn through the data points with each
successively smaller size fraction following a line which
is closer to the previous line. It is suspected that the
relationship demonstrated in Figure 3.17 can be related to
the possible inaccurate measurement of the finest sizes by
the particle size measurement technique. Nevertheless, an
assumption was made that the breakage functions for the
sub-sieve sizes were normalizable along the line produced
by the lowest experimentally determined breakage values.6
The complete breakage function is given in Appendix B.

68
an °{ g¤¤ 2 ° ~—· ‘ N 3D O ; O
U)V la I ¤ ; ID:
“E
“·¤0Q N• ·•-I‘=„
*1 E°• \E0 ·x¥°··Li~ <1 *-\-. 0••.•.r\‘\=\‘‘\
Q-:
X >\"•
\ •*.U. gg g\‘\‘°•
\'¤> S3°‘.
X > Q°•· \ •|¤|
4-* ¤>-_X GU > 'pq ·•-I CD
¤> ‘;E°°•_ ‘s‘ E p—• cg
5E "s‘ Z5 GS0 >•· \
°'. \s |°• \
:~v-I«-• .• C"}o an *1 ° Q,«-•
O:;0~r-(cz.
UOT§1OUH;{ BÖEXEBJQ S/\§T|„9[|'ll.IH']Q

CHAPTER 4
Discussion of Operating Conditions
4.1 Percent Solids
Tests conducted in this research indicate that there
is no change in coal grinding efficiency between 20 and
60% solids for energy inputs of 94 kwh/ton. This tends to
agree with the findings of Sepulveda (1980) for grinding
of several different materials between 20 and 50% solids.
For a higher specific energy input (280 kwh/ton), however,
a coarser size distribution is produced at 60% solids -
while the distributions at 20% and 43% are, once again, .
identical.
As the coal becomes finer, the surface area of the
entire mass increases. The increased surface area will
possibly result in increased adsorption of water and thus
create a highly viscous mass. Sepulveda showed, through
grinding with heavy oils, that increasing the viscosity of
the mill material is detrimental to efficient grinding.
This effect seems to apply in the case of high percent
solids as well. During high solids testing the inner
vessel walls become heavily coated with a pasty layer of
media and fine coal. This action renders the balls
motionless and thus they are unable to make contact with
69

70
fine particles and other media.
Provided the energy input is not excessive, it is
possible to reduce the time required for size reduction
* and increase mill throughput by grinding at higher solids
concentrations. This is true at 94 kwh/ton between 20
and 60% solids where the higher concentration results in a
50% reduction in residence time.
It may not be valid to assume that grinding
efficiency is independent of solids concentrations below
94 kwh/ton. For example, below 20% solids, it is expected
that fine coal particles would be effected by ·
hydrodynamics in the grinding chamber. Since the fine
coal has a specific gravity very near to that of water,
particles would seem to travel with the grinding fluid and
thus have a lower chance of impacting directly with the
balls or between the balls and the grinding chamber.
If the size or type of media changes, the conclusion
of equal energy efficiency at varying percent solids may
become invalid. Very small or light media is more likely
to be influenced by the amount of water which is added to
the mill. At very low solids concentrations, for example,
the light media may flow too easily with the mill
material.

71
4.2 Rotor Speed
The chief observation made during the examination of
various stirring speeds was that lower speeds provided
finer grinding than higher speeds at equal energy input.
The tradeoff, however, is that a significantly longer
period of grinding is necessary to achieve an equal energy
input as the shaft speed decreases. Since the minimum
allowable shaft speed in this research was 216 rpm, it is
not known to what minimum speed the ball mixture will
continue to grind with increasing efficiency. At some
point the rotor speed will become too slow to provide
enough kinetic energy for the media to'effectively shear
or crush the material being ground.
From observations of the grinding process during
numerous tests it was observed that the increased
efficiency at lower speeds may be the result of a more
fluid swirling action of the media in a lower breakage
zone. The slower speeds ground the product with much less
noise and less fluctuation in torque readings. More noise
indicates that there is increased media interaction,
increased turbulence in the rotating mass, and accelerated
mill and media wear. None of these actions contribute to
efficient grinding.
Further observation of the shaft pins indicated
that there was a parabolically—shaped grinding zone which

72
appeared in the mill at high speeds. Upon emptying the
mill after one experiment it was observed that the coating
of coal on the top stirring pin existed only on the
outside edges. For each succeeding pin below, the coating
extended closer toward the central shaft. At slower
speeds, the coating may not even appear on the uppermost
pin and the angle of the cone becomes smaller. The
majority of media and coal during slow speed tests seems
to reside in the lower portion of the mill. As the shaft
speed increases, media is thrown to a higher region in
which less contact can be made with coal particles. This
is shown schematically in Figure 26.
Other investigators (Sadler,et.al.,l974; Nguyen,l981)
have demonstrated an advantage for high shaft speed in
terms of energy efficiency. In these cases however, the
rotor speeds were varied at speeds far greater than those
tested during this research. The increase in grinding
efficiency with slower rotor speed as found in this
investigation, may indicate that there is a different
breakage process occuring between very low and very high
shaft speeds. It may be possible that when the shaft
speed increases to a particular level there is turbulent
action in the mill. Increasing the rotation to a higher
speed may cause centrifugal forces which lead to uniform

73
ID
R\\\\\\\\\& &\\\\\\\\\\§
¤ *QI III
\ ' / II ~ / II.‘~_. __„_’ II I „ I
~
\\ 1/
~I \‘ • / §I I I~
—
~
Figure 4.1 — Diagram of parabolic depression occurringin the batch mill at higher Shaft speeds.

74
circulation of media around the inner wall of the grinding
chamber. This action may change the mechanism of breakage
to one similar to low speed ranges and thus increase the
grinding efficiency.
4.3 Ball Size
Based on equal energy input, small balls produced a
finer product distribution than larger balls. This
observation is consistent with the findings of other
researchers who have found a similar relationship for
grinding of coal in attrition and stirred ball mills
(Stanczyk and Feld,l972;Herbst and Sepulveda,l978).
From simple observation of the grinding tests, one
might conclude that the energy input to the mill is being
used more effectively with smaller balls. The mill
operates with much less noise and much smaller variance in
the measured torque values when grinding with the
l/l6—inch balls. This observation indicates that there is
more uniform swirling of mill material in the grinding
chamber. For larger sized balls, there is less uniform
flow and a more noise. Energy is apparently lost to ball
motion in regions outside of the breakage zone.
Since there is a larger number of small balls than
large balls at equal weights, it is possible that

75
grinding efficiency is improved because of the increased
number of points of media contact. In addition, the
smaller interstitial spaces between the smaller diameter
balls may provide less opportunity for very fine particles
to escape contact. The probability of contact may be
related to the rate of particle breakage and is likely to
be a function of both the diameter of the media and the
average particle diameter of the feed.
It was shown during the determination of the grinding
rate constants that a 35x48 mesh feed had an initial
grinding rate which was faster than the size fractions
both immediatly above and immediately below when it was
ground using l/4-inch balls. It is not proper to assume
from this data that l/4-inch balls are optimum for the
35x48 mesh feed since a different ball size might result
in a higher breakage rate. In order to determine optimum
ball size for various feed sizes, breakage rates can be
measured using several ball sizes on different monosized
feeds. Figure 4.2 shows the feed disappearance plots for
a lOOxl5O mesh feed ground with varying media size. Closer
evaluation of Figure 4.2 reveals that the 1/8-inch balls
provide a faster rate of size reduction than l/l6—inch,
and l/4-inch balls. This relationship is more easily seen
in the plot of the breakage rate function vs. ball
diameter shown in Figure 4.3. Apparently, ball size is

76
C C ec2 2 E *5·•·~
„ E. 2N 0 N E1 <1 -x- Q,—· <*· Q 1 2§ « •• °"‘
.:><GJE
I Qu
G -•LOI-«
><
3•-•LQ L,
m N O2 E
‘ "“.E-• O U) ww
IQO Q) +->Q>LU] Qwq
Emu -5 "";*vg;) C ¤.UßU- '•"* CD,-«E ää
° ¤> ;„E ¤>:s•*'* CLOI- ¤.·«-4
EV;.,.l$um
LD¤ -x- <1
“fEE2 S32
I
Nq• 4
c o o fbO M
-• _„_,«-a · CN
ÖU§U§9LU8H SZIQS D88:_{ }0 1U80•JSd

77
lf] .s N ;
Q +->GJEcf
Eüf Z¤ E
2“°
2·•-• m U)Ev-• C s.:QD L) Q)L G) uu C >mg «-• •«-1mm -
¤"' ¤> - Eä 4->
Ü-6-».:1
ä <+-«(Uvr ·•—• Ea o ¤ g
•—1
"' 22CD
a CD E2 §6 :2
u0*:di
° äCU CD LD V CU ~·• CD ID V CU O w~·• -• ~·-• -• o o o o E
UO§Z}3U|'l;] S19};-| 8ÖQ>|Q8«JQ

78
important to the initial rate of particle size reduction.
Particles which are larger than a specific size (35x48
mesh in the case of 1/4 inch balls) may not be easily
broken because they are not being contacted in the same
manner in which a smaller particle is being contacted.
Tracking the median particle size as it changes over
time, as was done in Figure 3.13, further demonstrates
that there is a relationship between the rate of grinding
of a product and the size of the media. Although the
initial rates of size reduction using the 1/16 and
3/32—inch balls was less than that of the 1/8—inch balls,
the products eventually became equal in size indicating
that the long term grinding rate becomes equal after 10
minutes. This indication however, may not be valid since
subsequent testing revealed that some fine material may
not have been accounted for in the sizing distributions
after long periods of grinding.
Careful examination of Figure 3.13 shows that size
reduction begins immediately for the 1/8-inch and 3/32
inch media and continues at a constant rate until roughly
5 minutes of grinding. The 1/16¥inch balls do not begin
rapid size reduction until nearly 45 seconds after
beginning the milling process. After that time, size
reduction occurs at a very rapid pace until it slows at 5
minutes with the other balls. The rate of size reduction

79
of the median particle size appears to be greater for the
smaller balls than for the larger balls in the range of
100 to 10 microns. This is likely to result from the
ability of the smaller balls to contact coal particles
when larger balls cannot as was previously discussed.
4.4 Energy—Size Relationship
The results of most of the grinding tests presented
in the preceeding chapters can be represented on a single
log-log plot in terms of specific energy input vs. median
particle diameter of the product. Herbst and Sepulveda
(1978) have previously shown that stirred ball mill
grinding can be represented by Charles Equation. By
assuming that the feed size is much larger than the
resulting product size, this equation reduces to the
following form·
E=A<dp>'°‘
<11>l
where E is the specific energy input, A is the Charles
Constant, o< is the slope of the equation when plotted
on l0g—log paper, and dp is the median product size.
A plot of Charles Equation for the data collected in
this research appears in Figure 4.4. Through linear

SO ‘
1000
500CO
-6->\.:3 „.¥
>ZCD
E 100 CCLU
2 OO„_ 50-«-1UGJQ.U)
1010 50 100
Median Product Diameter, Microns
Figure 4.4 — Charles Law plot for stirred ball milling ofElkhorn seam coal.

81
regression analysis, the Charles constant was determined
to be 5896 and the slope was 2.33. These values are near
those reported for stirred ball mill grinding of Lower
Freeport and Montana Rosebud coal by Herbst and Sepulveda
(1978). As was previously reported, it appears to be more
difficult to grind coal in the stirred ball milling
process than it is to grind other industrial materials.
It may be possible that the tendency for coal to
plastically deform makes it more difficult to grind than
harder, more brittle materials.
Sepulveda (1980) concluded that although there is
some minor variation in grinding efficiency which can be
attributed to the operating characteristics in the mill,
stirred ball mill behavior is to a good first
approximation only dependent on the energy input per unit
mass and not the manner in which the energy is input. The
data presented in Figure 4.4 seems to indicate that the
effect of mill operating conditions may infact be more
pronounced than was previously reported by Sepulveda. The
three darkened data points which tend away from the
straight line plot result from the tests of the influence
of shaft speed at equal energy input. As the shaft speed.
increased, the product particle size also increased. This
relationship seems to indicate that if all the plotted
. points on the Charles plot were run at a higher speed the

82
line would be shifted to the right effectively raising the
value of the Charles constant. Coincidentally, all of the
data points available for plotting the energy-size
relationship were obtained while milling at 335 rpm.
On the lower portion of the graph, three points are
plotted which lie in a vertical progression. These points
demonstrate the difference in energy required to produce a
12 micron product by varying the media size. Again, there
may be a slight change in the movement of the Charles plot
depending on the size of the media used in grinding.

CHAPTER 5
Grinding Simulation
The population balance model, described in Chapter l,
can be symbolically expressed as follows:
i—ldlm1<t>Hl'"'‘°'‘'‘" =‘dt
jtl
where S5 and Bqj are experimentally determined parameters
defined as the selection function and breakage function
respectively. Although the above equation has no analytical
solution, it can be simplified to one with an exact solution
if Si and Bij are assumed to be independent of changes in
size distribution in the mill. Under these circumstances,
the size distribution occuring after one breakage event can
be viewed as the feed distribution for the following
breakage event and so-forth. The differential mass balance
equation can thus be solved numerically through matrix
multiplication and computer iteration.
The Crude Euler technique has been used to solve the
population balance equation for stirred ball mill grinding
of coal. The numerical expression for this technique is as
follows:
Yi ‘ Y1-1=^X f(Xi—l ·Y1-1)
83

84
A computer program was written to compute the
particle size distribution resulting from stirred ball
mill grinding of coal when given an initial feed size
distribution and a grinding time. Input data consisted of
experimentally determined selection and breakage functions
‘as described in Chapter 3.
Over very short grinding periods, the computer model
was found to accurately predict the product particle size
distribution of the coarse size classes. In the fine
sizes however, there is a slight deviation from the
experimentally determined product distribution. The model
predicts that a larger quantity of material will be broken
out of the finer size range than was actually measured by
the particle size analyzer. This is demonstrated in
Figure 5.1 after only 1-minute of grinding. Figure 5.2
shows that after a longer grinding time, 5- minutes, the
difference in computed and experimentally determined size
distributions becomes more pronounced.
The increase in product fineness predicted by the
computer model after 1-minute may in fact be more
representative of the true product distribution than the
experimentally determined distribution. The computer
generated distribution indicates that there is a
A possibility that fine particles are not being counted in
the product measuring process. This error is likely since

85
it was not possible to obtain a single orifice tube for
use in the size analyzer which was capable of detecting
the entire particle distribution in the product,
particularly in the finest size ranges.
Because the feed particles disappear so quickly in
the stirred milling process it was expected that the
computer model would begin to deviate from experimentally
determined size data after short grinding times. As has
been observed in the modeling of ball mill grinding, the
first order assumption for breakage kinetics seems to
apply over short grind times but to become invalid after
longer grind times. In the case of stirred ball milling,
the rate of initial size reduction is very rapid and thus
non-linear breakage seems to occur very early in the
grinding process. Non-linearity can be associated with
the fact that the size—discretized selection functions are
not time independent. In addition, overestimation of
product fineness resulted from prediction of the particle
breakage rates for the very small size classes based on
the measured values for large particles.
A complete list of the computer program, written in
basic, is included in Appendix C.

S6
•·—•t¤ .
C 4-: :°·‘u :E _„ .+1 .¤ ;
L. U g3+ c. :>< ¤* Z
LU
‘T5
"UCCD·•·*4->S-«Obb
- ··-4C UG)—¤·—•
(D4->E U) S-«'Z
E I"• ua'; O CELw O „- Cbl Q} +4 Uv) C€v—4ELOBQC·¤—•f'7I"7 #:5|·—('¤<T O cg¤ L 4-::..L) CCD
.,-4 Q)-:->-» 2 E:CD äm
Q C1-1 N ><O• -r··1·••
.°. ¤: °€• '—I
CLI • \® L.) Op•-,-1 (DCD•
·«-J--JE ;”~=VU ¤.<1>CL ENQ.-:
C_)U)
I
#
LG
G)S-•
+4 IJbb
<> 21-1
ÖUI§SSEd ÜLUSOJSCI 8A{Z}E[Hl1IÜQ
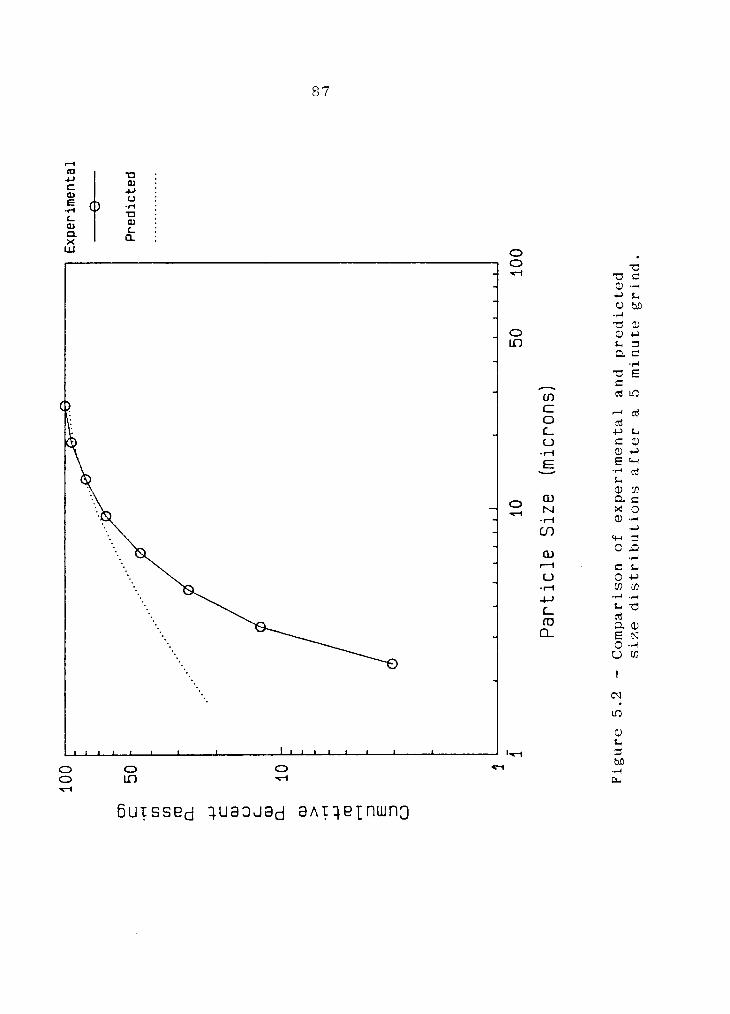
87
r-1B%
¤ rc U 1um
"‘° :E U .
.,-4"-‘
ÄL U Zan
‘”:Q L .
>< Ü- ZLu O2
.2¤.>·-1+-> L.0 am
·:-1
·¤ 0C) Q).;LO L. :
:1:·:-1
·¤ EL-L ¤'eur:u (D
E E -1 cd1 O :6· L +» L.•* L1 : cu
.,-4E
.: ,.‘CD Q.:$.2
E3Q)
1*** c L.·. LJ 0+-
; -:-1 U') U'}_‘_) ·:-1.-1L
e m .0.0CL
äg
a O
LD0L.
Iq—4 3
0 0 0 «=—. ff0 LO =-1 QQ-I
ÖUTQSSE.;1 I],U3I]L|Bd 3/\T§]E’[VllUNQ

CHAPTER 6
General Conclusions and Suggestions for Future Work
6.1 Conclusions
1. Stirred ball milling was shown to be effective in
producing fine coal products with a median size
between 3.8 and 10 microns.
2. A scoop sampling technique was shown to accurately
represent the product size distribution when
compaired with fully dicharging the mill contents.
3. Variations in slurry percent solids between 20 and
43% were found to have no effect on grinding
efficiency for energy inputs up to 280 kwh/ton.
Below 94 kwh/ton, there was no effect on grinding
efficiency between 20% and 60% solids.
4. Between 840 and 216 rpm, the grinding efficiency of
the stirred milling process was found to increase
with decreasing shaft speed.
5. Tests using monosized ball feeds of 1/4", 1/8",
3/32" and 1/16" diameter showed increasing grinding
efficiency as ball size decreased.
6. The energy required for particle size reduction was
found to be closly approximated by Charles Equation
but dependent on operating characteristics of the
88

89
mill for particle grinding to 5 microns.
7. Initial rate of particle breakage was shown to be
dependent on the relative size of the feed particles
and the media diameter.
8. A computer model of the breakage process, using the
population balance approach, showed good predictivel
capability at very short grind times but deviated
from experimental data after 5 minutes.
6.2 Recommendations
Based on the observations and data obtained in this
investigation, the following are areas recommended for
future research:
1. Since it is desirable to achieve ultrafine product
sizes at minimal cost, additional research should be
conducted to determine the optimum combination of
operating conditions for minimizing energy
consumption.
'2. Grinding test should be conducted using particle
dispersion agents to determine if it is feasible to
reduce the viscosity effect seen at high percent
solids. Such studies could allow lower mill
residence times and higher throughput levels.
3. Studies should be conducted to determine the amount

90
of media wear which occurs in the milling process.
4. The effect of different ball materials should be
investigated as a possible means for reducing mill
energy requirements while achieving fine particle
distributions.
5. The observed relationship between ball size and
particle size in determing the initial rate of coal
breakage should be further quantified through
additional grinding of monosized material. The
effect of ball mixtures should also be investigated
using monosized feeds.
6. Additional studies should be conducted to describe
the mechanism of particle breakage at Very high and
Very low shaft speeds. This work could include the
effects of Variations in the design of the impellerand the chamber walls. ’7. Continuous studies, and large scale studies should
be conducted to verify the observations made using
the small batch mill constructed for this research. ‘
The focus of this additional work should be to
determine the potential for practical application on
and industrial scale.

REFERENCES
' 9 l

92
REFERENCES
Atlantic Research Corporation, 1984. Arc-Coal Coal-WaterFuel, Information Circular 0584, 5390 CherokeeAvenue, Alexandria, Virginia 22312.
Austin, LAL, 1973, "Understanding Ball Mill Sizing",Ind, Eng. Chem. Process Des, Deyelop,, vol. 12, no. 2,p. 121.
Bond, F.C., 1952. "Third Theory of Communition," Trans,AIME, vol. 193, p. 484.
Broadbent, S.R. and Calcott, TLG., 1956. "Coal BreakageProcess - 1 and 2f'Q, Inst, Fuel, vol. 29, p. 524.
Broadbent, S.R. and Calcott, T., 1956. "A Matrix Analysis ofProcesses Involving Particle Assemblies," Phil, Trans,Soc, Lond, (A), vol. 249, p. 99.
Brown, M.D., Adel, G.T. and Yoon, R.H., 1984. "A LaboratoryStirred Ball Mill For Fine Grinding of Coal," 3rdAnnual Collegiate Assoc. for Mining Engrg. Education,Lexington, KY, October 2-4.
Davies,E.G„ Collins,E.W.and Feld,I.Lg l973,"Large-Scale Continuous Attrition Grinding of Coarse Kaolin",USBM R, I, 7771.
Davis,E.G., Hansen, J.P. and Sullivan, G.V. in P.Somasundaran,ed., Fine Particles Processing, vol. 1,AIME, New York, 1980, p. 74.
Epstein, B., 1947, "The Mathematical Description of CertainBreakage Mechanisms Leading to the Logarithmico-NormalDistribution", Q, Frank. lnst,, vol 244, p. 471.
Feld, IA„, McVay, TAL, Gilmore, HA„ and Clemmons, B.H„1960, "Paper—Coating Clay from Coarse Kaolin by a NewAttrition—Grinding Process", USBM R, I. 5697.
Gardner, R.P„ Austin, LAL and Walker, PAL, Jr„ 1961,“A
Phenomenological Approach to the Batch Grinding ofCoals", Special Research Report Submitted to the CoalResearch Board of the Commonwealth of Pennsylvania,Number SR-23.
Herbst, JLA„ 1971, Batch Ball Mill Simulation: An Approachfor Wet Systems", D.Eng. Dissertation, University ofCalifornia, Berkeley, California.

93
Herbst,J.A.and Fuerstenau,D.W„ 1968,"The Zero OrderProduction of Fine Sizes in Comminution and itsImplications in Simulation", AlME Trans., vol. 241,December, p.538.
Herbst, J.A., Grandy, G.A. and Mika, T.S., 1971, "On theDevelopment and Use of Lumped Parameter Model forcontinuous Open- and Closed-Circuit Grinding Systems",Trans. IHM, vol. 80, p. Cl93.
Herbst, J;A. and Sepulveda, J.L. 1978, Fundamentals ofFine and Ultrafine Grinding in a Stirred Ball Mill",Proceedings og International Powderand Bulk Solids Handling, pp. 452-470.
Hukki, R., 1961. "Proposal for a Solominic SettlementBetween the Theories of von Rittinger, Kick and Bond,"Trans, AIMH, vol.220, p.403.
Kick, F., 1885. "Das Gesets der Proportionalen WinderStande und Seine Anwendunger," Arthur Felix Leipzig
Kim, JJL, 1974, "A Normalized Model for Wet Batch BallMilling", PhJL Dissertation, University of Utah, SaltLake City, Utah.
Klimpel, R„ Pomder Technology, 32, (1982) 267.
Reid, K., 1965. "A Solution to the Batch Grinding Equation,“Chemical Hhgrg. §ci,, vol. 20, p.953.
Sadler, L.Y., lll, Stanley, D.A. and Brooks, D.R., 1975,"Attrition Mill Operating Characteristics", PowderTechnology, vol. 12, p. 19.
Sepulveda, JJ„, 1981, "A Detailed Study on Stirred BallMill Grinding," PhJL Thesis, Department of Metallurgyand Metallurgical Engineering, University of Utah,Salt Lake City, Utah.
Siddique, M„ 1977.“A
Kinetic Approach to Ball Mill sca1é—up for Dry and Wet Systems," M.S.Thesis, Dept.Mining, Metalurgical and Fuels Engrg, Univ. of Utah,Salt Lake City, Utah.
· Stanczyk, M.H. and Feld, I.L., 1963, "Continuous AttritionGrinding of Coarse Kaolin. Part I. Open-CircuitTests", HSHH_R, I, 6327, 28 pp.

94
Stanczyk, M.H. and Feld, I.L., 1965, "Continuous AttritionGrinding of Coarse Kaolin. Part II. Closed—CircuitTests", QSBM R. I, 6694.
Stanczyk, M.H. and Feld, I.L., 1968, "Investigation ofOperating Variables in the Attrition Grinding Process",USBM R. I, 7168.
Stanczyk, M.H. and Feld, I.L., 1972, "Ultrafine Grinding ofSeveral Industrial Minerals by the Attrition—GrindingProcess", QSBM R, I, 7641.
Stanley, D.A., Sadler, L.Y., III, Brooks, D.R. and Schwartz,M.A., 1974, "Attrition Milling of Ceramic Oxides",Ceramic Bulletin, vol. 53, no. 11, p. 813.
Szegvari, A., 1956, “Treatment of Liquid Systems andApparatus Therefor", U.S. Patent 2,764,359.

APPEND I X A
95

96
PROGRAM FOR BLENDING SIZE DISTRIBUTION DATAMICHEAL D. BROWNAPRIL 1984
DIMENSION P(30),RETAN(30),PASS(31)OPEN (1,FILE='INPUTWN=0DO 17 J=1,20P(J)=0
17 CONTINUEREAD(1,*)(P(I),I=1,5)
14 CONTINUEREAD(1,*)WGHT,TSIZE,NCLASS,NUMBRWRITE(*,11)NCLASS,NUMBR
11 FORMAT(5X,'DISTRIBUTION FROM CLASS ',I2,' TO CLASS ',I2I=NCLASSOLDY=1.0
15 CONTINUEREAD(1,*,END=50)X,YIF(X.GE.TSIZE) GOTO 100IF(I-NUMBR) 202,203,204
203 PRINT*,'THERE IS SOME AMOUNT OF MATERIAL PASSING THE& SMALLEST SCREEN SIZE IN THE PREVIOUS DISTRIBUTION.& YOU SHOULD DEFINE A WIDER RANGE OF SIZESH
204 CONTINUE202 CONTINUE
WRITE(*,20l)I,TSIZE201 FORMAT(2X,'CLASS ',I2,' =+',F6.2,' MICRONS')
TSIZE=TSIZE/1.4142I=I+1
100 CONTINUEDR.Y=1 SOBY=Y/100.0PCT=OLDY-YP(I)=PCT*WGHT+P(I)OLDY=YIF(I.LE.NUMBR) GOTO 15
50 CONTINUEN=N+1IF(N.EQ.2) GOTO 300CLOSE (1)OPEN(1,FILE='PUTIN°)GOTO 14
300 CONTINUETOTAL=0DO 110 I=1,NUMBRTOTAL=TOTAL+P(I)
110 CONTINUEl
TRETAN=0

97
DO 120 I=1,NUMBRRETAN(I)=P(I)/TOTAL*100TRETAN=TRETAN+TRETAN(I)PASS(I)=100.0—TRETAN
120 CONTINUEWRITE(*,130)
130 FORMAT(/3X,'SIZE CLASS',3X,‘WEIGHT',3X,'% RETAINED',&3X,'CUM % PASSING')
DO 200 M=l,NUMBRWRITE(*,140)M,P(M),RETAN(M),PASS(M)
140 FORMAT(6X,I2,SX,F8.2,3X,F8.2,5X,F8.2)200 CONTINUE

Q
U)
W'0~
¢ • -0
•¤| • ¤
¤ ¤•
u• • •
n•
¤• • • • •
n • • • •¤
• • • • •n
• n ¤• •
n• • n ¤
• • •n ¤ ¤
•¤
• • • •
• 3* I• Ü I I Ü ¤• I I I II I I I I I ¤
U1 $1 • • • • • •n
• • • •¤
•n
• • • •| | Q
• • • • • • • • •n n
• n • • • • •¤
• • • n--Q•-• 0~ • I I I I I I ·o~ll ¤ I I I Il
•
E ¤ l I I I I I I I•
C• I I I I ¤
In • ¤ • ¤ ¤ • • n n n • • • • « •~
nl I I I I I I I I • • • • • • • • • • • • • ‘• • ¤ • • ¤ • • ¤42
• I I I I I IU ¤
*I I I I I I I I I
•
¤ I I I I I•
I ¤ I I I I I I I I I I•
Q Q--• • • • • • •
¤• • •
¤•
n n n I I | I |• • • •
u• •
n• • • • • u ¤
• •n n
•¤—-Q
L I• I I I I I I I I I I
•x
§ • E I I I I I U II I I I I I I I I I I I I ¤• I I I I I I
•
gl « • ¤ •¤
• ¤ • • • • • ¤ ¤ • • I I I I I I I I I I I I • I • • • • • • • • • • • • • « ¤ • • ¤ •
I ¤ K I I I I I I n
D ¤ I I I I I I I I I I I I I ¤•-1 • K I I I I I I
•
O ~I I I I I I I I I I I I I I S
•
n• •
¤ 1 n u• • • • • •
I I | | I | I I n•
u• • • n
• • • • • n• •
n• • •—·@
f\•
I I I I I I I I I I I I I I I•y\
•-• • I I I I I I I I ¤M
• I I I I I I I I I I I I I I I•
·•— • I I I I I I I I•
ga n ¤• • • • ¤ • • • • • • • I I I I I I I I I I I I I I I 1 n ¤ • • u • ¤ • « • • • • ¤ • • • • n
E• x I I I V I I I I
•
ll ¤ I I I I I I I I I I I I I I I I I ¤L '
I I I I I I I I ull
• I I I I I I I I I I I I I I I I I K n••„ ©—· • •
n•
¤• • • • •
ul I I I I I I I I | •¤
• • • •n
• • • • • • • • • •—-Q
§ ~O• I I I I I I I I I I I I I I I I I I I •©
-¤-• • I I I I I I I I I I •
2• I I I I I I I I I I I I I I I I I I I
— •• I I I I I I I I I I
•• • n • • u • • • • n n • I I I I I I I I I I I I I I I I I I I I
~• • u • • n • n • • ¤ • • • • •
In h U I I I I I I I 1 I I ¤D
• I I I I I I I I I I I I I I I I I I I I I•
n I I I I I I I I I I•
Ih • I I I I I I I I I I I I I I I I I I I I I•
Q;@—~
¤• • • •
¤•
¤ ¤•
I I I I I I I I I I•
¤ n • • • •¤ n
• •¤
• •¤ •-——()
I4 H7 ¤ I I I I I I I I I I I I I I I I I I I I I I 8 •g')«•·• • I I I I I I I I I I I I ¤In • I I ! I I I I I I I I I I I I I I I I I I I I I
•
u I I I I I I I I P I I I•
L• • • ¤ ¤
• ¤ ¤ •* I I I I I I I I I I I I I I I I I I I I I I I I • • n • u ¤ u • n • • • ¤ • •
Ih• I I I I I I I I I I I I ¤
•)~
I I I I I I I I I I I I I I I I I I I I I I I I I•
Ib~
I I I I I I ¤ I I I I I•
G• Ü I I I I I I I I I I I I I I I I I I I I I I I I I
•
¢¤ @--•
¤•
n•
n•
I I I I I I I I I I I I I 1• • • n • • • • •
¤• • •—~(3
--1 V• I I I I I I I I I I I I I I I I I I I I I I I I I I I
•12'
2• I I I I I I I I I I I I I I
••
8 I I I I I I I I I I I I I I I I I I I I I I I I I I I nI•- • I I I I I I I I I I I I I I nO
•¤
• • ¤ • •I I I I I I I I I I I I I I I I I I I I I I I I I I I I ~
• ¤ • u • •~
• ¤ • • • •• I I I I I I I I I I I I I I
•
C I I I I I I I I I I I I I I I I I I I I I I I I I I I I I I•
C; I I I I I I I I I I I I I I I I E u>¤ • I I I I I I I I I I I I I I I I I I I I I I I I I I I I I I ¤; (b--
• • •lt I I I I I I I I I I I I I I I ¤
~n
• •¤
• •¤
• ••—(J
F'!• I I I I I I I I I I I I I I I I I I I I I I I I I I I I I I I I ‘I"°l• I I I I I I I I I I I I I I I U
•
I B I I I I I I I I I I I I I I I I I I I I I I I I I I I I I I I I I I « ,I I I I I I I I I I I I I I I I I I I ~¤ • • • I I I I I I I I I I I I I I I I I I I I I I I I I I I I I I I I I I I • ¤ u ¤
• n n • « •
I K I I I I I'
I I I I I I I I I I I I l•
G ~ I I I I I I I I I I I I I I I I I I I I I I I I I I I I I I I I I I I I I I• • 1 I I I I I I I I I I I I I I I I I I
•
Q I I I I I I I I I I I I I I I I I I I I I I I I I I I I I I I I I I I I I I I•
Q-, ul I I I I I I I I I I I I I I I I I I • • ¤ ¤ • • ¤ q--3
¤ F4•
I I I I I I I I I I I I I I I I I I I I I I I I I I I I I I I I I I I I I I •(°“4O
-I I I I I I I I I I I I I I I I I I I •
G• I I I I I I I I I I I I I I I I I I I I I I I I I I I I I I I I I I • I I I S
•• I I I I I I I I I I I I I I I I I I I I ¤
¤~ I I I I E I I I I I I I I I I I I I I I I I I I I I I I I I I I I I I I I I I I I• • • • •
~•
~U ¤ I I I I I I I I I I I I I I I I I I I I
•
·•| I I I I I I I I I I I I I I I I I I I I I I I I I I I I I I I I I I I I I I I I Ü 'N I I I I I I I I I I I I I I I I I I I I I I ¤2 I I I I I I I I I I I I I I I I I I I I I I I I I I I I I I I I I I I I I I I I I I U I ¤
Q-. •1 I I I I I I I I I I I I I I'
I I I I I I • • I-.©•-1 I I I I I I I I I I I I I I I I I I I I I I I I I I I I I I I I I I I I I I I I I I I I ••-I
l I I I I I I I I I I I I I I I I I I I I I I~
I I I I I I I I I I I I I I I I I I I I I I I I I I I I I I I I I I I I I I I I I I I I ••-• ¤ I I I I I I I I I I I I I I I I I I I I I I I •
• ¤ I I I I I I I I I I I I I I I I I I I I I I I I I I I I I I I I I I I I I I I I I I Ü I • ¤~•
I I I I I I I I I I I I I I I I I I I I I I I•
• I I I I I I I I I I I I I I I I I I I I I I I I I I I I I I I I I I I I I I I I I I I I I ~• I I I I I I I I I I I I I I I I I I I I I I I ¤• I I I I I I I I I I I I I I Z I I I I I I I I I I I I I I I I I I I I I Z I I I I I I I I I •
$--U I I I I I I I I I I I I I I I I I J I I I I I —·©
·\ .«~ fx /\ /'x /x /\ fx /'\ .·x»^\ rx "~ ·\ /‘ /'~ /-. fx .^ /2 .«·\ /·. xx »~ -'—."* fx zx «— /x .·’~ ·~
\•°I€'f'll‘~ll‘~If'~Il‘~I¢'7I47€}l‘·l\D©‘!'¢€f'7€$I\f\I}¢'~l*O$€l"}v1$€l"ik7}Il'}l’Il‘~II'1©•«I\~O~QO~QINL;] 0~©•-•l“~4I"I?If7~Qf\10~•-·~f~I¤‘IflY\®Ql‘4l"II47f\¤~•-•¤'~00~-•¤'N¢L'I~¢O~!N€©¤'®l'\I\•-«~Q•-•~0(‘e®
•• •-n •-•I*~I¢#ll*«I¢'~4¢‘~If*Il‘*4l‘*4l*4I'~I¢"'Il’II'I(’)\"il'11'1I'¤'*1'i‘?I¢1I„flIl'ILf1£~¢~0I\f\I\f\I$0~0~0~¢Q•-«•«t‘~4I‘~4l’!t‘1
In
E- >< ¢$®¢l‘~Il‘~lI\&"|l'!I4'I¢I\Q0~1'?©I«'I©CDK'1!‘~Il*l*~40~—•Q*V'h7~0~0l'1<'1~Q(’lf'¤®¢"!W'f·J¢•-«<>v'!l'§('7¢Ql:g
hll'¤I&*~Jl“~I("n!"}l')W'*!'W'I-7Ie'I€I\I\I\Za®0~0~Q~0~0~0~®¤2I\I'\~¤@I4'|V'<?l"1¢")¢\II.‘·A!'\4¢‘I•·¤•-«•-«w<•-•

Q.
U'!
•| . I•©
•-1« I
*
nee• I I I I I
•
O• I I ~,• n I I I I I 1 • • • • • • • ¤ • • • ¤ • n • • • • • ¤ u • • ¤ • • • • • • ¤ • ¤ ¤ n • u ¤ • • « ¤• I I I I ¤
F4 II I I I I I Iu
I I I I I•
•I I I I I I I I ~Q-- I I I I Z • I n • n • • n • • • ¤ • ¤ • • • • ¤ • n ¤ • • u • • n n • u • • • •
ntr•I I I I I I I I | ¤O~
UI• I I I I Ü
•
•—• ul I I I I I I I I I uGJ ¤ I I I I Il
•
: n I I I I I I I I I I I ~ ¤ n • • n • • • • • u ¤ n • n n • • • 1 • • • n • • • • n • u u • ¤ • •C I I I I I I I
•
fu•
I I I I I I I‘
I I I In
.C• I I I I I I
•
U • I I I I I I I I I I I I Ü ~Q-. | I I I I I ¤
• • u• •
u ¤ ¤• • •
u• •
¤ n• • • • • • • •
¤ n• • 1 n
¤I I I I I I I I I I I IIO• I I I I I I 1•
L•I I I I I I I I I I I I I I
•
4•— •I I I I I I I
•
~I I I I I I I I l I I l I I1 ¤
• • • • • •n
•n n u ¤ ¤ u
• n• • • u
•¤ n
• • •¤
• • • • n
n I I I I I I I•
BJ ¤ I I I I I I I I I I I I I I I•
E•
I I I I I I I Ü ¤
D•
I I I I I I I I I I I I I I I I ¤
-1 I I I I I I I I • ¤ u • • u • • • • • • • ¤ • • • • u • • • • ¤ n
Y\ •I I I I I I I I I I I I I I I I ¤I\
I I I I I I I I U•
•I I I I I I I I I I I I I I I I I
¤
GI 'I I I I I I I I
•
D I I I I I I I I I I I I I I I I I I 3 I ¤ • n • • • • • • • u • • • • n u • n • • • n ¤ • • • • n-•¤ • I I I I I I I I I
•
•J •II I I I I I I I I I I I I I I I I ~
G ¤ I I I I I I I I I ¤•-• • I I I I I I I I I I I I I I I I I I U
I I I I I I I I \ ¤ • • • u • ¤ • • • • • • • • • • • • • ¤• • • n • n
*0•I
I I I I I I I I I I I I I I I I I I‘@
D v I I I I I I I I I•
I.) ¤ I I I I I I I I I I I I I I I I I I I Ü•
~I I I I I I I I I I
•
III ¤ I I I I I I I I I I 'D ¤ I I I I I I I I I I I I I I I I I I I I Ü
•
¤ I I I I I I I I I I•
Ih ¤ I I I I I I I I I I I I I I I I I I I I I•
I-! M7 ¤| I I I I I I I I I I I I I I I I I I I I S•I|Ü
-1~
I I'
I I I I I I I I•
III • I I I I I I I I I I I I I I I I I I I l I I•
l I I I I I I I I I I II I I I I I I I I I I I I I I I I ' I I I I 3 • • • • • ¤ • • • ¤ ¤ ¤ • • • ¤ • ¤ • • • • • • u
gg ¤ I I I I I I I I I I I•
¢* • I I I L I I I I I I I I I I I I I I I I I I I•
ID•
I I I I I I I I I I I ¤
Q ¤ I I I I I I I I I I I I I I I I I I I I I I I•
VB G-· I I I I I I I I I | | 1• u ¤
•¤ ¤ n
•n
•¤
• •¤
•¤
• •
-
• • • •—-@
-•-< V •I I I I I I I I I I I I I I I I I I I I I I I I•W'
I I I I I I I I I I I I '•I I I I I I I I I I I I I I I I I I I I I I I I Q
•
G; • I I I I I I I I I I I I•
Q • I I I I I I I I I I I I I I I I I I I I I I I I I • • • ¤ • • ¤ ¤ • • • n • • • • • u ¤ • • • •
~ I I ' I I I I I I I I I•
A:• I I I I I I I I I I I I I I I I I I I I I I I I I l
•
C; • I I I I I I I I I I I I I•
IB • I I I I I I I I I I I I I I I I I I I I I I I I I I‘
L Q-. | 1 I I I I I I I I I I I•
~• • • • • • • • • ¤ ¤ • • ¤ ¤
• • n q-lg
LSI Y') ¤| I I I I I I I I I I I I I I I I I I I I I I I I I B•l'7
¤ I I I I I I I I I I I I I•
¤ I I I I I I l I I I I I I I I I I I I I I I I I I I I 'I I I I I I I I I I I I I I
_¤
¤ I I I I I I I ' I I I I I I I I I I I I I I I I I I I I•
~n • • ¤ • • • • • • • u
I I I I I I I I I I I I I I II I I I I I I I I I I I I I I I I I I I I I I I I I I I I
•
¤ ¤ I I I I I I I I I I I I I I
I I I J I I I I I I I I I I I E I I I I I I I I I I I I II ' I I I I I I I I I I I I t • ¤ • • • • • • n n • • n • • • -1;
¤ PQ vl I I I I I I I I I I I I I I I I I I I I I I I I I I I I I ¤F~I
O ¤ I 1 I I I I I I I I I I I I I¤I I I I I I I I I I I I I I I I I I I I I I I I I I I I I I B
•
•I I I I I I I I I I I I I I I '•• n I I I I I I I I I I I I I I I I I I I I I I I I I I I I I I I 8 • • • ¤ u • • • • n • 1 • • u •
GJ I I I I I I I I I I I I I I I I I•
•J •I I I I I I I I I I I I I I I I I I I I I I I I I I I I I I I I X
•
Q • I I I I I I I I I I I I I I I I•I
I I I I I I I I I I I I I I I I I I I I I I I I I I I I I I I II I I I I I I I I I I I I I I l Iu•-4
•I I I I I I I I I I I I I I I I I I I I I I I I I | I I I I I I I I1••«
• I I I I I I I I I I I I I I I I I Ü‘
I I I I I I I I I I I I I I I I I I I I I I I I I I I I I I I I I I ' I I B ¤•~• • I E I I I I I I I I I I I I I I I I ¤
• I I I I I I I I I I I I I I I I I I I I I I I I I I I I I I I 7 I I I I I* '
• • • •* *
•' '
¤ I I I I I I ' I I I I I I I I I I I I I ¤
¤ I I I I I I I I I I I I I I I I I I I I I I I I I I I I I I I I I I I I I I I I I
¤ I I I I'
I I 'I I I I I I I I I I I I *1
•
• I I I I I I I I I I I I I I I I I I I I I I I I I I I I I I I I I I I I I I I I I IIR!
I I I I I I I I I I I I I I I I I I I I I Irxz~••'D
UTll
¤-I)<C;n ¤ • n ¤ • . • • ¤ • • • u • • n ¤ ¤ • n • • • • ¤ • • • • ¤ • • n

APPENDIX B
l00

101
Selection Function
The selection function values for each size class asdiscussed in Chapter 3 are as followsz
Size Class Size Mesh Si
1 28 x 35 2.83
2 35 x 48 2.263 48 x 65 1.794 65 x 100 1.45
5 100 x 150 1.156 150 x 200 .94
7 200 x 270 .76
8 270 x 400 .60
9 400 x 500 .41
Size Microns
10 23 .33
11 16.3 .26
12 11.5 .22
13 8.1 .17
14l
5.75 .14
15 4.10 .11
16 2.90 .09
17 2.0 .07
18 1.45 .04

102
Breakage Function
The breakage function described in Chapter 3 can be
represented as a lower triangular matrix with values as
followsz
b(1,1)= b(2,2) = b(3,3) = b(n,n) = 0b(2,1) = b(3,2) = b(4,3) = b(n+1,n)b(i„J) = b(i+l„J+l)
b(l,l)= 0.000_ b(2,1)= 0.268
b(3,1)= 0.200b(4,l)= 0.150b(5,l)= 0.112b(6,l)= 0.082b(7,l)= 0.058b(8,l)= 0.041b(9,1)= 0.028b(10,l)= 0.020b(11,l)=
‘ 0.013b(12,l)= 0.009b(l3,l)= 0.006b(l4,1)= 0.004b(15,1)= 0.003b(l6,1)= 0.002b(17,1)= 0.002 .b(l8,l)= 0.002b(l9,1)= 0.000
Class 19 = 1 - SUM b(l,j) to b(18,j)

APPENDIX C
103

104
-1:-1:-1:-1: 0*+·1< L1{ •s
= -1: :>·• { AE-4 -1: Z+-4 -1: \Ui -1: >-4CZ -1: VE -1:> -1: Z+-4 -1: OZ -1: +-4D B4
Ui DU U :194 +-4 +-452 E- M:-4 Cd E—4U3 Z Ui
+-4 1-i4-5 :.1 DL1 U E11E4 Z -1: 4: ND +-4 -1: -1: 4-94 Q -1: -1: 03I-I ni { { C •~{-4 +-4 -1: C +4 GN :
=C.0 Z -1: M 4 N(DZ U 4: E11 +-4 +-4 IIU1-4 -1: N 94+-4 I -1: +-4 O :E-U -1: Q -1: Z E4 U •~Ez:1—4 Q -1: Q -1: +-4 O Ui +-4ZZ- CD ·1< 4 -1: U ·-
I':+-4.*71 ZE 4: -1: Z : •„ZU E- -1: I -1: 4 EQ Ui :C;} E:} -1: -1: Ui CdUE- Z -1: U: +-4 -1: E4 141 :1: U:Z>4 -1: Z -1: D Cd Ui LZ+-444.7 M Ui O E ·1< ff-4 ·• 4 4QO= :.4.1 >-4 +-4 ><: -1: Z D 4;+ JIZ.C.4Z 1-'J 4 E4 Ea: 4: 1-4 co U U+-4 3: D c.: +-4 Z 4 mC-S4OL¤ L1.] M Q
•• E-: O +-4 [zi LGLÜPICZGD -1: •<: ... cs 4 E- N N
Zczcw -1: -1: O Il Q O 4-4 4-4[:.11-1 +-1 -1: -1: U
-Z E-4 Ui UiOU• 41: -1: +-4 E4 U1 O
MQ- -1: -1: Q V D +-4 U E;. ZCN Q-: EI O 1-{AA
2}+4:44-I -1: -1: +-1 ••<D Z Z L) 1-4+-44-4:::1 -1: 4: E4 I.f'1|I +-4 D cz:. 4:4: mE-DDQ (Q -1: 41: AA +-4 c~1{-4 -1: O E E13 DVV
¤..¤E-4:+-4 -1: -1: OG Z O -1: >-4 E—4 C1 OUZZ:4.,;;*2.;): -1: -1:Nr; mm +-4 OE-4 4: Z E44-4--+@@+.4+-4;;, 41+ 41: 1 -1: E-4: -1: O = D L11: {-4
Z::Z<2 -1: -1:4::+-4 occoo -1: ·~ -1: Q Z Z -42: O>-4: :11:: -1: 4: mmmmm -1: +-4c -1: : = : ++::94EJ ·• -1: -1:4.1E;—4 VVVVV -1: 411+ -1: II +-4 ZME45-4E·4E—4E-4-1: 1::1.61 Ui¤1Z+-IZ -1: +-4N -1: E—4E4</>·E4E-•E<*1E4E4IINZZZZZ Q1-4 •• DZCGZDZ

105
E4Ih
=4=#4:
¢=
=44=£xJ:=¤Z>¤#+-42·'$3E—4+··-4=s=<2U) E—4
·+¢ : JU} OE- -+4 ·+¢ 4: D4 [-40 44 ·+¤ 4- 0:414 454 -+< 4¤ ·+< ZD A:1 -k ~4¤ -4: +-4Uo\¤ 41II «+¤ -4: -+¢ U'} VA ~x -4< ~+< D ·~Z4-4 -+¢ +4 ·+¢ :|
---•¢ —+¢ ·+¤ E-4 c
2 ·+¢ · ·+< ·+¤ Z D ++0•• -+¢ ·+< -k +-I E:] 4-4
+;-4 il ·+¤_ ·+¤ x 23 : „
O Z ,‘)* ad +-4 •~«-
E·—4 O Z ~+< •• <‘. '"J41E 4:** _ O ·K
•~ E4 •~V•~ :4 +-4 ~+¢ = LC = Z
U= U [*4 il CZ ~COC!] Z U II U}-1•~N E Z U] GW UÄP]: +-4 E4 Eu D Z ^ <VLQU} L9 C:-4 O Z AEQJQQ
••Z )-4 +-4
U•~
U10 = 0 kl E4 E =U}E—4 ^ 4-4 L') V C:l=«=4 Z E·4 <Z Q Nä»-Jh +-4 U td D Erl U1 4-4¢UO ZI. Cal < U E U} LQ •
V •-'J 3 A +-4 41 ¢4=Edt? zu cz 4 E-4 2 ==NZLIE'4Ü&} U} C3 U ==·„1=4-4UDE == :4::U}+—·4•~+-4 Z Z·xD:
E- 4**4 +-4 ~+¤ E1? 02:4:C¤ZC=J -+¤ 5422 E4+-4:-·=O NU Q D ·+< Z4-4+-4 Z1C5=¢••=
4;+4-4: 4 4 4< 4-4::::+: \¤4===C-$<U]+—4 Cr-] UU fs] UU
(Z4 UJU) rz UJUJ ·+¤ D•4•• ••U]Or—4 {-4Cf]E·•Cl-46- ·|< #1 -— ·I< ••kOkD r-4 ~L')O24—4¤+—4 ~•¤ 0041 ·+¤0041ODZBZ
-+< E—4E-4 ~ +¤ BE-4 ~·+¢ ~-~E·4»·~++-4+
02.+-4U}LD ·+¢ +-4 4: +-4 ·+¤ ¤—4N<'7 4147440-·~+-4 ·::•:::: ·k 4-44-4V ··+¢ 4-44-4V ~+¢ 4-4V 34141 4-4 ·+< +4++Ui41+-4 44 4+ ++¤‘-41+-4 -x £zJ¤JC=l4+';‘¤ V€—4 E-E-4E—4E-4 4< 4-441 4¤ 4·4'7 -4¤ &4&4E44144&4E-42BZODDDD CJBE4 GEB <·<E<C ^<ZII

106
-¤·•<
4= «¤·•¤ -•<+< ~¤4¢ 4<Z 4<O 4<I-4 4=E 4=4 4<U
·•< ccccP-I {
~s;~A 4: ccccQ4 {
~s~~,54 ·x cccc:*4 {
s~~~A c Z ccccD Q' O ss~~E Gx 5-+ cccc
•—1 :1 ssxs
>< >·: U ccccP-4 (HO•~A
G: 4E—+cc= D ccccE"* kl ~~ns
E4 4 zwcwowzz cccc=E—4 ^ Z6: : O cccc
ns ZP—1 ssns
H: + ><AE4E-4 E—4 ccccät LC;
D D ••UU¤ Ci cccc:1::*-.. Q ~· @9 ••Q;QE·•• H Z O Zx¤&J</>Z Es.} GOODcw: 2: »·~ ·•¢ oa Hcxm<::<°.> U1 ~~~~E-«=== : H »·~ cw Q-•A·~A ·•< cccc
U " *1 •··4 4- C13:cz: E ~ HG••Z::: —•< cccc
=¢ E4 —k V1 O ¤äE—•Q L) ·k ~~~~=•= »—— -* E—< LTO;-{ZD c4: ccccA E-«=¤= ci H U2 O UDO: ¤w+< ~~~~4 2.:; CG
~ I U BJ oo-x cccmE-• H=¤= A H ~« DZZ>4Z:-44:OQ1: D UUV
·•=U Z Zum: C
-•< cccw •E4 D-• EJ LOC/ZU) E U) Cd HIZIQSIZ O-•< ~~t\•—1+
••U *|¢ *|¢ D E E·4E<E•£x1 E-• Om· ~»- HZ ·¤ C>O»— + O H E am O4 —c¤1•—1c
*1 ~+-4 *|< E·4E•*—4 ^ E4¤·~ OO== ZO UE P7 • ~—V Nm +< ~ c H E—• NU:>-«ZL¤c¤ •·4 comccE D O
·•¢•-1:-H1 -~ LD x¤::==: [·-4Q •—„~
Il*1£ü II·•<
IIIIVHZ *1|IAHIlE••-4 Illl LD-K NOCOA E-+E—•cA
·•< v·:Hc¤ u !—·|II AQ 5—«u:—v>5—•;-4 +4:494Zng +E-4^ E4 ^E-4E-•+OD44DD >< 4444

107
Q x , xx Q x {
O~
O RCO ~ O ~
Nx@ x Q
•
Q x Q x x
O ~O~
Q O~O
~ O L9 CO ~O ~ N N
Q xcj x Q• •
x@ x@ x x x
O ~C> ~ CO O GO ~C> ~O xD C: ur:_ ~O ~O ~ N N «-4Q x@ x@ • • •
Q x@ x@ x x x x
~O ~O ~C¤ C O NO ~O ~GkD O LO r—·1
O~O ~O ~N N «—4 •—·ix@ x@ x@ • • • •
{ Q x@ x@ xx x x x
+< O~O ~C> ~<:3C> O N N-8
‘~C> ~O ~C>kCO L!7 r-( CC
-8 O~O ~O ~NN •—( r-4 O{ Q x@ x@ x@ • • • • • >
{ x@ x@ x@ xxx x x x
-8’
O~O ~O ~C0OO N N C3-8 O~CD ¤G ~O\DOLO ¤·—4 Q U7-8 ~O ~O ~O ~NN»—4 •—1 O O«k Q x@ x@ x@ • • • • • •
OOOOOOOOOOOOOO ~8 O~O ~O ~O~~~~ ~ ~ ~xxxxxxxxxxxxxx{ BOBSBQBQQONNQN
OCDOOO©CDGOGOCDO<‘ -8 O~O ~O ~O\OOLOr—( Q LO <‘
OOOCDOOOOOOOOF•~+< ~O ~O ~Q ~Q •••• • • •
xxxxxxxxxxxx@@@•)¢ @x@x@x@xxxxx x x x
OOOOOOOOOOOCB •~~·8 ~O ~O ~O ~<IJOONN Q •·-4 Q:xxxxxxxxxxx@@@@Z C)~@ ~@ ~@LQ@LO•-{CO LO
<‘N
OOOOOOOOOO•—4•~~~O ~O ~O ~O ~NN«—••-(O O O
xc) x@ x@xxxxxx x x x
~~_~~~~~~~¤—·IOOOC>O() O~C> ~O ~Q3OONNOO •-1 Q': OOOOOOOC>O(\ •~~~~~Z ~C> ~C> ~Ok:>C>L¤¤-(QLO
<‘N CJ
~~~~~~~~•—•OOOQOOEJ O~O ~O O CD 0(j@@@@@@N•xxxxxxQ_, xcj x@
x@•••••• • • •
xxxxxxx(\]@C)@@@Cj@ @x@x@xxxxxxx x x x
OOOOOO\D•~~~~~~~Iz2 ~O ~O ~QOONNC¤•·-1 00 O M~~~~~~NC>¤CDQOOC>QU O ~Q ~OkDOL•"7r—+Ql•"7<:' N N »-—1
OOC>OG<*1•~~~~~~~~<'. ~O ~O ~NN•-1•—4C>OO O C> Q
x@@@@@p-—1•xxxxxxxxx<x@x@~xxxxxxx x x x
~*¤¤<'GOGOCCD©OCDOÜS O *CD •CO®©C\|t\lC‘Or—|Q C (*7 CN
OOOC>•~~~~~~~~~~¤~O ~O*~OOL(1¤-4QL¤<:‘<‘J N «-4 0
~~~kC><DOOQC>¤C>OOOC>C£. C> ~O ~NNr-+r-4000C O O O@@kQ•xxx~xxxxxxx{
x@x@•••••••• • • •
~~(\OOOOC>OOOOOOO-8 O ~O ~~~~~~~~~ ~ ~ ~
QOOOOOOOGOGOGCD-8 O ~O\DOL’7r-·(Q\!7¤'C‘~!N •—\ O G
•-—-1000OC>OC>C>OOOQOO·u O~O••••••••• • • •
• BBBBBBBBBBBBBB{ BC BBBBBBBBBx B B B
r·1OC)OOCOGOO©OOGO-8 O CN MD <'xxxxxxxxxxxxxxx-[ x@\Q¢)LOr—{QLO<'(\|N•-1@()@
OOOOOOOCDOOOCDOGO-8 C) ~NNr·4•—!OOOOOO O O OBBBBBBBBBBBBBBB BO I I I I I I I I I I I I I
coocoooooocoooonc O •~~~~~~~~~~ ~ ~ ~xxxxxxxxx~xsxsxE——(
O O
-8<Z<2<2·<C<l<C5C<2·=C<Z<C<·=t¤2<C fC<<C§C<C'$C•¤€<C§C§C<E_•§ZI g ·<1 gf.
c< E- w<.‘<<<1<<<<·<1·<<<t·<Z<<¤¤¤;<<£<.<£<£·=2<<C<Z·<2<·<C < <.'
·<.‘QQQQDQQQQQQQCJQQMQQQQQQGQDQQQQ Cl @0:3
* B
L!7\£>|\QC\Or·1Nf'7<'U7\D(\COG\O•—(Nf'1<*lI7LDI\QC\O¤-4N("7 QOLO ~kDOOOOO«—I•—1r—1•—-I«-1•—(«—I¤—4«—-|¤—(NNNNNNNNNN<"7r*7f*3€•’7 (**3 ~C*‘$Or*1NNNNNNNNNNNNNNNNNNNNNNNNNNNNN NON ~N

108
n • n_
CD G N OO LI7 •—1 l\
N r-1 ¤-1 N• • • •
n s~
sO N N CDL!7 #-1 Q Qr-1 •—1 Q •—1
• • • •
~s n s
N N Q CD•—1 Qu’7 (**7
#-1 O G #-1..
• • • •
n~
s sN CO r—1 G7Q LÜ <‘ QO G O O
• • • •
~s s s
Q #-1 Q #-1LV7
<^‘N XD
C.) CD O O• • • •
s n n nr-1 Q O #-1<2‘ N N
<‘
CD G O C)• • • •
~s
~ ~Q G (*7 QN N #-1 NC O O O• • • •
s n s sG (*7 G7 G7N r-1 C
•-1
O C) O CD• • • •
n s s n(*7 G7 XD (*7 ·r—1 C} G #-1Q O O O• • • •
n n~
s07 XD <' C7C G C3 GCD O C C
• • • •
s s s~XD
<‘ (*7 XDO CD Q QO CD O O• • • •
s s x s<‘ (*7 N<‘
C Q C GCD O CD O• • • •
n s s sI"7 N N NG Q OOOOQ C> O ~C> ~• • •@ •;·-1
s ~@ sxns
N N ~NGOONO GOOXDOF7OCC *C>NOI\
• ~•@ • • • •
Q s n n
c>•¤: ~·=C¤o<‘.c>gx:<·~1—E—+c>E—<X¤E-«c>¤—•mo<.‘ ~·<CN<‘.N<L‘m·¤C>¤ •D ·Q •
Q s n s s
-®Q®@®©CDNQQXDQQONLDQQ~(*”7Nf*7Nf*7•—1<‘(*7
CN•N •N •N •
