an overview: working on the “workforce”
TRANSCRIPT

An Overview: Working on the “Workforce”
Mike Carnathan
ARC/Neighborhood Nexus
Image credit: Medium.com
• The occupations that have an over-representation of workers-of-color tend to have the lowest wages.
• Lowest-wage workers have fared the worst in the pandemic economy, with employment rates declining some 23 percent since January 2020 for workers making less than $27K annually.
• Growth in middle-wage occupations has stagnated; while many common low-wage occupations are paying less today, in real terms, than they did five years ago.
• Occupations in high demand clusters have held up well compared to the job market overall.
2
Key Points

Who Is Metro Atlanta’s Workforce?
3Source: Jobs EQ and American Community Survey
151,319 6%
909,401 34%
205,992 8%
1,348,693 51%
42,277 1%
Composition of the Workforce
Asian
Black
Hispanic
White
Other
364,660 6%
2,057,902 34%
661,048 11%
2,762,575 46%
172,559 3%
Composition of the Population
The relatively older White population results in a larger share for Whites in the workforce than in the population as a whole. Conversely, the relatively younger Hispanic population contributes to their higher share of population than of the workforce.

4
Demographics of our Workforce: Age Composition
Source: JobsEQ, 2019Q2
0.0% 5.0% 10.0% 15.0% 20.0% 25.0% 30.0%
14-18
19-21
22-24
25-34
35-44
45-54
55-64
65-99
Workforce by Age
% of New Hires During Q2, 2019 % of Total Employment
The 35-44 and 45-54 cohorts comprise the largest overall age group shares of the workforce. New hiring, though, is most concentrated in the workforce “entry-level” cohort of ages 25-34. The smallest share of new hiring is in the 65+ age group

0% 10% 20% 30% 40% 50% 60% 70% 80% 90% 100%
Office and Administrative Support
Management
Sales and Related
Business and Financial Operations
Transportation and Material Moving
Healthcare Practitioners and Technical
Construction and Extraction
Food Preparation and Serving Related
Computer and Mathematical
Production
Personal Care and Service
Building and Grounds Cleaning and Maintenance
Education, Training, and Library
Installation, Maintenance, and Repair
Arts, Design, Entertainment, Sports, and Media
Healthcare Support
Community and Social Services
Architecture and Engineering
Protective Service
Legal
Life, Physical, and Social Science
Total
Asian Black Hispanic Other Races/Ethnicities White
5
Race/Ethnicity Composition by Occupation
Source: Burning Glass
White workforce is over-represented in higher-wage jobs such as Management and Legal. Black workers have relatively higher shares of lower-wage Personal Care and Service and Transportation/ Material Moving occupations. Hispanic workers are concentrated in Construction. The Asian workforce is most clustered in Computer and Mathematical.

6
Gender Composition by Occupation
Source: Burning Glass
0% 10% 20% 30% 40% 50% 60% 70% 80% 90% 100%
Office and Administrative Support
Management
Sales and Related
Business and Financial Operations
Transportation and Material Moving
Healthcare Practitioners and Technical
Construction and Extraction
Food Preparation and Serving Related
Computer and Mathematical
Production
Personal Care and Service
Building and Grounds Cleaning and Maintenance
Education, Training, and Library
Installation, Maintenance, and Repair
Arts, Design, Entertainment, Sports, and Media
Healthcare Support
Community and Social Services
Architecture and Engineering
Protective Service
Legal
Life, Physical, and Social Science
Total
Female MaleFemales fill far higher shares of the jobs in Healthcare sectors, as well as Office and Administrative support—and the lower wages align with the inequity in earnings across gender. Males are over-represented in higher-wage areas such as Architecture/ Engineering, but also in “manual labor” sectors such as Construction and Transportation/Material Moving.

Tale of Two Times
7
284,000
101,800
43,400
23,800
65,800
14,900
13,600
9,900
500
2,100
8,100
(318,600)
(125,400)
(54,200)
(31,600)
(29,300)
(23,000)
(22,300)
(11,000)
(8,800)
(7,300)
(5,700)
(400,000) (300,000) (200,000) (100,000) - 100,000 200,000 300,000 400,000
Total
Leisure/Hospitality
Professional/Business
Education
Trade, Trans, Util
Other Services
Manufacturing
Finance
Government
Information
Construction
Job Change: Beginning and Until Now
Source: Bureau of Labor Statistics
The orange bars above show job loss by sector in the March and April 2020 “crash”; the green bars indicate extent of the recovery (net increase) since May of 2020. “Now”, there is still a net deficit of almost 35,000 jobs. As for sectors, only Trade/Transportation/Utilities (includes e-commerce and warehousing) has fully recovered from the pandemic plunge.

There Will Clearly Be Some Winners based on BLS’s “Strong-Pandemic Impact” Scenario
8
Source: Bureau of Labor Statistics, via NY Times - https://www.nytimes.com/2021/02/22/upshot/jobs-future-pandemic-.html
The rates of change (shaded in blue) indicate by sector the pandemic-driven increase in jobs over the baseline projection (that did not include any pandemic effects). Health and web-related jobs are seen as spiking.

But Some Occupations Could Continue to Struggle based on BLS’s “Strong-Pandemic Impact” Scenario
9
Source: Bureau of Labor Statistics, via NY Times - https://www.nytimes.com/2021/02/22/upshot/jobs-future-pandemic-.html
The rates of change (shaded in blue) indicate by sector the pandemic-driven decline in jobs below the baseline projection (that did not include any pandemic effects). Food and travel occupations suffer the most.

It’s The Low Wage Workers Who Are Suffering
10Source: tracktherecovery.org

-60,000 -40,000 -20,000 0 20,000 40,000 60,000 80,000
Total Change in Jobs, 2015-2020
$109,870
$92,700
$81,090
$78,670
$70,220
$68,330
$67,630
$51,520
$50,920
$48,880
$45,860
$43,320
$40,200
$38,070
$34,520
$32,630
$30,720
$29,320
$27,190
$24,230
$20,920
0 20,000 40,000 60,000 80,000 100,000 120,000
Management
Computer & Mathematical
Architecture & Engineering
Legal
Business & Financial Operations
Life, Physical, Social Science
Healthcare Practitioners, Technical
Arts, Design, Ent, Sports, Media
Educational Instruction, Library
Installation, Maintenance, Repair
Community & Social Service
Construction & Extraction
Protective Service
Office & Admin Support
Production
Transportation & Material Moving
Sales & Related
Healthcare Support
Building Grounds Maintenance
Personal Care Service
Food Preparation & Serving
Median Wage, 2020
Where Did Middle Wage Jobs Go?
High Wage Jobs +124,000
Mid Wage Jobs -24,000
Low Wage Jobs +52,000
Source: Bureau of Labor Statistics

12
And Why Are Wages Stuck Here More So Than Elsewhere… at Least for Some Occupations?
Source: Bureau of Labor Statistics
-$4,000
-$2,000
$0
$2,000
$4,000
$6,000
$8,000
$10,000
$12,000
Cashiers Customer ServiceRepresentatives
Heavy and Tractor-Trailer Truck Drivers
Laborers and Movers,Hand
Office Clerks, General Retail Salespersons Secretaries andAdmins, not Legal,
Med, Ex
Stockers and OrderFillers
Waiters and Waitresses
Change in Wages, 2015-2020, Common Low-Wage Occupations -- Selected Peer Metros ($2020)
Atlanta Austin Boston Charlotte Chicago Dallas Denver Houston Minneapolis Seattle Washington
The yellow bars show the Atlanta 2015-2020 wage trends for lower-wage occupations; there are real declines in wages over the period in Customer Service Reps, Secretaries/ Admins, and Waiters/ Waitresses. And further, in the low-wage occupations in which there are wage increases, Atlanta trails most peer metros, except in the case of Office Clerks.

So It’s REALLY About Economic Mobility
Source: Brookings Institute
While Atlanta trailed only three of the 25 largest metros in job growth from 1990-2010 (x-axis), our metro came last (of the 25) in generational income growth for the children of lower-income residents (y-axis).

Overview: High Demand Occupations

15
What We THINK We Know About Pandemic Effects on High Demand Clusters
2.2% 2.4%
3.4%
4.6%
3.0%
2.3%
-2.5%
0.3%
1.5%
4.1%
-0.3%
-8.0%-9.0%
-7.0%
-5.0%
-3.0%
-1.0%
1.0%
3.0%
5.0%
AdvMfg Skilled Trade TDL IT Healthcare Overall
Target Clusters (Top Jobs) and Overall Job Growth (in Percent): Averages Q2 to Q2
2010-2019 2019-2020
Source: Jobs EQ, 2020Q2
Five target high-demand job training clusters have been identified in state and regional workforce planning and are listed above on the x-axis (horizontal). In the pre-pandemic period of 2010-2019, job growth in all but the Advanced Manufacturing cluster exceeded the 2.3 percent increase of the overall job base. From 2019-2020, the overall job base declined 8 percent, but jobs actually increased in three of the five target clusters.

16
Average Wages for High Demand Clusters
$39,300
$48,400
$50,500
$52,500
$90,200
$54,300
$0 $10,000 $20,000 $30,000 $40,000 $50,000 $60,000 $70,000 $80,000 $90,000 $100,000
TDL
Healthcare
Adv. Mfg
Skilled Trades
IT
Overall
Source: Jobs EQ, 2020Q2
Average wages in the IT cluster are much higher than in the economy overall, and are comparable to three of the remaining clusters. Only in Transportation, Demand, and Logistics (TDL) is the average wage over 10% lower than the overall average—and low barriers of entry are a major advantage for training in this sector.

17
Race Composition of High Demand Clusters
49.3%
60.7%
47.5%
43.1%
42.3%
50.9%
23.5%
34.1%
44.6%
48.8%
51.3%
39.6%
25.2%
2.4%
5.4%
6.2%
3.9%
7.0%
2.0%
2.8%
2.6%
1.9%
2.5%
2.5%
0.0% 10.0% 20.0% 30.0% 40.0% 50.0% 60.0% 70.0% 80.0% 90.0% 100.0%
IT
Skilled Trades
Adv Mfg
Healthcare
TDL
Overall
White Black Asian Other
Source: Jobs EQ, 2020Q2
White and Asian populations dominate employment in the higher-wage cluster of IT, while Black workers are over-represented in the relatively lower-wage TDL and Healthcare sectors. Skilled Trades and disproportionately weighted to white workers, as well.

18
Ethnicity Composition of High Demand Clusters
94.9%
88.1%
86.4%
86.2%
77.5%
89.1%
5.1%
11.9%
13.6%
13.8%
22.5%
10.9%
0.0% 10.0% 20.0% 30.0% 40.0% 50.0% 60.0% 70.0% 80.0% 90.0% 100.0%
IT
Healthcare
TDL
Adv. Mfg
Skilled Trades
Overall
Non-Hispanic Hispanic
Source: Jobs EQ, 2020Q2
Hispanic workers hold a disproportionately high share of jobs in most high-demand clusters. In particular in the Skilled Trades sector, more than one in five jobs is filled by someone of Hispanic origin. In the higher- wage IT sector though, only 1 in 20 workers is Hispanic compared to over 1 in 10 for the economy on the whole.

19
Gender Composition of High Demand Clusters
13.2%
65.7%
73.2%
78.3%
95.7%
51.1%
86.8%
34.3%
26.8%
21.7%
4.3%
48.9%
0.0% 10.0% 20.0% 30.0% 40.0% 50.0% 60.0% 70.0% 80.0% 90.0% 100.0%
Healthcare
TDL
Adv. Mfg
IT
Skilled Trades
Overall
Male Female
Men are, with the exception of healthcare, over-represented in all of the high-demand clusters (as compared to a nearly 50/50 split across the workforce overall). This imbalance suggests possible policy initiatives to target women for training in many of these high-demand clusters.
Source: Jobs EQ, 2020Q2

Job Postings by OccupationsApril 1, 2020 – March 31, 2021
20Source: Burning Glass
Biggest Differences:
Higher demand for:▪ Truck Drivers (+21K)▪ Registered Nurses (+5K)▪ Intensive Care Nurse
Lower demand for:▪ Software Developers (-11K)▪ Office/Admin Asst. (-2K)
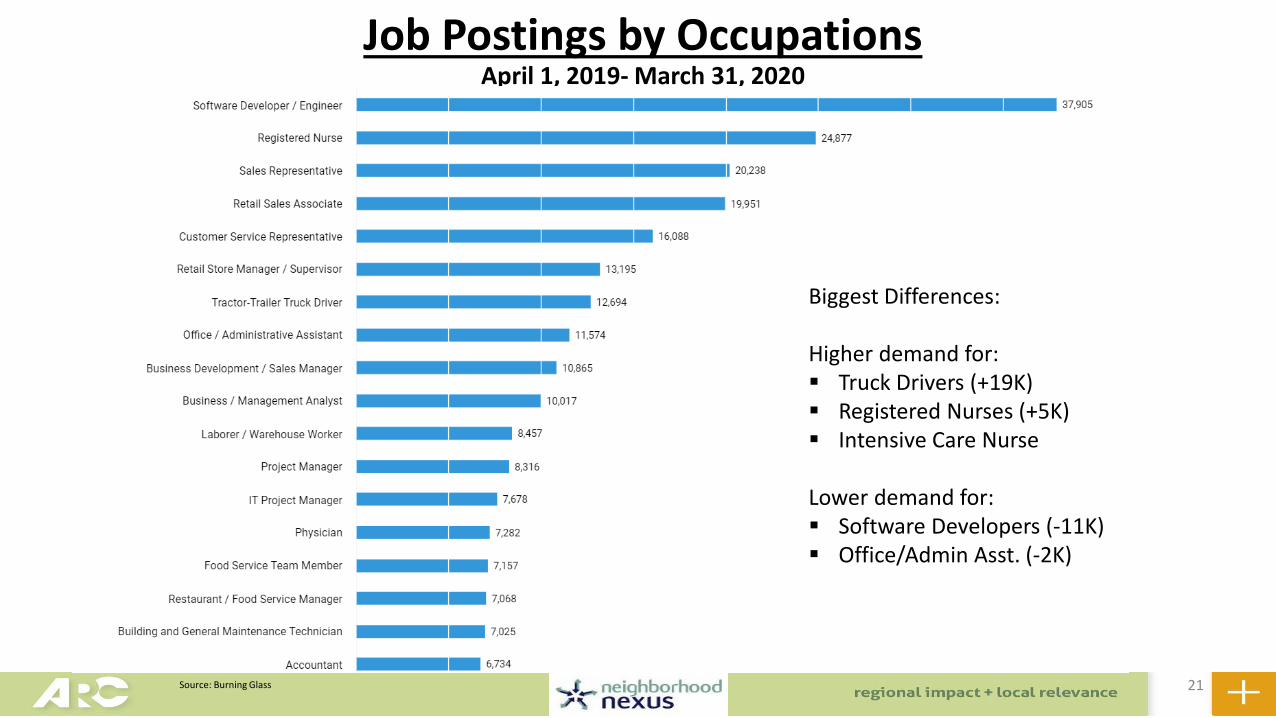
Job Postings by OccupationsApril 1, 2019- March 31, 2020
21Source: Burning Glass
Biggest Differences:
Higher demand for:▪ Truck Drivers (+19K)▪ Registered Nurses (+5K)▪ Intensive Care Nurse
Lower demand for:▪ Software Developers (-11K)▪ Office/Admin Asst. (-2K)

Who’s Hiring? Last 60 Days
22Source: Burning Glass
What Groups Stand Out? • Healthcare• IT• TDL• Skilled Trades?

23
For more, visit the CareerRise Dashboard
The CareerRise Dashboard covers labor demand and supply on dimensions such as gender, age, race and ethnicity. It also offers quick summaries of these dimensions according to the top job clusters. The image to the right shows how employment in the region’s leading job sectors in the year leading up to the pandemic.
The dashboard is available at neighborhoodnexus.org/maps-and-data/workforce-dashboard.
Total Employment Change for Top Jobs in the ARC Region (Q2 2019 to Q2 2020)