analysing nigeria’s energy system in light of the un’s
TRANSCRIPT

INOM EXAMENSARBETE TEKNIK,GRUNDNIVÅ, 15 HP
, STOCKHOLM SVERIGE 2017
Analysing Nigeria’s Energy system in light of the UN’s Sustainable Development Goals- A CLEWs assessment
OBIORA OKOLO
HAORAN TENG
KTHSKOLAN FÖR ARKITEKTUR OCH SAMHÄLLSBYGGNAD

0
Abstract Today 57.7 % of Nigerians has access to electricity with less than 1 % using electric stoves for cooking. Fuelwood is used for cooking in 63.7 % of the households and is one of the main contributors to Nigeria having the third highest deforestation rate in the world with 410 000 hectares of forest cut down per year. The country is also listed as one of the ten most vulnerable countries to climate change in the world. The main objective of this thesis is therefore to evaluate a key section of the integrated Climate, Land, Energy and Water system (CLEWs) nexus for Nigeria between 2015–2030 with the main CLEWs interlinkages focused on being the ones between energy (electricity & cooking), land (deforestation) and climate (CO2 emissions). The further aim of this thesis is to contribute in the UNDP’s work towards the SDG 7 (affordable and clean energy) and 15 (life on land). Through the modelling of 10 different scenarios in the long-term energy planning tool OSeMOSYS (Open Source Energy Modelling System) the outcomes of all scenarios are analysed and compared regarding costs and their implications on the deforestation rate and CO2 emissions. The results show that the scenarios with NREEEP leads to a 30 % reduction in CO2 emissions in Nigeria compared to those in the cost-optimized scenarios. The results on deforestation show that the forests in the country will be gone or almost gone by 2030 both in the cost-optimal scenarios as well as in the business as usual and high growth scenarios. The No fuelwood and charcoal scenario saved the most of the forests, but had the highest CO2 emissions which indicates that there is a conflict between SDG 7 and 15. For future work it is recommended to expand the modelling work done in this study through, among other things, enforcing OSeMOSYS to create an optimal cooking sector based on environmental factors through the use of parameters such as emission penalty and implementing other types of innovative stoves in the model to analyse the outcomes.

Acknowledgements First and foremost, we would like to express our sincere gratitude to our supervisor Rebecka Engström for all her valuable guidance and encouragement. We would also like to thank Prof. Mark Howells and the entire KTH-dESA division for welcoming us and for all the support we have received. Special thanks to Georgios and Nandi for sharing their expertise and help with the modelling work. We would like to show gratitude to a few people at the UNDP in Nigeria. To Senior Economic Advisor, Mr. Ojijo Odhiambo, who made the MFS trip possible as well as Muyiwa Odele and his team for their guidance and help in linking us with the different ministries. Thanks to the representatives of Energy Commission, Departments of Climate Change and Department of Forestry for their expertise and contributions in the data collection process.

AbbreviationsBAU - Business as usual CLEWs - Climate, Land, Energy and Water systems
FAO - Food and Agriculture Organization
GHG - Greenhouse gas
IAEA - International Atomic Energy Agency
INDC - Intended Nationally Determined Contributions
KTH - Royal Institute of Technology
LPG - Liquid petroleum gas
NACC- Nigerian Alliance for Clean Cookstoves
NDHS - Demographic and Health Survey
NEMP - Nigeria National Energy Master Plan
NFCCN - The National Forest Conservation of Nigeria
NREEEP - National Renewable Energy and Energy Efficiency Policy
OnSSET - Open Source Spatial Electrification Tool
OSeMOSYS - Open Source Energy Modelling System
SE4ALL - Sustainable Energy for All
SDG- Sustainable Development Goals
UNDESA - United Nations Department of Economic and Social Affairs
UNDP - United Nations Development Programme

Table of content 1.Introduction................................................................................................................................................1
1.1CLEWs...................................................................................................................................................1
1.2Nigeria..................................................................................................................................................1
1.3Purposeandobjectives........................................................................................................................2
2.Background.................................................................................................................................................3
2.1Climate.................................................................................................................................................3
2.2Land......................................................................................................................................................3
2.2.1Deforestation................................................................................................................................3
2.2.2Driversofdeforestation................................................................................................................4
2.2.3Consequencesofdeforestation....................................................................................................4
2.2.3.1Biodiversity..........................................................................................................................4
2.2.3.2Emission...............................................................................................................................5
2.3Energy...................................................................................................................................................5
2.3.1Cookingsector...............................................................................................................................5
2.3.2Healthimpactsofhouseholdfuelwooduse..................................................................................6
2.4Policiesconsideredinthisstudy...........................................................................................................6
2.4.1NV20:2020....................................................................................................................................6
2.4.2NREEEP..........................................................................................................................................6
2.4.3INDC..............................................................................................................................................7
2.4.4NACC.............................................................................................................................................8
2.4.5SDGs..............................................................................................................................................8
3.Method.......................................................................................................................................................9
3.1Modellingtools...................................................................................................................................9
3.1.1OnSSET.........................................................................................................................................9
3.1.1.1Multi-tiercategorizationofelectricity.................................................................................9
3.1.2OSeMOSYS.................................................................................................................................10
3.1.2.1RESofNigeria.....................................................................................................................10
3.2Data...................................................................................................................................................11
3.2.1TEMBA.........................................................................................................................................11
3.2.2Cookingsector.............................................................................................................................11
3.3Scenarios...........................................................................................................................................12

3.3.1Electricityproduction..................................................................................................................13
3.3.2Electricitydemand.......................................................................................................................13
3.3.3Cookingsolutions........................................................................................................................14
3.3.3.1Cost-optimized...................................................................................................................14
3.3.3.2Nofuelwoodandcharcoalby2030...................................................................................14
2.2.3.3Improvedwoodstoves.......................................................................................................14
3.3.3.4BAU(HighgrowthI)...........................................................................................................14
3.3.3.5Highgrowth(HighgrowthII).............................................................................................15
2.3.1Deforestationrateanalysis.........................................................................................................16
4.Resultsandanalysis..................................................................................................................................17
4.1Optimalelectricitymix......................................................................................................................17
4.2Cookingsolutions..............................................................................................................................18
4.3Costs..................................................................................................................................................19
4.4CO2emissions...................................................................................................................................................20
4.5Deforestationrate............................................................................................................................................23
5.Discussionandconclusion........................................................................................................................25
6.References................................................................................................................................................27
List of figures 1.ReferenceenergysystemofNigeria........................................................................................................10
2.Scenarios...................................................................................................................................................12
3.Optimalelectricitymixcost-optimizedinOSeMOSYS............................................................................17
4.OptimalelectricitymixbasedonrenewableenergytargetssetinNREEEP...........................................18
5.Productionofcookingsolutionsindifferentscenarios...........................................................................19
6.CO2emissionsforcost-optimizedelectricityproductionscenarios.......................................................22
7.CO2emissionsforscenariosbasedonelectricityproductionbyNREEEP..............................................22
8.Deforestationrateindifferentscenarios................................................................................................24

List of tables 1.SectoralelectricitydemandprojectionssetinNV20:2020......................................................................6
2.RenewableenergytargetssetinNREEEPbasedonreferencegrowthof7%GDP/year.........................7
3.Mappingoftierofelectricityconsumptiontoindicativeelectricappliances..........................................9
4.Cookingdemandprojections...................................................................................................................11
5.DatainputsfordifferentstovestypesinOSeMOSYS..............................................................................12
6.ReferenceelectricitydemandaftercalibrationwithOnSSET.................................................................14
7.DatainputforSupersaverGLWoodinOSeMOSYS.................................................................................14
8.CookingsolutionmixtureinHighgrowthI..............................................................................................15
9.CookingsolutionmixtureinHighgrowthII.............................................................................................16
10.Totaldiscountedcosts2015-2030fromdifferentscenarios.................................................................20
11.Totalemissions2015-2030fromdifferentscenarios............................................................................21

1
1. Introduction 1.1 CLEWs The world population is projected to reach 8.5 billion by 2030 (UNDESA, 2015) leading to a 50 % increase in food demand (UNDESA, 2014). As the population grows and more people manage to break out of poverty the level of energy supply needs to be doubled by 2050 to meet the rising demand (WEC, 2007). The Organisation for Economic Co-operation and Development (OECD) (2012) predicts that the global demand for water will increase by 50 % by 2050 as a result of droughts and increased demand for freshwater. Global warming is on track to breach the 2 degrees Celsius threshold by 2050 unless governments at least double their efforts to limit greenhouse gas (GHG) emissions. (Doyle, 2016) These resources are interconnected to each other in various ways. For instance, changes in temperature caused by global warming affects the amount of energy that is consumed (EPA, 2013). Other examples are that 69 % of water withdrawals are due to agricultural demands and that water is also used for energy production (FAO, 2016a). The inherent interconnectedness of these sectors have lead to the development of the Climate, Land, Energy and Water systems (CLEWs) modelling approach, a result of a collaboration between Royal Institute of Technology (KTH) and organisations such as United Nations Department of Economic and Social Affairs (UNDESA), International Atomic Energy Agency (IAEA) and Food and Agriculture Organization (FAO). It has helped in the quantitative analysis and modelling of the integrated resources and has been used to analyse interactions on a national and transboundary level. CLEWs has previously been applied on assessments for developing countries in Africa and South America. This policy-focused framework is often employed in collaboration with governmental authorities and the result facilitates them in capacity development activities (KTH, 2015).
1.2 Nigeria
With a population of over 180 million in 2015 (World Bank, n.d.(a)) Nigeria is the most populous country in Africa and the population is projected to grow with 2.3-2.6 % per year in the next 15 years. In 2030 this would mean a population of 263 million people (Worldometers 2017). Nigeria’s economy is the largest on the continent and stands for 55 % of West Africa’s GDP (GIZ, 2015). The mainstay of the Nigerian economy is the oil and natural gas resources in the country, (EIA, 2016) yet the power sector is still seen by many analysts as the key constraint on economic development (GIZ, 2015). Currently only 57.7 % of Nigerians have access to electricity (World Bank, n.d.(b)) and those with access have to deal with regular blackouts and rely on private generators. Most Nigerians use biomass such as wood, charcoal and waste for residential energy needs (EIA, 2016). The use of fuelwood is one of the main reasons for deforestation in the country (GIZ, 2015) and with 410 000 hectares of forests cut down annually Nigeria has the third

2
highest rate of deforestation in the world (UNDP, 2015).
1.3. Purpose and objectives The main objective of this study is to evaluate a key section of the integrated CLEWs nexus for Nigeria through the modelling of the electric power and cooking energy system in the country for the years 2015 - 2030. With the magnitude of the deforestation problem in the country, the main CLEWs interlinkages that this report will focus on are the ones between energy (electricity & cooking), land (deforestation) and climate (CO2 emissions). Water sector interactions hence lie outside the scope of this study. Through the modelling of a set of future energy scenarios the aim is to analyse and compare the scenarios regarding cost as well as impact on deforestation and CO2 emissions. The further aim of this thesis is to contribute in the UNDP’s work towards the Sustainable Development Goals (SDG) of 2030. The thesis focuses on the interlinkages between SDG 7 (Affordable and Clean energy), SDG 13 (Climate action) and SDG 15 (Life on Land).

3
2. Background
2.1 Climate
Nigeria’s GHG emissions are expected to grow to 900 million tonnes annually in 2030, corresponding to around 3.4 tonnes per capita. According to the 2014 World Climate Change Vulnerability Index, Nigeria is one of the ten most vulnerable countries to climate change in the world. The north is more vulnerable than the south, because of higher rainfall and socio-economic development in the south (UNFCCC, 2015). Among the things that are the most sensitive to climate change is the agricultural sector where productivity could decline between 10 to 25 per cent by 2080 under a business as usual (BAU) scenario. Another future problem is projected to be the global-warming induced accelerated sea level rise which is anticipated to be 0.5-1 meters this century, but could in the worst case scenario lead to a 75 % loss of land in the Niger delta (UNFCCC, 2015). If no adaptation action is taken, between 2–11 % of Nigeria’s GDP could be lost by 2020. A recent example of this is the 2012 flood where the total damage caused by the disaster amounted to 16.9 billion USD, which stood for 1.4 % of real GDP growth in that year (UNFCCC, 2015).
2.2 Land The land coverage in Nigeria varies from thick mangrove forests and dense rain forests in the south to a near-desert condition in the northeastern corner of the country (FAO, 2016b). Until recently, Nigeria's agriculture sector produced inadequate amounts of crops forcing large food imports from abroad. However, reforms implemented between 2011 to 2014 has led to an sharp increase in food production and thus reduction in food imports. 40.5 million hectares of the country consists of cultivated land and 6.5 million hectares of permanent crops. The main crops produced in the country are rice, cassava and yam. Soil degradation is a huge problem in the country. Causes to this are inappropriate use of chemicals for agriculture, urbanization and deforestation (FAO, 2016b). 2.2.1 Deforestation Between 1990 and 2010 forest area in Nigeria diminished from 17 million to 9 million hectares, a reduction by almost 50 % (UNDP, 2015). Lowland rainforests have lost over 40 % of their area. Freshwater swamp- and mangrove forests have lost 30 % and 11 % of their area respectively (Ayanlade & Drake 2015).

4
Currently Nigeria has the third highest deforestation rate in the world with 410 000 hectares of forests annually cut down. The National Forest Conservation of Nigeria (NFCCN) estimates that a large proportion of the forests in the country will disappear within a few decades if the current rate of deforestation is not reduced and reforestation activities not increased (UNDP, 2015). 2.2.2 Drivers of deforestation UNDP lists the increasing consumption of fuelwood by households, institutions and cottage industries as one of the main drivers of deforestation in Nigeria. Over 70 % of the population depends on fuelwood for cooking and other domestic uses contributing to the total deforestation of 410 000 hectares per year in Nigeria (UNDP, 2015). Another important cause of deforestation is the practice of commercial logging, especially for construction, furniture purposes and for export. In some cases the logging is selective and less than 10 per cent of the trees are cut, but more than 60 per cent may be damaged in the process due to large trees being connected by other vegetation such as lianas. Also small trees are damaged when large trees fall over them and removing the logs damages soil and vegetation (Park, 1992). A final contributing factor is the increased land conversion. In Cross River State, approximately 75 692 hectares of forest was converted to commercial monocrops such as cocoa, oil palm and rubber in 1980 (Uyanga, 1980). Various reports have observed that urban expansion increases land degradation, which includes forest loss. For instance, the problem has been noted as a major threat to the natural forest around the metropolitan Lagos area (Enaruvbe, 2016). In UNREDD’s social survey (2015) in Cross River State subsistence and commercial agriculture together accounted for 48 % of total deforestation. Fuelwood and logging accounted for 32 % and 20 % respectively. 2.2.3 Consequences of deforestation 2.2.2.1 Biodiversity Nigeria is rich in biodiversity. The country has roughly 8000 types of plants and 22,000 vertebrate and invertebrate species (Mobolaji & Olajumoke, 2015). As an agrarian society, Nigerians depend largely on biodiversity resources for food supplies. Biodiversity supports 70-80 % of food requirements of 70 % of rural Nigerians and around 30-50 % of urban communities (CBD, 2015). Deforestation is seen as the largest threat to biodiversity in the country (CBD, 2015) and have lead to several species of fauna and flora to be rendered extinct or in danger of extinction (Oluduro & Gansu, 2012).

5
2.2.2.2. Emission Forests are known to be the largest terrestrial carbon sinks. Deforestation is rapidly destroying this storage and being responsible for 40 % of national carbon dioxide emissions in Nigeria. Based on a deforestation rate of 2.6 % an estimated 26.5 ton CO2-eq is projected to be emitted annually from deforestation in 2030. This is an increase in emissions by almost 280 % compared to 1990 (UNDP, 2015).
2.3 Energy The power supply available in Nigeria is erratic and is seen as one of the major obstacles for economic and industrial development in the country (Ohajianya et al., 2014). Out of the total of 116 516 ktoe of energy consumed in the country, 85.9 % comes from biofuels and waste, 9 % from oil products, 3.3 % from natural gas while the remaining 1.8 % comes from electricity. The largest consumer of energy is the residential sector which accounts for 82 % of total consumption followed by the industry and transport sector each at little over 6 % (IEA, 2014). Nigeria has one of the lowest rates of electricity consumption per household in the world with only 655 kWh/household which can be compared to 7,752 kWh/household in Sweden or 12,305 kWh/household in USA (World Energy Council, 2014). Only 57.7 % of the population currently have access to electricity compared to 85.3% worldwide (World Bank, n.d.(a)). The population with access to electricity in the country face rolling blackouts and have to rely on private diesel generators to ensure uninterrupted electricity supply. (IEA, 2014). 2.3.1 Cooking sector In the Nigeria Demographic and Health Survey (NDHS) by the National Population Commission (2013) a nationwide sample was done to find out which cooking fuels Nigerians use in their households. The results show that fuelwood is the dominant type of fuel as it is used in 63.7 % of all households. Kerosene is the second most used with 25.5 % followed by 3.2 % of households that used charcoal. Natural gas/LPG (liquefied petroleum gas)/biogas and agricultural residue are only used in 2.3 % and 1.8 % of the cases respectively and the other sources of energy for cooking (electricity, coal/lignite, and animal dung) is used in less than 1 % of the households. 2.6 % stated that they don’t cook any food in their households. Ifegbesan et al.’s (2016) analysis of the findings in the NDHS report show that a statistically significant relationship exists between the cooking fuel used and socio-economic variables such as place of residence, geographical regions, access to electricity, educational level and wealth index. The authors also state that it isn’t surprising that fuelwood is the mostly used fuel for cooking as it is the cheapest, most affordable and easily available in Nigeria. Both gas and kerosene are not as easily available and are unaffordable for most rural households (Ifegbesan et

6
al., 2016). 2.3.2 Health impacts of household fuelwood use Indoor air pollution exists across Nigeria due to use of fuelwood and charcoal in open fires indoors and poor ventilation in homes (UNDP, 2015; Momodu et al., 2010). Smoke has been determined to have negative effects on human health and indoor air pollution is believed to be a major contributor to respiratory ailment (Anozie et al., 2006). Studies have linked smoke from the use of fuelwood with conditions such as acute respiratory infection, low birth weight, chronic obstructive pulmonary disease, cancer and eye infections. Smoke caused by burning of fuelwood is estimated to cause 95,000 deaths annually in Nigeria (UNDP, 2015). Women and children suffer physical damage from collecting stacks of firewood which normally weighs up to 35kg and this time-consuming task limits their opportunity to engage in income-generating tasks and receiving education (Momodu et al., 2010).
2.4 Policies considered in this study 2.4.1 NV 20:2020 Nigeria Vision 20:2020 (NV 20:2020) is a long-term economic transformation blueprint for stimulating the economic growth in the country and transforming Nigeria into one of the 20 largest economies in the world by 2020. The reference electricity demand projections presented in Table 1 are based on a projected moderate annual GDP growth of 7 % per annum. (Energy Commission of Nigeria, 2014).
Table 1. Sectoral Electricity Demand Projection set in NV 20:2020, Reference Scenario (TWh)
Sector 2015 2020 2025 2030
Industry 47.55 102.57 175.25 254.25
Households 55.73 103.25 198.74 294.17
Services 34.63 53.59 84.17 120.24 2.4.2 NREEEP The National Renewable Energy and Energy Efficiency Policy (NREEEP) focuses on electrification policies concerning renewable energy resources. The Renewable Energy part of the policy is intended to serve as a blueprint for the sustainable development, supply and utilization of the renewable energy sources hydropower, biomass, solar and wind. The policy addresses the

7
fact that on-going power sector reforms in Nigeria will only extend the national grid to rural areas which are close to main urban areas. Remote rural areas with a low demand density will have to depend on off-grid energy solutions and therefore the policy focuses on both on-grid and off-grid energy solutions. The energy efficiency part of the policy focuses on improvements in the efficiency of power utilization. The two parts together form a strategy to achieve cleaner and greener energy (Ministry of power, 2015). The renewable energy targets from NREEEP are presented in Table 2.
Table 2. Renewable energy targets set in NREEEP based on a reference growth of 7 % GDP/year (MW)
Resource 2015 2020 2030
Hydro (LHP) 2121 4549 4627
Hydro (SHP) 140 1607 8174
Solar 117 1343 6831
Biomass 5 57 292
Wind 55 631 3211 2.4.3 Nigerian INDCs Nigeria’s unconditional contribution to the global agreement on the reduction of greenhouse gas emissions, reached at the COP21 meeting in Paris, is 20 percent below the BAU scenario in the INDC. In their Intended Nationally Determined Contributions (INDC), Nigeria states that the country could reduce emissions with up to 45 per cent below BAU with international support, in the form of investments, technology and capacity building. The BAU scenario projects a CO2 emission of 900 mton CO2-eq in 2030 spread across the industry, oil and gas, agriculture and land use, electricity generation and transport sectors. Another key measure stated in the document is to end gas flaring by 2030 (INDC, 2015). 2.4.4 Clean cooking initiative The Nigerian Alliance for Clean Cookstoves (NACC) is a public-private partnership that intends to introduce 10 million fuel-efficient stoves to Nigerian households and institutions by 2020. This is intended to be done through policy change, quality certification of stoves, innovative financing and through communicating the value of fuel-efficient stoves at the grassroot level. Notable members of the Alliance are: Federal Ministry of Environment, Energy Commission of Nigeria, USAID and the International Centre for Energy, Environment & Development (Nigerian Alliance for Clean Cookstoves, 2015).

8
2.4.5 Agenda 2030 The SDGs are 17 goals aimed at ending poverty, protecting the environment and ensuring that all citizens can enjoy peace and prosperity by 2030. The SDGs will be guiding UNDP policy and funding in order to implement the actions necessary to achieve the goals (UNDP, 2017). SDG 7 aims at ensuring access to affordable, reliable, sustainable and modern energy for all by 2030. More specifically, one of the targets is to substantially increase the share of renewable energy in the global energy mix by 2030 (UNDP, n.d.(a)). SDG 13 focuses on the need to take urgent action to combat climate change and its impacts, with the conditions of the Paris agreement set as a guideline for each individual country (UNDP, n.d.(b)). SDG 15 targets sustainably managing forests, aiming to implement the sustainable management of all types of forests and halting deforestation (UNDP, n.d.(c)).

9
3. Method
The primary analysis of this quantitative study is to evaluate a potential transformation of the residential cooking sector in Nigeria. In the analysis, the current unsustainable use of fuelwood in this sector is replaced by alternative cooking solutions and the changes in deforestation rate, CO2 emissions and economic costs through this transformation is analysed. To achieve this, a representation of the cooking sector is modelled in OSeMOSYS (Open Source Energy Modelling System) (Howells et al., 2011). Ten different scenarios are created based on different cooking solutions, electricity production and electricity demand. OnSSET (Open Source Spatial Electrification Tool (Mentis et al., 2015)) is used as an analytical tool in this study to determine the reliability and interpret the possible implications of household electricity demand projected in Vision 20:2020.
3.1 Modelling tools 3.1.1 OnSSET OnSSET uses geospatial data to quantify the investment needs of increasing electrification and optimizing the allocation of which electrification technology types (grid, mini-grid, stand-alone solutions) to use (Mentis et al., 2015). OnSSET can also assess the increase in household electricity demand for the current non-electrified households for year 2030 based on assumptions of which electricity tier they reach by then. 3.1.1.1 Multi-tier of electricity This report will follow the definition of the multi-tier categorization of household electricity access proposed by the World Bank's Global Tracking Framework for Sustainable Energy for All (SE4ALL) which is also utilized in OnSSET (See Table 3). It is assumed that Tier 4 is the tier which allows for the use of electric stoves. Table 3. Mapping of tier of electricity consumption to indicative electric appliances (Nerini
et al., 2015)
Level of access
Tier 0 Tier 1 Tier 2 Tier 3 Tier 4 Tier 5
Indicative appliances powered
Torch and radio
Task lightning
General lightning
Small appliances
Medium or continuous appliances
Heavy or continuous appliances

10
3.1.2 OSeMOSYS OSeMOSYS is an open-source modelling tool developed for long-term energy planning. The model code is written in GNU MathProg and the tool is designed to be easily updated and modified to suit the needs of a particular analysis and allow the creation of different scenarios. OSeMOSYS models solely based on cost-optimization and does not consider environmental and social factors. However through the use of constraints, scenarios can be created in which OSeMOSYS is constrained to model based on e.g. an environmental friendly energy system mixture (Howells et al., 2011). 3.1.2.1 Reference Energy System of Nigeria The OSeMOSYS model uses a reference energy system (RES) to illustrate the process of how energy carriers move from raw material to be transformed into electricity and in this study, heat for cooking. The reference energy system illustrated in Figure 1 shows the fuels, technologies and demand interlinkages used for the modelling in OSeMOSYS. For simplification, all trade links with other countries have been neglected.
Figure 1: Reference energy system of Nigeria

11
3.2 Data 3.2.1 The Electricity Model Base for Africa The main source of data used for the energy modelling in OSeMOSYS comes from the model The Electricity Model Base for Africa (TEMBA). It includes data and projections for the electricity supply systems in forty-seven African countries including Nigeria for the years 2010 to 2050 (Taliotis et al., 2016). 3.2.2 Cooking Sector For the modelling of the cooking sector data from various Nigerian authorities is gathered. Another source of data and information comes from various reports about the Nigerian cooking sector. The cooking demand was calculated by using the estimate that 10 000 kJ is required per person per day for cooking (World Bank, 2015). With a population in 2015 of 182 201 960 (World Bank, n.d.(a)) and 52.22 % rural population (World Bank, n.d.(c)) the rural and urban cooking demand is determined to be 347.3 PJ and 317.7 PJ respectively. This demand is projected to grow with the percentage increase in population as projected on Worldometers (2017) until 2030 (See Table 4).
Table 4. Cooking demand projections (PJ)
Population 2015 2020 2025 2030
Rural 347.3 394.3 447.6 505.5
Urban 317.7 360.7 409.5 462.4 The cooking sector modelled in OSeMOSYS consists of fuelwood, kerosene, LPG, charcoal and electric stoves, following the shares from National Population Commission (2013). Fuelwood comes with it’s own singular supply chain. Kerosene and LPG fuels for cooking are converted from oil with a conversion factor of 0.91 for oil to kerosene (Seai, n.d.) and 0.926 for oil to LPG (Elgas n.d.; Ocean university, 2005). Charcoal is converted from traditional kilns with a conversion efficiency of 10 % (UNDP, 2013). Electricity for electric stoves is diverted from the total electricity supplied to households. Data inputs for the different stoves are presented in Table 5. The CO2 emissions from burning of fuelwood and charcoal are set to 0.1152 mton/PJ (FAO, n.d.; Quaschning 2015) and 0.0767 mton/PJ (Ocean University, 2005; Quaschning 2015) respectively.

12
For biomass the value is 0.11184 mton/PJ (EPA, 2015). In this analysis it is assumed that the trees used for production of these biofuels are not replanted and thereby not considered CO2-neutral.
Table 5. Data inputs for different stove types in OSeMOSYS Stove Type
Efficiency (%)
(Gujba et al., 2015)
Unit Capacity
(kW) (Gujba et al., 2015)
Operational Life (Years) (Gujba et al.,
2015)
Variable Cost (MUSD/PJ) (FAO, n.d.;
NCCMDP, n.d.; Ifegbesan et
al., 2016)
Capital Cost (MUSD/GW) (Gujba et. al,
2015)
Residual capacity
(GW) (National
Population Commission, 2013; NBS, 2012; World
Bank, n.d.(b))
Fuelwood 18 2 5 3.113 0.6 4.926
Charcoal 22 2 5 4.021 0.6 2.457
Kerosene 55 2 10 - 6.1 19.585
LPG 60 2.5 10 - 76.2 2.208
Electricity 95 2.5 10 - 76.2 0.384
3.3 Scenarios
A total of 10 different scenarios are created and are combined as presented below in Figure 2. The scenarios are modelled based on two different electricity production mixtures, a cost-optimized mixture from OSeMOSYS and an environmentally friendly mixture presented in NREEEP which corresponds with SDG 7 where one target is to substantially increase the share of renewable energy in the energy mix. The electricity demand is based on NV 20:2020 projections, with a reference and high growth demand based on projected GDP growth and OnSSET calibration. The cooking solutions are chosen based on their implications for the cooking sector, with a representative of different policies and projected developments of the sector (See Figure 2).
Figure 2: Scenarios. The scenarios will be combined as seen in the figure above

13
3.3.1 Electricity production The electricity production in the scenarios varies between being cost-optimized in OSeMOSYS to being constrained by the targets for renewable electricity in NREEEP. For the cost-optimized electricity production in OSeMOSYS the constraints on maximum activity levels of renewable technologies were retained from TEMBA. However for the NREEEP scenarios the constraints were removed due to the production levels being higher than the constraints in TEMBA. In this scenario the electricity production was modelled to produce the mixture precisely as listed in Table 2. 3.3.2 Electricity demand For the reference household electricity demand the Reference scenario in NV 20:2020 was considered. The Reference scenario is based on the prediction that the economy will develop on the basis of a BAU approach. The resulting overall annual growth rate for the total GDP is 7 % per annum. It is also stated that the increase in the growth rates of energy demand for the Reference scenario is due to increased access to electricity by all the sectors of the economy among other things (Energy Commission of Nigeria, 2014). This scenario is compared with the results obtained from OnSSET. The OnSSET calculations show that for the unelectrified population in Nigeria to reach Tier 3 by 2030 an increase in household electricity demand by 153 PJ is required. For Tier 4 and Tier 5 it is 396 PJ and 483 PJ respectively. Nigeria is an unequal country with a GINI index of 42.97 in 2014 (World bank, n.d.(d)) and where the richest 10 % of the population earned 38.9 % of Nigeria's total income (CIA, 2017). Based on this information, a tier for the unelectrified households that represents the inequalities should be found. The total projected household electricity demand in 2030 is 1060 PJ in the Reference scenario in Vision 20:2020. If the currently unelectrified population is assumed to reach Tier 3 by 2030, the electrified and the unelectrified population will use 85.6 % and 14.4 % respectively. In Tier 4 the division is 62.6 % to 37.4 % and in Tier 5 it is 54.4 % to 45.6 %. Tier 4 is therefore considered the most suitable tier to show the inequality in the country. The current electrified population consumes the remaining 664 PJ of the total household electricity demand (1060 PJ) in the Reference scenario of NV 20:2020. However, we argue that the Reference scenario in NV 20:2020 where everyone has reached tier 4 by 2030 according to the OnSSET calculations, should be considered as a high growth scenario. A more plausible reference scenario would be that the unelectrified population reaches Tier 3 by 2030 (153 PJ) while the electrified population consumes the same share as for Tier 4 above (62.6 % to 37.4 %) with 257 PJ. The electricity demand for the household sector in the Reference scenario is shown in Table 6 below and in Table 1 for the High growth scenario.
14
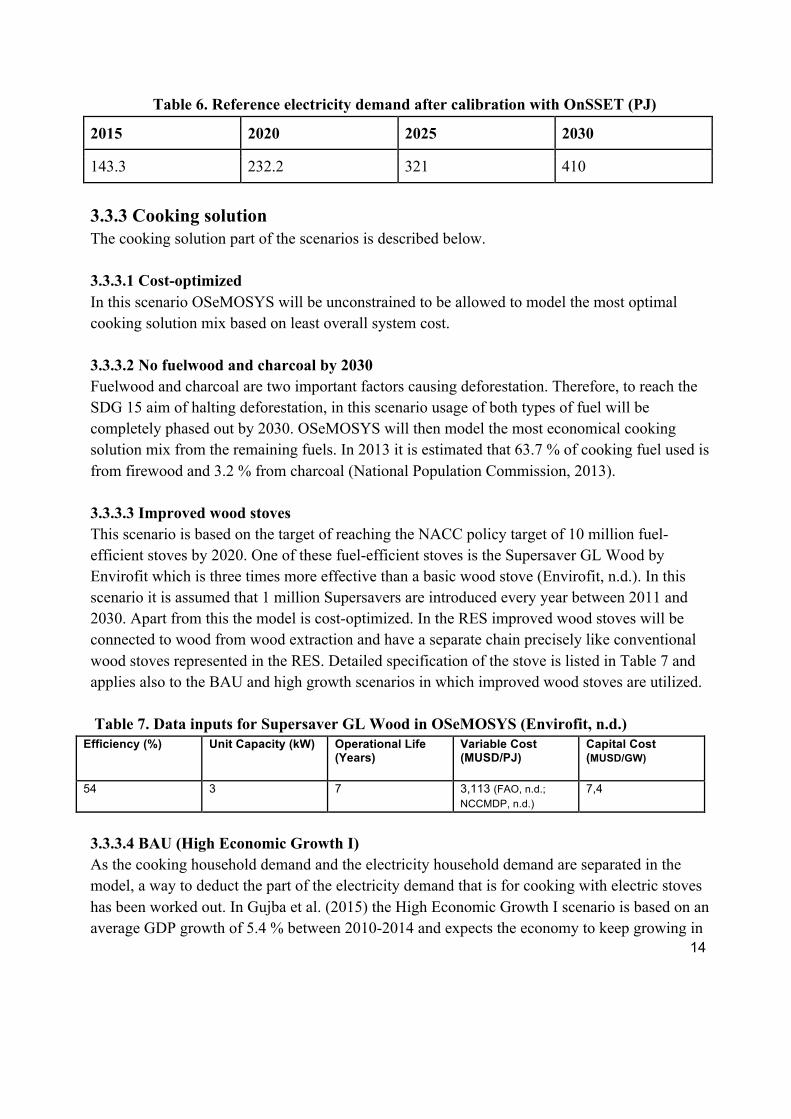
Table 6. Reference electricity demand after calibration with OnSSET (PJ)
2015 2020 2025 2030
143.3 232.2 321 410
3.3.3 Cooking solution The cooking solution part of the scenarios is described below. 3.3.3.1 Cost-optimized In this scenario OSeMOSYS will be unconstrained to be allowed to model the most optimal cooking solution mix based on least overall system cost. 3.3.3.2 No fuelwood and charcoal by 2030 Fuelwood and charcoal are two important factors causing deforestation. Therefore, to reach the SDG 15 aim of halting deforestation, in this scenario usage of both types of fuel will be completely phased out by 2030. OSeMOSYS will then model the most economical cooking solution mix from the remaining fuels. In 2013 it is estimated that 63.7 % of cooking fuel used is from firewood and 3.2 % from charcoal (National Population Commission, 2013). 3.3.3.3 Improved wood stoves This scenario is based on the target of reaching the NACC policy target of 10 million fuel-efficient stoves by 2020. One of these fuel-efficient stoves is the Supersaver GL Wood by Envirofit which is three times more effective than a basic wood stove (Envirofit, n.d.). In this scenario it is assumed that 1 million Supersavers are introduced every year between 2011 and 2030. Apart from this the model is cost-optimized. In the RES improved wood stoves will be connected to wood from wood extraction and have a separate chain precisely like conventional wood stoves represented in the RES. Detailed specification of the stove is listed in Table 7 and applies also to the BAU and high growth scenarios in which improved wood stoves are utilized. Table 7. Data inputs for Supersaver GL Wood in OSeMOSYS (Envirofit, n.d.)
Efficiency (%)
Unit Capacity (kW)
Operational Life (Years)
Variable Cost (MUSD/PJ)
Capital Cost (MUSD/GW)
54 3 7 3,113 (FAO, n.d.; NCCMDP, n.d.)
7,4
3.3.3.4 BAU (High Economic Growth I) As the cooking household demand and the electricity household demand are separated in the model, a way to deduct the part of the electricity demand that is for cooking with electric stoves has been worked out. In Gujba et al. (2015) the High Economic Growth I scenario is based on an average GDP growth of 5.4 % between 2010-2014 and expects the economy to keep growing in

15
the short to medium term. In our modelling, this will be the BAU scenario as by reducing the electricity demand from the Reference scenario in Vision 20:2020 based on a GDP growth of 7 % (See 3.3.2.) we argue that the GDP for the BAU scenario is also reduced and corresponds with the 5.4 % in the High Economic Growth 1 scenario. In this scenario Gujba assumes that the use of LPG and kerosene stoves will increase, but that electricity stoves are used in 0.1 % of all cases (See Table 8). This is because it isn’t reasonable for everyone to have an electric stove with the unreliable power situation in the country. The electricity used by electric stoves is deducted from the electricity household demand. Table 8. Cooking solution mixture in High Economic Growth I (Gujba et al., 2015)
Stove 2020 (%) 2030 (%)
Fuelwood 62.9 54.2
Charcoal 2.8 2.8
Electricity 0.1 0.1
Kerosene 19.0 23.3
LPG 13.0 17.3
Improved wood stove
0.9 1.1
3.3.3.5 High growth (High Economic Growth II) This scenario explores the implications of a high GDP growth in which electricity demand follows the demand in Table 1. In this scenario Gujba et al. (2015) projects the electricity sector to grow rapidly and an increase in electricity access across the country with 75 % of households electrified by 2025, indicating a possibility for Nigeria to be completely electrified by 2030. In this scenario it is plausible that residents in mostly urban parts of Nigeria will switch to electricity for cooking. It is therefore estimated that 26 % of the cooking demand will be met by electric stoves by 2030. With the current high poverty levels, it is estimated that fuelwood will continue to dominate, especially in rural areas (Gujba et al., 2015). The electricity used by electric stoves is deducted from the electricity household demand.

16
Table 9. Cooking solution mixture in High Economic Growth II (Gujba et al., 2015)
Stove 2020 (%) 2030 (%)
Fuelwood 63.9 46.9
Charcoal 2.8 2.8
Electricity 12.9 25.7
Kerosene 10.5 10.5
LPG 0.2 0.2
Improved wood stove
8.5 12.8
3.4 Deforestation rate analysis Afi River Forest Reserve is a tropical rainforest located in Cross River State and in a study Aigbe et al. (2014) concluded that the forest has a merchantable volume of 1536 m3/hectare. Pycnathus angolensis is the richest individual species with 29 trees per hectare representing 9.5 % of the total amount of trees per hectare. It is assumed that all trees in the forest are pycnathus angolensis, which has the density of 456 kg/m3 (Kryn & Fobes, 1959). The merchantable volume and the density results in the mass per hectare of 700 416 kg/hectare. This value is assumed to represent the overall composition of vegetation in Nigeria. Through converting the extractions of wood from PJ to kg for the fuelwood, improved wood stoves as well as for charcoal production by using the energy content in 1 kg of wood (FAO, n.d.) the deforestation rate in hectares could be calculated.

17
4. Results and analysis 4.1 Optimal electricity mix Comparing the optimal fuel and technology mix for cost-optimized electricity production and the one based on NREEEP (See Figure 3 and 4 respectively) shows a much richer utilization of different energy resources in the NREEEP case. In the cost-optimized case, coal is completely dominant, with run-of-river hydro and oil fired gas turbine the only other two technologies used until 2025 when solar rooftop PV in rural areas and concentrated solar power (CSP) are utilized. The NREEEP electricity production follows the allocation of renewables shown in Table 2.
Figure 3: Optimal electricity mix cost-optimized in OSeMOSYS

18
Figure 4: Optimal electricity mix based on renewable energy targets set in NREEEP 4.2 Cooking solutions The distribution of cooking solutions for the different scenarios is shown below in Figure 5. Figure 5a indicates that fuelwood stoves are the most cost-optimal for cooking. When use of fuelwood is constrained, the second most cost-effective alternative is the use of LPG stoves as shown in Figure 5b. The short presence of electric stoves in 5b and 5c can be due to the residual capacity built in electric stoves and the need to reinvest in LPG stoves due to the end of operational life.

19
(a) Cost-optimized (b) NREEEP - No fuelwood and charcoal
(c) Cost-optimized - No fuelwood and charcoal (d) Improved wood stoves Figure 5: Production of cooking solutions in different scenarios 4.3 Costs The total discounted costs for the years 2015-2030 of different scenarios are presented in Table 10 below. Total discounted costs for the NREEEP electricity production scenarios were very similar compared to the cost-optimized ones from OSeMOSYS. For the High growth scenario, NREEEP was more economical than the electric mixture cost-optimized through OSeMOSYS. This can be attributed to the high electric stove utilization in the High growth scenario. With the low electricity generation cost of hydroelectric power plants, it is very economically beneficial to produce electricity through this source. As previously mentioned, in the cost optimization of electricity production, an upper limit was set on annual activity for the different renewable power generation options based on data from TEMBA. This was removed in the NREEEP scenarios in which generation of renewable technologies was calibrated to follow the amount stated in NREEEP, leading to an increase in hydroelectric power plant production.

20
Table 10. Total discounted costs for the modelled electricity production, distribution- and
cooking systems in the different scenarios during 2015-2030
Electricity production
Electricity demand Cooking solution Total discounted cost (BUSD)
Cost-optimized
Reference
Cost-optimized 213.94
No fuelwood and charcoal
252.60
Improved wood stoves
216.1
BAU 266.34
High growth High growth 306.80
NREEEP
Reference
Cost-optimized 220.00
No fuelwood and charcoal
261.47
Improved wood stoves
221.5
BAU 236.98
High growth High growth 289.21
4.4 CO2 emissions Taking the emissions of the entire modelling period 2015-2030 into account, electricity production by NREEEP reduces CO2 emissions by approximately 30 % for all scenarios compared to the cost-optimized electricity production in OSeMOSYS.

21
Table 11. Total emissions 2015-2030 from different scenarios
Electricity production
Electricity demand Cooking solution Emissions (Mton CO2-eq)
Cost-optimized
Reference
Cost-optimized 5590.2
No fuelwood and charcoal
5756.1
Improved wood stoves
5337.9
BAU 5675.1
High growth High growth 6745.0
NREEEP
Reference
Cost-optimized 3995.5
No fuelwood and charcoal
4169.4
Improved wood stoves
3743.1
BAU 4080.4
High growth High growth 4805.8
From the emission diagrams for the different scenarios the scenario which emits the least amount of CO2 in 2030 for both electricity production based on NREEEP and cost-optimized in OSeMOSYS is the Improved wood stoves scenario. NREEEP in combination with improved wood stoves leads to CO2 emissions of 296.3 mton CO2-eq in 2030. The highest emissions are from the cost-optimized High growth scenario with emissions of 638.5 mton CO2-eq in 2030.

22
Figure 6: CO2 emissions for cost-optimized electricity production scenarios
0
100
200
300
400
500
600
700
2015 2016 2017 2018 2019 2020 2021 2022 2023 2024 2025 2026 2027 2028 2029 2030
Emission
s(MtonCO
2-eq
)
Improvedwoodstoves Nofuelwoodandcharcoal Highgrowth
BAU Cost-op_mized

23
Figure 7: CO2 emissions for scenarios based on electricity production by NREEEP
4.5 Deforestation rate In Figure 8 the deforestation rate for the different scenarios are presented. Comparing the Improved wood stoves scenario with the Cost-optimized scenario approximately 126 000 hectares of forest would be saved with the implementation of improved wood stoves in 2030 alone. The High growth scenario leads to a reduction in deforestation by 24 000 hectares in 2030 compared to BAU, mainly attributed to the use of electric stoves in the former scenario. The deforestation rate in 2015 in the No fuelwood and charcoal scenario was 302 000 hectares which can be compared to the reported deforestation rate (410 000 hectares per year) in the country. This would mean that fuelwood accounts for 74 % of all deforestation in Nigeria today which can be compared to the 32 % in the social survey by UNREDD in Cross River State.
0
100
200
300
400
500
600
700
2015 2016 2017 2018 2019 2020 2021 2022 2023 2024 2025 2026 2027 2028 2029 2030
Emission
s(MtonCO
2-eq
)
Improvedwoodstoves Nofuelwoodandcharcoal Highgrowth
BAU Cost-op_mized

24
(a) Cost-optimized (b) No fuelwood and charcoal
(c) Improved wood stoves (d) BAU
(e) High growth
Figure 8: Deforestation rate in different scenarios Nigeria had approximately 7 million hectares of forests in 2015 (9 million in 2010 and a loss of 410 000 hectares per year) indicating that the remaining forests in Nigeria would be gone by 2030 in the Cost-optimized scenario. In the Improved wood stoves, BAU and High growth scenarios there would be less than 1 million hectares remaining in 2030. In the No fuelwood and charcoal scenario there would still be over 6 million hectares of forest remaining in 2030 when all of the wood use is phased out.

25
5. Discussion and conclusion In their INDC, Nigeria's aim is to reduce the BAU emissions by 20 % unconditionally and 45 % with international support by 2030. As there are no total emissions stated in the INDC for the years 2015-2030, this study compares the emissions modelled in OSeMOSYS for the end year 2030. In the INDC BAU scenario, Nigeria projects emissions of 900 mton CO2-eq in 2030. However, this also considers emissions from the transport sector and agriculture which are neglected in the model. In the BAU scenario of our study the results project emissions of 328.8 mton CO2 for electricity production by NREEEP and 512.7 mton CO2 for cost-optimized electricity production in OSeMOSYS in 2030. None of the other scenarios manages to reduce the BAU emissions by 20 %, with the only decrease in emissions coming from the improved wood stoves scenarios in which the scenario with electricity production by NREEEP was 9.9 % less compared to BAU and 6.2 % less for the cost-optimized electricity production in OSeMOSYS. Interestingly, emissions in 2030 for the No fuelwood and charcoal scenario are higher than BAU for electricity production by NREEEP and cost-optimized electricity production. This is because LPG stoves, which is accompanied with high emissions, overtakes all cooking when fuelwood and charcoal are unavailable. This shows that the eradication of woodburning does not immediately break the trend in increased emissions. In other words, it indicates that reaching SDG 15 could be in conflict with reaching SDG 13 in the context of cooking energy. All the results ensure access to reliable energy as the energy demand is met in all scenarios, but as a lot of the energy comes from coal and fuelwood it cannot be considered sustainable. For the share of energy to be mainly renewable the targets in policies such as NREEEP have to be higher. None of the scenarios except No fuelwood and charcoal are able to decrease the deforestation rate in Nigeria. This shows the importance of Nigeria moving away from wood for cooking. According to the results the implementation of improved wood stoves is more economically beneficial than in the BAU case, which can be attributed to the low cost of fuelwood and relative high efficiency of the Supersaver GL Wood stove. The capital cost used for the Supersaver GL Wood stove is based on the retail price of individual stoves. There is a possibility that there are better woodstoves alternatives with regards to cost and efficiency. With the environmental benefits that these stoves can bring, negotiations for the stove supplier could even be held at governmental level with the involvement of international competitors to ensure the choice of the most efficient stove at the lowest price. It is clear that the scenarios with a lot of fuelwood are the cheapest, but from a socio-economic view it is important to include the value of the forests, for instance. Assuming 14 000 USD/hectare and 1900 USD/hectare for the replacement cost method and the expected damage function approach respectively (Barbier, 2016) the value of the wood saved would be significant.

26
An example is the 126 000 hectares of wood saved in the Improved wood stoves scenario that could be worth up to approximately 175 MUSD in annual welfare loss using the replacement cost method and 23 MUSD using the expected damage function approach. The value varies a lot depending on the method used, but both values indicate that Nigeria could benefit from a shift away from the use of wood for cooking. This analysis lies outside of the scope of the study, but is a future interesting study area in Nigeria would be the valuation of forests to be able to internalize the environmental damage in cost-based energy modelling such as OSEMOSyS. It should be noted that the deforestation rate results could have been lower if there was nationwide data on tree density available. The results on deforestation are based on data in the tropical rainforest Afi River Forest Reserve in Cross River, which is denser than the average tree density in Nigeria and not representative for the whole country, especially the northern parts of the country. This study has shown how changes in the energy sector has an impact on the climate and land sectors. However, it should be noted that due to the lack of data access there are inevitable limitations with this report and it’s results. For the Improved wood stoves scenario, we have assumed that only one type of wood stove is used, a more realistic scenario would be a mixture of different stoves, including improved charcoal, LPG and kerosene stoves. For future studies, we recommended to expand the scope and detail of the Improved wood stoves scenario as the results indicates that it has huge potential from an environmental and economical perspective. Another relevant area for future studies is to enforce OSeMOSYS to create an optimal cooking sector based on environmental factors using parameters such as emission penalty. Nigeria has one of the highest deforestation rates in the world and is one the most vulnerable countries when it comes to climate change. Therefore the report focuses on the interlinkages between energy, climate and land. The results show that the scenarios with NREEEP led to a 30 % reduction in CO2 emissions compared to those in the cost-optimized scenarios. The results on deforestation show that the forest will be gone or almost gone by 2030 both in the most cost-optimal solutions as well as in the business as usual and high growth projections of the future. Therefore it is important for Nigeria to implement measures to decrease deforestation immediately.

27
6. References Aigbe H.I, Akindele S.O., Onyekwelu J.C., Tree Species Diversity and Density Pattern in Afi River Forest Reserve, Nigeria, International Journal of Scientific & Technology Research, 3(10), 2014 Anozie A.N., Bakare A.R., Sonibare J.A. and Oyebisi T.O., Evaluation of cooking energy cost, efficiency, impact on air pollution and policy in Nigeria, Energy, 32, 1283-1290, doi: 10.1016/j.energy.2006.07.004, 2007 Ayanlade A. and Drake N., Forest loss in different ecological zones of the Niger Delta, Nigeria: evidence from remote sensing, Geojournal, 81 (5), 717-735, doi: 10.1007/s10708-015-9658-y Barbier, B. E., The protective service of mangrove ecosystems: A review of valuation methods, Marine Pollution Bulletin, 109, 676-681, 2016 Biomass research report 1401, 2014, The impact of oil exploration, extraction and transport on mangrove vegetation and carbon stocks in Nigeria. CBD, 2015, Nigeria Fifth National Biodiversity Report (Convention on Biological Diversity). CIA, 2017, The world factbook - Nigeria, URL: https://www.cia.gov/library/publications/the-world-factbook/geos/ni.html (viewed 2017-05-18) Doyle, 2016, Global warming to breach 2C limit by 2050 unless tougher action: study, URL: http://www.reuters.com/article/us-climatechange-emissions-idUSKCN11Z2AO (viewed 2017-05-22) EIA, 2016, Nigeria, URL: https://www.eia.gov/beta/international/analysis.cfm?iso=NGA (viewed 2017-05-01) Elgas, n.d., LPG Conversions, URL: http://www.elgas.com.au/blog/389-lpg-conversions-kg-litres-mj-kwh-and-m3 (viewed 2017-05-22) Enaruvbe G. O. and Atafo O.P., Analysis of Deforestation Pattern in the Niger Delta Region of Nigeria, Journal of Land Use Science, 11, 111-130, 2014 Energy Commission of Nigeria, 2014, Energy implications of vision 20:2020 and beyond. Envirofit, n.d., Supersaver GL Wood, URL: http://envirofit.org/product/cookstoves/supersaver-gl-wood/ http://documents.worldbank.org/curated/en/603241469672143906/Global-tracking-framework (viewed 2017-05-20) EPA, 2013, Climate impacts, URL: https://www.epa.gov/climate-impacts/climate-impacts-energy (viewed 2017-03-13) EPA, 2015, Emission Factors for Greenhouse Gas Inventories, URL: https://www.epa.gov/sites/production/files/2015-07/documents/emission-factors_2014.pdf (viewed 2017-05-22) FAO, n.d., Definitions, Conventions and Convention Factors, URL: http://www.fao.org/docrep/x2740e/x2740e05.htm (viewed 2017-05-21)

28
FAO, 2016a, Water Uses, URL: http://www.fao.org/nr/water/aquastat/water_use/index.stm (viewed 2017-04-11) FAO, 2016b, Nigeria, URL: http://www.fao.org/nr/water/aquastat/countries_regions/NGA/ (viewed 2017-03-15) GIZ, 2015, The Nigerian Energy Sector An Overview with a Special Emphasis on Renewable Energy, Energy Efficiency and Rural Electrification. Gujba, H., Mulugetta, Y. and Azapagic, A., The Household Cooking Sector in Nigeria: Environmental and Economic Sustainability Assessment, Resources, 4, 412-433, doi:10.3390/resources, 2015
Howells, M., Rogner, H., Strachan, N., Heaps, C., Huntington, H., Kypreos, S., Hughes, A., Silveira, S., DeCarolis, J., and Bazillian, M., OSeMOSYS: The Open Source Energy Modeling System: An Introduction to Its Ethos, Structure and Development, Energy Policy, Sustainability of biofuels, 39, no. 10, 5850–70, doi:10.1016/j.enpol.2011.06.033, 2011 IEA, 2014, Nigeria: Balances for 2014, URL: https://www.iea.org/statistics/statisticssearch/report/?country=NIGERIA&product=balances&year=2014 (viewed 2017-04-11) Ifegbesan, A. F., Rampedi, I. T. and Annegarn H. J., Nigerian households' cooking energy use, determinants of choice, and some implications for human health and environmental sustainability, Habitat International, 55, 17-24, 2016 INDC, 2015, Nigeria´s intended nationally determined contribution. Kryn, J.M. & Fobes, E.W. The Woods of Liberia. Forest Products Laboratory Document No. 2159, Forest Service, U.S. Department of Agriculture. 1959. KTH, 2015, CLEWs- Climate, Land, Energy and Water strategies to navigate the nexus, URL: https://www.kth.se/en/itm/inst/energiteknik/forskning/desa/researchareas/clews-climate-land-energy-and-water-strategies-to-navigate-the-nexus-1.432255 (viewed 2017-04-11) Mentis, D., Welsch, M., Fuso-Nerini, F. Broad, O., Howells, M., Bazilian, M., Rogner, H., A GIS-based approach for electrification planning—A case study on Nigeria. Energy for Sustainable Development, 29:142-150, 2016 Ministry of power, 2015, National renewable and energy efficiency policy (NREEEP). Mobolaji A.I. and Olajumoke A.M., Wild fauna conservation in Nigeria, Environment and natural resources research, 5(3), 2015, doi:10.5539/enrr.v5n3p98 Momodu A.S., Akinbami J-F. K. and Akinwunmi I.O., Environmental and health implications of fuel substitution for cooking energy in Nigeria´s household energy mix, Energy & Environment, 21(8), 2010 National population Commission, 2013, Nigeria Demographic and Health Survey. NBS, 2012, Annual Abstract of Statistics.

29
Nerini, F. F., Oliver B., Dimitris M., Manuel W., Morgan B., and Mark H., A Cost Comparison of Technology
Approaches for Improving Access to Electricity Services, Energy 95, 255–65, doi:10.1016/j.energy.2015.11.068, 2016 NHDS, 2013, Nigeria demographic and health survey. Nigerian Alliance for Clean Cookstoves, 2015, Nigeria's silent energy crisis, URL: http://nigeriacleancooking.org/wp-content/uploads/2015/01/Nigeria-Alliance-for-Clean-Coostove-2Pager.pdf (viewed 2017-05-20) NNPC, 2016, Oil Production, URL: http://www.nnpcgroup.com/nnpcbusiness/upstreamventures/oilproduction.aspx (viewed 2017-03-13) Ocean University, 2005, Biomass Energy, URL: https://www.ocean.washington.edu/courses/envir215/energynumbers.pdf (viewed 2017-05-21) OCED, 2012, Environmental outlook to 2050: The consequences of inaction. Ohajianya A.C., Abumere O.E., Owate I.O., Osarolube E., Erratic power supply in Nigeria: Causes and solutions, International journal of engineering science invention, 3(7), 2014 Oluduro O.F. and Gansu G.N., A Critical Appraisal of the Legal Regime for Biodiversity Conservation in Nigeria, Canadian Social Science, 8, 249-257, doi: 10.3968/j.css.1923669720120804.3020, 2012 Park, C.C., 1992, Tropical rainforest, New York: Routledge. Quaschning V., 2015, Statistics- Specific carbon dioxide emissions of various fuels, URL: https://www.volker-quaschning.de/datserv/CO2-spez/index_e.php (viewed 2017-05-21) Seai, n.d., Energy Consumption Calculator. Taliotis, C., Shivakumar, A., Ramos, E., Howells, M., Mentis, D., Sridharan, V., Broad, O., Mofor, L., An indicative analysis of investment opportunities in the African electricity supply sector — Using TEMBA (The Electricity Model Base for Africa), Energy for Sustainable Development, 31: 50-66, 2016. UNDESA, 2014, Water and Food Security, URL: http://www.un.org/waterforlifedecade/food_security.shtml (viewed 2017-03-13) UNDESA, 2015, World population projected to reach 9.7 billion by 2050, URL: http://www.un.org/en/development/desa/news/population/2015-report.html (viewed 2017-03-13) UNDP, 2013, Nationally Appropriate Mitigation Action Study on Sustainable Charcoal in Uganda, URL: http://www.undp.org/content/dam/undp/library/Environment%20and%20Energy/MDG%20Carbon%20Facility/CharcoalNAMAstudy_9Jan2013.pdf (viewed 2017-05-29) UNDP, 2015, Sustainable Fuelwood Management in Nigeria.

30
UNDP, 2017, Sustainable development goals, URL: http://www.undp.org/content/undp/en/home/sustainable-development-goals.html (viewed 2017-05-27) UNDP, n.d.(a), Goal 7: Ensure access to affordable, reliable, sustainable and modern energy for all, URL: http://www.un.org/sustainabledevelopment/energy/ (viewed 2017-05-27) UNDP, n.d.(b), Goal 13: Take urgent action to combat climate change and its impacts, URL: http://www.un.org/sustainabledevelopment/climate-change-2/ (viewed 2017-05-27) UNDP, n.d.(c), Goal 15: Sustainably manage forests, combat desertification, halt and reverse land degradation, halt biodiversity loss, URL: http://www.un.org/sustainabledevelopment/biodiversity/ (viewed 2017-05-27) UNFCCC, 2015, Nigeria’s Intended Nationally Determined Contribution, URL: http://www4.unfccc.int/submissions/INDC/Published%20Documents/Nigeria/1/Approved%20Nigeria's%20INDC_271115.pdf (viewed 2017-04-18) UNREDD (Department of Forestry), 2015, Study on the Drivers of Deforestation and Forest Degradation in Cross River State. Uyanga, J., The plantation economy in the Calabar region: a preliminary analysis. In Calabar and Environs: Geographic Studies, Dept. of Geography, University of Calabar, 1980 WEC, 2007, Deciding the Future: Energy policy scenarios to 2050. WEC, 2016, Average electricity consumption per electrified household, URL: https://www.wec-indicators.enerdata.eu/household-electricity-use.html (viewed 2017-05-20) World Bank, n.d.(a), Population, total, URL: http://data.worldbank.org/indicator/SP.POP.TOTL?locations=NG (viewed 2017-05-20) World Bank, n.d.(b), Access to electricity (% of total population), URL: http://data.worldbank.org/indicator/EG.ELC.ACCS.ZS (viewed 2017-03-20) World Bank, n.d.(c), Rural Population (% of total population) URL: http://data.worldbank.org/indicator/SP.RUR.TOTL.ZS?locations=NG (viewed 2017-05-22) World Bank, n.d.(d), GINI index, URL: http://data.worldbank.org/indicator/SI.POV.GINI? (viewed 2017-05-22) World Bank, 2015, Beyond Connections- Energy Access Redefined. World Energy Council, 2007, Deciding the Future: Energy Policy Scenarios to 2050 Worldometers, 2017, Nigeria Population, URL: http://www.worldometers.info/world-population/nigeria-population/ (viewed 2017-05-22)

TRITA -IM-KAND 2017:18
www.kth.se