analysis of crude oil vapor pressures at the u.s ... · 3 sand2005-4322 unlimited release printed...
TRANSCRIPT

SANDIA REPORT
SAND2005-4322 Unlimited Release Printed August 2005) Analysis of Crude Oil Vapor Pressures at the U.S. Strategic Petroleum Reserve
David Lord and David Rudeen
Prepared by Sandia National Laboratories Albuquerque, New Mexico 87185 and Livermore, California 94550 Sandia is a multiprogram laboratory operated by Sandia Corporation, a Lockheed Martin Company, for the United States Department of Energy’s National Nuclear Security Administration under Contract DE-AC04-94AL85000. Approved for public release; further dissemination unlimited.

2
Issued by Sandia National Laboratories, operated for the United States Department of Energy by
Sandia Corporation.
NOTICE: This report was prepared as an account of work sponsored by an agency of the United States Government. Neither the United States Government, nor any agency thereof, nor any of their employees, nor any of their contractors, subcontractors, or their employees, make any warranty, express or implied, or assume any legal liability or responsibility for the accuracy, completeness, or usefulness of any information, apparatus, product, or process disclosed, or represent that its use would not infringe privately owned rights. Reference herein to any specific commercial product, process, or service by trade name, trademark, manufacturer, or otherwise, does not necessarily constitute or imply its endorsement, recommendation, or favoring by the United States Government, any agency thereof, or any of their contractors or subcontractors. The views and opinions expressed herein do not necessarily state or reflect those of the United States Government, any agency thereof, or any of their contractors. Printed in the United States of America. This report has been reproduced directly from the best available copy. Available to DOE and DOE contractors from
U.S. Department of Energy Office of Scientific and Technical Information P.O. Box 62 Oak Ridge, TN 37831 Telephone: (865)576-8401 Facsimile: (865)576-5728 E-Mail: [email protected] Online ordering: http://www.osti.gov/bridge
Available to the public from
U.S. Department of Commerce National Technical Information Service 5285 Port Royal Rd Springfield, VA 22161 Telephone: (800)553-6847 Facsimile: (703)605-6900 E-Mail: [email protected] Online order: http://www.ntis.gov/help/ordermethods.asp?loc=7-4-0#online

3
SAND2005-4322 Unlimited Release
Printed August 2005
Analysis of Crude Oil Vapor Pressures at the
U.S. Strategic Petroleum Reserve
David Lord Geotechnology & Engineering Department
Sandia National Laboratories P.O. Box 5800
Albuquerque, NM 87185
David Rudeen GRAM, Inc.
8500 Menaul Blvd., NE, Suite B-335 Albuquerque, NM 87112
Abstract
Crude oil storage caverns at the U.S. Strategic Petroleum Reserve (SPR) are solution-mined from subsurface salt domes along the U.S. Gulf Coast. While these salt domes exhibit many attractive characteristics for large-volume, long-term storage of oil such as low cost for construction, low permeability for effective fluids containment, and secure location deep underground, they also present unique technical challenges for maintaining oil quality within delivery standards. The vapor pressures of the crude oils stored at SPR tend to increase with storage time due to the combined effects of geothermal heating and gas intrusion from the surrounding salt. This presents a problem for oil delivery offsite because high vapor-pressure oil may lead to excessive atmospheric emissions of hydrocarbon gases that present explosion hazards, health hazards, and handling problems at atmospheric pressure. Recognizing this potential hazard, the U.S. Department of Energy, owner and operator of the SPR, implemented a crude oil vapor pressure monitoring program that collects vapor pressure data for all the storage caverns. From these data, DOE evaluates the rate of change in vapor pressures of its oils in the SPR. Moreover, DOE implemented a vapor pressure mitigation program in which the oils are degassed periodically and will be cooled immediately prior to delivery in order to reduce the vapor pressure to safe handling levels. The work described in this report evaluates the entire database since its origin in 1993, and determines the current levels of vapor pressure around the SPR, as well as the rate of change for purposes of optimizing both the mitigation program and meeting safe delivery standards. Generally, the rate of vapor pressure increase appears to be lower in this analysis than reported in the past and, problematic gas intrusion seems to be limited to just a few caverns. This being said, much of the current SPR inventory exceeds vapor pressure delivery guidelines and must be degassed and cooled in order to meet current delivery standards.

4

5
Table of Contents
1 Executive Summary ................................................................................................................ 9
1.1 Primary Findings............................................................................................................ 9 1.1.1 Data Confidence...................................................................................................... 9 1.1.2 Flowing Versus Downhole Sampling ................................................................... 10 1.1.3 Measuring Methane Regain .................................................................................. 10 1.1.4 Current Rates of BPP and GOR Rise on Cavern and Stream Basis ..................... 11
2 Introduction........................................................................................................................... 12
2.1 History of Vapor Pressure Monitoring at SPR ............................................................ 12 2.1.1 BPP Impacts on Air Quality Modeling................................................................. 13 2.1.2 Predicting GOR in SPR Oils................................................................................. 13
2.2 Scope of Report............................................................................................................ 14 3 Methodology......................................................................................................................... 16
3.1 Direct Measurements ................................................................................................... 16 3.1.1 TVP-95.................................................................................................................. 16 3.1.2 TVP-2000.............................................................................................................. 17 3.1.3 Sample Acquisition............................................................................................... 18
3.2 Numerical Analyses ..................................................................................................... 19 4 Intrusion Rates ...................................................................................................................... 20
4.1 Interpretation of Gas Regain in Terms of Reservoir Depletion Modeling .................. 21 4.2 Discussion of Degas Outlet Stream Properties ............................................................ 23 4.3 Flowing Versus Downhole Sample Testing ................................................................ 26
4.3.1 Interpreting the Latest Data Relative to Historical Values ................................... 27 4.3.2 Insight to Cavern Oil Heterogeneity from Degasification Reports ...................... 29
4.4 Identifying Regain through Changes in Oil Composition ........................................... 33 4.5 Results of Regain Analysis .......................................................................................... 36 4.6 Analysis of GOR Regain ............................................................................................. 42
5 Summary ............................................................................................................................... 45
6 Acknowledgements............................................................................................................... 46
7 References............................................................................................................................. 46
Appendix BPP............................................................................................................................... 48
Appendix GOR ............................................................................................................................. 60

6
List of Figures
Figure 3-1. Schematic of Major Conceptual Elements of the TVP-95 Instrument System..........16
Figure 3-2. Schematic of Major Conceptual Elements of the TVP-2000 Instrument System......17
Figure 4-1. Typical BPP Response after Degas Represented by BM111......................................22
Figure 4-2. Degas II Inlet and Outlet BPP Measurements Using the TVP-2000 Grabner for (a) BH 108 and (b) BH113. ........................................................................................25
Figure 4-3. Schematic of Typical Big Hill Cavern Annotated to Illustrate String Configuration for Degasification (Reproduced from DOE, 1981). ............................30
Figure 4-4 Degas Plant Inlet and Outlet BPP Measurements for (a) BH108 (b) BH113 (c) BH103 and (d) BH101 Using the TVP-2000 Grabner. Horizontal red lines mark regions of constant BPP possibly indicating layering of oil with in cavern......32
Figure 4-5. Gas and Whole Oil Composition Comparisons for BH108 and BH109....................34
Figure 4-6. Gas Composition Histories and Component Profiles for BM114..............................35
Figure 4-7. BH103 Gas and Whole Oil Compositions for Degas Plant II Inlet and Outlet Streams. ......................................................................................................................36
Figure 4-8. Linear Least Squares Fit to BP Pressures at Bryan Mound, Big Hill, West Hackberry and Bayou Choctaw. .................................................................................37
Figure 4-9. Projected BP Pressures at 100oF for Sweet and Sour Streams at Big Hill, Bryan Mound, West Hackberry and Bayou Choctaw. Lower curve is best estimate. Upper curve is a 2σ upper bound. ..............................................................................41
Figure 4-10. Aggregated GOR Versus BP Pressure Data from All Caverns with Linear and Non-linear Bryan Mound Regression Fits. .................................................................43
Figure 4-11. Projected GOR at 100oF for Sweet and Sour Streams at Big Hill, Bryan Mound, West Hackberry and Bayou Choctaw. Lower curve is best estimate. Upper curve is a 2σ upper bound. ..............................................................................44
Figure BPP-1. Big Hill BPP and Transfer Histories with Linear Regression Fit. ........................52
Figure BPP-2. Bryan Mound BPP and Transfer Histories with Linear Regression Fit................55
Figure BPP-3. West Hackberry BPP and Transfer Histories with Linear Regression Fit. ...........58
Figure BPP-4. Bayou Choctaw BPP and Transfer Histories with Linear Regression Fit. ...........59
Figure GOR-1. Big Hill GOR Histories with Linear Regression Fit............................................64
Figure GOR-2. Bryan Mound GOR Histories with Linear Regression Fit. .................................67
Figure GOR-3. West Hackberry GOR Histories with Linear Regression Fit...............................70
Figure GOR-4. Bayou Choctaw GOR Histories with Linear Regression Fit. ..............................71

7
List of Tables
Table 2-1. Rates of BPP Increase on Stream Basis in August 2002, Reproduced from Hinkebein (2003). .......................................................................................................13
Table 2-2. Rates of GOR Increase on Stream Basis in August 2002, Reproduced from Hinkebein (2003). .......................................................................................................14
Table 4-1. BPP Recovery Immediately after Degasification........................................................23
Table 4-2. Differences in Site-Averaged BPP and Mole Fractions (Flowing Test − Downhole Test). .........................................................................................................27
Table 4-3 Effect of Flowing Test Results on Estimates of BPP at Bryan Mound........................28
Table 4-4. Caverns Showing Regain Rates of at Least 0.2 psi/yr (Rounded). .............................38
Table 4-5. Caverns with Low Current Regain Rates, but, with BP Pressure Recoveries Greater than 3 psi after Degasification. ......................................................................38
Table 4-6. Blended Stream BP Pressures and Intrusion Rates at 100oF.......................................39
Table 4-7. Blended Stream GOR and Regain Rates at 100oF.......................................................42
Table BPP-1. Bayou Choctaw BPP, Regain Rates and Comparisons with 2003 Values.............48
Table BPP-2. Big Hill BPP, Regain Rates and Comparisons with 2003 Values..........................48
Table BPP-3. Bryan Mound BPP, Regain Rates and Comparisons with 2003 Values. ...............49
Table BPP-4. West Hackberry BPP, Regain Rates and Comparisons with 2003 Values. ...........50
Table GOR-1. Bayou Choctaw GOR, Regain Rates and Comparisons with 2003 Values. .........60
Table GOR-2. Big Hill GOR, Regain Rates and Comparisons with 2003 Values.......................60
Table GOR-3. Bryan Mound GOR, Regain Rates and Comparisons with 2003 Values..............61
Table GOR-4. West Hackberry GOR, Regain Rates and Comparisons with 2003 Values..........62

8
List of Acronyms
BP Bubble point BPP Bubble point pressure BC Bayou Choctaw BBL Barrel (42 US gallons) BH Big Hill SPR site BM Bryan Mound SPR site DOE U.S. Department of Energy GC Gas chromatograph GOR Gas-Oil Ratio (units: standard cubic feet gas per barrel of oil) MB Thousand barrels (volume) MMB Million barrels (volume) SNL Sandia National Laboratories SPR Strategic Petroleum Reserve TVP Total vapor pressure TVP-95 Measurement equipment developed in 1995 TVP-2000 Measurement equipment developed in 2000 WH West Hackberry

9
1 Executive Summary This report documents a 2005 Sandia National Laboratories review and analysis of the U.S. Strategic Petroleum Reserve (SPR) crude oil vapor pressure database. SPR, owned by the U.S. Department of Energy (DOE), currently stores about 700 million barrels of crude oil in subsurface salt caverns along the U.S. Gulf Coast. The crude oils stored at the SPR must meet a stringent set of requirements for delivery offsite, one of which is maintaining an oil bubble point pressure of 14.7 psia or less at delivery conditions. Failure to meet this criterion may lead to excessive atmospheric emissions of gases from the oil that pose explosion hazards (i.e., light hydrocarbons), health hazards (i.e., hydrogen sulfide, benzene), or handling problems (i.e., foaming) in floating roof storage tanks at atmospheric pressure. While underground salt cavern storage has many attractive features over other large-scale storage alternatives, it poses challenges for maintaining the bubble point of the oils within delivery specifications. Both geothermal heating and intrusion of gases from the host geology in the salt caverns contribute to a problematic rise in bubble point pressures. Starting in 1993, DOE has maintained a vapor pressure monitoring program that has built a substantial database on crude oil properties relevant to delivery criteria. At the direction of DOE, Sandia National Laboratories (SNL) undertook a close review of the SPR crude oil vapor pressure data, which is the main topic of this report. The objectives of this review are:
• Assign a level of confidence to the data, weighing the data with higher confidence with more significance in the analysis
• Evaluate the effects of sample acquisition (flowing vs. downhole) on recent trends in data
• Examine the capacity of the TVP measurement system to detect “methane regain” and correlate with BPP
• Estimate the current rate of change in bubble point pressure and GOR on a cavern and stream basis
1.1 Primary Findings
1.1.1 Data Confidence
The primary parameters of interest are the bubble point pressure (BPP), gas-oil ratio (GOR), and “flash” gas composition. Flash gas is generated when crude oil is depressurized to a condition lower than its bubble point, causing gases to exsolve and form bubbles that eventually separate by density difference into a stable, two phase mixture. Temperature is also important, and it is typically controlled as an independent variable according to experimental protocol. The values for these parameters are stored in the vapor pressure database, and are determined by both experimental and numerical means.
Data in the vapor pressure database exhibit considerable scatter. Scatter leads to uncertainty in defining current conditions as well as historical and future trends, all of which are very important to the safe and secure operation of SPR. The authors decided to screen out most data generated by numerical means in order to focus on directly measured values. This helped to reduce the data scatter, and increase confidence in trends discovered in the data. Data were assigned an

10
index of 1 or 0 according to whether they would be screened in or out of analyses. Hence, no data were actually removed from the database. Criteria for screening are discussed in detail within the report.
1.1.2 Flowing Versus Downhole Sampling
SPR utilized two primary means of obtaining crude oil samples for vapor pressure measurements. Downhole tool measurements retrieve a 40 L crude oil sample from any prescribed depth in the cavern. Flowing samples take oil from a flowing line that typically draws from the very top of the cavern. In some cases, the intake for the flowing line is very deep, near the oil-brine interface. These are top-of-cavern and downhole flowing samples, respectively. This matters to SPR because the top-of-cavern flowing samples appeared to give generally higher BPP values than downhole samples. This report investigated the issue for the Big Hill and Bryan Mound sites for data obtained during the period 2000-2005. Top-of-cavern flowing samples were indeed found to give higher BPP than downhole tool samples, with a 0.9 psi difference seen at Bryan Mound, and a 3.3 psi difference seen at Big Hill. The differences were hypothesized to result from any of the following: (i) truly different properties at the top of cavern and downhole; (ii) systematic measurement error for downhole samples due to sample handling or inadequate sample volume; and/or (iii) systematic measurement error in the flowing test. The data available to the authors at the time of this report did not allow for a decision on the most likely hypothesis that is driving the observed bias. Inspection of degasification reports that monitor BPP in the process stream for a cavern on a daily basis indicate that each cavern has a unique profile, and no confident predictions on the degree of spatial heterogeneity in oil properties may be given yet. Many of the high BPP measurements obtained by the top-of-cavern flowing sample method were screened out of the regression fits for gas regain calculated by DynMcDermott, so the effect of these high values on downstream calculations of oil deliverability is controlled by a subjective screening process.
1.1.3 Measuring Methane Regain
The SPR vapor pressure monitoring program collects compositional data on the flash gas from cavern oils. Methane is a key player in determining the vapor pressure of an oil because it is very volatile and exhibits a strong preference for residing in the gas phase rather than the bulk liquid oil phase. Methane is also implicated as a driver in BPP increases observed over the years at SPR because salt caverns on the U.S. Gulf Coast are known to contain considerable quantities of high pressure methane trapped in pores and inclusions within the salt. This analysis sought to correlate BPP increase with methane concentration in three examples to see if the compositional measurements support the theory that BPP increase is caused by methane intrusion into the caverns. Examined were (i) Big Hill caverns 108 and 109, a pair of that started with the same oil, but BPP diverged over time; (ii) Bryan Mound 114 which exhibited the highest rate of BPP increase over the last 5 years, and (iii) Big Hill 103 pre- and post-degas oil. The analysis showed that methane composition correlated well with the higher BPP in cavern BH108, did not correlate well with the BPP increase in time in BM114, and was clearly lower in post-degas versus pre-degas oil in BH103. Thus, the identification of methane as the driver for BPP increase is not universal. It may be responsible for the increase in BH108 over BH109, but a combination of gases like propane, butane, and nitrogen may be responsible for the BM114 BPP rise. Measurement errors and oil transfers may also be responsible for the poor correlation in BM114.

11
1.1.4 Current Rates of BPP and GOR Rise on Cavern and Stream Basis
After the vapor pressure data were screened and the latest data were incorporated, cavern and stream-averaged regain rates were estimated. These rates are generally lower than reported in the past. Moreover, the uncertainties are lower upon screening the numerically-derived data out. Measurement methods have generally gotten better with time, so recent data tend to show less scatter than early data. Caverns tend to show an offset of about 2 psi from the value reported at the completion of degas to the first measurement a year or so after degas. This may be more of a mixing phenomenon of degassed oil with leftover oil and brine in the cavern than gas intrusion into the cavern. From a year after degas forward, the BPP increase rates are generally very low. There are a few exceptions, such as BM002 and BM114. BM002 is a unique case in that methane appears to be invading the cavern wells at a high rate, requiring that one well be vented periodically. Whether this methane intrusion affects the oil properties of the entire cavern is uncertain.

12
2 Introduction The U.S. Strategic Petroleum Reserve (SPR) currently (March, 2005) stores about 700 million barrels of crude oil in 62 underground caverns mined from domal salts along the U.S. Gulf Coast. This storage configuration has many attractive features, such as a low cost of construction, good containment in impermeable salt, and a relatively secure location underground.
Salt dome storage poses some challenges, however. Foremost is geothermal heating of the oil from around 70-80°F upon arrival at SPR to as high as 120-130°F after years of storage. The problematic effect of heating is that a temperature increase may raise the bubble point of the oil to above 1 atm. When oil exhibiting a bubble point > 1 atm is depressurized from its subsurface storage conditions of 900-2400 psi to atmospheric pressure in an above-ground storage tank, it may evolve a considerable quantity of gas comprising methane, ethane, propane, butane, hydrogen sulfide, and BTEX compounds, along with some inorganics. These gases, in turn, may cause occupational health and safety issues in the vicinity of the storage tanks or be subject to emissions regulations. It is therefore important to monitor the vapor pressure of SPR oils in order to provide a basis for managing the health, safety, and environmental risks of delivering large quantities of SPR oils to offsite terminals in the event of a major SPR drawdown.
In addition to geothermal heating, gas absorption during storage may contribute to an increase in oil bubble point. Salt domes make effective gas traps, and significant quantities of high-pressure gases such as methane, carbon dioxide, and nitrogen are routinely discovered in salt mining operations (Ehgartner et al., 1998). It stands to reason that oil storage caverns leached from salt caverns would therefore be subject to gas intrusion from the surrounding salt formations.
2.1 History of Vapor Pressure Monitoring at SPR
Data on SPR oil vapor pressure have been compiled since 1993 and are presented throughout this report. The two main parameters of interest are the oil bubble point pressure and gas-oil ratio. The bubble point pressure (BPP) of the oil at SPR is defined as the pressure at which oil in the liquid phase first evolves gas as pressure is lowered at a known temperature, typically 100°F in SPR analyses. The gas-oil ratio (GOR) is the quantity of gas exsolved from oil as a result of lowering the containment pressure below the oil bubble point, and GOR is given in standard cubic feet (scf) of gas per barrel (BBL) of oil at T = 100°F and P = 1 atm.
Hinkebein presented a comprehensive overview of vapor pressure measurements and calculations on SPR oils in a 2003 report (Hinkebein, 2003). The Big Hill and Bryan Mound SPR sites exhibited the highest rates of increase in bubble point pressures, while rates at Bayou Choctaw and West Hackberry were low enough to be statistically insignificant relative to the measurement uncertainty. These findings are summarized below in Table 2-1. Hinkebein defines “intrusion rate” or “gas regain” as increase in bubble point pressure in units of psi/year. Streams are designated as sweet or sour, with oils containing total sulfur on a mass % basis of 0.50 or less qualifying as sweet, and oils containing 0.51 to 1.99 mass % sulfur qualifying as sour (DOE, 1999). Big Hill sour exhibited the highest stream intrusion rate at 0.45 ± 0.15 psi/yr, where the uncertainty is one standard deviation. Big Hill sweet stream intrusion rate was 0.24 ±

13
0.08 psi/yr which is likely lower than the sour stream, though not necessarily given the overlap in uncertainty ranges. The Bryan Mound sour stream gas intrusion rate was 0.29 ± 0.05 psi/yr, while the sweet stream was similar at 0.21 ± 0.10 psi/yr.
Table 2-1. Rates of BPP Increase on Stream Basis in August 2002, Reproduced from Hinkebein (2003).
Stream Intrusion Rates
Volume of Stream (MMB)
Stream Average
Intrusion Rate(psi/yr)
Standard Deviation of
Stream Average Intrusion Rate
BC Sweet 22.14 0.00 0.05 BC Sour 49.15 0.08 0.07 BH Sweet 27.18 0.24 0.08 BH Sour 74.13 0.45 0.15 BM Sweet 69.60 0.21 0.10 BM Sour 151.72 0.29 0.05 WH Sweet 75.83 0.13 0.05 WH Sour 90.15 0.01 0.02
2.1.1 BPP Impacts on Air Quality Modeling
Hinkebein (2003) used these data to project bubble points of streams through August, 2004. Most streams were predicted to exceed 14.7 psi bubble point at a delivery temperature of 100°F in 2004 and beyond, which conflicts with SPR Level II requirements (DOE, 1999). In order to examine the scale of such emissions against Texas and Louisiana occupational safety laws, Hinkebein (2003) ran the Industrial Source Complex Short Term (ISCST) air quality model developed by the US Environmental Protection Agency (EPA) using relevant SPR input data. In particular, the modeling sought to define a GOR limit below which worker safety in the vicinity of surface storage tanks would be reasonably assured. The GOR may be correlated to BPP and oil composition by an equation of state model (see §3.2) or by direct observation with the proper experimental apparatus. Hinkebein (2003) opted to use the equation of state approach, using coupled BPP and flash gas composition measurements.
According to the ISCST air quality model, virtually any nonzero GOR would create an H2S hazard, and a program to scavenge the H2S by chemical treatment at the time of drawdown was implemented to eliminate H2S emissions. The next most critical emissions component was benzene, for which it was determined that a GOR limit of 0.6 scf/BBL would be required to keep benzene concentration below the applicable OSHA limit of 1.0 ppm. Hence, the 0.6 GOR value stands as the objective for a maximum GOR at delivery.
2.1.2 Predicting GOR in SPR Oils
GOR and BPP are closely coupled, and increases in one imply increases in the other. Using the equation of state approach, Hinkebein (2003) developed predictions of GOR increase in SPR oils in parallel with his predictions of increases in BPP. The projected stream averages and increase rates from this effort are presented in Table 2-2 for oils at delivery conditions of P=1 atm and
14
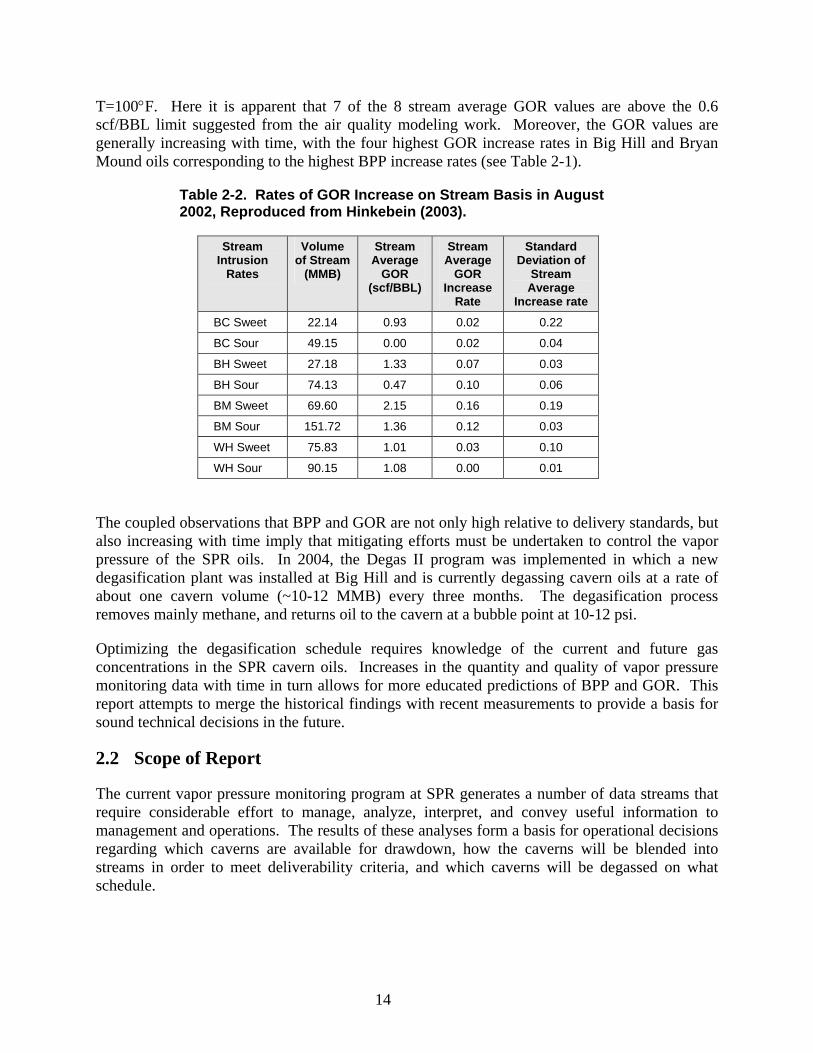
T=100°F. Here it is apparent that 7 of the 8 stream average GOR values are above the 0.6 scf/BBL limit suggested from the air quality modeling work. Moreover, the GOR values are generally increasing with time, with the four highest GOR increase rates in Big Hill and Bryan Mound oils corresponding to the highest BPP increase rates (see Table 2-1).
Table 2-2. Rates of GOR Increase on Stream Basis in August 2002, Reproduced from Hinkebein (2003).
Stream Intrusion
Rates
Volume of Stream
(MMB)
Stream Average
GOR (scf/BBL)
Stream Average
GOR Increase
Rate
Standard Deviation of
Stream Average
Increase rate
BC Sweet 22.14 0.93 0.02 0.22
BC Sour 49.15 0.00 0.02 0.04
BH Sweet 27.18 1.33 0.07 0.03
BH Sour 74.13 0.47 0.10 0.06
BM Sweet 69.60 2.15 0.16 0.19
BM Sour 151.72 1.36 0.12 0.03
WH Sweet 75.83 1.01 0.03 0.10
WH Sour 90.15 1.08 0.00 0.01
The coupled observations that BPP and GOR are not only high relative to delivery standards, but also increasing with time imply that mitigating efforts must be undertaken to control the vapor pressure of the SPR oils. In 2004, the Degas II program was implemented in which a new degasification plant was installed at Big Hill and is currently degassing cavern oils at a rate of about one cavern volume (~10-12 MMB) every three months. The degasification process removes mainly methane, and returns oil to the cavern at a bubble point at 10-12 psi.
Optimizing the degasification schedule requires knowledge of the current and future gas concentrations in the SPR cavern oils. Increases in the quantity and quality of vapor pressure monitoring data with time in turn allows for more educated predictions of BPP and GOR. This report attempts to merge the historical findings with recent measurements to provide a basis for sound technical decisions in the future.
2.2 Scope of Report
The current vapor pressure monitoring program at SPR generates a number of data streams that require considerable effort to manage, analyze, interpret, and convey useful information to management and operations. The results of these analyses form a basis for operational decisions regarding which caverns are available for drawdown, how the caverns will be blended into streams in order to meet deliverability criteria, and which caverns will be degassed on what schedule.

15
At the direction of DOE, Sandia National Laboratories (SNL) undertook a close review of the SPR crude oil vapor pressure data. The objectives of this report are:
• Assign a level of confidence to the data, weighing the data with higher confidence with more significance in the analysis
• Evaluate the effects of sample acquisition (flowing vs. downhole) on recent Bryan Mound and Big Hill data
• Examine the capacity of the TVP measurement system to detect “methane regain” and correlate with BPP
• Estimate the current rate of change in bubble point pressure and GOR on a cavern and stream basis
• Discuss any issues that arise during the analysis that require attention in the future

16
3 Methodology Bubble point pressure and gas-oil ratio data are obtained both by direct measurement and by calculation. The methods for obtaining these values are discussed briefly below, as well as in previously published reports (Hinkebein, 2003).
3.1 Direct Measurements
3.1.1 TVP-95
The Total Vapor Pressure (TVP) 95 system measures the bubble point, GOR, and composition of flash gas of a crude oil. The flash process is defined in petroleum literature as the sudden vaporization of a liquid that is subjected to a rapid pressure decrease or temperature increase. In the case of the TVP-95, the flash process is induced by allowing the oil sample to depressurize from around 450 psia in the process line to a much lower value in the gas-liquid separator.
A schematic of the TVP-95 is shown in Figure 3-1. The oil sample is flowed into a gas/liquid separator that uses feedback control to maintain a constant liquid level. A valve at the top of the separator remains closed for the first part of the test, which is the bubble point pressure test. The separator is held at 100°F, which is the reference state for vapor pressure measurements at SPR. A pressure transducer located at the top of the flash separator measures the pressure in the headspace. Oil is flowed through the separator for several hours until the pressure reading remains constant, at which point the pressure is recorded as the measured bubble point pressure of the oil at 100°F. This headspace gas is then allowed to flow into the gas chromatograph (GC) in order to obtain a compositional analysis.
Gas flow meter
Gas/Liquid separator
Oil out
Oil in
Pressure meter
Gas Chromatograph
Valve•Closed for VP•Open for GOR and GC
TVP-95 Schematic
Used oil disposal
Crude oil sample
Figure 3-1. Schematic of Major Conceptual Elements of the TVP-95 Instrument System.

17
The second part of the test is conducted with the valve at the top of the separator open so gas may flow if the headspace pressure exceeds 1 atm (14.7 psia). The flowing gas sample is monitored by the gas flow meter for a volume flow rate. This quantity is reported as flow rate in standard cubic feet gas (scf) evolved per barrel (BBL) of oil passed through the separator. The standard state here implies 100°F and 14.7 psia. The gas volume flowrate is monitored for a stable signal, and then the value is reported against the oil flowrate for the GOR. The flowing gas is also sampled by the GC for compositional analysis.
The TVP-95 system is currently housed in a trailer that can be moved to any cavern for testing. The trailer can also be moved to the degasification plant to operate in parallel with the TVP-2000, described below. TVP-95 oil samples can be obtained from either a flowing line, as is done at the degas plant, or from a downhole sample. The sample acquisition process is described in section 3.1.3. Instrument cycle time is typically one set of BPP, GOR and gas composition values in a day.
3.1.2 TVP-2000
The TVP-2000 measures the same properties as the TVP-95, though the methodology is somewhat different. A schematic of the TVP-2000 is given in Figure 3-2. The system takes its oil sample from the degasification plant process stream. The TVP-2000 is permanently installed at the degasification plant.
Gas flow meter
Gas/Liquid separator
Oil outOil in
Pressure maintained at 1 atm
Gas Chromatograph
TVP-2000 Schematic
Crude oil in degas process stream
P=f(V)
Grabner vapor pressure analyzer
Figure 3-2. Schematic of Major Conceptual Elements of the TVP-2000 Instrument System.

18
The bubble point pressure is measured by pulling a small mL-scale sample from the sample stream into a Grabner vapor pressure analyzer. This instrument performs three very precise pressure, volume, and temperature measurements on the oil by using an isothermal expansion to fix the volume at known values while measuring the resulting pressures. These data are extrapolated to a “zero” expansion in order to determine a bubble point pressure.
The GOR and gas composition are determined by introducing the flowing liquid sample stream into a flash separator with controlled temperature and pressure. The flash gas flowrate is then measured and compared against the feed oil flowrate for GOR. TVP-2000 cycle time is about one per hour for the Grabner device, every minute for the GOR meter, and every 15 minutes for the gas composition by gas chromatograph.
3.1.3 Sample Acquisition
Samples for the TVP instruments have been taken by a variety of methods over the duration of the vapor pressure monitoring program. The first samples in the 1993 time frame were taken with either the “pressurized sample method” or the “skid mounted gas separator method” (Hinkebein et al., 1995). The pressurized sample method employed a downhole tool that captured samples at a selected depth and transported them to the surface. The samples were then transferred to pressurized bottles that were sent to a laboratory for vapor pressure analysis. The skid-mounted separator took flowing samples from the caverns, and used a separator concept similar to the current TVP-95. There were also samples obtained by a coiled tubing unit. These were taken at a variety of cavern depths and processed like flowing samples.
Current acquisition techniques include the downhole sampling tool, top of cavern flowing samples, and downhole flowing samples. Each is discussed briefly.
Downhole sampling tool. This tool is lowered into the cavern to a selected depth and opened and closed remotely in order to capture an oil sample. Each tool has a 10L capacity, and a typical test employs five tools for a total of 50L of sample. The sample is stored at an elevated pressure until it is released into the TVP-95 separator unit. This method has the advantage that it gives a reasonable representation of the oil properties in the middle of the cavern, though it has the disadvantage of being limited in size (50 L) and relatively expensive to obtain. The limited sample size may impact the accuracy of a BPP measurement if the system is slow to reach equilibrium. The likely result would be a low measurement relative to the actual BPP value.
Top of cavern flowing sample. The top of cavern flowing sample is taken from the cavern wellhead after 10,000 barrels of oil are purged from the top of the cavern. For perspective, in a 10 MMB cavern, the purge effort moves 0.1% of the cavern volume. The purge step is taken in order to reduce the impact of activities such as cavern integrity tests on the test sample. Cavern integrity tests pump nitrogen into the cavern well, and are likely to cause some dissolution of nitrogen into the roof oil in the immediate vicinity of the well. Nitrogen has a considerable impact on bubble point pressure, and is likely to cause spurious high values in BPP and GOR that would not be representative of the bulk of oil in the cavern. It was decided that some effort should be taken to pass the oil most likely affected by cavern integrity tests out of the roof before a sample is taken for TVP analysis. To date, the authors are not aware of a specific validation of the 10,000 barrel purge volume, and this remains an open issue as to how many barrels is enough

19
to assure a representative sample for BPP and GOR. To execute the BPP and GOR test, the TVP-95 separator unit is attached through a pressure regulator to a flowing line attached directly to the cavern wellhead. The sample volume is therefore effectively unlimited and sample is flowed until steady values for BPP and GOR are obtained.
Downhole flowing sample. The downhole flowing sample is used only in select cases due to the special well configuration required and cost to obtain this configuration. The normal position of the wells in SPR cavern have the hanging string extending down into the brine at the bottom of the cavern to move water, while the “slick hole” at the top is the conduit for oil. Oil therefore typically flows out of the top of the cavern, and normal flowing samples are labeled as such. During a string workover or preparation for degasification, the hanging string is raised so that the end is actually in the oil phase. This provides an opportunity to sample oil from the bottom of the cavern. A typical degasification operation flows oil up through this downhole string to the degas plant, and back into the cavern through the slick hole at the top. A unique opportunity that degasification also affords is a large number of samples that represent a significant portion of the cavern volume properties prior to degas.
3.2 Numerical Analyses
All equation of state modeling presented in this report was done with the current Sandia Solver tool. The tool solves for equilibrium conditions in a crude oil “flash” problem. The underlying thermodynamic model is the Soave-Redlich-Kwong equation of state. A description of many of the underlying concepts to this model is published in Lott (1996). Operationally, the model requires system pressure, temperature, fluid composition, and gas-to-liquid volume ratio as input. The composition can be the mole fractions in either the gas phase (yi) or the liquid phase (xi). The model can then solve for one of the above variables given knowledge of the other three. For example, the bubble point may be determined for temperatures other than 100°F by setting the gas-to-liquid volume ratio to zero. Alternatively, the GOR may be determined by setting the pressure to 1 atm and solving for gas-to-liquid volume ratio and converting to scf/BBL units. All binary interaction coefficients were set to zero.

20
4 Intrusion Rates Previous estimates of gas intrusion rates have been obtained from linear regression analyses using the method of least squares (Hinkebein, 2003). Generally, all measured and calculated BPP and GOR data are compiled in spreadsheets that are updated quarterly. A history of all measured and calculated data for each cavern is stored on an individual Excel “worksheet” within a “workbook”. An individual workbook is maintained for each site. Each worksheet contains the mathematics required to perform a linear least squares fit to both the BPP versus time and GOR versus time data and provide statistical data such as the variance (σ2) and/or standard deviation (σ) of BPP, and GOR measurements and the variance of the resulting coefficients in the linear fit. The linear equation is defined as:
( )y a b t t= + −
where a is the value of the regression variable at the mean time, t , and b is the slope. For the purposes of SPR, the slope (b=ΔBPP/Δt) of linear fit through the BPP versus time data is called the “gas intrusion” or “regain rate”.
Past regression analyses have been performed with all data weighted equally whether measured or calculated, from flowing or downhole tool samples or directly outlet from the degas plant. Two analyses are performed when a cavern has been degassed to provide pre- and post- degas intrusion rates. The degas date and degas plant outlet BPP serve as the starting point for the post degas analysis. In a few cases data were removed from the analysis if there were known problems with the measurement. More recently, there has been discussion within the project over excluding calculated BPP from GOR tests when estimating regain due to inaccurate GOR measurements.
The authors acknowledge that there has been much discussion among the participants in the vapor pressure monitoring program over the accuracy of results from GOR tests. The GOR data has generally improved with time due to improvements in the test equipment and procedures. This report does not address the validity of the GOR measurements, but instead evaluates what the existing GOR measurements might contribute with regard to gas regain. The emphasis of this report is, however, BP pressure.
In the current estimation of intrusion rates, all the BPP and GOR data have been evaluated for their contribution to the regain analysis. The primary goal is to obtain an accurate as possible measure of the current BPP, GOR and gas regain rate. The following criteria have been applied:
• Where possible, only measured values are used. When there is a paired BPP test and a GOR test, only the measured BPP from the BPP test and the measured GOR from the GOR test are used. Values of the GOR from the BPP test and BPP form the GOR test as calculated by the Sandia Spreadsheet Solver are not used. Note that a Sandia Solver calculated value must be used for tests at pressures other than the BP or at temperatures other than 100oF.

21
• The BPP obtained from the outlet stream from the degas plant is not used for two reasons. One, the value is not representative of the oil within the cavern. Measurements of vapor pressure for inlet and outlet oil during degas demonstrate this effectively (see §4.2). Two, including the degas outlet value leads to an average regain rate since degas rather than an estimation of the current rate. Using the degas stream value would be conservative, however, in that it would tend to increase apparent gas intrusion rates.
• For caverns that have been degassed, we are only concerned with regain since degas. The exception is for caverns with too little data to evaluate the post-degas regain. For these, the pre degas rate is used as a surrogate.
• The initial or delivery BPP and GOR are screened out because they are only estimates of the oil properties at the time of delivery and not actually measured. This only concerns caverns that have not been degassed.
• If data from a top-of-cavern flowing test are strikingly out of line with the downhole tool test results, then the data are screened out. The implication here is that the oil in the upper cavern is subject to influences that may not affect the properties of the bulk oil in the cavern. Activities such as cavern integrity tests or methane intrusion into the wells are examples of plausible mechanisms for increasing the bubble point of the oil in the upper cavern.
• Current analysis includes data from 1993-2005. This is important since our comparisons are made to results reported in Hinkebein (2003) which cover 1993-2003.
Copies of a set of Quarterly Reports have been modified here to include separate weighting factors (usually 0 or 1, for exclude or include) for both the BPP and GOR from a given test. This allows for easy evaluation and visualization of the effect of a particular measurement or set of measurements on the regression analysis. The primary measure for gas regain analysis is displayed graphically as BPP histories, which are referred to throughout this report and are included in Appendix BPP for all caverns at each site. These BPP figures include an oil transfer history (connected triangles) with the scale located on the right side of the figure and units are 106 BBL or MMB. Vertical dark bands on the BPP figures indicate degas operations. A red “X” near the top of a figure indicates times of cavern integrity testing. Data represented by open diamonds were not included in the linear regression fit. Finally, BPP measurements resulting from flowing tests are enclosed in red boxes. Appendix GOR contains the corresponding GOR histories.
4.1 Interpretation of Gas Regain in Terms of Reservoir Depletion Modeling
Gas regain is currently assumed to follow a linear model or proceed with a constant rate which is updated periodically as new information is obtained (quarterly). It is more likely that the actual regain rate is not constant, but has a location and property dependent initial value and decays exponentially with time implying that a simplified reservoir depletion model might be better suited for forecasting future gas regain. In its simplest form a reservoir depletion model would generate gas flow rates that were a function of the pressure difference between the gas reservoir and the well (cavern); properties of the well (cavern)/gas reservoir system and properties of the
22
path between the two. Immediately after reservoir penetration (cavern formation) pressure gradients and, therefore, gas flow (intrusion) rates would be at their highest and would decay as gas flows to the cavern and reservoir volume and pressure are reduced. The rate of decay would be a function of system properties. To use a true depletion model would require both the model (fundamental equations) and properties in order to be properly applied. These properties would likely be spatially dependent and therefore both site and cavern dependent and therefore difficult to obtain. A second choice would be to derive a simplified functional form of a depletion model with a minimal set of coefficients that could be evaluated by non-linear regression analysis of the existing vapor pressure data in a manner similar to what is now used. The current vapor pressure data set contained in the quarterly reports was evaluated with the non-linear depletion equation in mind. The conclusions are discussed below.
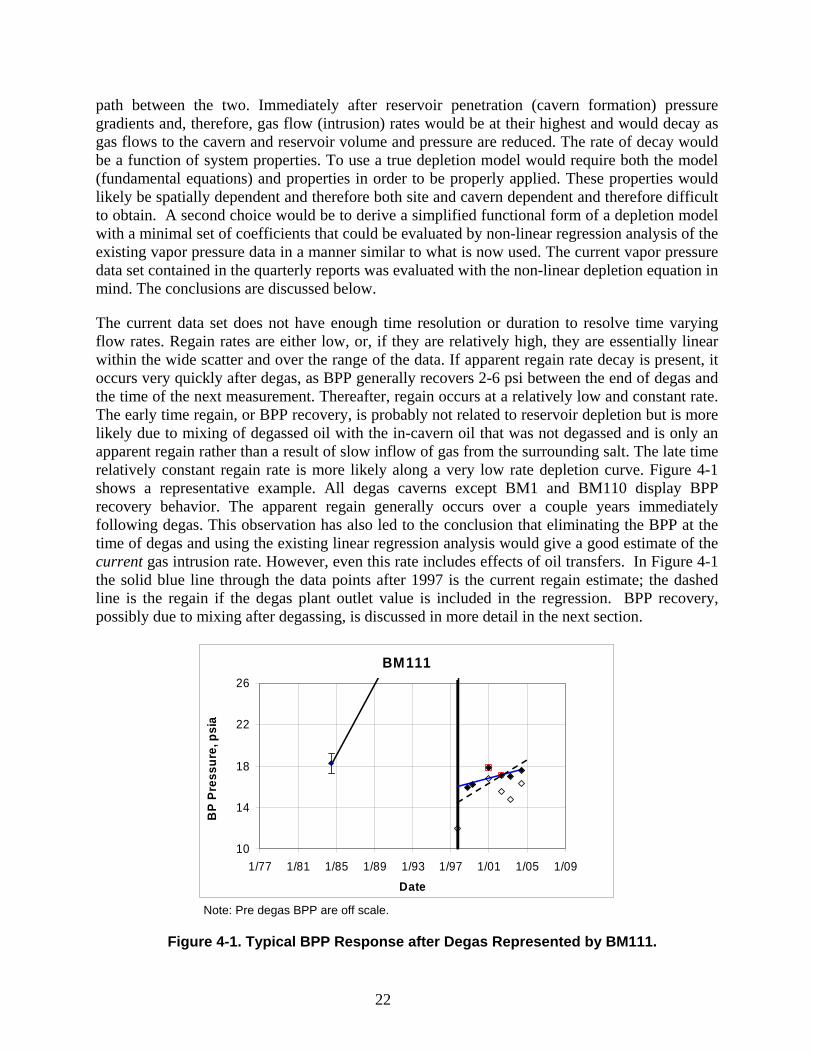
The current data set does not have enough time resolution or duration to resolve time varying flow rates. Regain rates are either low, or, if they are relatively high, they are essentially linear within the wide scatter and over the range of the data. If apparent regain rate decay is present, it occurs very quickly after degas, as BPP generally recovers 2-6 psi between the end of degas and the time of the next measurement. Thereafter, regain occurs at a relatively low and constant rate. The early time regain, or BPP recovery, is probably not related to reservoir depletion but is more likely due to mixing of degassed oil with the in-cavern oil that was not degassed and is only an apparent regain rather than a result of slow inflow of gas from the surrounding salt. The late time relatively constant regain rate is more likely along a very low rate depletion curve. Figure 4-1 shows a representative example. All degas caverns except BM1 and BM110 display BPP recovery behavior. The apparent regain generally occurs over a couple years immediately following degas. This observation has also led to the conclusion that eliminating the BPP at the time of degas and using the existing linear regression analysis would give a good estimate of the current gas intrusion rate. However, even this rate includes effects of oil transfers. In Figure 4-1 the solid blue line through the data points after 1997 is the current regain estimate; the dashed line is the regain if the degas plant outlet value is included in the regression. BPP recovery, possibly due to mixing after degassing, is discussed in more detail in the next section.
BM111
10
14
18
22
26
1/77 1/81 1/85 1/89 1/93 1/97 1/01 1/05 1/09Date
BP
Pres
sure
, psi
a
Note: Pre degas BPP are off scale.
Figure 4-1. Typical BPP Response after Degas Represented by BM111.

23
Based on the time resolution and range of the data with respect to reservoir depletion, the relatively wide scatter in the measured data, the extra complication of a non-linear regression, the lack of and expense in obtaining “gas reservoir” properties, and the observed behavior of the BPP after degas, we have concluded that the current linear regression least squares method gives us adequate forecasting capabilities as long as there is a continued cavern monitoring program.
4.2 Discussion of Degas Outlet Stream Properties
There are two issues with the BPP measured in the outlet stream from the degas plant: (i) it is not representative of the cavern oil, and (ii) the rapid rise and subsequent flattening of the typical cavern BPP history immediately after degassing (Section 4.1) means that the BPP value at the time of degas is not necessarily a good reference point for forecasting BPP immediately after degas when using constant regain rates. A better means to estimate the BPP behavior after degas is to use the outlet stream value plus an increment based on data from a previous degas for the cavern, or on an analysis of the BPP recovery occurring for particular stream or site. All of the caverns processed in the Degas I program in the mid-1990’s were evaluated for BPP recovery after degas, and the results are summarized in Table 4-1. Note that the average BPP increase from the degas outlet stream value in the first year following degas was about 2 psi (compare columns “Post Degas” and “Degas”). This increase is likely due to mixing of the degassed oil with cavern oil, both at the interface during degasification and due to a slower mixing with oil that is unintentionally bypassed (short circuited) during degas operations or intentionally unprocessed due to a partial degas. This behavior is examined below and in section 4.3.2.
Table 4-1. BPP Recovery Immediately after Degasification.
Cavern (% Degassed)
Pre DegasBPP, psig
DegasBPP,psig
Post DegasBPP, psig
BPP Recovery,
psi
BPP Recovery Fraction,
-
Apparent Degas Fraction
from Mixing Model
- BM2 23 12.3 13.8 1.5 0.14 0.86
BM106 (60%)* 19.2 13.9 17.7 3.8 0.72 0.28
BM113 18.5 12.3 12.4 0.1 0.02 0.98
BM114 21.5 12 12.3 0.3 0.03 0.97
BM Sweet Average 1.4 0.23 0.77
BM1 18.1 12 12 0 0.00 1.00
BM101 25.7 12.2 12.7 0.5 0.04 0.96
BM103 36.7 12.4 12.6 0.2 0.01 0.99
BM107 (80%) 18.3 11.1 13.3 2.2 0.31 0.69
BM109 23.2 12.2 13.7 1.5 0.14 0.86
BM110 (60%) 16.6 13.5 13.5 0 0.00 1.00
BM111 32.3 12 16 4.0 0.20 0.80
BM Sour Average 1.2 0.10 0.90
BM Site Average 1.3 0.14 0.86

24
Cavern (% Degassed)
Pre DegasBPP, psig
DegasBPP,psig
Post DegasBPP, psig
BPP Recovery,
psi
BPP Recovery Fraction,
-
Apparent Degas Fraction
from Mixing Model
- BH105 18.6 11.3 12.5 1.2 0.16 0.84 BH101+ 19.6 11.6 15.2 3.6 0.45 0.55
BH103+ 19.5 11.4 13.7 2.3 0.28 0.72
BH Sweet Average 2.4 0.30 0.70 BH106 25.4 11.1 13.9 2.8 0.20 0.80 BH107 24.3 11.1 13.4 2.3 0.17 0.83 BH108 23.6 11.3 19.2 7.9 0.64 0.36 BH109 18.2# 11.3 14.5 3.2 0.46 0.54 BH108+ 17.8 10.7 13 2.3 0.32 0.68
BH113+ 18.7 10.4 12.6 2.2 0.27 0.73
BH Sour Average 3.5 0.34 0.66 BH Site Average 3.1 0.33 0.67 WH103 (73%) 17.2 11.9 14.4 2.5 0.47 0.53 WH107 (75%) 16.7 11.5 15 3.5 0.67 0.33 WH113 (106%) 17.3 11.4 14.6 3.2 0.54 0.46 WH Sweet Average 3.07 0.56 0.44 BC Sweet BC18 (86%) 18.3 11.9 15.3 3.4 0.53 0.47 Sour BC17 (98%) 16.7 12.1 13.8 1.7 0.37 0.63 BC Site Average 2.6 0.45 0.55 Reserve Average 2.3 0.29 0.71 BM caverns were degassed from one cavern to another implying pre and post degas oils are different. *BM106 recovery is for Maya (sour) which has since been replaced with a sweet oil + Italics indicate caverns recently degassed. Table values are inlet and outlet BPP. # Pre degas BPP not reported. Value estimated from other deliveries in same time frame
For all degassed caverns, Table 4-1 lists the “Pre-Degas BPP”, the reported Degas Plant outlet stream BPP “Degas BPP,” and the in-cavern “Post Degas BPP”. The “Post Degas BPP” is the regression fit extrapolated back to the time of degas. In most cases this value is very near the first post degas BPP measurement. Also shown are the “BPP Recovery” or BP pressure increase (ΔBPP), the “BPP Recovery Fraction” which is the ratio of the BPP recovery and the BPP drop across the degas plant (Pre Degas BPP – Degas BPP). The “Apparent Degas Fraction from Mixing Model” is 1 minus the BPP recovery fraction and could be interpreted as the fraction of cavern oil that was processed by the Degas Plant and mixed with unprocessed cavern oil that would result in the observed post degas BPP. It should be noted that for Bryan Mound pre and post degas oil may be different because the Degas Plant processed oil from one cavern into another. Included in Table 4-1 are the four BH caverns that were recently degassed (BH108,

25
113, 103 and 101). For these caverns the pre degas BPP is equated to the early time Degas Plant inlet stream, the Degas BPP is equated to the outlet stream, while the Post Degas BPP is taken from the very late time inlet stream.
Figure 4-2 illustrates the problem with using the outlet stream BPP value in regain rate calculations. In the figure, the upper curve represents the inlet stream measured BPP and the lower curve represents the outlet stream. According to the cavern degasification completion report (Mihalik, 2004), 110% of the cavern volume was ultimately processed. Hence, the sharp drop in inlet BPP in early July 2004 (Figure 4-2 (a), (BH108)) is close to the time that 100% of the cavern volume was processed, and shows the effect of degassed oil mixing with cavern oil. Of interest is the 2.5 psi difference between inlet and outlet BPP at the time degassing was stopped. Clearly, the inlet stream is still dropping, but the important fact is that the BPP are quite different. Note that the inlet history was shifted down 2.07 psi because of modifications to the Grabner expansion points and equilibration times made after the Degas Plant had switched from BH108 to BH113. The same phenomena can be seen in Figure 4-2 (b) for BH113, except mixing occurs at the time 75% of the cavern volume is processed and the inlet BPP stabilizes near 12.5 psi or about 2.5 psi higher than the outlet stream. Note that neither the inlet or outlet streams are necessarily representative of the cavern but probably bound the representative value. Some small changes in inlet BP pressure could arise from stratification of oil from recent deliveries. However, these changes are not likely to be on the order of the 4-6 psi change seen in Figure 4-2.
(a) BH108
8
10
12
14
16
18
20
22
24
4/3/04 4/23/04 5/13/04 6/2/04 6/22/04 7/12/04 8/1/04Date
BP
Pre
ssur
e, p
sia
Inlet Shifted -2.07 psiOutlet
(b) BH113
8
10
12
14
16
18
20
22
24
26
6/22/04 7/12/04 8/1/04 8/21/04 9/10/04 9/30/04 10/20/04Date
BP
Pres
sure
, psi
a
InletOutletInlet shifted -2.07 psi
Figure 4-2. Degas II Inlet and Outlet BPP Measurements Using the TVP-2000 Grabner for (a) BH 108 and (b) BH113.
The authors theorize that BH113 shows significant breakthrough of the degassed oil into the inlet stream at only 75% of cavern volume processed because there may be some “dead” zones in the cavern that are not swept by the well configuration that moves the oil for degassing. This short-circuiting effect will likely manifest as a notable increase in BPP over the degas outlet stream value when the next TVP analysis is taken for this cavern. The increase or “recovery” would occur because only ~80% of the oil was degassed, while 20% of the oil remains at the original BPP. A simple volume-weighted average would yield a representative BPP for BH113 of BPP = (0.8*11psi+0.2*19psi) = 12.6 psi, which happens to be close to the inlet BPP at the end of degas. The 80/20 (75/25) percent split arises from the assumption that the cavern oil volume is accurately known. Uncertainty in cavern oil volume would shift the relative breakthrough

26
volume accordingly, though it is not responsible for the persistent offset between inlet and outlet BPP seen in BH113. Also, string depth relative to the oil/brine interface would also contribute to volume processed. For caverns that currently show little or no gas regain, a small increase in BP pressure over the stable inlet value a year after degas would indicate a mechanism like short-circuiting with both short-term mixing at the gassy/degassed oil interface followed by longer-term (year-scale) mixing of the entire cavern volume. Figure 4-1, presented previously, illustrates a typical BPP response after degas in 1997 and the underlines the difficulty in predicting early time regain. The degassed oil BPP for this cavern, BM111, was listed in the quarterly report as 12 psia. The first measured BPP was 16 psia one year later and has shown a relatively slow regain since. The discrepancy could either be (i) the difference between the outlet stream and the in-cavern BPP, or (ii) a 4 psi regain in the first year, which is not likely given the considerably lower regain rate suggested by the data for BM111 from 1997-2005. The BPP shift for this cavern following future degassing is likely to be less than 4 psi because the unprocessed oil that is left to mix with the processed oil has a current BPP (~18psi) that is much lower than the earlier pre degas BPP (>26 psi). Many caverns exhibit a ~2 psi recovery in BP pressure immediately after degassing followed by slow regain.
4.3 Flowing Versus Downhole Sample Testing
Recent BPP and GOR testing at Bryan Mound between November 2004 and February 2005 yielded an unusual median increase in BPP of 1.2 psi over early 2004 tests. This is a high rate of bubble point pressure increase relative to the ~0.2-0.3 psi/year reported in Hinkebein (2003). In the extremes, BM001 showed a 1.8 psi decrease, BM002 showed a 30 psi increase, while all others (BM004, 102, 104, 105, 106, 108, 113, 114, 115, 116) exhibited 0.3 to 2.4 psi increases. To complicate the matter, all 12 recent tests were top of cavern flowing samples, while 11 of the 12 were obtained with the downhole tool in early 2004. It was therefore difficult to determine if the tests revealed genuine cavern-scale bubble point increase, or if the sample acquisition technique biased results to look like there was a rapid increase in BPP during 2004.
The differences seen between flowing and downhole sample testing is not new and has been accounted for in both the current and previous regain analyses. BP pressures from top-of-cavern flowing tests taken immediately after CIT testing that showed both unreasonable BP pressures and significant amounts of nitrogen and/or methane have been excluded from the regression fits that lead to regain rates and have not been used as current BP pressure estimates. A similar approach has been used to screen out apparently low BP pressures from limited volume downhole tests that might not have reached equilibrium in the TVP-95 flash chamber. However, the discussion in this section uses all the available flowing data to quantify the differences and to possibly identify systematic errors in the testing technique. Results that are not representative of cavern oil are not necessarily considered flawed unless there is an identified testing error. Interpretation of results from flowing tests to represent the bulk cavern oil is still recommended for regain analyses. It is also recommended that caverns be identified as to appropriateness of using top-of-cavern flowing samples as representative of the entire cavern.
A memo written by the authors in March, 2005 (see Lord and Rudeen, 2005) investigated the bubble point values derived from top of cavern flowing tests versus downhole tool tests over the period 2000-2005 for both Big Hill and Bryan Mound. The memo reports that the top of cavern

27
flowing tests gave systematically higher bubble point pressure values than downhole tool tests (see Table 4-2). The memo also examined the site-average nitrogen (N2) and methane (C1) gas fractions from flowing and downhole samples, also listed in Table 4-2. Flowing samples exhibited higher fractions of both gases than downhole samples.
Table 4-2. Differences in Site-Averaged BPP and Mole Fractions (Flowing Test − Downhole Test).
(Flowing – Downhole) Average Property
BM BH BPP, psi 0.9 3.3 N2 gas fraction, % 3.6 18.5 C1 gas fraction, % 1.8 6.6
An open question remains whether the differences are due to systematic testing errors or whether they represent truly different oil properties. The authors hypothesize that the differences could stem from any combination of the following:
• Different properties for oil near the roof and oil at cavern mid-depth (or location of the downhole test). Top of cavern flowing test results tend to show more nitrogen, consistent with the impacts of Cavern Integrity Testing and methane sources in the well or roof of the cavern.
• Systematic measurement error in downhole tests due to sample handling prior to testing, or limited sample size, both of which could reduce the observed BPP and give gas composition that is not representative of the flash gas of a downhole sample
• Systematic measurement error in the flowing test.
Closing comments on flowing versus downhole measurements. An inherent challenge in evaluating the top-of-cavern flowing test data is to determine how much of a deviation from the expected cavern BPP is allowable before the data are discarded. The analysis above demonstrates that top-of-cavern samples will return higher BPP values, on average, than downhole. Expert judgment is typically exercised to screen the unreasonably high data from the regain rate calculations. This is still a subjective process, however, and is based on a best guess on reasonableness. How high a BPP in a flowing sample is too high to be reasonable for the cavern average? In the absence of better spatially-resolved data interior to the cavern, expert judgment is the best that can be done. In light of the uncertainty in actual cavern BPP values and corresponding regain rates, coupled with DOE attention focused on the deliverability of cavern oils during a full-scale summer drawdown, the authors believe that an effort to obtain several samples at varying depths within the most uncertain or at-risk caverns would be advisable.
4.3.1 Interpreting the Latest Data Relative to Historical Values
A 1.2 psi median increase in BPP across the entire Bryan Mound site in one year could be cause for concern, though the authors believe that the true rate of bubble point increase for the cavern oils is much lower than 1.2 psi. Instead of interpreting the BPP from the latest set of

28
measurements as the new baseline BPP value, the authors suggest using the regression fit to data from 2000 forward as a basis for assessing the new representative BPP. Note that the long-term regain rates used to forecast oil deliverability and plan degasification schedules use the regression fit approach, and hence smooth out the oscillations in data series to a representative line. The authors believe this same principle should be used when assessing the latest set of BPP data.
This approach is illustrated in Table 4-3. Columns 4 through 7 contain BP pressures estimated using one of two methods:
(i) the last measured value, which was the procedure used in the 11/04 Quarterly Site report, or
(ii) using the linear regression least squares fit to calculate the BPP on a specific date (current method recommended by authors).
Using the Bryan Mound Sweet Stream Average computed with the last measured values as an example, the BPP progresses from 17.1 psi in the November’04 report to 18.1 in the March’05 report, showing a 1.0 psi increase in a quarter year. If the linear regression is used for the 11/04 and 3/05 values, the estimated sweet stream average BP pressure values are 17.4 and 17.5 psi, respectively, with a 0.1 psi increase in BP pressure. Clearly the interpretation method influences the impact of the most recent measurements. The column labeled “3/05 Regression” is our current best estimate using both downhole and flowing samples as being representative of the entire cavern. Note that the very high BM002 measurements in 2005 have not been included in the averaging process. While there is good reason to believe that the BM002 flowing sample oil has very high bubble point due to methane influx to the cavern wells and the need to periodically vent the wellhead to relieve methane pressure, it is unlikely that this flowing sample is representative of the cavern average.
Table 4-3 Effect of Flowing Test Results on Estimates of BPP at Bryan Mound.
BPP, psia BM
Cavern Stream
Volume, MMB
11/04 Quarterly Measured
3/05 Measured
11/04 Regression
3/05 Regression
2 sweet 6.8 13.9 13.9 14.4 14.4
4 sweet 21.0 17.9 18.7 18 18.0
106 sweet 12.4 18.5 19.4 17.7 17.7
113 sweet 6.5 12.9 13.3 13.2 13.2
114 sweet 8.3 15.7 17 16.6 16.8
115 sweet 9.7 20.1 22.6 21.3 21.4
116 sweet 10.3 17.1 18 17.5 17.5
Total 74.8 Sweet Stream Average 17.1 18.1 17.4 17.5
1 sour 7.2 14.4 13.7 13.3 13.4
5 sour 36.3 16.9 17 17.3 17.3

29
BPP, psia BM
Cavern Stream
Volume, MMB
11/04 Quarterly Measured
3/05 Measured
11/04 Regression
3/05 Regression
101 sour 13.0 13.4 13.6 13.6 13.6
102 sour 11.2 17.4 18.2 18.5 18.5
103 sour 11.6 13.8 13.9 13.9 14.0
104 sour 11.2 16.9 18.9 18.1 18.1
105 sour 10.8 18.0 19.3 18.5 18.5
107 sour 12.2 13.0 13 13.1 13.1
108 sour 11.6 17.6 18 17.9 17.9
109 sour 8.5 13.3 13.3 13.2 13.2
110 sour 11.2 13.1 13.1 13.2 13.2
111 sour 12.0 17.6 17.6 17.7 17.8
112 sour 0.1 29.9 29.9 29.9 29.9
Total 156.9
Sour Stream Average 15.7 16.1 16.0 16.0 Table has been updated since the original memo (Lord and Rudeen 2005 ) bold – recently tested
4.3.2 Insight to Cavern Oil Heterogeneity from Degasification Reports
The validity of using the top-of-cavern flowing test to serve as a representative cavern sample for BPP, GOR, and light end composition has never been directly tested. It is acknowledged that cavern integrity testing may influence the top of cavern sample, and 10,000 barrels of oil are purged from the top of the cavern prior to a flowing test to alleviate this concern. The resulting uncertainty in exactly what sample acquisition technique is likely to yield results most representative of the cavern average is especially important in light of the observation above that flowing tests give higher BP pressure values than downhole tool tests at Big Hill and Bryan Mound.
The current vapor pressure monitoring program at SPR does not have a protocol for building a profile of BPP and GOR with depth. In spite of this, current degasification data may give some insight to the depth profiles for these properties. The degas plant processes an entire cavern oil volume using a closed circulation loop, and samples the oil in the process stream for BPP, GOR, and composition at a frequency of about once an hour. Both the oil at the inlet and outlet to the plant are typically monitored. For the purposes of analyzing cavern oil for BPP versus depth, the plant inlet stream is of direct interest.
Figure 4-3 shows a schematic of a typical Big Hill style cavern, with annotation showing the position of the hanging string that draws the oil out of the cavern, and the return line that pumps oil back into the cavern after degas. Note that the normal operational configuration of the hanging string has the end submerged in the brine phase. For degas, this string is lifted so that the end is in the oil phase. Oil is drawn from the bottom of the cavern through the hanging string and routed to the degasification plant. While the hydrodynamics inside the cavern are not specifically known, it is reasonable to assume that the oil in the cavern moves generally downward as degasification progresses, with the degassed oil re-injected into the top of the cavern. A strict plug flow assumption in the cavern with no diffusion, mixing, or wall effects
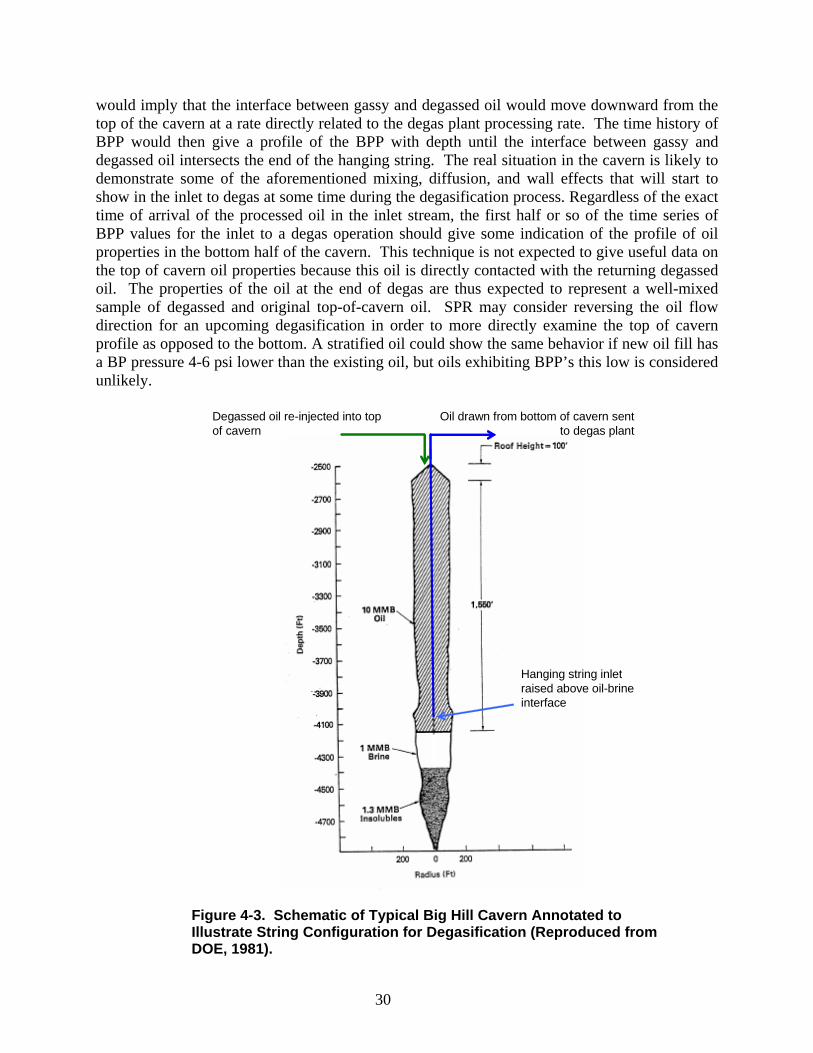
30
would imply that the interface between gassy and degassed oil would move downward from the top of the cavern at a rate directly related to the degas plant processing rate. The time history of BPP would then give a profile of the BPP with depth until the interface between gassy and degassed oil intersects the end of the hanging string. The real situation in the cavern is likely to demonstrate some of the aforementioned mixing, diffusion, and wall effects that will start to show in the inlet to degas at some time during the degasification process. Regardless of the exact time of arrival of the processed oil in the inlet stream, the first half or so of the time series of BPP values for the inlet to a degas operation should give some indication of the profile of oil properties in the bottom half of the cavern. This technique is not expected to give useful data on the top of cavern oil properties because this oil is directly contacted with the returning degassed oil. The properties of the oil at the end of degas are thus expected to represent a well-mixed sample of degassed and original top-of-cavern oil. SPR may consider reversing the oil flow direction for an upcoming degasification in order to more directly examine the top of cavern profile as opposed to the bottom. A stratified oil could show the same behavior if new oil fill has a BP pressure 4-6 psi lower than the existing oil, but oils exhibiting BPP’s this low is considered unlikely.
Hanging string inlet raised above oil-brine interface
Degassed oil re-injected into top of cavern
Oil drawn from bottom of cavern sent to degas plant
Figure 4-3. Schematic of Typical Big Hill Cavern Annotated to Illustrate String Configuration for Degasification (Reproduced from DOE, 1981).

31
To date, four caverns at Big Hill (108, 113,103 and 101) have been degassed. Inlet and outlet BP pressure histories for these four caverns are shown in Figure 4-4, where the x-axis units represent the percentage of cavern oil volume processed. All four show a distinctly different BP pressure profile with height (volume proceeds from bottom of cavern to top). BH108 shows three possible layers (indicated by horizontal lines) followed by an ever increasing mixing of the degassed oil with in the upper cavern. However, these shifts could also be due to measurement error or Grabner adjustments. Note that mixing of degassed oil with cavern oil is implied by the reduction in BP pressure in the degas inlet stream at processed volumes > 50%. BH113 shows a relatively constant BP pressure followed by a slight increase in BPP in the upper part of the cavern before mixing with degassed oil occurs near 80% volume degassed. This cavern is also the only one of the four that shows a slightly higher BPP in flowing sample tests, or conversely, a low bias in the downhole measurement (see BH113 BPP history in Appendix BPP). BH103 shows an initially flat BP pressure for the bottom quarter of the cavern oil followed by a very slow drop in pressure that accelerates smoothly until completion. BH101 shows an almost linear drop in BP pressure. This steady decline in BPP over the cavern volume implies either very fast mixing of the degassed oil or considerable heterogeneity in oil properties within the cavern. Discussions with DynMcDermott on the unique behavior of the BH101 degas inlet stream raised several other theories that are mentioned here for completeness since no particular theory has yet been verified. One theory is that a hole has developed in the hanging string somewhere near the top of the cavern that allows processed oil to enter the inlet line and lower the plant inlet BPP. This explanation would be consistent with the observed behavior in Figure 4-4, though it could not be confirmed until a string workover is performed. Another theory is that the recent oil fill at BH101 at the top of the cavern has a low BPP and thus appears as a lower-than-expected BPP at the plant inlet. The persistence of a high 15 psi inlet BPP at 120%+ cavern volume processed does not seem to corroborate this theory, however. This could be explored further if the recent fill oil properties were known, but the status of these data is not known to the authors at this time.
Also displayed on each figure are historical BPP measurements obtained from flowing (FTVP) and/or downhole (DTVP) samples. Both the flowing and downhole values for BH108 are ~17.6 psia and are within the range of the inlet stream values. The BH113 downhole tool value from 8/31/2002 is on the order of 2-3 psi lower than the flowing downhole values measured in the degas inlet stream. A historical look at BH113 shows no apparent gas regain since being filled in 1996. With an effectively static average BPP, this low downhole measurement may have been due to an insufficient sample size that led to a slightly low measurement on the TVP-95. Note that all the degas inlet oil for this cavern has BPP > 18 psi before breakthrough of the degassed oil stream around 75% cavern volume processed, so there is no other evidence of a region of 16 psi BPP oil in this cavern.
The BH103 downhole value (~18 psia, 8/19/04) shows a similar offset of about –2 psi from the degas inlet stream taken from the bottom of the cavern. An important factor to note is that side-by-side tests of the TVP-95 and TVP-2000 units were conducted on the BH103 Degas plant stream in December, 2004, and the results showed that the TVP-95 gave ~5% lower BPP values than the TVP-2000. This could account for a 1 psi difference when the samples are measuring around 20 psi. Add the effect of downhole tool limited sample size, and it is easy for the authors to envision a downhole tool sample measured with TVP-95 appearing 2 psi lower than flowing

32
samples from the TVP-2000. This cavern profile indicates that BH103 oil looks reasonably uniform within the bottom 80% of the cavern.
(a) BH108
10
14
18
22
26
0 20 40 60 80 100 120
Volume Degassed, %
BP
Pres
sure
, psi
a
OutletInlet (shifted -2.07)1/29/2002 DVTP2/7/01 FTVP
(b) BH113
8
12
16
20
24
0 20 40 60 80 100 120
Volume Degassed, %
BP
Pres
sure
, psi
a
Inlet 8/21/02 DTVPOutlet 7/30/04 FTVPInlet (shifted -2.07)
(c) BH103
10
14
18
22
26
0 20 40 60 80 100 120
Volume Degassed, %
BP
Pres
sure
, psi
a
Inlet
Outlet8/19/2004 DVTP
(d) BH101
10
14
18
22
26
0 20 40 60 80 100 120 140
Volume Degassed, %
BP
Pres
sure
, psi
aInletOutlet8/23/04 DTVP
Figure 4-4 Degas Plant Inlet and Outlet BPP Measurements for (a) BH108 (b) BH113 (c) BH103 and (d) BH101 Using the TVP-2000 Grabner. Horizontal red lines mark regions of constant BPP possibly indicating layering of oil with in cavern.
The BH101 downhole tool value (~18 psia, 8/23/04) happens to match the degas plant inlet stream value at about 30% cavern volume processed. The fact that it matches somewhere is inevitable, as there is a continuum of BPP values from 20 to 15 psi in BH101.
Several observations can be made about the degas report analysis. First, each cavern is likely to have a unique profile. Two of the four examined here were fairly uniform through the first 70% of cavern oil processed. One cavern (BH108) showed several step changes, though the significance of these are questionable given that the TVP-2000 instrument was in its first field application and was not necessarily stable. The last cavern, BH101, showed a gradual decrease in BPP through the entire volume of cavern oil processed. This could indicate very fast cavern mixing, a hole near the top of the hanging string that allows mixing of processed oil with incoming high BPP oil, or instrument error. The authors believe instrument error is the least likely of these three hypotheses given the historically stable and reliable performance of the Grabner TVP analyzer.

33
4.4 Identifying Regain through Changes in Oil Composition
It has been postulated that the increase in BPP in SPR caverns is due to an influx of highly volatile light hydrocarbons and inorganic gases, primarily methane and nitrogen, from the surrounding salt, with sources and mechanisms discussed in previous reports (Hinkebein, 2003). Quantification of the influx in terms of its effect on predicting deliverability (BPP and GOR) is of primary interest in this report. Identification of mechanisms and composition of the influx are of secondary importance and only to the extent that it contributes to prediction of regain rates. However, it is of interest for caverns that show significant regain to see if the contributors to the regain can be identified in the composition profiles generated the Gas Chromatographs (GC) used by TVP-95 and/or TVP2000 measurement/test equipment. This can, to some extent, be used to validate the GC data that is used as input to the Sandia Solver. Several factors have contributed to the difficulty in finding such data trends:
• The GC data tends to be inconsistent, indicating significant error bounds on composition that could be on the order of changes expected from gas regain.
• BPP and GOR are sensitive to small changes in gas composition of the highly volatile light hydrocarbons (C1-C4) and inert inorganic gases (are small changes real?)
• Gas composition is sensitive to temperature and pressure and, therefore, data should be evaluated at the same temperature and pressure which limits the available data set, or the data must recalculated at the same thermodynamic state using the Sandia Solver.
• Whole oil compositions are not sensitive to temperature and pressure, but are determined from gas compositions by the using the Sandia Solver.
• Light hydrocarbon content in whole oil in terms of mole fractions is very small so increases due gas regain would be even smaller
The sensitivities mentioned above are the subject of a separate report to be delivered later this year. Three cases have been identified for presentation of representative compositional data for identifying gas regain: (i) BH108 and BH109 which contain the same initial blended and degassed oil – BH108 shows significant regain by increase in BPP and BH109 does not; (ii) BM114 which has the highest estimated current regain rate; and (iii) BH103 for which there are compositional data for both the input and output streams to the Degas II Plant measured by the TVP-2000.
Figure 4-5 shows gas and whole oil compositions for BH108 on 1/29/02 and BH109 on 4/25/02. Note that gas compositions were directly measured, and whole oil compositions were calculated using the Sandia Solver. The gas composition in BH108 clearly shows a significant increase in both methane (C1) and nitrogen (N2) and a corresponding drop in C3 (propane) through C6 (hexanes), relative to BH109, to maintain the fraction balance. Note that the gas fractions are directly proportional to the partial pressures. The increase in C1 and N2 are also reflected in the whole oil composition shown in Figure 4-5(b). The conclusion is that there has been a significant influx of methane and nitrogen at BH108. It is possible, based on the BPP recovery theory discussed earlier, that differences are at least partially due to mixing with unprocessed oil in the
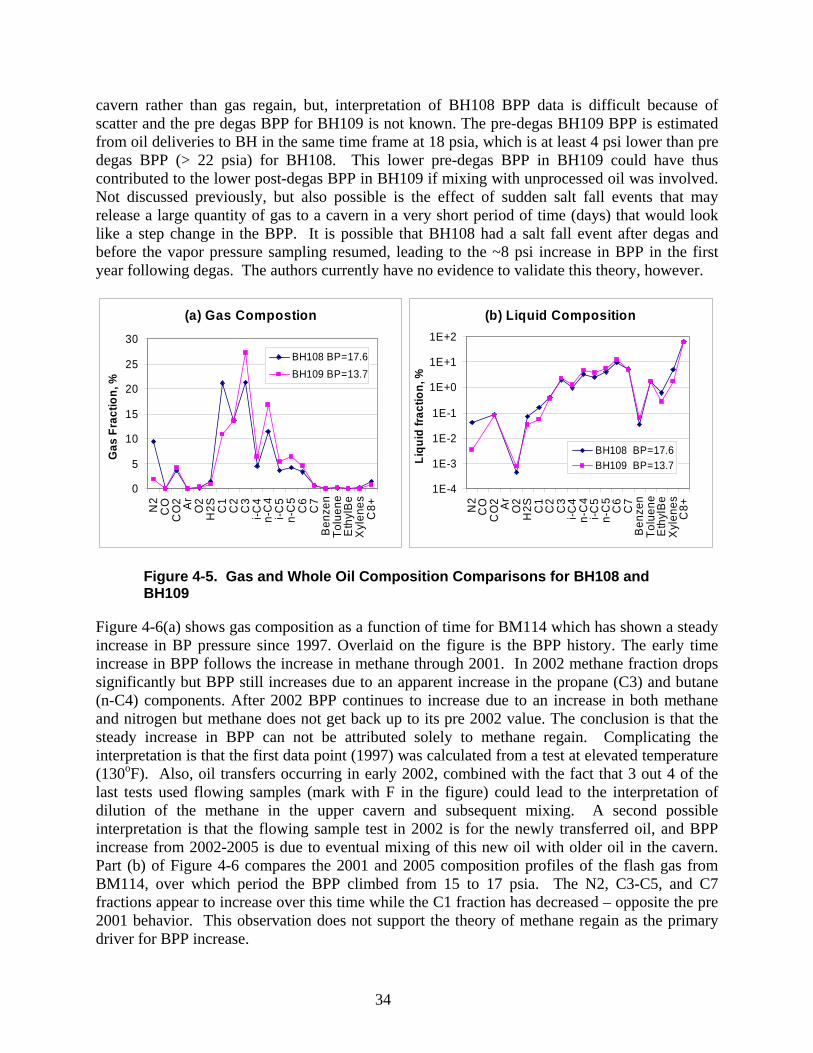
34
cavern rather than gas regain, but, interpretation of BH108 BPP data is difficult because of scatter and the pre degas BPP for BH109 is not known. The pre-degas BH109 BPP is estimated from oil deliveries to BH in the same time frame at 18 psia, which is at least 4 psi lower than pre degas BPP (> 22 psia) for BH108. This lower pre-degas BPP in BH109 could have thus contributed to the lower post-degas BPP in BH109 if mixing with unprocessed oil was involved. Not discussed previously, but also possible is the effect of sudden salt fall events that may release a large quantity of gas to a cavern in a very short period of time (days) that would look like a step change in the BPP. It is possible that BH108 had a salt fall event after degas and before the vapor pressure sampling resumed, leading to the ~8 psi increase in BPP in the first year following degas. The authors currently have no evidence to validate this theory, however.
(a) Gas Compostion
0
5
10
15
20
25
30
N2
CO
CO
2 Ar
O2
H2S C
1C
2C
3i-C
4n-
C4
i-C5
n-C
5C
6C
7B
enze
nTo
luen
eE
thyl
Be
Xyl
enes
C8+
Gas
Fra
ctio
n, %
BH108 BP=17.6BH109 BP=13.7
(b) Liquid Composition
1E-4
1E-3
1E-2
1E-1
1E+0
1E+1
1E+2
N2
CO
CO
2 Ar
O2
H2S C
1C
2C
3i-C
4n-
C4
i-C5
n-C
5C
6C
7B
enze
nTo
luen
eE
thyl
Be
Xyl
enes
C8+
Liqu
id fr
actio
n, %
BH108 BP=17.6BH109 BP=13.7
Figure 4-5. Gas and Whole Oil Composition Comparisons for BH108 and BH109
Figure 4-6(a) shows gas composition as a function of time for BM114 which has shown a steady increase in BP pressure since 1997. Overlaid on the figure is the BPP history. The early time increase in BPP follows the increase in methane through 2001. In 2002 methane fraction drops significantly but BPP still increases due to an apparent increase in the propane (C3) and butane (n-C4) components. After 2002 BPP continues to increase due to an increase in both methane and nitrogen but methane does not get back up to its pre 2002 value. The conclusion is that the steady increase in BPP can not be attributed solely to methane regain. Complicating the interpretation is that the first data point (1997) was calculated from a test at elevated temperature (130oF). Also, oil transfers occurring in early 2002, combined with the fact that 3 out 4 of the last tests used flowing samples (mark with F in the figure) could lead to the interpretation of dilution of the methane in the upper cavern and subsequent mixing. A second possible interpretation is that the flowing sample test in 2002 is for the newly transferred oil, and BPP increase from 2002-2005 is due to eventual mixing of this new oil with older oil in the cavern. Part (b) of Figure 4-6 compares the 2001 and 2005 composition profiles of the flash gas from BM114, over which period the BPP climbed from 15 to 17 psia. The N2, C3-C5, and C7 fractions appear to increase over this time while the C1 fraction has decreased – opposite the pre 2001 behavior. This observation does not support the theory of methane regain as the primary driver for BPP increase.

35
(a) BM114 Composition History
0.1
1
10
100
1000
1/96 1/98 1/00 1/02 1/04 1/06
Date
Gas
Fra
ctio
n, %
0
4.5
9
13.5
18
BP
Pres
sure
, psi
a
BP
C3
n-C4C2
N2 C5
CO2
C6
C1
F F F
(b) BM114 Gas Composition Profiles
0
5
10
15
20
25
30
35
N2
CO
CO
2 Ar
O2
H2S C
1C
2C
3i-C
4n-
C4
i-C5
n-C
5ic
6C
6m
cpB
enze
ne cc6
C7
mch
Tolu
ene
ic8
c8s
Eth
Xyle
nes
c9s
c10+
Component
Gas
Fra
ctio
n, %
01/10/01
01/25/05
Figure 4-6. Gas Composition Histories and Component Profiles for BM114.
Finally, Figure 4-7 shows snapshots of Degas Plant inlet and outlet gas and oil compositions for BH103. The gas composition shows an order of magnitude decrease in both methane and nitrogen and corresponding increases in C3 through C6. The oil whole oil composition shows a corresponding decrease in methane, nitrogen, oxygen, benzene, toluene and xylene, though a log scale is required to observe the changes. Most relevant to the observed bubble points are nitrogen and C1-C4 mole fractions. This extent of nitrogen reduction is not universal for other

36
degassed caverns. According to cavern degas completion reports for BH108 and BH113 (Espinosa, 2004; Mihalik, 2004), a smaller decrease in nitrogen mole fraction was observed in the whole oil degas outlet stream, 50% and 30%, respectively. Meanwhile, an order of magnitude reduction was typical for methane. Hence, the vapor pressure reduction in degassed oils is mainly due to methane removal. This example demonstrates that current uncertainties in compositional measurements can make it difficult to confirm a cause-effect relationship from just one sample.
(a) BH103 Gas Compostion
05
10152025303540
N2
CO
CO
2 Ar
O2
H2S C
1C
2C
3i-C
4n-
C4
i-C5
n-C
5C
6C
7B
enze
nTo
luen
eE
thyl
Be
Xyl
enes
C8+
Gas
Fra
ctio
n, %
Inlet BP=17.8Outlet BP=11.2
(b) BH103 Liquid Composition
1E-51E-41E-31E-21E-11E+01E+11E+2
N2
CO
CO
2 Ar
O2
H2S C
1C
2C
3i-C
4n-
C4
i-C5
n-C
5C
6C
7B
enze
nTo
luen
eE
thyl
Be
Xyl
enes
C8+
Liqu
id fr
actio
n, %
Inlet BP=17.8Outlet BP=11.2
Note: values in the figure without makers, Ar and CO for example, are actually zero.
Figure 4-7. BH103 Gas and Whole Oil Compositions for Degas Plant II Inlet and Outlet Streams.
4.5 Results of Regain Analysis
Values of BPP, GOR and regain rates (ΔBPP/Δt) estimated in this report were determined by a slightly different method than was used previously for interpretation of the existing data set contained in the four Site Quarterly Reports. Data have been screened by test (BPP, GOR) measurement method (measured, calculated) and sampling method (flowing, downhole) in order to provide the best estimate of current gas regain rates instead of “average” rates since fill or degas. Current values of BPP and GOR are estimated using the linear least squares fit rather than the latest measured value. Figure 4-8 summarizes the BPP histories since fill or latest degas for all caverns at a given site, separated by stream type (sweet or sour). Linear regression fits are shown for the screened data for each cavern. Two general trends are visible: (i) results tend to cluster around two BPP values 14 and 18 psi plus or minus 2 psi; and (ii) caverns with possible significant regain (≥ 0.2 psi/yr) show positive slopes distinctly different than the other caverns within the stream. Curves with high positive slopes are labeled with their corresponding cavern number, and are listed in Table 4-4 along with some author comments. Negative slopes should be interpreted as zero regain since there is currently no plausible gas loss mechanism. Table 4-5 shows caverns with stable BP pressures after degas that are significantly higher than the reported degas outlet stream value. The implication is that the stable BPP value is the in-cavern post degas value. The BPP recoveries identified in Table 4-5 are caused by either an intentional partial degas (WH107 and WH113, for example) and/or by mixing of degassed and gassy oil bypassed during degas operations. In Table 4-4, cavern BM114, which shows the largest gas regain rate, is listed in bold.

37
BH Sweet Stream BPP vs Time at 100 F
12
14
16
18
20
22
1/85 1/89 1/93 1/97 1/01 1/05 1/09
Date
BP P
ress
ure,
psi
a
101
105
BH Sour Stream BPP vs Time at 100 F
12
14
16
18
20
22
1/85 1/89 1/93 1/97 1/01 1/05 1/09Date
BP P
ress
ure,
psi
a
BM Sour Stream BPP vs Time at 100 F
12
14
16
18
20
22
1/77 1/81 1/85 1/89 1/93 1/97 1/01 1/05 1/09
Date
BP
Pres
sure
, psi
a
1
111 103
BM Sweet Stream BPP vs Time at 100 F
12
14
16
18
20
22
1/77 1/81 1/85 1/89 1/93 1/97 1/01 1/05 1/09
Date
BP P
ress
ure,
psi
a
114
115
WH Sweet Stream BPP vs Time at 100 F
12
14
16
18
20
22
1/77 1/81 1/85 1/89 1/93 1/97 1/01 1/05 1/09
Date
BP P
ress
ure,
psi
a 111
115
WH Sour Stream BPP vs Time at 100 F
12
14
16
18
20
22
1/77 1/81 1/85 1/89 1/93 1/97 1/01 1/05 1/09
Date
BP P
ress
ure,
psi
a
116
BC Sweet and Sour at 100 F
10
12
14
16
18
20
22
1/77 1/81 1/85 1/89 1/93 1/97 1/01 1/05 1/09Date
BP P
ress
ure,
psi
a
19
15
Solid lines are sour streams. Dashed lines are sweet streams.
Figure 4-8. Linear Least Squares Fit to BP Pressures at Bryan Mound, Big Hill, West Hackberry and Bayou Choctaw.

38
Table 4-4. Caverns Showing Regain Rates of at Least 0.2 psi/yr (Rounded).
Cavern Stream Current
BPP, psia
Current Rate psi/yr
Comment
BH101 Sweet 15.2 0.24 Recently degassed. Final Degas Plant inlet value is shown.
BH105 Sweet 14.1 0.19 15% new oil since degas
BH112 Sour 19.6 0.18 Rate increase due to recent downhole flowing test result
BM114 Sweet 16.8 0.50 Historically gassy cavern, largest current regain
BM1 Sour 13.4 0.18 All flowing tests, top-of-cavern oil effect
BM111 Sour 17.6 0.24 66% new oil since degas
WH116 Sweet 19.3 0.28 Last point flowing test, top-of-cavern oil effect. Tested lower than estimated delivery BPP (i.e. estimate is bad)
WH115 Sour 20.3 0.34 Last point flowing test, top-of-cavern oil effect. Tested lower than estimated delivery BPP (i.e. estimate is bad)
Table 4-5. Caverns with Low Current Regain Rates, but, with BP Pressure Recoveries Greater than 3 psi after Degasification.
Cavern Stream BPP, psia
BH106 sour 2.8
BH108 sour 7.9
BH109 sour 3.2
BM111 sour 4.0
WH107 sweet 3.5
WH113 sweet 3.2
BC18 sweet 3.4
The slow regain (3 psi in 16 years or <0.2 psi/yr) for caverns at West Hackberry, particularly the sour stream caverns (Figure 4-8), is due to BP pressures measured in 1993-1994 that were lower than both the estimated delivery BPP and more recently measured data. Removing the estimated delivery value from the regression resulted in shifting the regain rate from nearly zero to the small positive value shown. WH115 and WH116 are good examples (see histories in Appendix BPP).

39
Two Bayou Choctaw sour stream caverns show strong negative regain or gas loss (Figure 4-8). This is either due to an influence of recent deliveries or brings into question the reliability of either the 1994 measured data or the more current 2003 data. In either case, if the 1994 data are not used, the two curves in question would be flat at their current BPP values (14 to 15 psia).
Of particular interest is cavern BM114 which shows a steady, large regain rate and has historically been identified as a gassy cavern. BH114, which also has been historically gassy, was evaluated by Hinkebein and Ehgartner in a September 2001 memo. At the time there was only about 0.13 MMB of oil in the cavern. It does not show up in this analysis because of the addition of 10 MMB of oil since 2002 and it has only a single good data point since being filled. Gas regain rates should be lower than previously estimated due the much larger quantity of oil available for absorbing the inflow of gas.
Current best estimates of BPP, regain rates, standard deviations and upper bounds to gas intrusion rates for all SPR sites are provided on a cavern by cavern basis in history plots and tables in Appendix BPP. The bounding rates are determined from the best estimate plus two standard deviations (2σ). For a normal distribution assumption, 2σ provides a 95.5% confidence level that the rate will be less than the bounding value. The standard deviation, σ, has been included in table as an indicator of the confidence in the estimated data value. The smaller the σ relative to the data value the more reliable data. Conversely, a large σ would indicate a large amount of scatter in the measured data and a less reliable estimate. Also shown in the tables are the values from Hinkebein (2003) which provide a basis for determining the impact of the current interpretation methods. The comparisons with earlier interpretations will be based on blended stream averages at 100oF summarized in Table 4-6.
The Big Hill blended stream averages include the effects of the recent degassing of caverns BH101, BH103, BH108 and BH113. For these caverns the post degas BPP value was taken from Table 4-1. Recall that these values are the final Degas Plant inlet values. In forecasts of future degas operations, one of the average BPP recovery fractions could be applied to the expected Degas Plant inlet and outlet values or a pressure increment could be added to the expected outlet BPP based on one of the average BPP Recoveries also listed in Table 4-1.
Table 4-6. Blended Stream BP Pressures and Intrusion Rates at 100oF.
Hinkebein (2003) Current Estimates
Stream BPP, psia
Rate, psi/yr
σ(b), psi/yr
BPP, psia
σ(BPP), psi
Rate, psi/yr
σ(b), psi/yr
BM Sweet 17.2 0.21 0.1 17.5 0.21 0.10 0.02
BM Sour 16.5 0.29 0.05 16.0 0.23 0.06 0.03
BH Sweet 16.8 0.24 0.08 16.4 0.43 0.13 0.04
BH Sour 16.0 0.45 0.15 15.1 0.40 0.05 0.05
WH Sweet 17.0 0.13 0.05 17.5 0.21 0.10 0.02
WH Sour 17.6 0.01 0.02 16.0 0.23 0.06 0.03
BC Sweet 16.1 0 0.05 16.2 1.07 0 0.55 BC Sour 14.8 0.08 0.07 14.8 0.42 0 0.04

40
Most streams showed significant decreases in stream averaged regain rates. The exception, WH sour, showed only a very slight increase (0.01 to 0.06 psi/yr). Most streams also showed a decrease in the standard deviation of the rate. The exception, BC sweet, consists of two caverns. One of these, BC18, has limited and scattered data, which is manifested as a large standard deviation (0.79 psi/yr). The remaining standard deviations are either lower or nearly the same as reported in 2003 indicating that, in general, the current regression “fits” the screened data better than in the previous analyses. Figure 4-9 shows projections of blended stream averaged BPP over the next 8 years for all sites at standard temperature 100oF, based on the values given in Table 4-6. Note that these are not at the expected delivery temperatures.
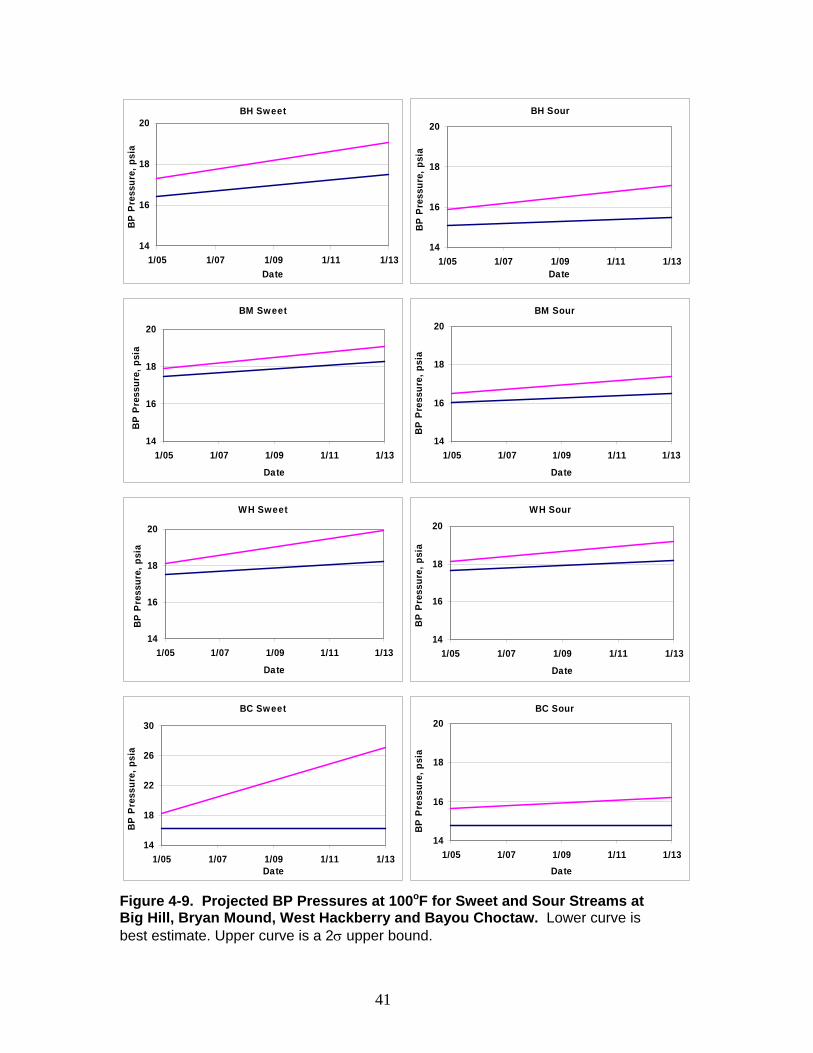
41
BH Sweet
14
16
18
20
1/05 1/07 1/09 1/11 1/13Date
BP P
ress
ure,
psi
a
BH Sour
14
16
18
20
1/05 1/07 1/09 1/11 1/13Date
BP P
ress
ure,
psi
a
BM Sweet
14
16
18
20
1/05 1/07 1/09 1/11 1/13
Date
BP
Pres
sure
, psi
a
BM Sour
14
16
18
20
1/05 1/07 1/09 1/11 1/13
Date
BP P
ress
ure,
psi
a
WH Sweet
14
16
18
20
1/05 1/07 1/09 1/11 1/13
Date
BP P
ress
ure,
psi
a
WH Sour
14
16
18
20
1/05 1/07 1/09 1/11 1/13
Date
BP P
ress
ure,
psi
a
BC Sweet
14
18
22
26
30
1/05 1/07 1/09 1/11 1/13Date
BP P
ress
ure,
psi
a
BC Sour
14
16
18
20
1/05 1/07 1/09 1/11 1/13Date
BP P
ress
ure,
psi
a
Figure 4-9. Projected BP Pressures at 100oF for Sweet and Sour Streams at Big Hill, Bryan Mound, West Hackberry and Bayou Choctaw. Lower curve is best estimate. Upper curve is a 2σ upper bound.

42
4.6 Analysis of GOR Regain
The interpreted GOR values discussed in this section resulted from a linear regression analysis of the data in the four site Quarterly Reports, screened as discussed in Section 4. Current best estimates of GOR, GOR rates, standard deviations and upper bounds to gas intrusion rates for all SPR sites are provided on a cavern by cavern basis in history plots and tables in Appendix GOR. The GOR data is summarized as blended stream averages at 100oF in Table 4-7. Current estimated stream averaged GOR and regain rates are lower than those estimated in 2003 and include the impacts of both screening and inclusion of new data since 2003. The largest impact was from removing the GOR calculated from a BPP tests which tended to be high. Standard deviations also tended to be lower (except BC sweet) again indicating a possibly better “fit”. The Big Hill blended stream averages include the effects of the recent degassing of caverns BH101, BH103, BH108 and BH113. For these caverns the 1Plant Model GOR versus BPP regression was assumed.
Table 4-7. Blended Stream GOR and Regain Rates at 100oF.
Hinkebein (2003) Current estimates
Stream GOR, scf/BBL
Rate, scf/BBL/yr
σ(b), scf/BBL/yr
GOR, scf/BBL
σ(GOR), scf/BBL
Rate, scf/BBL/yr
σ(b), scf/BBL/yr
BM Sweet 2.15 .16 .19 0.84 0.28 0.06 0.02
BM Sour 1.36 .12 .03 0.35 0.19 0.02 0.03
BH Sweet 1.33 .07 .03 0.33 0.46 0.02 0.04
BH Sour 0.47 .10 .06 0.12 0.15 0.03 0.02
WH Sweet 1.01 .03 .10 0.80 0.13 0.01 0.03
WH Sour 1.08 0.0 .01 1.07 0.11 0.03 0.01
BC Sweet 0.93 .02 .22 1.2 1.10 0 0.75
BC Sour 0.0 .02 .04 0.05 0.20 0.01 0.07
Traditionally, accurate GOR measurements are hard to obtain and data have been suspect. Therefore, a non-linear regression fit (found in the 1Plant Model spreadsheet) of GOR versus BPP has been recommended for use in downstream analyses instead of the estimates from the GOR versus time regression. As can be seen in the GOR histories (Appendix GOR), the screened GOR measurements are more consistent (less scattered) than the complete set. For evaluation against the 1Plant Model regression equation, the latest GOR data is plotted as function of the latest BPP results across all caverns in Figure 4-10. Overlaid on the figure are the 1Plant Model regression fit:
20.01776 0.27786 0.23723GOR BP BP= − +
and a linear least squares trend line generated by Excel:
0.3132 4.60174GOR BP= −

43
A linear fit is used because of the influence of the BM data point near 29 psig that caused a near zero coefficient for the quadratic term in a quadratic fit. The 1Plant Model regression is still considered a reasonable fit to the new data except for the one point near 29 psig. This point is BM112 which is about 2% filled.
-2
0
2
4
6
10 15 20 25 30BP Pressure, psia
GO
R, s
cf/b
bl
BHBMWHBCLinear Regression1Plant Regression
Figure 4-10. Aggregated GOR Versus BP Pressure Data from All Caverns with Linear and Non-linear Bryan Mound Regression Fits.
Projected GOR over the next 8 years for blended streams at 100oF for each site are shown in Figure 4-11. Projections are based on data in Table 4-7. Again, the lower curve is the current best estimate and the upper curve is a 2σ upper bound. The upper bound for the BC sweet stream is large because there are very few data points.

44
BH Sweet
0
1
2
3
1/05 1/07 1/09 1/11 1/13Date
GO
R, s
cf/b
bl
BH Sour
0
1
2
1/05 1/07 1/09 1/11 1/13Date
GO
R, s
cf/b
bl
BM Sour
14
16
18
20
1/05 1/07 1/09 1/11 1/13
Date
BP P
ress
ure,
psi
a
BM Sour
0
1
2
1/05 1/07 1/09 1/11 1/13
Date
GO
R, s
cf/b
bl
WH Sweet
0
1
2
1/05 1/07 1/09 1/11 1/13Date
GO
R, s
cf/b
bl
WH Sour
0.0
1.0
2.0
1/05 1/07 1/09 1/11 1/13Date
GO
R, s
cf/b
bl
BC Sweet
0
2
4
6
8
1/05 1/07 1/09 1/11 1/13Date
GO
R, s
cf/b
bl
BC Sour
0.0
1.0
2.0
1/05 1/07 1/09 1/11 1/13Date
GO
R, s
cf/b
bl
Figure 4-11. Projected GOR at 100oF for Sweet and Sour Streams at Big Hill, Bryan Mound, West Hackberry and Bayou Choctaw. Lower curve is best estimate. Upper curve is a 2σ upper bound.

45
5 Summary This report presents an analysis of the SPR vapor pressure database, covering data from 1993-2005. The main objectives were to screen the data to reduce scatter and increase confidence level in the remaining data, evaluate the impacts of flowing versus downhole sample acquisition methods, examine whether vapor pressure increases correlate with the presence of methane in SPR oils, and estimate the current rate of change in bubble point pressure and gas-oil ratio in the SPR inventory.
First, the data were screened to reduce uncertainty, and generally only measured values of BPP and GOR were used in the analysis. Also, this report includes data from the period 2003-2005 in order to expand upon the last comprehensive analysis presented by Hinkebein (2003). Resulting cavern and stream-averaged rates of current BPP and GOR rise are lower than both those reported by Hinkebein (2003), and others published in quarterly vapor pressure reports distributed by DynMcDermott. The main reasons are that data scatter has been reduced by including only measured data, and some early values were removed from the regression fits to BPP data because the values do not represent cavern-average values, which are the operative parameter in judging the suitability of a cavern oil against delivery requirements. The resulting regression fits to BPP history data give what the authors believe to be the best estimates of current BPP increase rates for the SPR caverns. In general, very little regain is observed. This being said, many cavern and stream vapor pressures exceed 14.7 psia and require degasification, but this is largely due to the properties of the incoming oil and the tendency of leaching to release trapped gases to the caverns. Gas intrusion during storage at SPR does not appear to currently serve as dominant a factor as was historically reported.
Also explored was the effect of flowing versus downhole sampling on the BPP for Bryan Mound and Big Hill caverns. A significant bias was observed in Bryan Mound and Big Hill data in the 2000-2005 data where flowing samples gave, on average, 0.9 psi higher BPP for Bryan Mound, and 3.3 psi higher BPP for Big Hill. The possible causes for this bias were discussed. Among the leading hypotheses are: oil heterogeneity within a cavern, systematic error in downhole sample handling, insufficient volume for downhole samples, or systematic error in flowing sample technique. BPP from degas histories were examined to see if spatial heterogeneity in BPP is possible inside a cavern. The result was that there is likely spatial heterogeneity in some caverns, but no correlation between roof and mid-cavern values was possible with the given data.
The specific correlation between methane and BPP was also examined in three select cases. Methane intrusion has historically been identified as a likely driver for BPP increase at SPR. This spot-check intended to test that theory. In the first case, two caverns, BH108 and BH109, assumed to start with identical oils in late 1997 were compared for BPP and methane content in the flash gas. These caverns were selected because BPP for BH108 was 17.6 psi prior to recent degasification, while BPP for BH109 is 13.7 psi. BH108 showed nearly double the methane and 4 times the nitrogen mole fraction in the flash gas over BH109 at the respective bubble point pressures. In the second case, gas compositions for BM114 were plotted against time and BPP. While BPP consistently rose over the period, methane and nitrogen mole fraction in the flash gas fluctuated up and down. Also, propane and butane mole fraction appeared to increase with time, and may account for some of the BPP increase. Finally, the compositions of cavern BH103 pre-

46
and post-degas were compared. The plant outlet stream BPP was lowered by 25%, with corresponding order-of-magnitude reductions in whole oil mole fractions of methane, nitrogen, and oxygen. While methane concentration does appear to drive some high BPP caverns, it is not clear from these selected examples that methane alone is behind high BPP in SPR oils. One of the most consistent gas regain caverns, BM114, shows both positive and negative fluctuations in methane content over time in spite of a steady increase in BPP over an 8 year period.
6 Acknowledgements The authors wish to thank Patrick Mihalik, Thomas Jones, Lisa Eldredge, and Collins Lanier of DynMcDermott Petroleum Operations Company, Ray Allen of Allen Energy Services, and Brian Ehgartner of Sandia National Laboratories for support in collecting and analyzing the SPR vapor pressure data, and reviewing this report.
7 References Ehgartner, B.L., J.L. Neal, T.E. Hinkebein. 1998. Gas releases from Salt. SAND98-1354.
Albuquerque, NM; Sandia National Laboratories.
Espinosa, S. 2004. Memo to Mr. James Quern, US Department of Energy, Re: Contract No. DE-AE96-03PO92207; Big Hill Cavern 108 Degas Report, Dated October 6, 2004. 60003-EOE-04-0406Rev2. New Orleans, LA: DynMcDermott Petroleum Operations Company.
Hinkebein, T.E., S.J. Bauer, B.L. Ehgartner, J.K. Linn, J.T. Neal, J.L. Todd, P.S. Kuhlman, C.T. Gniady, H.N. Giles. 1995. Gas Intrusion into SPR Caverns. SAND94-0023. Albuquerque, NM; Sandia National Laboratories.
Hinkebein, T.E. 2003. Compilations of Gas Intrusion Measurements, Variations, and Consequence Modeling for SPR Caverns. SAND2003-0330. Albuquerque, NM: Sandia National Laboratories.
Lord, D.L. and D.K. Rudeen. 2005 Memo to Gerard Berndsen (DOE) re: Summary of BM and BH Flowing and Downhole VP Test Results Since 2000, dated March 7, 2005. Albuquerque, NM: Sandia National Laboratories.
Lott, S.E. 1996. Analysis of Strategic Petroleum Reserve Bubble Point Pressure Data. SAND96-1172. Albuquerque, NM; Sandia National Laboratories.
Mihalik, P.L. 2004. Memo to Mr. James Quern, US Department of Energy, Re: Contract No. DE-AE96-03PO92207; Big Hill Cavern Degas Report, Dated November 18, 2004. 62005-TWJ-04-045 Rev 1. New Orleans, LA: DynMcDermott Petroleum Operations Company.

47
DOE (US Department of Energy). 1981. Final Supplement to Final Environmental Impact Statements, Phase III Development, Texoma and Seaway Group Salt Domes. DOE/EIS-0075. Washington, DC: U.S. Department of Energy
DOE (US Department of Energy). 1999. Strategic Petroleum Reserve Technical and Performance Criteria, Level I. DOE/FE-0403. Washington, DC: U.S. Department of Energy, Office of Fossil Energy, Strategic Petroleum Reserve.

48
Appendix BPP Table BPP-1. Bayou Choctaw BPP, Regain Rates and Comparisons with 2003 Values.
Hinkebein (2003) Current Estimates
BC Cavern
Stream BPP, psia
Rate, psi/yr
σ(b), psi/yr
Max Rate, psi/yr
BPP, Psia
σ(BPP), psi/yr
Rate, psi/yr
σ(b), psi/yr
Max Rate, psi/yr
18 Sweet 14.9 0.01 0.53 1.07 15.4 1.52 0. 0.79 1.6
20 Sweet 18.2 0 0.06 0.12 17.9 0.77 0.01 0.08 0.2
Stream Average 16.1 0 0.05 0.1 16.2 1.07 0 0.55 1.1
15 Sour 14.5 0 0.07 0.14 14.0 0.67 0 0.03 0.07
17 Sour 13.8 0.35 0.2 0.75 13.6 0 0 0 0
19 Sour 15.9 0 0.05 0.1 14.5 0.78 0 0.04 0.08
101 Sour 14.8 0 0.25 0.5 17.1 1.37 0 0.14 0.28
Stream Average 14.8 0.08 0.07 0.22 14.8 0.42 0 0.04 0.07
Table BPP-2. Big Hill BPP, Regain Rates and Comparisons with 2003 Values.
Hinkebein (2003) Current Estimates
BH Cavern
Stream BPP, psia
Rate, psi/yr
σ(b), psi/yr
Max Rate, psi/yr
BPP, psia
σ(BPP), psia
Rate, psi/yr
σ(b), psi/yr
Max Rate, psi/yr
101 sweet 18.3 0.12 0.08 0.28 15.2+ 0.86 0.24 0.1 0.45
102 sweet 17.5 0.02 0.07 0.16 17.9 0.47 0.14 0.06 0.26
103 sweet 22.0 0.42 0.17 0.76 13.7+ 1.64 0.13 0.13 0.40
104 sweet 22.5 0.53 0.15 0.83 17.9 0.95 0.07 0.09 0.26
105 sweet 13.8 0.41 0.13 0.67 14.1 0.28 0.19 0.08 0.35
114 sweet 23.7 0.5 1.69 3.88 20.0 0* 0 0 0
Stream Average 16.8 0.24 0.08 0.4 16.4 0.43 0.13 0.04 0.22
106 sour 13.7 0.34 0.82 1.98 13.7 0.42 0 0.08 0.16
107 sour 14.5 0.61 0.33 1.27 14.3 0.31 0.12 0.07 0.27
108 sour 17.6 0.75 0.51 1.77 13.0+ 0.76 0 0.16 0.32
109 sour 13.7 0.29 0.38 1.05 13.7 0.57 0 0.11 0.22
110 sour 16.5 0 0.14 0.28 16.3 .40 0 0.07 0.14
111 sour 17.4 0.49 0.29 1.07 17.4 1.80 0.1 0.15 0.40
112 sour 16.6 0.17 0.18 0.53 19.6 1.76 0.18 0.23 0.64
113 sour 18.1 0.9 0.39 1.68 12.6+ 1.38 0 0.12 0.23
Stream Average 16.0 0.45 0.15 0.75 15.1 0.40 0.05 0.05 0.15
* BH114 has only 1 good data point. Not included in stream average of σ. +These caverns were recently degassed and BPP is based on the late time Degas Plant Inlet stream.
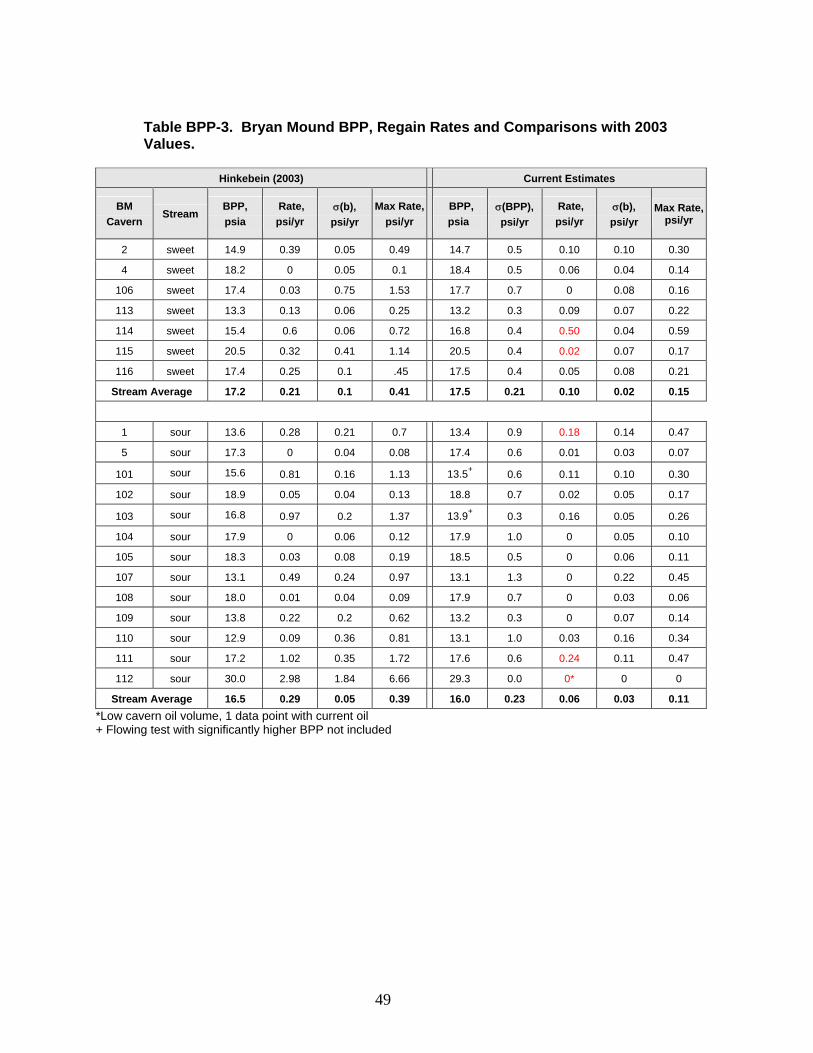
49
Table BPP-3. Bryan Mound BPP, Regain Rates and Comparisons with 2003 Values.
Hinkebein (2003) Current Estimates
BM Cavern
Stream BPP, psia
Rate, psi/yr
σ(b), psi/yr
Max Rate, psi/yr
BPP, psia
σ(BPP), psi/yr
Rate, psi/yr
σ(b), psi/yr
Max Rate, psi/yr
2 sweet 14.9 0.39 0.05 0.49 14.7 0.5 0.10 0.10 0.30
4 sweet 18.2 0 0.05 0.1 18.4 0.5 0.06 0.04 0.14
106 sweet 17.4 0.03 0.75 1.53 17.7 0.7 0 0.08 0.16
113 sweet 13.3 0.13 0.06 0.25 13.2 0.3 0.09 0.07 0.22
114 sweet 15.4 0.6 0.06 0.72 16.8 0.4 0.50 0.04 0.59
115 sweet 20.5 0.32 0.41 1.14 20.5 0.4 0.02 0.07 0.17
116 sweet 17.4 0.25 0.1 .45 17.5 0.4 0.05 0.08 0.21
Stream Average 17.2 0.21 0.1 0.41 17.5 0.21 0.10 0.02 0.15
1 sour 13.6 0.28 0.21 0.7 13.4 0.9 0.18 0.14 0.47
5 sour 17.3 0 0.04 0.08 17.4 0.6 0.01 0.03 0.07
101 sour 15.6 0.81 0.16 1.13 13.5+ 0.6 0.11 0.10 0.30
102 sour 18.9 0.05 0.04 0.13 18.8 0.7 0.02 0.05 0.17
103 sour 16.8 0.97 0.2 1.37 13.9+ 0.3 0.16 0.05 0.26
104 sour 17.9 0 0.06 0.12 17.9 1.0 0 0.05 0.10
105 sour 18.3 0.03 0.08 0.19 18.5 0.5 0 0.06 0.11
107 sour 13.1 0.49 0.24 0.97 13.1 1.3 0 0.22 0.45
108 sour 18.0 0.01 0.04 0.09 17.9 0.7 0 0.03 0.06
109 sour 13.8 0.22 0.2 0.62 13.2 0.3 0 0.07 0.14
110 sour 12.9 0.09 0.36 0.81 13.1 1.0 0.03 0.16 0.34
111 sour 17.2 1.02 0.35 1.72 17.6 0.6 0.24 0.11 0.47
112 sour 30.0 2.98 1.84 6.66 29.3 0.0 0* 0 0
Stream Average 16.5 0.29 0.05 0.39 16.0 0.23 0.06 0.03 0.11 *Low cavern oil volume, 1 data point with current oil + Flowing test with significantly higher BPP not included

50
Table BPP-4. West Hackberry BPP, Regain Rates and Comparisons with 2003 Values.
Hinkebein (2003) Current Estimates
WH Cavern
Stream BPP, psia
Rate, psi/yr
σ(b), psi/yr
Max Rate, psi/yr
BPP, psia
σ(BPP), psi/yr
Rate, psi/yr
σ(b), psi/yr
Max Rate, psi/yr
7 sweet 17.9 0 0.27 0.54 17.4 1.3 0 0.30 0.60
101 sweet 18.3 0 0.04 0.08 17.9 0.9 0 0.10 0.19
102 sweet 18.5 0.02 0.19 0.4 19.1 1.1 0.12 0.16 0.44
103 sweet 14.4 0.51 0.11 0.73 14.1 0.0 0 0 0
104 sweet 16.3 0 0.07 0.14 18.7 0.8 0.16 0.06 0.29
105 sweet 18.2 0 0.05 0.1 18.9 0.7 0.10 0.06 0.22
107 sweet 15.1 0.71 0.07 0.85 14.7 0.3 0 0.11 0.21
108 sweet 17.8 0 0.06 0.12 18.1 0.8 0.11 0.08 0.26
110 sweet 17.8 0 0.08 0.16 18.3 1.0 0.15 0.09 0.33
113 sweet 13.4 0.38 0.06 0.5 14.6 2.1 0 0.71 1.42
116 sweet 18.1 0 0.1 0.2 19.3 0.6 0.28 0.08 0.45
Stream Average 17.0 0.13 0.05 0.23 17.5 0.31 0.09 0.07 0.22
6 sour 18.4 0 0.06 0.12 17.4 1.1 0.02 0.11 0.24
8 sour 16.2 0 0.09 0.18 16.8 0.9 0 0.13 0.26
9 sour 19.1 0.04 0.09 0.22 16.9 1.4 0.05 0.18 0.42
11 sour 17.8 0 0.06 0.12 16.1 0.9 0 0.08 0.16
106 sour 17.0 0 0.06 0.12 16.7 0.7 0 0.07 0.14
109 sour 16.6 0 0.08 0.16 17.7 0.8 0.13 0.10 0.34
111 sour 18.5 0.09 0.12 0.33 20.0 1.3 0.13 0.12 0.37
112 sour 17.2 0 0.05 0.1 17.2 0.7 0.03 0.11 0.24
114 sour 16.7 0 0.05 0.1 16.6 0.6 0 0.05 0.10
115 sour 18.3 0 0.11 0.22 20.3 0.6 0.34 0.07 0.48
117 sour 17.9 0 0.03 0.06 18.0 0.3 0.03 0.02 0.07
Stream Average 17.6 0.01 0.02 0.16 17.6 0.26 0.07 0.03 0.13

51
BH101
10
14
18
22
26
1/88 1/92 1/96 1/00 1/04 1/08Date
BP
Pres
sure
(psi
a)
0
10
20
Volu
me
(MM
B)
BH102
10
14
18
22
26
1/88 1/92 1/96 1/00 1/04 1/08Date
BP
Pres
sure
(psi
a)
0
6
12
Volu
me
(MM
B)
BH103
10
14
18
22
26
1/88 1/92 1/96 1/00 1/04 1/08
Date
BP
Pres
sure
(psi
a)
0
6
12
Volu
me
(MM
B)
BH104
10
14
18
22
26
1/88 1/92 1/96 1/00 1/04 1/08Date
BP
Pres
sure
(psi
a)
0
10
20
Volu
me
(MM
B)
BH105
10
14
18
22
26
1/88 1/92 1/96 1/00 1/04 1/08Date
BP
Pres
sure
(psi
a)
0
5
10
15
20
Volu
me
(MM
B)
BH106
10
14
18
22
26
1/88 1/92 1/96 1/00 1/04 1/08Date
BP
Pres
sure
(psi
a)
0
5
10
15
20
Volu
me
(MM
B)
BH107
10
14
18
22
26
1/88 1/92 1/96 1/00 1/04 1/08
Date
BP
Pres
sure
(psi
a)
0
4
8
12
16
Volu
me
(MM
B)
BH108
10
14
18
22
26
30
1/88 1/92 1/96 1/00 1/04 1/08
Date
BP
Pres
sure
(psi
a)
0
2
4
6
8
10
Volu
me
(MM
B)
DH

52
BH109
10
14
18
22
26
1/88 1/92 1/96 1/00 1/04 1/08Date
BP
Pres
sure
(psi
a)
0
7
14
Volu
me
(MM
B)
BH110
10
14
18
22
26
1/88 1/92 1/96 1/00 1/04 1/08Date
BP
Pres
sure
(psi
a)
0
6
12
Volu
me
(MM
B)
BH111
10
14
18
22
26
1/88 1/92 1/96 1/00 1/04 1/08
Date
BP
Pres
sure
(psi
a)
0
7
14
Volu
me
(MM
B)
BH112
10
14
18
22
26
1/88 1/92 1/96 1/00 1/04 1/08Date
BP
Pres
sure
(psi
a)
0
7
14
Volu
me
(MM
B)
DH
BH113
10
14
18
22
26
1/88 1/92 1/96 1/00 1/04 1/08Date
BP
Pres
sure
(psi
a)
0
6
12
Volu
me
(MM
B)
DH
BH114
10
14
18
22
26
1/88 1/92 1/96 1/00 1/04 1/08
Date
BP
Pres
sure
(psi
a)
0
8
16
Volu
me
(MM
B)
Figure BPP-1. Big Hill BPP and Transfer Histories with Linear Regression Fit.

53
BM 1
10
14
18
22
26
1/77 1/81 1/85 1/89 1/93 1/97 1/01 1/05 1/09
Date
BP
Pres
sure
, psi
a
0
5
10
Volu
me,
MM
B
BM2
10
20
30
40
50
60
70
1/77 1/81 1/85 1/89 1/93 1/97 1/01 1/05 1/09Date
BP
Pres
sure
, psi
a
0
6
12
Volu
me,
MM
B
BM4
10
14
18
22
26
1/77 1/81 1/85 1/89 1/93 1/97 1/01 1/05 1/09
Date
BP
Pres
sure
, psi
a
0
12
24
Volu
me,
MM
B
BM 5
10
14
18
22
26
1/77 1/81 1/85 1/89 1/93 1/97 1/01 1/05 1/09
Date
BP
Pres
sure
, psi
a
0
10
20
30
40
Volu
me,
MM
B
BM101
10
14
18
22
26
1/77 1/81 1/85 1/89 1/93 1/97 1/01 1/05 1/09Date
BP
Pres
sure
, psi
a
0
8
16
Volu
me,
MM
B
BM102
10
14
18
22
26
1/77 1/81 1/85 1/89 1/93 1/97 1/01 1/05 1/09Date
BP
Pres
sure
, psi
a
0
6
12
Volu
me,
MM
B
BM103
10
14
18
22
26
1/77 1/81 1/85 1/89 1/93 1/97 1/01 1/05 1/09Date
BP
Pres
sure
, psi
a
0
6
12
Volu
me,
MM
B
BM104
10
14
18
22
26
1/77 1/81 1/85 1/89 1/93 1/97 1/01 1/05 1/09
Date
BP
Pres
sure
, psi
a
0
6
12
Volu
me,
MM
B

54
BM 105
10
14
18
22
26
1/77 1/81 1/85 1/89 1/93 1/97 1/01 1/05 1/09Date
BP
Pres
sure
, psi
a
0
6
12
Volu
me,
MM
B
BM106
10
14
18
22
26
1/77 1/81 1/85 1/89 1/93 1/97 1/01 1/05 1/09Date
BP
Pres
sure
, psi
a
0
7
14
Volu
me,
MM
B
BM107
10
14
18
22
26
1/77 1/81 1/85 1/89 1/93 1/97 1/01 1/05 1/09
Date
BP
Pres
sure
, psi
a
0
8
16
Volu
me,
MM
B
BM 108
10
14
18
22
26
1/77 1/81 1/85 1/89 1/93 1/97 1/01 1/05 1/09Date
BP
Pres
sure
, psi
a
0
8
16
Volu
me,
MM
B
BM109
10
14
18
22
26
1/77 1/81 1/85 1/89 1/93 1/97 1/01 1/05 1/09Date
BP
Pres
sure
, psi
a
0
6
12
Volu
me,
MM
B
BM 110
10
14
18
22
26
1/77 1/81 1/85 1/89 1/93 1/97 1/01 1/05 1/09Date
BP
Pres
sure
, psi
a
0
6
12
Volu
me,
MM
B
j
BM111
10
14
18
22
26
1/77 1/81 1/85 1/89 1/93 1/97 1/01 1/05 1/09
Date
BP
Pres
sure
, psi
a
0
6
12
Volu
me,
MM
B
BM 112
10
20
30
40
50
60
1/77 1/81 1/85 1/89 1/93 1/97 1/01 1/05 1/09
Date
BP
Pres
sure
, psi
a
0
6
12
Volu
me,
MM
B

55
BM113
10
14
18
22
26
1/77 1/81 1/85 1/89 1/93 1/97 1/01 1/05 1/09
Date
BP
Pres
sure
, psi
a
0
4
8
Volu
me,
MM
B
BM114
10
14
18
22
26
1/77 1/81 1/85 1/89 1/93 1/97 1/01 1/05 1/09
Date
BP
Pres
sure
, psi
a
0
5
10
Volu
me,
MM
B
BM 115
14
18
22
26
1/77 1/81 1/85 1/89 1/93 1/97 1/01 1/05 1/09Date
BP
Pres
sure
, psi
a
0
6
12
Volu
me,
MM
B
P a rt ia l D e ga s
BM116
10
14
18
22
26
1/77 1/81 1/85 1/89 1/93 1/97 1/01 1/05 1/09
Date
BP
Pres
sure
, psi
a
0
6
12
Volu
me,
MM
BP a rt ia l D e ga s
Figure BPP-2. Bryan Mound BPP and Transfer Histories with Linear Regression Fit.

56
WH6
10
14
18
22
26
1/77 1/81 1/85 1/89 1/93 1/97 1/01 1/05 1/09
Date
BP
Pres
sure
(psi
a)
0
5
10
Volu
me,
(MM
B)
WH7
10
14
18
22
26
1/77 1/81 1/85 1/89 1/93 1/97 1/01 1/05 1/09
Date
BP
Pres
sure
(psi
a)
0
8
16
Volu
me,
(MM
B)
WH8
10
14
18
22
26
1/77 1/81 1/85 1/89 1/93 1/97 1/01 1/05 1/09Date
BP
Pres
sure
(psi
a)
0
6
12
Volu
me,
(MM
B)
WH9
10
14
18
22
26
1/77 1/81 1/85 1/89 1/93 1/97 1/01 1/05 1/09
Date
BP
Pres
sure
(psi
a)
0
6
12
Volu
me,
(MM
B)
WH11
10
14
18
22
26
1/77 1/81 1/85 1/89 1/93 1/97 1/01 1/05 1/09Date
BP
Pres
sure
(psi
a)
0
5
10
Volu
me,
(MM
B)
WH101
10
14
18
22
26
7/72 6/78 6/84 6/90 6/96 6/02 6/08Date
BP
Pres
sure
(psi
a)
0
5
10
Volu
me,
(MM
B)
WH102
10
14
18
22
26
1/81 1/85 1/89 1/93 1/97 1/01 1/05 1/09
Date
BP
Pres
sure
(psi
a)
0
6
12
Volu
me,
(MM
B)
WH103
10
14
18
22
26
1/81 1/85 1/89 1/93 1/97 1/01 1/05 1/09
Date
BP
Pres
sure
(psi
a)
0
6
12
Volu
me,
(MM
B)

57
WH104
10
14
18
22
26
1/81 1/85 1/89 1/93 1/97 1/01 1/05 1/09Date
BP
Pres
sure
(psi
a)
0
6
12
Volu
me,
(MM
B)
WH105
10
14
18
22
26
1/81 1/85 1/89 1/93 1/97 1/01 1/05 1/09
Date
BP
Pres
sure
(psi
a)
-12
0
12
Volu
me,
(MM
B)
WH106
10
14
18
22
26
1/81 1/85 1/89 1/93 1/97 1/01 1/05 1/09Date
BP
Pres
sure
(psi
a)
0
6
12
Volu
me,
(MM
B)
WH107
10
14
18
22
26
1/81 1/85 1/89 1/93 1/97 1/01 1/05 1/09
Date
BP
Pres
sure
(psi
a)
0
6
12
Volu
me,
(MM
B)
WH108
10
14
18
22
26
1/81 1/85 1/89 1/93 1/97 1/01 1/05 1/09Date
BP
Pres
sure
(psi
a)
-12
0
12
Volu
me,
(MM
B)
WH109
10
14
18
22
26
1/81 1/85 1/89 1/93 1/97 1/01 1/05 1/09
Date
BP
Pres
sure
(psi
a)
0
6
12
Volu
me,
(MM
B)
WH110
10
15
20
25
30
1/81 1/85 1/89 1/93 1/97 1/01 1/05 1/09
Date
BP
Pres
sure
(psi
a)
0
6
12
Volu
me,
(MM
B)
WH111
10
14
18
22
26
1/81 1/85 1/89 1/93 1/97 1/01 1/05 1/09Date
BP
Pres
sure
(psi
a)
0
5
10
Volu
me,
(MM
B)

58
WH112
10
14
18
22
26
1/81 1/85 1/89 1/93 1/97 1/01 1/05 1/09
Date
BP
Pres
sure
(psi
a)
0
6
12
Volu
me,
(MM
B)
WH113
10
14
18
22
26
1/81 1/85 1/89 1/93 1/97 1/01 1/05 1/09Date
BP
Pres
sure
(psi
a)
0
6
12
Volu
me,
(MM
B)
WH114
10
14
18
22
26
1/81 1/85 1/89 1/93 1/97 1/01 1/05 1/09
Date
BP
Pres
sure
(psi
a)
0
6
12
Volu
me,
(MM
B)
WH115
10
14
18
22
26
1/81 1/85 1/89 1/93 1/97 1/01 1/05 1/09
Date
BP
Pres
sure
(psi
a)
-12
0
12
Volu
me,
(MM
B)
WH116
10
14
18
22
26
1/81 1/85 1/89 1/93 1/97 1/01 1/05 1/09
Date
BP
Pres
sure
(psi
a)
-12
0
12
Volu
me,
(MM
B)
WH117
10
14
18
22
26
1/81 1/85 1/89 1/93 1/97 1/01 1/05 1/09Date
BP
Pres
sure
(psi
a)
0
3
6
9
12
Volu
me,
(MM
B)
Figure BPP-3. West Hackberry BPP and Transfer Histories with Linear Regression Fit.

59
BC15
10
14
18
22
26
1/77 1/85 1/93 1/01 1/09
Date
BP
Pres
sure
(ps
ia)
0
5
10
15
20
Volu
me
(MM
B)
BC17
10
14
18
22
26
1/77 1/81 1/85 1/89 1/93 1/97 1/01 1/05 1/09
Date
BP
Pres
sure
(ps
ia)
0
4
8
12
16
Volu
me
(MM
B)
BC18
10
14
18
22
26
1/77 1/81 1/85 1/89 1/93 1/97 1/01 1/05 1/09
Date
BP
Pres
sure
(ps
ia)
0
4
8
12
16
Volu
me
(MM
B)
BC19
10
14
18
22
26
1/77 1/81 1/85 1/89 1/93 1/97 1/01 1/05 1/09
Date
BP
Pres
sure
(ps
ia)
0
6
12
Volu
me
(MM
B)
BC20
10
14
18
22
26
1/77 1/81 1/85 1/89 1/93 1/97 1/01 1/05 1/09
Date
BP
Pres
sure
(ps
ia)
0
5
10
15
20
Volu
me
(MM
B)
BC101
10
14
18
22
26
1/88 1/92 1/96 1/00 1/04 1/08
Date
BP
Pres
sure
(ps
ia)
0
4
8
12
16
Volu
me
(MM
B)
Figure BPP-4. Bayou Choctaw BPP and Transfer Histories with Linear Regression Fit.

60
Appendix GOR Table GOR-1. Bayou Choctaw GOR, Regain Rates and Comparisons with 2003 Values.
Hinkebein (2003) Current Estimates
BC Cavern
GOR, scf/BBL
Rate, scf/BBL/yr
σ(b), scf/BBL
GOR, scf/BBL
σ(GOR), scf/BBL
Rate, scf/BBL/yr
σ(b), scf/BBL
18 0.26 0.02 0.3 1.3 1.56 .09 1.09
20 2.23 0.01 0.04 0.87 0.78 0 0.08
Sweet Stream Average 0.93 0.02 0.22 1.2 1.10 0.0 0.75
15 -0.05 0 0.04 -0.36 0.16 0 0.02
17 -0.27 0.07 0.14 -0.55 0.32 0 0.06
19 0.3 0 0.04 0.43 0.63 0 0.06
101 0.04 0 0.08 0.76 0.44 0.02 0.28
Sour Stream Average 0 0.02 0.04 0.05 0.20 0.01 0.07
Table GOR-2. Big Hill GOR, Regain Rates and Comparisons with 2003 Values.
Hinkebein (2003) Current Estimates
BH Cavern
GOR, scf/BBL
Rate, scf/BBL/yr
σ(b), scf/BBL
GOR, scf/BBL
σ(GOR), scf/BBL
Rate, scf/BBL/yr
σ(b), scf/BBL
101 3.96 0.23 0.07 0.12+ 1.19 0.07 0.07 102 1.26 0.01 0.04 0.85 0.29 0.01 0.03 103 4.98 0.34 0.11 -0.24+ 0.98 0 0.07 104 3.82 0.27 0.09 1.55 1.75 0.04 0.16 105 -0.76 0 0.04 -0.90 0.14 0 0.02 114 2.82 0 0.54 0.67 0 0 0
Sweet Stream Average 1.33 0.07 0.03 0.33 0.46 0.02 0.04
106 -0.31 0 0.38 -0.22 0.64 0 0.09 107 -0.08 0.13 0.03 -0.20 0.16 0.07 0.03 108 1.11 0.25 0.13 -0.37+ 0.17 0 0.06 109 -0.63 0 0.1 -0.49 0.38 0 0.06 110 1.31 0 0.08 1.28 0.30 0.13 0.04 111 0.9 0.13 0.07 0.60 0.37 0.05 0.03 112 0.85 0.1 0.05 0.88 0.54 0.02 0.07 113 0.67 0.22 0.1 -0.44+ 0.41 0.02 0.03
Sour Stream Average 0.47 0.10 0.06 0.12 0.15 0.03 0.02
+ Caverns were recently degassed so GOR estimated using 1Plant Model regression.
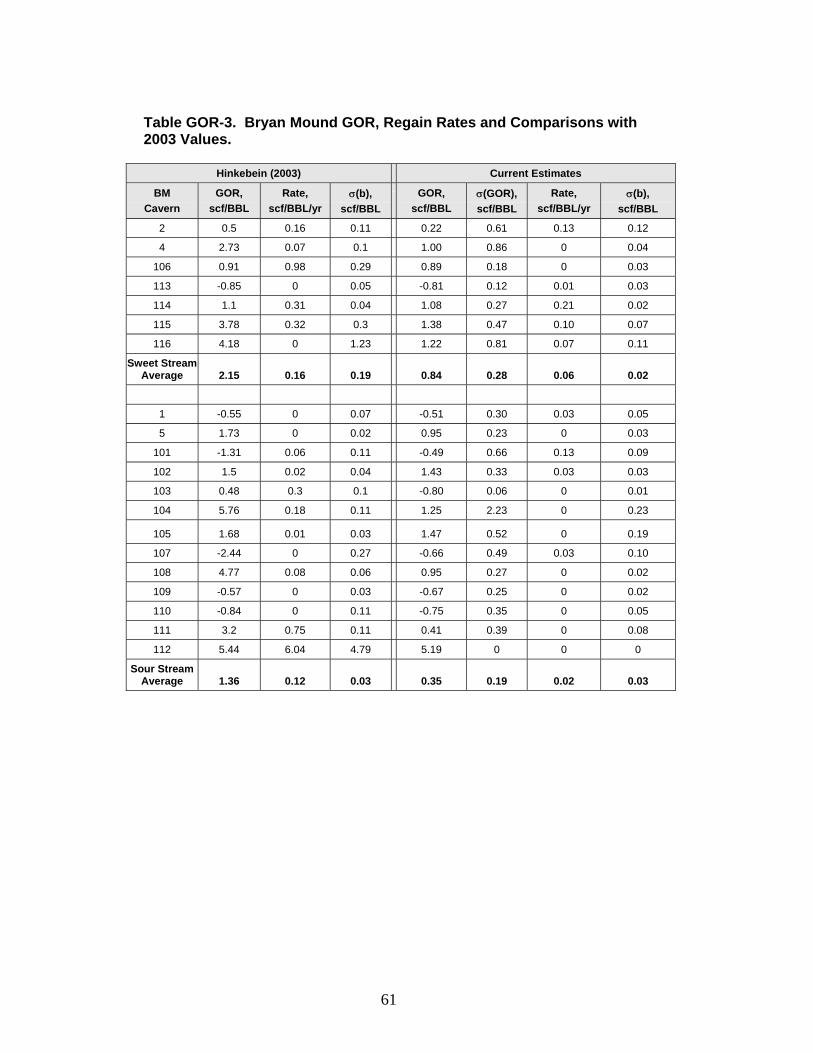
61
Table GOR-3. Bryan Mound GOR, Regain Rates and Comparisons with 2003 Values.
Hinkebein (2003) Current Estimates
BM Cavern
GOR, scf/BBL
Rate, scf/BBL/yr
σ(b), scf/BBL
GOR, scf/BBL
σ(GOR), scf/BBL
Rate, scf/BBL/yr
σ(b), scf/BBL
2 0.5 0.16 0.11 0.22 0.61 0.13 0.12
4 2.73 0.07 0.1 1.00 0.86 0 0.04
106 0.91 0.98 0.29 0.89 0.18 0 0.03
113 -0.85 0 0.05 -0.81 0.12 0.01 0.03
114 1.1 0.31 0.04 1.08 0.27 0.21 0.02
115 3.78 0.32 0.3 1.38 0.47 0.10 0.07
116 4.18 0 1.23 1.22 0.81 0.07 0.11
Sweet Stream Average 2.15 0.16 0.19 0.84 0.28 0.06 0.02
1 -0.55 0 0.07 -0.51 0.30 0.03 0.05
5 1.73 0 0.02 0.95 0.23 0 0.03
101 -1.31 0.06 0.11 -0.49 0.66 0.13 0.09
102 1.5 0.02 0.04 1.43 0.33 0.03 0.03
103 0.48 0.3 0.1 -0.80 0.06 0 0.01
104 5.76 0.18 0.11 1.25 2.23 0 0.23
105 1.68 0.01 0.03 1.47 0.52 0 0.19
107 -2.44 0 0.27 -0.66 0.49 0.03 0.10
108 4.77 0.08 0.06 0.95 0.27 0 0.02
109 -0.57 0 0.03 -0.67 0.25 0 0.02
110 -0.84 0 0.11 -0.75 0.35 0 0.05
111 3.2 0.75 0.11 0.41 0.39 0 0.08
112 5.44 6.04 4.79 5.19 0 0 0
Sour Stream Average 1.36 0.12 0.03 0.35 0.19 0.02 0.03

62
Table GOR-4. West Hackberry GOR, Regain Rates and Comparisons with 2003 Values.
Hinkebein (2003) Current Estimates
WH Cavern
GOR, scf/BBL
Rate, scf/BBL/yr
σ(b), scf/BBL
GOR, scf/BBL
σ(GOR), scf/BBL
Rate, scf/BBL/yr
σ(b), scf/BBL
7 1.41 0 0.61 0.89 0.35 0 0.13 101 1.48 0 0.02 1.15 0.44 0 0.05 102 1.37 0 0.05 1.27 0.39 0.02 0.06 103 -0.16 0.1 0.04 -0.22 0.77 0.02 0.14 104 0.55 0 0.04 0.78 0.29 0 0.03 105 1.71 0 0.02 0.97 0.45 0 0.17 107 0.15 0.20 0.03 0.09 0.16 0.01 0.06 108 1.86 0.00 0.05 1.00 0.25 0.01 0.03
110 1.27 0.00 0.04 1.22 0.36 0.04 0.04 113 -0.54 0.3 0.04 -0.01 0.78 0 0.26 116 1.56 0.00 0.07 1.18 0.44 0.04 0.05
Sweet Stream Average 1.01 0.03 0.10 0.80 0.13 0.01 0.03
6 0.92 0.00 0.03 1.27 0.40 0.07 0.04 8 0.43 0.00 0.08 0.78 0.65 0 0.11
9 1.53 0.00 0.04 1.05 0.40 0.06 0.04 11 0.89 0.00 0.03 0.82 0.4 0.02 0.07
106 0.83 0.00 0.04 1.2 0.24 0.03 0.02 109 0.86 0.00 0.05 0.45 0.26 0 0.03 111 1.20 0.00 0.05 1.37 0.46 0.05 0.06 112 1.12 0.00 0.03 0.96 0.20 0 0.02 114 1.05 0.00 0.03 1.19 0.23 0.04 0.02 115 1.67 0.00 0.06 1.68 0.32 0.07 0.04 117 1.47 0.00 0.02 1.11 0.24 0 0.02
Sour Stream Average 1.08 0.00 0.01 1.07 0.11 0.03 0.01

63
BH101
0
4
8
12
16
1/88 1/92 1/96 1/00 1/04 1/08Date
GO
R (s
cf/b
bl)
BH102
0
1
2
3
1/88 1/92 1/96 1/00 1/04 1/08Date
GO
R (s
cf.b
bl)
BH103
0
2
4
6
8
10
1/88 1/92 1/96 1/00 1/04 1/08
Date
GO
R (s
cf/b
bl)
BH104
0
1
2
3
4
5
1/88 1/92 1/96 1/00 1/04 1/08
Date
GO
R (s
cf/b
bl)
BH105
-2
0
2
4
6
1/88 1/92 1/96 1/00 1/04 1/08
Date
GO
R (s
cf/b
bl)
BH106
-2
0
2
4
6
1/88 1/92 1/96 1/00 1/04 1/08Date
GO
R (s
cf/b
bl)
BH107
-2
0
2
4
1/88 1/92 1/96 1/00 1/04 1/08Date
GO
R (s
cf/b
bl)
BH108
-1
0
1
2
3
4
5
1/88 1/92 1/96 1/00 1/04 1/08
Date
GO
R (s
cf/b
bl)

64
BH109
-1
0
1
2
1/88 1/92 1/96 1/00 1/04 1/08
Date
GO
R (s
cf/b
bl)
BH110
-2
0
2
4
6
1/88 1/92 1/96 1/00 1/04 1/08
Date
GO
R (s
cf/b
bl)
BH111
-2
0
2
4
6
1/88 1/92 1/96 1/00 1/04 1/08Date
GO
R (s
cf/b
bl)
As Hi gh as 16
BH112
0
1
2
3
1/88 1/92 1/96 1/00 1/04 1/08
Date
GO
R (s
cf/b
bl)
BH113
-1
0
1
2
3
4
1/88 1/92 1/96 1/00 1/04 1/08
Date
GO
R (s
cf/b
bl)
BH114
-1
0
1
2
3
4
1/88 1/92 1/96 1/00 1/04 1/08
Date
GO
R (s
cf/b
bl)
Figure GOR-1. Big Hill GOR Histories with Linear Regression Fit.

65
BM1
-2
0
2
4
1/77 1/81 1/85 1/89 1/93 1/97 1/01 1/05 1/09
Date
GO
R, s
cf/b
blBM2
-2
0
2
4
6
1/77 1/81 1/85 1/89 1/93 1/97 1/01 1/05 1/09Date
GO
R, s
cf/b
bl
BM4
-2
0
2
4
6
8
1/77 1/81 1/85 1/89 1/93 1/97 1/01 1/05 1/09Date
GO
R, s
cf/b
bl
BM5
0
1
2
3
4
1/77 1/81 1/85 1/89 1/93 1/97 1/01 1/05 1/09Date
GO
R, s
cf/b
bl
BM 101
-2
0
2
4
6
1/77 1/81 1/85 1/89 1/93 1/97 1/01 1/05 1/09Date
GO
R, s
cf/b
bl
BM 102
-2
0
2
4
6
8
1/77 1/81 1/85 1/89 1/93 1/97 1/01 1/05 1/09Date
GO
R, s
cf/b
bl
BM103
-2
0
2
4
6
8
10
12
1/77 1/81 1/85 1/89 1/93 1/97 1/01 1/05 1/09Date
GO
R, s
cf/b
bl
BM 104
-2
0
2
4
6
1/77 1/81 1/85 1/89 1/93 1/97 1/01 1/05 1/09
Date
GO
R, s
cf/b
bl

66
BM 105
-2
0
2
4
1/77 1/81 1/85 1/89 1/93 1/97 1/01 1/05 1/09
Date
GO
R, s
cf/b
bl
BM 106
-2
0
2
4
6
1/77 1/81 1/85 1/89 1/93 1/97 1/01 1/05 1/09
Date
GO
R, s
cf/b
bl
BM 107
-2
-1
0
1
2
1/77 1/81 1/85 1/89 1/93 1/97 1/01 1/05 1/09
Date
GO
R, s
cf/b
bl
BM108
-2
0
2
4
6
1/77 1/81 1/85 1/89 1/93 1/97 1/01 1/05 1/09Date
GO
R, s
cf/b
bl
BM 109
-2
0
2
4
6
1/77 1/81 1/85 1/89 1/93 1/97 1/01 1/05 1/09Date
GO
R, s
cf/b
bl
BM110
-2
-1
0
1
1/77 1/81 1/85 1/89 1/93 1/97 1/01 1/05 1/09
Date
GO
R, s
cf/b
bl
BM 111
-2
0
2
4
1/77 1/81 1/85 1/89 1/93 1/97 1/01 1/05 1/09Date
GO
R, s
cf/b
bl
BM112
0
5
10
15
20
25
30
1/77 1/81 1/85 1/89 1/93 1/97 1/01 1/05 1/09
Date
GO
R, s
cf/b
bl

67
BM 113
-2
0
2
4
1/77 1/81 1/85 1/89 1/93 1/97 1/01 1/05 1/09
Date
GO
R, s
cf/b
blBM 114
-2
0
2
4
6
1/77 1/81 1/85 1/89 1/93 1/97 1/01 1/05 1/09Date
GO
R, s
cf/b
bl
BM115
-202468
101214
1/77 1/81 1/85 1/89 1/93 1/97 1/01 1/05 1/09
Date
GO
R, s
cf/b
bl
BM 116
-2
0
2
4
6
1/77 1/81 1/85 1/89 1/93 1/97 1/01 1/05 1/09
Date
GO
R, s
cf/b
bl
Figure GOR-2. Bryan Mound GOR Histories with Linear Regression Fit.

68
WH 6
0
0.5
1
1.5
2
2.5
1/77 1/81 1/85 1/89 1/93 1/97 1/01 1/05 1/09Date
GO
R (s
cf/b
bl)
y
WH 7
0
2
4
1/77 1/81 1/85 1/89 1/93 1/97 1/01 1/05 1/09
Date
GO
R (s
cf/b
bl)
up to 70
WH 8
0
1
2
3
1/77 1/81 1/85 1/89 1/93 1/97 1/01 1/05 1/09Date
GO
R (s
cf/b
bl)
WH 9
0
0.5
1
1.5
2
2.5
1/77 1/81 1/85 1/89 1/93 1/97 1/01 1/05 1/09
Date
GO
R (s
cf/b
bl)
WH11
0
0.5
1
1.5
2
2.5
1/77 1/81 1/85 1/89 1/93 1/97 1/01 1/05 1/09Date
GO
R (s
cf/b
bl)
WH 101
0
0.5
1
1.5
2
2.5
7/72 6/78 6/84 6/90 6/96 6/02 6/08
Date
GO
R (s
cf/b
bl)
WH102
0
0.5
1
1.5
2
2.5
3
3.5
1/81 1/85 1/89 1/93 1/97 1/01 1/05 1/09Date
GO
R (s
cf/b
bl)
WH 103
-2
0
2
4
6
1/81 1/85 1/89 1/93 1/97 1/01 1/05 1/09
Date
GO
R (s
cf/b
bl)

69
WH 104
0
1
2
3
4
1/81 1/85 1/89 1/93 1/97 1/01 1/05 1/09
Date
GO
R (s
cf/b
bl)
WH 105
0
2
4
6
1/81 1/85 1/89 1/93 1/97 1/01 1/05 1/09Date
GO
R (s
cf/b
bl)
WH 106
0
0.5
1
1.5
2
2.5
1/81 1/85 1/89 1/93 1/97 1/01 1/05 1/09
Date
GO
R (s
cf/b
bl)
WH 107
-2
0
2
4
1/81 1/85 1/89 1/93 1/97 1/01 1/05 1/09
Date
GO
R (s
cf/b
bl)
WH 108
0
1
2
3
4
5
1/81 1/85 1/89 1/93 1/97 1/01 1/05 1/09
Date
GO
R (s
cf/b
bl)
WH 109
0
1
2
3
1/81 1/85 1/89 1/93 1/97 1/01 1/05 1/09
Date
GO
R (s
cf/b
bl)
WH 110
0
2
4
6
8
1/81 1/85 1/89 1/93 1/97 1/01 1/05 1/09Date
GO
R (s
cf/b
bl)
WH 111
0
1
2
3
1/81 1/85 1/89 1/93 1/97 1/01 1/05 1/09
Date
GO
R (s
cf/b
bl)

70
WH 112
0
2
4
6
1/81 1/85 1/89 1/93 1/97 1/01 1/05 1/09
Date
GO
R (s
cf/b
bl)
WH 113
-2
0
2
4
1/81 1/85 1/89 1/93 1/97 1/01 1/05 1/09
Date
GO
R (s
cf/b
bl)
WH 114
0
1
2
3
1/81 1/85 1/89 1/93 1/97 1/01 1/05 1/09Date
GO
R (s
cf/b
bl)
WH 115
0
1
2
3
1/81 1/85 1/89 1/93 1/97 1/01 1/05 1/09Date
GO
R (s
cf/b
bl)
WH 116
0
1
2
3
1/81 1/85 1/89 1/93 1/97 1/01 1/05 1/09
Date
GO
R (s
cf/b
bl)
WH 117
0
1
2
3
1/81 1/85 1/89 1/93 1/97 1/01 1/05 1/09
Date
GO
R (s
cf/b
bl)
Figure GOR-3. West Hackberry GOR Histories with Linear Regression Fit.

71
BC15
-1
-0.5
0
0.5
1
1/77 1/81 1/85 1/89 1/93 1/97 1/01 1/05 1/09Date
GO
R (s
cf/b
bl)
BC17
-2
0
2
4
1/77 1/81 1/85 1/89 1/93 1/97 1/01 1/05 1/09
Date
GO
R (s
cf/b
bl)
BC18
-2
0
2
4
1/77 1/81 1/85 1/89 1/93 1/97 1/01 1/05 1/09
Date
GO
R (s
cf/b
bl)
BC19
-1
0
1
2
1/77 1/81 1/85 1/89 1/93 1/97 1/01 1/05 1/09
Date
GO
R (s
cf/b
bl)
BC20
-202468
101214
1/77 1/81 1/85 1/89 1/93 1/97 1/01 1/05 1/09
Date
GO
R (s
cf/b
bl)
BC101
-2
-1
0
1
2
3
4
1/88 1/92 1/96 1/00 1/04 1/08
Date
GO
R (s
cf/b
bl)
Figure GOR-4. Bayou Choctaw GOR Histories with Linear Regression Fit.

72
DISTRIBUTION: U.S. Department of Energy (via CD-R only) Strategic Petroleum Reserve Project Management Office 900 Commerce Road East New Orleans, LA 70123 U.S. Department of Energy (3) Strategic Petroleum Reserve Program Office 1000 Independence Avenue, SW Washington, D.C. 20585 Attn: D. Johnson, FE-421 GRAM, Inc. 8500 Menual Blvd., NE Suite B-335 Albuquerque, NM 87112 Attn: K. Wahi D. Rudeen Sandia Internal: MS 0701 P.B. Davies, 6100 MS 0741 Margie Tatro, 6200 MS 0706 D.J. Borns, 6113 MS 0706 B.L. Ehgartner, 6113 MS0706 D.L. Lord, 6113 (5) MS 0706 B.L. Levin, 6113 MS 0706 C.A. Rautman, 6113 MS 0706 A.R. Sattler, 6113 MS-0706 A.C. Snider, 6113 MS-1395 J.S. Stein, 6821 MS-0706 S. Wallace, 6113, for SPR library (5) MS 0750 T.E. Hinkebein, 6118 MS 9018 Central Tech. Files, 8945-1 MS 0899 Technical Library, 9616 (2)