vapor pressures of substituted polycarboxylic acids … · 6648 a. j. huisman et al.: vapor...
TRANSCRIPT
Atmos. Chem. Phys., 13, 6647–6662, 2013www.atmos-chem-phys.net/13/6647/2013/doi:10.5194/acp-13-6647-2013© Author(s) 2013. CC Attribution 3.0 License.
EGU Journal Logos (RGB)
Advances in Geosciences
Open A
ccess
Natural Hazards and Earth System
Sciences
Open A
ccess
Annales Geophysicae
Open A
ccessNonlinear Processes
in Geophysics
Open A
ccess
Atmospheric Chemistry
and PhysicsO
pen Access
Atmospheric Chemistry
and Physics
Open A
ccess
Discussions
Atmospheric Measurement
Techniques
Open A
ccess
Atmospheric Measurement
Techniques
Open A
ccess
Discussions
Biogeosciences
Open A
ccess
Open A
ccess
BiogeosciencesDiscussions
Climate of the Past
Open A
ccess
Open A
ccess
Climate of the Past
Discussions
Earth System Dynamics
Open A
ccess
Open A
ccess
Earth System Dynamics
Discussions
GeoscientificInstrumentation
Methods andData Systems
Open A
ccess
GeoscientificInstrumentation
Methods andData Systems
Open A
ccess
Discussions
GeoscientificModel Development
Open A
ccess
Open A
ccess
GeoscientificModel Development
Discussions
Hydrology and Earth System
Sciences
Open A
ccess
Hydrology and Earth System
Sciences
Open A
ccess
Discussions
Ocean Science
Open A
ccess
Open A
ccess
Ocean ScienceDiscussions
Solid Earth
Open A
ccess
Open A
ccess
Solid EarthDiscussions
The Cryosphere
Open A
ccess
Open A
ccess
The CryosphereDiscussions
Natural Hazards and Earth System
Sciences
Open A
ccess
Discussions
Vapor pressures of substituted polycarboxylic acids are much lowerthan previously reported
A. J. Huisman1,*, U. K. Krieger 1, A. Zuend2,** , C. Marcolli 1, and T. Peter1
1Institute for Atmospheric and Climate Science, ETH Zurich, 8092 Zurich, Switzerland2Department of Chemical Engineering, California Institute of Technology, Pasadena, California 91125, USA* now at: Chemistry Department, Union College, Schenectady, New York 12308, USA** now at: Institute for Atmospheric and Climate Science, ETH Zurich, 8092 Zurich, Switzerland
Correspondence to:A. J. Huisman ([email protected]) and U. K. Krieger ([email protected])
Received: 30 November 2012 – Published in Atmos. Chem. Phys. Discuss.: 10 January 2013Revised: 4 June 2013 – Accepted: 7 June 2013 – Published: 12 July 2013
Abstract. The partitioning of compounds between theaerosol and gas phase is a primary focus in the study of theformation and fate of secondary organic aerosol. We presentmeasurements of the vapor pressure of 2-methylmalonic(isosuccinic) acid, 2-hydroxymalonic (tartronic) acid, 2-methylglutaric acid, 3-hydroxy-3-carboxy-glutaric (citric)acid and DL-2,3-dihydroxysuccinic (DL-tartaric) acid,which were obtained from the evaporation rate of supersatu-rated liquid particles levitated in an electrodynamic balance.Our measurements indicate that the pure component liquidvapor pressures at 298.15 K for tartronic, citric and tartaricacids are much lower than the same quantity that was de-rived from solid state measurements in the only other roomtemperature measurement of these materials (made byBoothet al., 2010). This strongly suggests that empirical correctionterms in a recent vapor pressure estimation model to accountfor the inexplicably high vapor pressures of these and similarcompounds should be revisited, and that due caution shouldbe used when the estimated vapor pressures of these and sim-ilar compounds are used as inputs for other studies.
1 Introduction
The production of secondary organic aerosol (SOA) by gas-to-particle partitioning is generally represented by an equilib-rium partitioning model such as that ofPankow(1994, 2003).This framework has recently been applied in box modelsand large scale atmospheric models by means of a volatil-ity basis set (VBS; see, e.g.,Donahue et al., 2011, and ref-
erences therein). A key physical parameter which governsgas-particle partitioning is the pure component vapor pres-sure (p◦), which is difficult to accurately measure at atmo-spheric temperatures for low- and semi-volatile organic com-pounds (L/SVOC) such as polycarboxylic acids. Note thatthroughout this article, the term “vapor pressure” is usedas defined by chemical thermodynamics to denote the par-tial pressure of a compound in equilibrium with a liquid orsolid phase, which is sometimes emphasized by the equiva-lent term “equilibrium vapor pressure”.
Vapor pressure measurements of L/SVOC may be made byfollowing the volatilization of bulk samples (e.g.,Verevkinet al., 2000; Ribeiro da Silva et al., 2001; Booth et al.,2010; Bruns et al., 2012), ensembles of airborne or depositeddroplets (e.g.,Cappa et al., 2007; Salo et al., 2010), and sin-gle trapped airborne droplets (e.g.,Zardini et al., 2006; Popeet al., 2010; Soonsin et al., 2010; Krieger et al., 2012) orby other techniques such as gas–liquid chromatography (seereview byLetcher and Naicker, 2004). Generally, the agree-ment of different techniques is reasonable for measurementsin which the sample state is positively identified and un-expectedly poor for measurements where the physical stateis not well controlled (Soonsin et al., 2010; M. Bilde, per-sonal communication, 2012). Vapor pressures are generallyreported for the liquid statep◦,L (not to be confused withp◦, which we will use to denote the vapor pressure of a purecompound in an unspecified physical state), which is the ref-erence state for most models of atmospheric partitioning.However, vapor pressure measurements of polyacids are gen-erally made in the solid state (p◦,S) as these compounds have
Published by Copernicus Publications on behalf of the European Geosciences Union.

6648 A. J. Huisman et al.: Vapor pressures of polyacids
a melting point above room temperature. The measured solidstate vapor pressurep◦,S can be converted to the liquid vaporpressurep◦,L by the enthalpy of fusion, the melting tempera-ture, and the change in heat capacity upon melting (Prausnitzet al., 1999). While it is possible to measure eitherp◦,S orp◦,L, it is preferable to measure directly in the liquid statewhen reportingp◦,L to circumvent the phase conversion andits associated uncertainty. As these compounds are solid atroom temperature, measurements ofp◦,L can only be madedirectly in small droplets, in which strong supersaturations orsubcoolings can be maintained without crystallization.
There are several cases (e.g., tartaric compared with suc-cinic acid) in which thep◦,L reported byBooth et al.(2010)increases upon functionalization of the carbon backbonewith an oxygen-bearing substituent, a counterintuitive result.There have been a few specific cases reported in the litera-ture where addition of an oxygen-bearing functional groupto a parent structure can lead to an increase of the solid-state vapor pressure. As discussed inZuend and Seinfeld(2012), such effects have been reported, e.g., byChattopad-hyay and Ziemann(2005) for substitutions where a ketonegroup is added inα-position to a carboxyl group. While ketosubstitutions inα-position of a carboxyl group can raise thesolid-state vapor pressure of a dicarboxylic acid with respectto the unsubstituted parent structure, keto substitutions at aβ-position or further away from the carboxyl group alwaysresulted in decreased solid-state vapor pressure.Chattopad-hyay and Ziemann(2005) suggest that a ketone group inα-position may form an internal hydrogen bond with the car-boxyl group. Such an internal hydrogen bond may reducethe level of intermolecular hydrogen bonding and may leadto an increase in vapor pressure relative to the unsubstitutedparent carboxylic acid. However, such effects on the purecompound vapor pressure have been observed only for sam-ples measured in the solid state. Although the presence ofintermolecular group interactions may lessen the reductionin vapor pressure as compared to the prediction of a sim-ple “additive” group-contribution model, the typical behav-ior observed is that addition of an oxygen-bearing functionalgroup to an organic structure lowers the pure compound va-por pressure. In this study, we presentp◦,L measured usingan electrodynamic balance (EDB) to directly access supersat-urated liquid-state conditions in single droplets of five com-pounds, including three of the functionalized polycarboxylicacids for whichBooth et al.(2010) reported unexpected highvolatility. To the authors’ knowledge, these are the first mea-surements ofp◦,L obtained directly from the liquid state for2-hydroxymalonic acid (2-hMA), 2-methylglutaric acid (2-mGA), and tartaric acid (TA).
The number of different compounds present in atmo-spheric aerosols necessitates the use of estimation meth-ods that rely on structure–activity relationships, such as theNannoolal et al.(2008) or Moller et al. (2008) methods orEVAPORATION (Estimation of VApour Pressure of ORgan-ics, Accounting for Temperature, Intramolecular, and Non-
additivity effects) (Compernolle et al., 2011) to estimate theaerosol mass generated by chemical processing of volatileand semivolatile organic compounds in the gas and particlephases. In this study, we focus on comparison of our mea-surements to the EVAPORATION model, which is intendedto enable the prediction ofp◦,L for polyfunctional moleculesthat occur in SOA. The model has been optimized to accountfor the influence of hydrogen bonding and intramoleculargroup interactions onp◦,L and has been parameterized withthe most recent experimental data for polyfunctional acids.Although Compernolle et al.(2011) endeavor to reproducemeasurements ofp◦,L for substituted polyacids reported byBooth et al.(2010) by implementing an empirical correctionterm, they are not able to rationalize these effects. Becauseonly few measurements are available for such compounds,a danger of overfitting exists (see discussion inBarley andMcFiggans, 2010), especially since some compounds havebeen measured only with a single technique. This highlightsthe need for accurate measurements ofp◦ (and especially di-rect measurements ofp◦,L) to assure the accuracy of modelsof partitioning-driven aerosol formation. In their manuscript,Compernolle et al.(2011) noted that measurements using themethodology ofSoonsin et al.(2010) were needed for thesecompounds. The measurements presented in this work beginto address that need, but are not intended to be an exhaustiveset that will allow for a re-fitting of models such as EVAP-ORATION. Rather, we intend them to demonstrate the ex-istence of substantial deviations from previous experimentaldata and as an immediate caveat to anyone using EVAPORA-TION or similar models to predict partitioning of substitutedpolycarboxylic acids. Finally, we show that the EVAPORA-TION model can be modified to yield predictions in betteragreement with our measurements.
2 Method
Vapor pressures of pure melts and aqueous solutions ofsubstituted polycarboxylic acids were measured using theelectrodynamic balance (EDB) apparatus and technique de-scribed inSoonsin et al.(2010). In this technique, the evap-oration rate of a levitated particle is related to vapor pres-sure via continuum theory (see discussion in Sect. IV ofKrieger et al., 2012). The EDB apparatus consists of a three-wall temperature-controlled glass chamber containing a lev-itated charged particle held in place through applied electricAC and DC fields. A constant flow (typically 25 sccm) ofa N2/H2O gas mixture with a controlled H2O partial pres-sure is pumped continuously through the chamber at a con-stant total pressure adjustable between 200 and 1000 hPa.The temperature can be varied between 330 K and 160 K witha stability better than 0.1 K and an accuracy of±0.5 K. Therelative humidity in the chamber is set by automatic massflow controllers regulating the N2/H2O mixing ratio. Dur-ing an experiment, the temperature and the relative humidity
Atmos. Chem. Phys., 13, 6647–6662, 2013 www.atmos-chem-phys.net/13/6647/2013/

A. J. Huisman et al.: Vapor pressures of polyacids 6649
are kept constant while measuring a particular evaporationrate. Note that the N2/H2O gas flow is completely free ofany evaporated organic molecules prior to entering the glasschamber as the gas flow is freshly generated from a puri-fied liquid N2 reservoir, part of which is flowing over anenclosed temperature-controlled liquid solution of purified,deionized water containing 2.5 wt-% of dissolved sulfuricacid to scrub any ammonia from laboratory air potentiallyleaking into the system. Injection solutions had an analytecontent between 0.5 % and 4 % by weight, leading to par-ticles of approximately 2 to 9 µm dry radius. Evaporation ofthe solvent from the particle was judged to be complete whena steady shrink rate was established under constant temper-ature (T ) and relative humidity (RH). Highly supersaturatedparticles with respect to solid phases can be obtained dueto the small (micrometer-range) particle radius and wall-freecontainment of the EDB. For simplicity, we will refer to mea-surements as being on a “solution” without specifying if thesample was supersaturated, or on the “subcooled melt” forthe pure component. All measurements were taken on spheri-cally symmetric (i.e., non-crystalline) particles, as judged bythe regularity of the angular fringes of scattered laser light(seeZardini et al., 2006), and measurements were made onat least two particles for all investigated substances.
Throughout each measurement,T , RH, and backgroundgas pressure were held constant (to within 0.25 K, 0.5 %, and1 torr, respectively), and the particle radius was measured toa high degree of precision using morphology (radius) de-pendent resonance spectrometry (Zardini et al., 2006). Va-por pressure measurements were made on subcooled meltdroplets or solution droplets with the organic concentrationin water controlled by the RH in the EDB. A continuous flowof 20–35 cm3min−1 organic-free N2 gas with a known watercontent was applied and the ambient pressure was regulatedto 600± 1torr (79.99± 0.13kPa). As the partial pressure ofthe organic decreases with decreasing organic solute activityon the mole fraction basis (aorg), measurements were mostoften performed at low to moderate humidity (RH< 40%).
After the particle was equilibrated with respect toT andRH, any change in size was attributed to evaporative loss (cf.,Sect IV of Krieger et al., 2012), and the vapor pressure (p)of the organic substance under those conditions (RH,T ) wascalculated using Eq. (1) ofSoonsin et al.(2010):
p = −1
2
dr2
dt×
xρRT
(xMorg+ (1− x)Mw)Dv. (1)
wherer is the particle radius,x is the mole fraction of theorganic solute,ρ is the density of the condensed phase,R
is the gas constant,M is molar mass,Dv is the diffusivityof the organic vapor in the buffer atmosphere, and “org” and“w” refer to the organic component and water, respectively.Strictly, Eq. (1) is valid for stagnant conditions. However, thegeometry of our EDB together with the flows used keeps theenhancement in evaporation rate due to the gas flow below
0.1 % (Zhang and Davis, 1987). On the other hand, the flowneeds to be sufficiently large to avoid any significant con-tamination of the gas phase by the organic vapor evaporatingfrom the particle. The partial pressure of the organic sub-stance far from the particle,p∞, has to be only a small frac-tion of the vapor pressurep. Our flows are sufficient to keepthe ratiop∞/p below 1 %, (cf.,Zhang and Davis, 1987). Thederivation or measurement of each term in Eq. (1) will be dis-cussed below.
2.1 Radius
The particle radius as a function of time was determined bycombining an absolute radius from the two-dimensional scat-tering pattern at one point in time with the fractional changein particle radius as a function of time from morphology de-pendent resonance spectroscopy (Zardini et al., 2006):
r(t) = r(t0) ×λ(t)
λ(t0), (2)
wheret0 is the initial time andλ is the wavelength at whichthe Mie resonance occurs. Each particle was sized at onestage of the experiment, and the radius was calculated at allother times based on that initial radius and the change in ra-dius calculated from Mie spectra, such that the retrieved ra-dius of the particle was self-consistent. In this calculation ofparticle radius, we have neglected any shift in Mie peaks aris-ing from changes in the index of refraction due to changingRH. Examples of raw radius data as a function of time atconstantT and RH are given for 2-mGA, CA, and TA in Ap-pendixA and shown in Fig.A1.
The absolute radius of the particle at one point in time wasretrieved from the spacing of fringes of the two-dimensionalscattering pattern at 90◦ following the method outlined inEq. (25) ofGlantschnig and Chen(1981). Using the smallangle approximation, we equate the angular separation offringes1θ with their linear separation on the detector. Cal-ibration was performed by injecting a single latex sphere(Polyscience Inc., Warrington, PA, nominal diameter 10 µm)and measuring the separation of the fringes.
The fractional change in particle radius was measured bytracking the change in wavelength of a Mie scattering reso-nance from a single particle as a function of time (dλ
dt). As in
Zardini et al.(2006), the particle was illuminated with a LED(λcenter= 589nm, FWHM= 16nm, radiant power 150 µW)and backscattered light was collected and imaged usinga 150 mm spectrograph with a CCD detector. The quantitydλdt
is directly related to the change in size of a particle whenfollowing a single Mie resonance (Zardini et al., 2006), ifthe index of refraction of the particle is constant. The changein wavelength of a group of Mie resonances as a functionof time, dλ
dt, was retrieved using a custom script based on
a digital image correlation algorithm in the Mathworks Mat-lab environment. This quantity was then used along with theretrievedr(t0) to calculater(t) via Eq. (2).
www.atmos-chem-phys.net/13/6647/2013/ Atmos. Chem. Phys., 13, 6647–6662, 2013

6650 A. J. Huisman et al.: Vapor pressures of polyacids
2.2 Mole fraction of solute
The mole fraction of organic compound in an aqueous parti-cle was calculated from the RH in the EDB by assuming thatthe particleaw is equivalent to measured RH, i.e., that theparticle is homogeneous and in thermodynamic equilibrium.The thermodynamic group-contribution model AIOMFAC(Aerosol Inorganic-Organic Mixtures Functional groups Ac-tivity Coefficients) developed byZuend et al.(2008, 2011)was used to calculate activity coefficients of water and or-ganic compounds as a function of the droplet mixture com-position. The activity coefficients account for non-ideal mix-ing, which influences vapor pressure via modified Raoult’slaw (Zuend et al., 2010). For simplicity, AIOMFAC was runat 298.15 K and used at allT ; the model output varies by lessthan 1 % between 298.15 K and 313 K (the highest tempera-ture used).
2.3 Density
Density was parameterized by assuming additivity of the mo-lar volumes of the components and fitting experimental datato the equation
ρ =x × Morg+ (1− x) × Mw
x × Vorg+ (1− x) × Vw, (3)
whereV is the molar volume, and all other variables and sub-scripts are defined as above. Such a fit is necessary becausedensity measurements are available only for (sub-)saturatedbulk solutions, while measurements often took place underhighly supersaturated conditions. The molar volumes of 2-hMA and 2-mMA were retrieved from the SciFinder web-site, which providesVorg calculated by the Advanced Chem-istry Development, Inc. software (ACD/Labs, 2012). Mea-surements of 2-mGA density were made using a 10 mL py-cnometer (Blaubrand, 43408) on solutions from 0.11 to 0.75weight fraction organic in water. We determinedVorg of119.7± 0.3cm3mol−1 for 2-mGA by fitting Vorg to exper-imentally determined densities of aqueous solutions usingEq. (3). Experimental data fromLaguerie et al.(1976) andWashburn et al.(1926) were used to calculate the molar vol-ume of CA and TA, respectively. All density parameters usedin this study are summarized in Table1 and the raw data for2-mGA density as a function of solute weight fraction in wa-ter are given in Table2.
2.4 Diffusivity of organic vapor
The diffusivity of organic vapor in nitrogen was estimatedfollowing the method ofBilde et al.(2003): the group con-tribution method ofLydersen(1955) was used to determinethe critical volumeVc and the diffusivities used in this studywere calculated using Eqs. (17.3–12) fromBird et al.(2007):
Dv = 0.0018583×
√T 3 ×
(1
MN2
+1
Morg
)×
1
P × σ 2AB × �
, (4)
Table 1. Partial molar volumes of compounds under study. The“Quality R2” column refers to the correlation coefficient of a fitof Eq. (3) using the statedVorg to experimental data.
Material QualityR2 Vorg (cm3mol−1)
2-Methylmalonic acid N/A 84± 32-Hydroxymalonic acid N/A 65± 32-Methylglutaric acid 0.9981 119.7± 0.3Citric acid 0.9981 118.9± 0.3DL-tartaric acid 0.997 85.8± 0.3
Table 2. Density of 2-methylglutaric acid solutions in water. Allmeasurements carry an error of 1.5× 10⁻³gcm−3.
Solute weight Densityfraction (gcm−3)
0.1080 1.01820.2020 1.03690.2934 1.05870.3971 1.08110.5296 1.10370.7502 1.1555
where P is the ambient gas pressure,σAB is one of theLennard-Jones parameters for the organic material in N2, �
is the collisional integral, and all other symbols are definedas above. The values ofDv for each material are given forT = 298.15K in Table3.
2.5 Materials
Materials were as follows: Millipore water (resistivity>18.2M�cm, total organic content< 5ppb) was used asthe injection solvent for 2-methylmalonic acid (2-mMA,2-methylpropanedioic acid, Sigma-Aldrich> 99%), 2-hydroxymalonic acid (2-hMA, 2-hydroxypropanedioic acid,> 97%, Sigma-Aldrich), 2-methylglutaric acid (2-mGA, 2-methylpentanedioic acid,> 99% ABCR, Karlsruhe, Ger-many and> 98%, Fluka), and citric acid monohydrate (CA,3-carboxy-3-hydroxypentanedioic acid, Fluka,> 99.5%).A mixture of approximately 1: 1 by volume diethyleneglycol (Fluka, > 99%) with Millipore water was usedas an injection solvent for DL-tartaric acid (TA, 2,3-dihydroxybutanedioic acid,> 99%, Aldrich) to prevent crys-tallization upon injection that occurs when pure water isused. All reagents were used as received with no additionalpurification. Organic-free, very low humidity nitrogen car-rier gas was obtained from the blowoff of a dewar containingliquid nitrogen.
Atmos. Chem. Phys., 13, 6647–6662, 2013 www.atmos-chem-phys.net/13/6647/2013/

A. J. Huisman et al.: Vapor pressures of polyacids 6651
Table 3.Parameters for estimation of organic compound vapor dif-fusivity in N2 at 600 torr (∼ 80kPa) at 298.15 K.
Material Vc σB εAB/kB � Dvcm3 A K cm2s−1
2-Methylmalonic acid 306 4.667 279.7 1.40 0.08352-Hydroxymalonic acid 269 4.548 287.4 1.42 0.08672-Methylglutaric acid 380 6.091 260.1 1.347 0.0777Citric acid 449 6.440 285.8 1.406 0.0681DL-Tartaric acid 338 5.858 291.6 1.440 0.0762
3 Analysis
3.1 Extraction of p◦,L as a function of temperature
While p◦,L is the quantity of interest in this study, higherquality data are achieved by measuringpL of aqueous solu-tions of the organic compound at several concentrations toextractp◦, L at aorg = 1. When measurements ofpL wereavailable at multipleaorg, a weighted linear least-squares fitof the data through (aorg = 0, p = 0Pa) was used to extractp◦,L. The data in Fig.1 are an example of the retrievedpL of2-mGA as a function ofaorg at a singleT . The error of theresulting fit slope was propagated from the calculated erroron each point following the method ofLyons(1986, p. 127)and used in the calculation of the error onp◦,L at eachT ; ingeneral, points with longer duration measurement or at lowerwater activity (aw) have smaller error bars. As discussed inSoonsin et al.(2010), the linear fit ofpL againstaorg providesa more robust measure ofp◦,L than a single measurement ataorg = 1.
As the materials under study here have lowerp◦,L thanthose in the preceding study bySoonsin et al.(2010), whichemployed the same EDB apparatus, it was not always possi-ble to quantify the evaporative loss of particle mass. There-fore, a detailed error analysis was performed that allows usto report an upper limit for measurements below the limitof quantitation (LoQ, see, e.g.,Armbruster and Pry, 2008,for a discussion on the difference between limit of detectionand LoQ). A detailed treatment of error on the measurementshown in Fig.1 is given in AppendixB. Conservatively, weassume that a size change of 1 nm on a 10 µm particle isneeded to accurately quantify the change in radius, leadingto a LoQ of 3.6× 10⁻⁷Pa for a 24 h measurement, and ne-glecting any confounding effects from instrumental noise ordrift (which will become increasingly important for multi-day experiments). In general, the statistical (propagated) er-ror upon which we base our stated uncertainties is arounda factor of 2 higher than the theoretical LoQ, primarily dueto the influence of minor drifts in RH (cf., AppendixB2) onthe statistical error.
Measurements with calculated uncertainties that extend tonegative pressure are considered indistinguishable from zero;in such a case only an upper bound onpL is reported and
0 0.2 0.4 0.6 0.8 10
0.2
0.4
0.6
0.8
1
1.2x 10
−4
aorg
(unitless)
Vap
or P
ress
ure
(Pa)
Fig. 1. Measured vapor pressurepL of 2-methylglutaric acid (cir-cles) as a function of the mole fraction based organic activityaorg at280.5 K. The value of the (dashed) fit line intercept ataorg = 1 rep-resents the pure component liquid vapor pressure at 280.5 K and 2σ
error bounds are shown by dotted lines. The fit line is made throughthe origin and data are weighted by the square of their inverse rela-tive error. For the calculation of error bounds and a more completedescription of the error analysis, see AppendixB.
that point is excluded from the fit forp◦,L. In the event thatall measurements at a givenT were indistinguishable fromzero, the upper bound ofp◦,L at thatT was calculated asmin(pupper/aorg), wherepupperandaorg are the upper limitsof the measuredpL and organic activities corresponding tothe compositions at the points, respectively, and the / signindicates element-wise division. Using this quantity ratherthan the simple upper-limit pressure takes into account thedecrease inpL for a solution compared to the pure liquid.
3.2 Extraction of p◦,L (T )
The pure component liquid vapor pressuresp◦,L derived inSect.3.1 are fit and displayed as a function of1
Tusing the
Clausius–Clapeyron equation:
ln
(p◦,L(T )
p◦,L(T )
)=
−1Hvap
R
(1
T−
1
T
), (5)
where1Hvap is the enthalpy of vaporization of the organic
component atT and the superscript indicates the standardstate withT
= 298.15K. This formula assumes that the en-thalpy of vaporization1H
vap is constant over the range ofT
used in measurements (∼ 30K). The fit line to Eq. (5) wasweighted by the inverse square of the relative error on eachpoint to extractp◦,L(T ) and the statistical error was propa-gated using the method ofLyons(1986, p. 126–127).
www.atmos-chem-phys.net/13/6647/2013/ Atmos. Chem. Phys., 13, 6647–6662, 2013

6652 A. J. Huisman et al.: Vapor pressures of polyacids
Table 4.Vapor pressure data from this study and comparison to data from the literature. Abbreviations are: 2-mMA, 2-methylmalonic acid;2-hmA, 2-hydroxymalonic acid; 2-mGA, 2-methylgluratic acid; 3-mGA, 3-methylglutaric acid; TA, DL-tartaric acid; CA, citric acid. Dataare organized as experimental studies reporting liquid-state vapor pressure (p◦,L), experimental studies reporting solid-state vapor pressure(p◦,S), and model predictions of liquid-state vapor pressure (p◦,L), including 3-methylglutaric acid for comparison to 2-methylglutaric acid.All data are reported in Pa atT
= 298.15 K unless stated otherwise. For citric and tartaric acids, extrapolations toT are reported alongwith data obtained atT > T . Superscript letters indicate notes on data or reference.
2-mMA 2-hMA 2-mGA 3-mGA TA CA
Experimental liquid-state measurements
This Measurement (1.1±0.3)×10−3 (4.4±1.2)×10−6 (1.0±0.2)×10−3− (3.2±1.0)×10−7 (∼305 K) <1.6×10⁻⁷ (∼311 K)
This Measurementa− − − − (8.6− 24)×10−8 <4.0×10⁻⁸
This Measurementb− − − − (1.8− 4.9)×10−8 <1.4×10⁻⁹
Booth et al.(2010) (5.3±4.0)×10−3 (5.6±4.2)×10−3 (9.6±7.2)×10−4 (9.2±6.9)×10−4 (3.2±2.4)×10−1 (3.1±2.3)×10−3
Mønster et al.(2004)c (9.1±3.2)×10−4− − (7.3±2.6)×10−4
− −
Yaws et al.(2009)d − − − − − (1 − 40)×10−9
Experimental solid-state measurements
Booth et al.(2010) (3.3±1.3)×10−4 (2.5±1.0)×10−4 (1.9±0.7)×10−4 (1.8±0.7)×10−4 (1.8±0.7)×10−4 (3.8±1.5)×10−5
Ribeiro da Silva et al.(2000)e (5.8±2.9)×10−4− − − − −
Ribeiro da Silva et al.(2001)f − − 2.3+2.6−1.2×10⁻⁴
− − −
de Wit et al.(1983)g − − − − (1.3−2.6)×10−9−
Model liquid-state predictions
Compernolle et al.(2011)h (5.0+7.7−3.0)×10−3 (1.9+0.6
−0.5)×10−3 (5.4+8.1−3.2)×10−4
− (4.0+6.1−2.4)×10−3 (5.0+7.7
−3.0)×10−5
Compernolle et al.(2011)i (5.0+7.7−3.0)×10−3 (9.1+14
−5.5)×10−5 (5.4+8.1−3.2)×10−4
− (2.8+4.2−1.7)×10−7 (8.7+13.1
−5.2 )×10−10
Nannoolal et al.(2008)j (3.7±3.1)×10−2 (2.0±1.7)×10−6 (3.1±2.7)×10−3− (1.4±1.2)×10−9 (9.1±7.8)×10−13
Moller et al.(2008)k (1.1±0.3)×10−1 (2.1±0.5)×10−4 (8.2±2.0)×10−3− (6.9±1.7)×10−8 (2.7±0.6)×10−10
a Extrapolation toT using1Hvap=75 kJ mol−1.b Extrapolation toT using1Hvap=250 kJ mol−1.c Assumed liquid (the physical state was not specified), see Sect. 4.1.d Extrapolation of data from 426 K< T <451 K.e Extrapolation of data from 341 K< T <354 K.f Extrapolation of data from 338 K< T <348 K.g Extrapolation of sublimation data from 411 K< T <440 K.h EVAPORATION model.i EVAPORATION model without correction for substituted polycarboxylic acids.j The method ofNannoolal et al.(2008) was used with theTb estimate ofNannoolal et al.(2004).k The method ofMoller et al.(2008) was used with theTb estimate ofNannoolal et al.(2004).
4 Results and discussion
Thep◦,L determined here, along with a comparison to previ-ous measurements in both the liquid (p◦, L) and solid states(p◦,S) and to a few common models of vapor pressure, aresummarized in Table4 and graphically depicted in Fig.2.Figures3 through7 show the pure compound vapor pres-surep◦,L obtained in this study as a function of inverse tem-perature (cf., Eq.5) for each compound. Experimental dataare shown as open symbols with error bounds extending totwo standard errors; within each plot, different particles areshown using different symbols. The dashed fit line in thesefigures is made by weighting the data by the square of theirinverse relative error, and extends toT
= 298.15K. The 2σbounds of fit lines are shown as dotted lines. Data that areindistinguishable from zero are reported as the highest valueallowed by the statistical (propagated) error, and displayed inplots with their bottom error bar off-scale.
4.1 2-Methylmalonic acid
Thep◦,L of 2-mMA as a function of inverseT is displayedin Fig. 3. Based on the fit of Eq. (5) to these data, wedetermine1H
vap = (89± 15)kJmol−1. Measurement timesshown were a few hours to a few days per point, not in-cluding instrument settling time. The calculatedp◦, L(T )
of (1.1± 0.3) × 10−3Pa is just inside the lower error boundof the measurements ofBooth et al.(2010) and is in excellentagreement with the measurement ofMønster et al.(2004) forthis compound.
Although the physical state of the aerosol was not reportedin the study ofMønster et al.(2004), we assert that it wasliquid as our measurements of 2-mMA carried out under dry(RH < 3%) conditions for many days did not result in par-ticle crystallization. Measurements in the tandem differen-tial mobility analyzer (TDMA) used byMønster et al.(2004)were performed on a shorter timescale and used aerosol par-ticles of smaller size than our measurement, both of whichdecrease the probability of crystallization. This assertion issupported byRiipinen et al.(2007), who determined that
Atmos. Chem. Phys., 13, 6647–6662, 2013 www.atmos-chem-phys.net/13/6647/2013/

A. J. Huisman et al.: Vapor pressures of polyacids 6653
2−mMA 2−hMA 2−mGA TA CA
10−12
10−10
10−8
10−6
10−4
10−2
100
Vap
or P
ress
ure
(p° , P
a)
Liquid
Solid
Mod
el (liq
uid)
Liquid
Solid
Mod
el (liq
uid)
Liquid
Solid
Mod
el (liq
uid)
Liquid
Solid
Mod
el (liq
uid)
Liquid
Solid
Mod
el (liq
uid)
This Meas.Booth (liq.)Mønster (liq.)Yaws (liq.)Booth (sol.)Ribeiro da Silva 2000 (sol.)Ribeiro da Silva 2001 (sol.)deWit (sol.)EVAP. (liq.)EVAP. w/o corr. (liq.)Moller / Nannoolal (liq.)Nannoolal / Nannoolal (liq.)
O
OH
O
HO
O
OH
O
HO
OH
O
OH
O
HO
OH
OH O
OH
O
HO
OH
O
OH
O OHO
HO
Fig. 2. Pure component vapor pressures at T = 298.15 (p◦(T)) for 2-methylmalonic acid (2-mMA), 2-
hydroxymalonic acid (2-hMA), 2-methlyglutaric acid (2-mGA), DL-tartaric acid (TA), and citric acid (CA),
from this work (liquid) and from previous measurements reported in the liquid state, the solid state and and
the EVAPORATION model with and without empirical correction term as well as two commonly used models
(all in liquid state). CA from this study is shown using the most conservative (largest) upper limit. Counter to
intuition, the liquid vapor pressure measured here for 2-hMA, TA and CA is smaller than the solid-state vapor
pressure reported by Booth et al. (2010). See Table 4 for full reference list.
29
Fig. 2. Pure component vapor pressures atT = 298.15 (p◦(T )) for 2-methylmalonic acid (2-mMA), 2-hydroxymalonic acid (2-hMA), 2-methylglutaric acid (2-mGA), DL-tartaric acid (TA), and citric acid (CA) – from this work (liquid) and from previous measurements reportedin the liquid state, the solid state and the EVAPORATION model with and without empirical correction term as well as two commonly usedmodels (all in liquid state). CA from this study is shown using the most conservative (largest) upper limit. Counter intuitively, the liquidvapor pressure measured here for 2-hMA, TA and CA is smaller than the solid-state vapor pressure reported byBooth et al.(2010). SeeTable4 for full reference list.
3.35 3.4 3.45 3.5 3.55 3.6 3.65 3.7
x 10−3
10−5
10−4
10−3
10−2
Inverse Temperature (1/K)
Vap
or P
ress
ure
p° (T
) (P
a)
295 289 283 277 271
Temperature (K)
Fig. 3. Pure component vapor pressurep◦,L of 2-methylmalonicacid (open symbols, denoting two different particles). Fit line(dashed) is to Eq. (5) with 2σ error bounds shown as dotted lines.
malonic acid was in the liquid state during vapor pressuremeasurements, employing the same technique and apparatusas that ofMønster et al.(2004).
4.2 2-Hydroxymalonic acid
The p◦,L of 2-hMA is displayed in Fig.4 using the sameaxes and fitting procedure as for 2-mMA in Sect.4.1. We de-termine1H
vap = (120± 19)kJmol−1 from a fit of Eq. (5)to experimental data. Measurement times shown were manyhours to a few days per point, not including instrument set-tling time. The calculatedp◦,L(T ) of (4.4±1.2)×10−6Pais around three orders of magnitude lower than the value ofp◦,L reported byBooth et al.(2010).
4.3 2-Methylglutaric acid
The p◦,L of 2-mGA is displayed in Fig.5 using the sameaxes and fitting procedure as for 2-mMA in Sect.4.1. We de-termine1H
vap = (97.3± 3.5)kJmol−1 by fitting Eq. (5) tothe experimental data. Measurement times shown in Fig.5were a few hours to several days per point, not including in-strument settling time. These data demonstrate that the EDBmethod is reliable over a broad range of pressures and can
www.atmos-chem-phys.net/13/6647/2013/ Atmos. Chem. Phys., 13, 6647–6662, 2013

6654 A. J. Huisman et al.: Vapor pressures of polyacids
3.2 3.25 3.3 3.35
x 10−3
10−6
10−5
10−4
Inverse Temperature (1/K)
Vap
or P
ress
ure
p° (T
) (P
a)
312 308 304 300 296
Temperature (K)
Fig. 4. Pure component vapor pressurep◦,L of 2-hydroxymalonicacid (open symbols, denoting two different particles). Fit line(dashed) is to Eq. (5) with 2σ error bounds shown as dotted lines.
retrieve pressures of 1× 10⁻⁶Pa and lower. The calculatedp◦,L(T ) of (1.0± 0.2) × 10−3Pa agrees very well with thevalue reported byBooth et al.(2010).
We also compare our results to previous measurements of3-methylglutaric acid (a structural isomer of 2-mGA that isexpected to have a similarp◦,L). Our measurements of 2-mGA are in very good agreement with thep◦, L(T ) for 3-methylglutaric acid reported byBooth et al.(2010) and byMønster et al.(2004). As in Sect.4.1, we assume that themeasurements ofMønster et al.(2004) represent the liquidstate. Once again, measurements of 2-mGA were made undervery dry (RH< 3%) conditions and no crystallization of theparticle was observed.
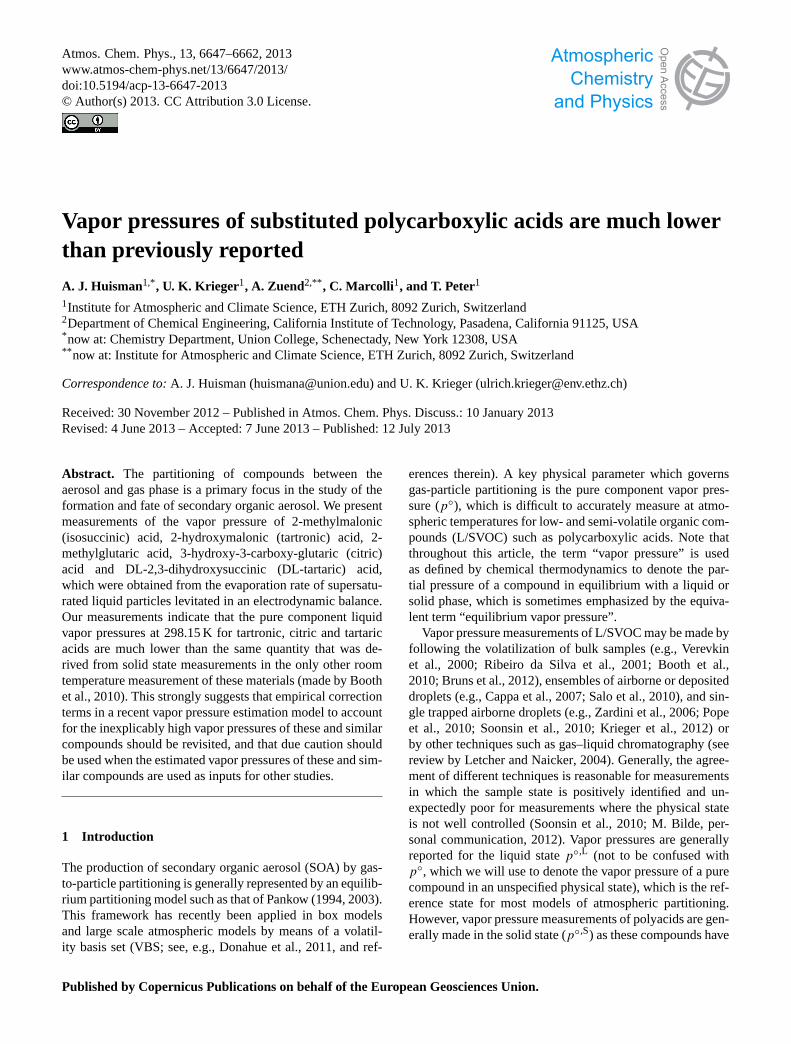
4.4 Tartaric acid
Two measurements of DL-tartaric Acid (TA)p◦,L are shownin Fig. 6. Measurement times were 2 days (312 K) and 11days (305.5 K), not including instrument settling time. Asonly one point was distinguishable from zero, a fit to de-termine1H
vap is not possible, so we extrapolate toT us-ing Eq. (5) and two values of1H
vap, which should cover
the range of possibilities: 75 and 250 kJmol−1 (cf., Fig. 2 ofCompernolle et al., 2011). Using1H
vap = 75 kJ mol−1, p◦,L
is calculated to be in the range (8.6–24)× 10−8 Pa, while1H
vap = 250 kJ mol−1 yields a p◦,L of (1.8–4.9)× 10−8
Pa. This result is approximately six orders of magnitudelower than the measurement ofBooth et al.(2010). We notethat tartaric acid has several stereoisomers and can be pur-chased as D-, L-, DL-, and meso-tartaric acid. The measure-ment ofBooth et al.(2010) was also performed on the DL-stereoisomer (A. M. Booth, personal communication, 2013),so the results of this study should be strictly comparable to
3.4 3.5 3.6 3.7 3.8 3.9 4
x 10−3
10−7
10−6
10−5
10−4
10−3
10−2
Inverse Temperature (1/K)
Vap
or P
ress
ure
p° (T
) (P
a)
292 283 274 265 256
Temperature (K)
Fig. 5. Pure component vapor pressurep◦,L of 2-methylglutaricacid (open symbols, denoting six different particles). Fit line(dashed) is to Eq. (5) with 2σ error bounds shown as dotted lines.These data demonstrate that this method produces consistent, highquality data over a broad range of pressures.
the results ofBooth et al.(2010) for tartaric acid. However,comparison to measurements of other stereoisomers are alsoreasonable, as all are expected to have a similar vapor pres-sure and the six order of magnitude discrepancy lies outsidethe expected range of variance due to stereoisomerism.
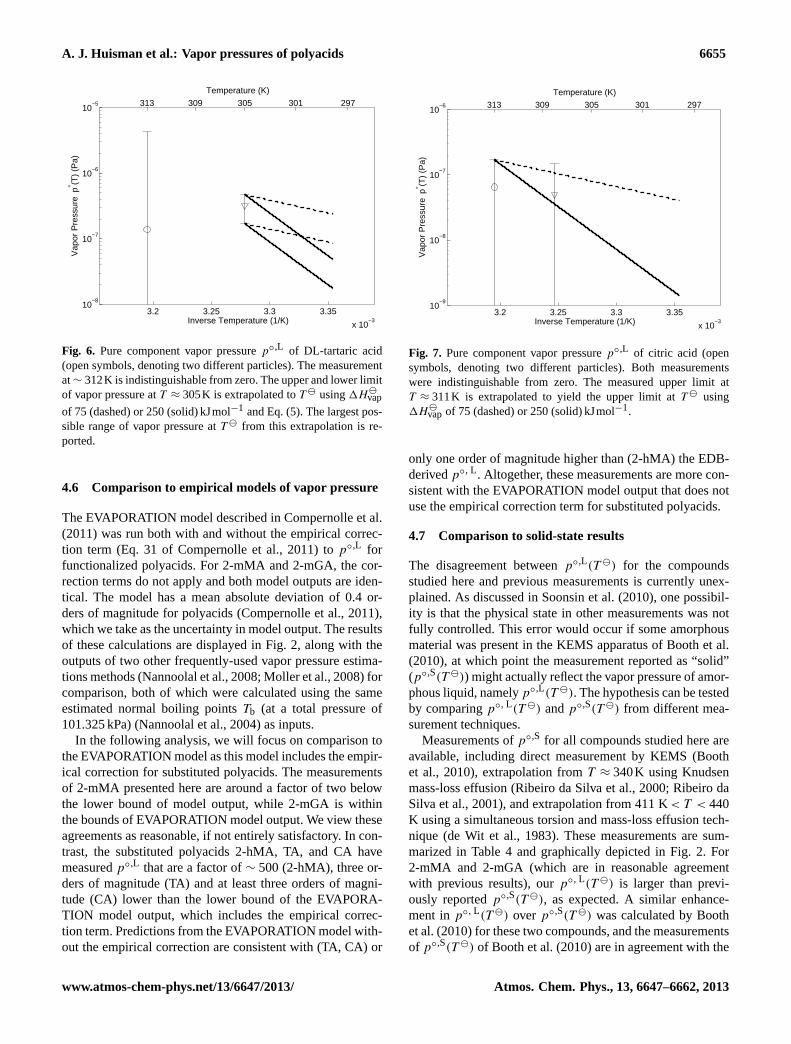
4.5 Citric acid
Thep◦,L measured for CA, shown in Fig.7, were both indis-tinguishable from zero. Measurement times were 4 days (∼
311K) and∼ 12 days (∼ 308K), not including instrumentsettling time. The measurement at 311 K,< 1.6×10⁻⁷Pa, isa crude upper bound that is also valid atT . However, fol-lowing the logic employed for TA, we extrapolate from thispoint toT , again using1H
vap of 75 and 250 kJmol−1. The
two upper limits from this extrapolation are< 4.0× 10⁻⁸Pafor 75 kJmol−1 and < 1.4× 10⁻⁹Pa for 250 kJmol−1. Allthree of these upper limits are at least four orders of magni-tude below the value reported byBooth et al.(2010).
We also compare our measurement with measurementsmade above the melting point of CA (T > 426K,Yaws et al.,2009). Using Eq. (5), 1Hvap = 146kJmol−1 was extractedby fitting the lowest 25 K of the parameterization. Assum-ing a 10 % error on this1Hvap and extrapolating from thelower point of validity in the parameterization (T = 426K,p = 0.34Pa), we calculatep◦,L at T is in the range (1–40) × 10−9Pa, consistent with our upper limits.
Atmos. Chem. Phys., 13, 6647–6662, 2013 www.atmos-chem-phys.net/13/6647/2013/
A. J. Huisman et al.: Vapor pressures of polyacids 6655
3.2 3.25 3.3 3.35
x 10−3
10−8
10−7
10−6
10−5
Inverse Temperature (1/K)
Vap
or P
ress
ure
p° (T
) (P
a)
313 309 305 301 297
Temperature (K)
Fig. 6. Pure component vapor pressurep◦,L of DL-tartaric acid(open symbols, denoting two different particles). The measurementat∼ 312K is indistinguishable from zero. The upper and lower limitof vapor pressure atT ≈ 305K is extrapolated toT using1H
vap
of 75 (dashed) or 250 (solid) kJmol−1 and Eq. (5). The largest pos-sible range of vapor pressure atT from this extrapolation is re-ported.
4.6 Comparison to empirical models of vapor pressure
The EVAPORATION model described inCompernolle et al.(2011) was run both with and without the empirical correc-tion term (Eq. 31 ofCompernolle et al., 2011) to p◦,L forfunctionalized polyacids. For 2-mMA and 2-mGA, the cor-rection terms do not apply and both model outputs are iden-tical. The model has a mean absolute deviation of 0.4 or-ders of magnitude for polyacids (Compernolle et al., 2011),which we take as the uncertainty in model output. The resultsof these calculations are displayed in Fig. 2, along with theoutputs of two other frequently-used vapor pressure estima-tions methods (Nannoolal et al., 2008; Moller et al., 2008) forcomparison, both of which were calculated using the sameestimated normal boiling pointsTb (at a total pressure of101.325 kPa) (Nannoolal et al., 2004) as inputs.
In the following analysis, we will focus on comparison tothe EVAPORATION model as this model includes the empir-ical correction for substituted polyacids. The measurementsof 2-mMA presented here are around a factor of two belowthe lower bound of model output, while 2-mGA is withinthe bounds of EVAPORATION model output. We view theseagreements as reasonable, if not entirely satisfactory. In con-trast, the substituted polyacids 2-hMA, TA, and CA havemeasuredp◦,L that are a factor of∼ 500 (2-hMA), three or-ders of magnitude (TA) and at least three orders of magni-tude (CA) lower than the lower bound of the EVAPORA-TION model output, which includes the empirical correc-tion term. Predictions from the EVAPORATION model with-out the empirical correction are consistent with (TA, CA) or
3.2 3.25 3.3 3.35
x 10−3
10−9
10−8
10−7
10−6
Inverse Temperature (1/K)
Vap
or P
ress
ure
p° (T
) (P
a)
313 309 305 301 297
Temperature (K)
Fig. 7. Pure component vapor pressurep◦,L of citric acid (opensymbols, denoting two different particles). Both measurementswere indistinguishable from zero. The measured upper limit atT ≈ 311K is extrapolated to yield the upper limit atT using1H
vap of 75 (dashed) or 250 (solid) kJmol−1.
only one order of magnitude higher than (2-hMA) the EDB-derivedp◦, L. Altogether, these measurements are more con-sistent with the EVAPORATION model output that does notuse the empirical correction term for substituted polyacids.
4.7 Comparison to solid-state results
The disagreement betweenp◦,L(T ) for the compoundsstudied here and previous measurements is currently unex-plained. As discussed inSoonsin et al.(2010), one possibil-ity is that the physical state in other measurements was notfully controlled. This error would occur if some amorphousmaterial was present in the KEMS apparatus ofBooth et al.(2010), at which point the measurement reported as “solid”(p◦,S(T )) might actually reflect the vapor pressure of amor-phous liquid, namelyp◦,L(T ). The hypothesis can be testedby comparingp◦, L(T ) andp◦,S(T ) from different mea-surement techniques.
Measurements ofp◦,S for all compounds studied here areavailable, including direct measurement by KEMS (Boothet al., 2010), extrapolation fromT ≈ 340K using Knudsenmass-loss effusion (Ribeiro da Silva et al., 2000; Ribeiro daSilva et al., 2001), and extrapolation from 411 K< T < 440K using a simultaneous torsion and mass-loss effusion tech-nique (de Wit et al., 1983). These measurements are sum-marized in Table4 and graphically depicted in Fig.2. For2-mMA and 2-mGA (which are in reasonable agreementwith previous results), ourp◦, L(T ) is larger than previ-ously reportedp◦,S(T ), as expected. A similar enhance-ment inp◦, L(T ) over p◦,S(T ) was calculated byBoothet al.(2010) for these two compounds, and the measurementsof p◦,S(T ) of Booth et al.(2010) are in agreement with the
www.atmos-chem-phys.net/13/6647/2013/ Atmos. Chem. Phys., 13, 6647–6662, 2013
6656 A. J. Huisman et al.: Vapor pressures of polyacids
measurements ofRibeiro da Silva et al.(2000) andRibeiroda Silva et al.(2001). However, thep◦,S(T ) reported byBooth et al.(2010) for 2-hMA, CA, and TA are all at leastone order of magnitude larger than the largest upper limit orvalue ofp◦,L(T ) reported here. Thus, the physical state ofthe sample cannot be the only factor leading to the large dif-ferences between this work and previously reported values.
To the authors’ knowledge, the only measurements ofp◦,S(T ) for CA and 2-hMA are provided byBooth et al.(2010). However, measurements of meso-tartaric acid (astereoisomer of tartaric acid that is expected to have sim-ilar physical properties to DL-tartaric acid) were made byde Wit et al.(1983) in the range 411 K< T < 440 K. Us-ing the reported1Hsub of 156.9 kJmol−1 in de Wit et al.(1983) and assuming 2% error on that value, extrapolation toT = 298.15 K using Eq. (5) yieldsp◦,S
= (1.3–2.6)× 10−9
Pa at 298.15 K. This value is around 5 orders of magnitudesmaller than the reportedp◦,S(T ) for TA in Booth et al.(2010) and is consistent with (i.e., less than or equal to) theextrapolatedp◦, L(T ) of Yaws et al.(2009).
5 Implications
5.1 Partitioning of atmospheric aerosols
The propensity of organic material to re-enter the gas phaseafter condensation to an aerosol is postulated to be a cru-cial control on further chemical processing (e.g.,Salo et al.,2011). However, at some point a substance that has suf-ficiently low p◦,L is expected to remain in the condensedphase during the residence time of the particle in the atmo-sphere.Donahue et al.(2011) suggests that compounds withap◦,L of ∼ 1.3×10⁻⁶Pa or lower will be “almost completelycondensed under typical ambient conditions”. The measure-ments ofp◦, L(T ) for 2-hMA, CA and TA presented hereare near or below this value, while other published values forthe same compounds (see Table4) are above the cutoff bya few orders of magnitude. Thus, the accurate determinationof thep◦, L of these compounds will influence not only esti-mations of their partitioning between the gas and condensedphase, but also the mechanism by which they are further oxi-dized. This conclusion is not limited to 2-hMA, CA, and TA,but extends to all compounds that may have ap◦,L which issignificantly over-estimated by current vapor pressure calcu-lation techniques.
5.2 Evaporation rates in laboratory measurements
The time needed for a single-component particle to evapora-tively shrink to 1
eof its original radius is
1t =
(1−
1
e2
)×
(r(t0))2ρRT
2Dvp◦M, (6)
where1t is the elapsed time, and other symbols are definedas above (Davis and Ray, 1977). Using theDv given in Ta-
ble3, the e-folding evaporation times for a 10 µm radius par-ticle of pure TA atT is 8.3 min forp◦,L
= 0.31Pa (Boothet al., 2010) and∼ 15 yr forp◦, L
= 3.2×10⁻⁷Pa (this work)(details and calculation given in AppendixD). Similarlyfor CA, the e-folding evaporation time would be 10.9 h forp◦,L
= 3.1× 10⁻³Pa (Booth et al., 2010) and ∼ 23 yr forp◦, L
= 1.6× 10⁻⁷Pa (this work). Thus, the fast evapora-tion times associated with the measurements ofBooth et al.(2010) are not compatible with these EDB observations,which did not show any discernible evaporation of CA forseveral days even at∼ 310K.
For particles of radius 100 nm (similar to those used inTDMA experiments), the e-folding evaporation times wouldbe four orders of magnitude smaller, roughly 50 ms and 14 hfor the twop◦,L for TA given above. Such a large differenceshould be easy to observe in a TDMA and we suggest thatmeasurements of these and other compounds on such an in-strument could be used to corroborate our results.
6 Conclusions
Measurements of the pure component liquid vapor pressure(p◦,L) of several substituted polycarboxylic acids were madeby tracking the decreasing size of an evaporating particlein an EDB. As the measurements in the current study weretaken on a solution already in the liquid state or on the puresubcooled melt, they preclude the possibility of error intro-duced via the conversion from solid-state to liquid-state va-por pressure.
Our measurementsp◦,L(T ) agree reasonably wellwith previous measurements of 2-methylmalonic and 2-methylglutaric acids, and with an extrapolation of measure-ments taken above the melting point of citric acid (T >
426K), but are at least a factor of 500 lower than the onlyother measurements of 2-hydroxymalonic, tartaric, and cit-ric acids performed near room temperature byBooth et al.(2010). The discrepancy between our measurements and pre-vious studies may be partially explained by the presence ofliquid or amorphous semi-solid inclusions in a bulk sam-ple that was assumed to be crystalline, but the disagreementamong the vapor pressures of some of the polyacids is solarge that there is no obvious solution that brings these EDBmeasurements and the KEMS measurements ofBooth et al.(2010) into agreement.
The substantial disagreement between these two tech-niques shows that measurements of the vapor pressure ofsubstituted polyacids should be revisited. The agreement forthe methyl-substituted polyacids 2-mMA and 2-hMA showsthat these two techniques can provide consistent results. In-deed, the measurements of unsubstituted oxalic, succinic,and glutaric acids made bySoonsin et al.(2010) using thissame EDB apparatus and technique are all consistent withthep◦,L(T ) reported byBooth et al.(2010) for those com-pounds.
Atmos. Chem. Phys., 13, 6647–6662, 2013 www.atmos-chem-phys.net/13/6647/2013/

A. J. Huisman et al.: Vapor pressures of polyacids 6657
The measurements presented here are more consistentwith the EVAPORATION model which excludes the em-pirical correction of polyacids. Perhaps coincidentally, themethyl-substituted polyacids for which agreement with othermethods was found did not require an empirical correctionterm in the EVAPORATION model, while 2-hMA, CA andTA did. Altogether, these data suggest that the discrepancybetween the EDB and KEMS technique (and by extension,the EVAPORATION model, which includes the empiricalpolyacid correction) arises in polyacids with oxygen-bearing(or at least non-aliphatic) substituent groups. This suggestsvery strongly that for the time being, the EVAPORATIONmodel should be used without the empirical correction forsubstituted polyacids.
Appendix A
Examples of radius data
Examples of the raw radius data as a function of time for2-mGA, TA, and CA are shown in Fig.A1. Each experi-mental trace starts after the particle is equilibrated with re-spect to RH andT , and shows a very small but discernibleshrinking of the particle over the course of many days. Thesesignals correspond to vapor pressures of (a) 1.1× 10⁻⁶Pa,(b) 3.6×10⁻⁷Pa, and (c)< 1.6×10⁻⁷Pa. Measurements of2-mMA, Fig. A1a, were easily above limit of quantitation,as evidenced by the observable evaporation even at reducedtemperature. The measurement of TA, Fig. A1b, is approach-ing the limit of quantitation, as instrumental noise is visiblyoverlaid with evaporative shrinking. Finally, measurementsof CA, Fig. A1c, are below limit of quantitation. The∼ 10day experiment shown here shows a quasi-exponential pro-file that is typical of, e.g., the loss of residual water from theparticle and not of slow evaporative loss of CA. In this case,the assumption that the particle is in equilibrium with its sur-roundings (i.e., thataw = RH) is violated. The error analy-sis procedure described in AppendixB correctly yields a va-por pressure indistinguishable from zero without any manualintervention. However, we can still place an upper limit onthe vapor pressure of CA by observing that its evaporationis small enough to be masked by these very small shrinkingrates due to evaporation of traces of water (2 nm in 7 days).
Appendix B
Error analysis
B1 Statistical error
Standard error propagation was used to calculate the statisti-cal error inp◦,L(T ) derived from experiments at multipleT and RH. In general, the statistical error on a measurementdepends on the duration of the measurement, the RH of the
0 2 4 6 8 10 127.81
7.82
7.83
Rad
ius
(µm
)
Time (days)
(b)
0 2 4 6 8 10 12304
305
306
307
308
Tem
pera
ture
(K
)
0 1 2 3 4 5 69.37
9.38
9.39
9.4
Rad
ius
(µm
)
Time (days)
(a)
0 1 2 3 4 5 6250
252
254
256
258
Tem
pera
ture
(K
)
0 1 2 3 4 5 6 7 8 9 10
8.193
8.194
8.195
8.196
8.197
Rad
ius
(µm
)
Time (days)
(c)
0 1 2 3 4 5 6 7 8 9 10
307
308
309
310
311
Tem
pera
ture
(K
)
Fig. A1. Radius data from(a) 2-methylglutaric acid,(b) DL-tartaricacid and(c) citric acid. Note that(a) and (b) have coarse radiusrange (30 and 20 nm, respectively) while(c) has a range of 5 nm.The spike in panel(a) near day four is an instrumental artifact and
was excluded from the fit ofdr2
dt. Panel(c) appears to show an expo-
nential decrease that is consistent with an exceedingly slow loss ofwater. The evaporative loss of citric acid in panel(c) must be lowerthan the loss rate of water after 10 days of drying at 35◦C.
measurement, and the steepness of the hygroscopic growthfactor that is unique to each compound. For LVOC, the cal-culated error is dominated by the particle response to slightchanges in RH, while experimental uncertainties for materi-als with higherp◦,L depend primarily on the accuracy of theretrieval of the absolute radius.
The assumed statistical errors in the variables of Eq. (1)are estimated as follows:
– Radius, the larger of (i) 10 %, based on the retrieval ofr(t0) from the angular scattering pattern, or (ii) the errordue to variations inr due to small changes in RH (cf.,Sect.B2).
– Mole fraction, 2 %, based on the variation of AIOM-FAC outputs with respect to the temperature range ofthe measurements and response ofx to small changesin RH.
– Density, 5 %, a conservative estimate due to the extrap-olation from bulk measurements.
– Temperature, 0.25 K, the maximum allowed variation intemperature over one experimental measurement
– Diffusivity of vapor, 20 %, following the suggestedvalue ofKrieger et al.(2012).
B2 Error arising from response of particles to changesin RH
In addition to the standard statistical uncertainty expected ina measurement, a potential error exists due to the response
www.atmos-chem-phys.net/13/6647/2013/ Atmos. Chem. Phys., 13, 6647–6662, 2013

6658 A. J. Huisman et al.: Vapor pressures of polyacids
of the particle to fluctuations in RH. In this case, the mea-surement of Mie resonance wavelength (and thus the changein particle radius) is highly accurate but the assumption thatevaporation is the only process causing the particle to changesize (at constantT and RH within instrumental stability)may be incorrect, leading to a confounding error indr
dt. Thus,
while our ability to measuredrdt
is excellent, the error indrdt
was increased for the purpose of error propagation as fol-lows. The measurement technique described here assumesthat the change in particle size is only due to evaporationof organic molecules and an associated amount of watermolecules, i.e., that the particle is equilibrated with its en-vironment inT and especially with respect to water vapor.Thus, a particle shrinking due to decreasing RH might beinterpreted to have highp, while a particle growing due toincreasing RH might display an artificially slow decrease inradius. Fits to data were made such that measured1RH <
0.5% and1T < 0.25K over the course of the measurement.We estimate that the ability of our RH sensor to detect driftsin measured RH is at worst 0.5 %, meaning that a drift of0.5 % actual RH could occur without registering a trend inmeasured RH.
Calculation of the false signal resulting from these smallvariations in RH requires a knowledge of the response of theparticle to changes in RH, which is highly non-linear. Above100 % RH, the particle grows without bound, and at high RHthe particle is extremely sensitive to small variations in RH,while under low RH conditions the growth is relatively small.For this analysis, the AIOMFAC model results were invertedto produce a growth factor:
GF=Vorg+ ( 1
x− 1) × Vw
Vorg. (B1)
The growth factor GF is normalized to be unity atx = 1 (pureorganic component) and is generated by assuming that thenumber of moles of organic compound are conserved dur-ing hygroscopic growth and that partial molar volumes areadditive. Each measurement occurs at a specific RH, whichdefines a range of growth factors depending on the steepnessof GF at that point. The error is then derived by assuminga totally non-volatile particle and calculating the largest pos-sible positive and negative changes in radius from the startingRH plus or minus the tolerance of 0.5 % RH. For substanceswith higher vapor pressures such as 2-mMA, this error playsa minor role in the calculation of the total statistical error,while for very short experiments (small dt) or very low p
measurements (small true dr), this term becomes dominant.
B3 Systematic errors
As thep calculated in Eq. (1) depends on the square of theabsolute particle radius, a systematic error is possible dueto error in the determination ofr(t0). This error would beapparent only when comparing several particles of the same
material, as each particle is self-consistent with respect toinitial radius. Such an error would appear as a set of datafrom one particle that is increased or decreased inp◦(T ) bya constant factor. Based on the six particles shown in Fig.5,we do not observe any systematic shifting of the data fromone particle away from the others. Thus, the systematic errorin the determination ofr(t0) is smaller than the statisticalerror and can be neglected.
Another systematic error that is very difficult to evalu-ate arises from the gas-phase diffusivity (Dv) of the organiccompound (see discussion inKrieger et al., 2012). Thep inEq. (1) is inversely proportional to gas-phase organic diffu-sivity, which is calculated based on two estimated parame-ters (as detailed in Sect.2.4). Unlike the potential error inr(t0), we have no ability to isolate the influence of system-atic error inDv as all experiments with the same materialused the same parameterization. In a future comparison tothese results, the influence of any systematic error inDv canbe minimized by taking into account the actual values thatwere used (given in Table3).
Appendix C
Miscellaneous effects
Here we present a justification for neglecting the influenceof the Kelvin effect and the reduction in vapor pressure ofpolarizable species in a charged droplet, and for neglectingthe influence of dimerization on the gas-phase diffusivity ofthe organic component.
C1 Influence of droplet size and charge
The Kelvin effect, the enhancement of vapor pressure overa curved surface, is well known and must be considered aspart of aerosol growth or evaporation in small particles. Inaddition to the Kelvin effect, recent work byNielsen et al.(2011) showed that the near-surface partial pressure of watervapor or other gasses with a permanent dipole or high po-larizability is increased above a charged particle. Using theformalism ofLapshin et al.(2002), Eq. (11) expressed in SIunits is
lnp
p0=
2σv
krT−
µDQ
4πε0kT r2× L
(µDQ
4πε0kT r2
)−
vQ2
32π2ε0kT r4
(1−
1
εL
), (C1)
whereL is the Langevin functionL(x) = coth(x)− 1/x andall symbols are defined as inLapshin et al.(2002) except ra-dius r, which has been changed fromR to avoid confusionwith the gas constant. Using the values in TableC1, the valueof p/p0 was calculated as 1.0004, a predicted enhancementof 0.04 % in the vapor pressure. Thus, the combined Kelvineffect and charge stabilization effect are minor compared to
Atmos. Chem. Phys., 13, 6647–6662, 2013 www.atmos-chem-phys.net/13/6647/2013/

A. J. Huisman et al.: Vapor pressures of polyacids 6659
Table C1.Definitions and values for parameters in Eq. (C1).
Variable Description Value Unit
σ Surface tension 7.2× 10⁻² Nm−1
v Molecular volume 2.99× 10⁻²⁹ m3molecules−1
ε0 Vacuum permittivity 8.85× 10⁻¹² m−3kg−1s4A2
k Boltzmann constant 1.38× 10⁻²³ JK−1
T Temperature 298 Kr Particle radius 2.5× 10⁻⁶ mµD Dipole moment 5.99× 10⁻³⁰ CmQ Charge 1.6× 10⁻¹⁵ CεL Static relative permittivity 80 unitless
experimental error and are not expected to influence our re-sults.
C2 Dimerization of gas-phase organics
An additional consideration in estimating the organic vapor-phase diffusivity in these materials is the possibility of car-boxylic acid dimer formation. Dimerization of carboxylicacids is well known, especially in the case of smallermolecules such as, e.g., formic acid; dicarboxylic acid dimershave been studied in the context of new particle nucleation(see, e.g.,Hallquist et al., 2009, and references therein). Sub-stantial dimerization would result in reduced gas-phase diffu-sivity and would influence the apparent vapor pressure of theorganic (and the monomer) vapor pressure. However, dimer-ization of the vapor is unlikely to influence the measurementsdue to the low gas-phase concentration of the organic compo-nent in the experimental apparatus. For a droplet in thermo-dynamic equilibrium, the vapor pressure specifies the partialpressure of that material in the vapor phase in the diffusion-limited region nearest the droplet. Thus, the mixing ratioof organic vapor (partial pressure of order 1× 10⁻³Pa orless) in an atmosphere of∼ 80× 103Pa continuously flow-ing organic-free N2 would be of order 1× 10⁻⁸ or lower.Assuming that di- and mono-carboxylic acids have similardimerization properties (the dissociation constants for mono-carboxylic acids in the gas phase are large, e.g., formic acid,3.6× 102Pa at 296 K,Vander Auwera et al., 2007), that theeffect of chain length on enthalpy of dimerization is min-imal (cf., Eq. 7 ofTsonopoulos and Prausnitz, 1970) andsolving the quadratic equation as described in, e.g.,Zuendet al. (2011), the fraction of molecules dimerized would be∼ 1 per 1× 10⁸ for a sample withp◦,L(T ) ∼ 1× 10⁻⁶ Pa.Even at the highest vapor pressures observed in this study of∼ 1× 10⁻³ Pa, less than 1 molecule in 1× 10⁵ is predicted tobe dimerized. Thus, dimerization is unlikely to play a majorrole in these experiments.
Table D1.Definitions and values for parameters in Eq. (D2).
Variable Description Value Unit
r(t0) Initial particle radius 1× 10⁻⁵ mρ Density 1.749 gcm−3
R Gas constant 8.314 Jmol−1K−1
T Temperature 298.15 KDv Gas phase diffusivity of organic 0.08 cm2s−1
p◦ Vapor pressure 0.31 PaM Molar mass 150.08 gmol−1
Appendix D
Evaporation times sample calculation
Beginning withDavis and Ray(1977), Eq. (3), and substitut-ing r for a to maintain consistency with our earlier nomen-clature,
r2(t) = r2(t0) + S12× (t − t0).
Now let 1t ≡ (t − t0) and letr(t) =1e× r(t0) to find the e-
folding evaporation time for a pure particle. Then
1
e2r2(t0) = r2(t0) + S12× 1t(
1−1
e2
)r2(t0) = −S12× 1t. (D1)
Now S12 ≡−2Dvp
◦MρRT
so that
1t =
(1−
1
e2
)r2(t0)ρRT
2Dvp◦M. (D2)
Using the values in TableD1 for TA,
1t =
(1−
1
e2
)(D3)
1× 10⁻¹⁰m2× 1.749gcm−3
× 8.314Jmol−1K−1× 298.15K
2× 0.08cm2s−1 × 0.31Pa× 150.08gmol−1
1t = 5.04× 10⁻⁸ m5s
cm5×
(100cm
1m
)5
= 5.04× 10²s= 8.4min
and ∼ 15 yr for p◦= 3.2× 10⁻⁷Pa. For CA, usingM =
192gmol−1 andp◦= 3.1×10⁻³Pa or 1.6×10⁻⁷Pa, we cal-
culate 10.9 h and∼ 23 yr, respectively. Due to the squareddependence on initial particle radius, changing from 10 µmto 100 nm radius particle results in a four order of magnitudedecrease in e-folding time.
www.atmos-chem-phys.net/13/6647/2013/ Atmos. Chem. Phys., 13, 6647–6662, 2013
6660 A. J. Huisman et al.: Vapor pressures of polyacids
Table E1.List of symbols and abbreviations.
Symbol Meaning SI Unit
1Hvap Enthalpy of vaporization atT kJmol−1
λ Peak wavelength of a Mie resonance mρ Density kg m−3
a activity coefficient –L/SVOC low- and semi-volatile organic compound –Dv Vapor phase diffusivity m2 s−1
GF (radius) growth factor –EDB Electrodynamic balance –KEMS Knudsen effusion mass spectrometry –M Molar mass kg mol−1
p Vapor pressure PapL p of liquid state sample Pap◦ Pure component vapor pressure in unspecified physical state Pap◦(T ) p◦ atT Pap◦,L p◦ of liquid state sample Pap◦,S p◦ of solid state sample Par particle radius mRH Relative humidity –T Temperature KT Reference temperature, here 298.15 K KTDMA Tandem differential mobility analyzer –V Molar volume m3 mol−1
x mole fraction of the organic component –
Acknowledgements.This material is based upon work supportedby the United States National Science Foundation under award no.IRFP 1006117, by ETH Zurich, and by the Competence CenterEnvironment and Sustainability of the ETH Domain (CCES)project IMBALANCE and OPTIWARES. Any opinions, findings,and conclusions or recommendations expressed in this material arethose of the authors and do not necessarily reflect the views of theUS National Science Foundation. Figure2 was produced usingthe bar2.m code written by Mike Sheppard of the MIT LincolnLaboratory. The authors thank Daniel Lienhard of ETH Zurich forperforming measurements of the density of 2-methylglutaric acid.
Edited by: M. Petters
References
ACD/Labs: Advanced Chemistry Development (ACD/Labs) Soft-ware V11.02 (© 1994–2012 ACD/Labs), Retrieved fromhttp://www.cas.org/products/scifinder, 15 November, 2012.
Armbruster, D. and Pry, T.: Limit of blank, limit of detection andlimit of quantitation., Clin Biochem Rev, 29 Suppl. 1, S49–52,http://www.ncbi.nlm.nih.gov/pubmed/18852857/, 2008.
Barley, M. H. and McFiggans, G.: The critical assessment of vapourpressure estimation methods for use in modelling the formationof atmospheric organic aerosol, Atmos. Chem. Phys., 10, 749–767, doi:10.5194/acp-10-749-2010, 2010.
Bilde, M., Svenningsson, B., Mønster, J., and Rosenørn, T.: Even–Odd Alternation of Evaporation Rates and Vapor Pressures of
C3–C9 Dicarboxylic Acid Aerosols, Environ. Sci. Technol., 37,1371–1378, doi:10.1021/es0201810, 2003.
Bird, R. B., Stewart, W. E., and Lightfoot, E. N.: Transport Phe-nomena, Wiley & Sons, 2007.
Booth, A. M., Barley, M. H., Topping, D. O., McFiggans, G.,Garforth, A., and Percival, C. J.: Solid state and sub-cooledliquid vapour pressures of substituted dicarboxylic acids usingKnudsen Effusion Mass Spectrometry (KEMS) and Differen-tial Scanning Calorimetry, Atmos. Chem. Phys., 10, 4879–4892,doi:10.5194/acp-10-4879-2010, 2010.
Bruns, E. A., Greaves, J., and Finlayson-Pitts, B. J.: Measurement ofVapor Pressures and Heats of Sublimation of Dicarboxylic AcidsUsing Atmospheric Solids Analysis Probe Mass Spectrometry, J.Phys. Chem. A, 116, 5900–5909, doi:10.1021/jp210021f, 2012.
Cappa, C. D., Lovejoy, E. R., and Ravishankara, A. R.: Deter-mination of Evaporation Rates and Vapor Pressures of VeryLow Volatility Compounds: A Study of the C4–C10 andC12 Dicarboxylic Acids, J. Phys. Chem. A, 111, 3099–3109,doi:10.1021/jp068686q, 2007.
Chattopadhyay, S. and Ziemann, P. J.: Vapor Pressures of Substi-tuted and Unsubstituted Monocarboxylic and Dicarboxylic AcidsMeasured Using an Improved Thermal Desorption Particle BeamMass Spectrometry Method, Aerosol Sci. Technol., 39, 1085–1100, doi:10.1080/02786820500421547, 2005.
Compernolle, S., Ceulemans, K., and Muller, J.-F.: EVAPORA-TION: a new vapour pressure estimation methodfor organicmolecules including non-additivity and intramolecular interac-tions, Atmos. Chem. Phys., 11, 9431–9450, doi:10.5194/acp-11-9431-2011, 2011.
Atmos. Chem. Phys., 13, 6647–6662, 2013 www.atmos-chem-phys.net/13/6647/2013/

A. J. Huisman et al.: Vapor pressures of polyacids 6661
Davis, E. J. and Ray, A. K.: Determination of diffusion coeffi-cients by submicron droplet evaporation, J. Chem. Phys., 67, 414,doi:10.1063/1.434903, 1977.
de Wit, H. G. M., Bouwstra, J. A., Blok, J. G., and de Kruif, C. G.:Vapor pressures and lattice energies of oxalic acid, mesotartaricacid, phloroglucinol, myoinositol, and their hydrates, J. Chem.Phys., 78, 1470–1475, doi:10.1063/1.444836, 1983.
Donahue, N. M., Epstein, S. A., Pandis, S. N., and Robinson, A.L.: A two-dimensional volatility basis set: 1. organic-aerosolmixing thermodynamics, Atmos. Chem. Phys., 11, 3303–3318,doi:10.5194/acp-11-3303-2011, 2011.
Glantschnig, W. J. and Chen, S.-H.: Light scattering from waterdroplets in the geometrical optics approximation, Appl. Opt., 20,2499–2509, doi:10.1364/AO.20.002499, 1981.
Hallquist, M., Wenger, J. C., Baltensperger, U., Rudich, Y., Simp-son, D., Claeys, M., Dommen, J., Donahue, N. M., George,C., Goldstein, A. H., Hamilton, J. F., Herrmann, H., Hoff-mann, T., Iinuma, Y., Jang, M., Jenkin, M. E., Jimenez, J. L.,Kiendler-Scharr, A., Maenhaut, W., McFiggans, G., Mentel, Th.F., Monod, A., Prevot, A. S. H., Seinfeld, J. H., Surratt, J. D.,Szmigielski, R., and Wildt, J.: The formation, properties and im-pact of secondary organic aerosol: current and emerging issues,Atmos. Chem. Phys., 9, 5155–5236, doi:10.5194/acp-9-5155-2009, 2009.
Krieger, U. K., Marcolli, C., and Reid, J. P.: Exploring thecomplexity of aerosol particle properties and processes usingsingle particle techniques, Chem. Soc. Rev., 41, 6631–6662,doi:10.1039/C2CS35082C, 2012.
Laguerie, C., Aubry, M., and Couderc, J. P.: Some physico-chemical data on monohydrate citric acid solutions in water:solubility, density, viscosity, diffusivity, pH of standard solu-tion, and refractive index, J. Chem. Eng. Data, 21, 85–87,doi:10.1021/je60068a031, 1976.
Lapshin, V., Yablokov, M. Y., and Palei, A. A.: Vapor Pressure overa Charged Drop, Russ. J. Phys. Chem., 76, 1901–1903, 2002.
Letcher, T. M. and Naicker, P. K.: Determination of vapor pressuresusing gas chromatography, J. Chromatogr. A, 1037, 107–114,doi:10.1016/S0021-9673(03)01299-8, 2004.
Lydersen, A. L.: Estimation of Critical Properties of Organic Com-pounds by the Method of Group Contributions, Tech. rep., Chem-ical Engineering Department, University of Wisconsin, 1955.
Lyons, L.: Statistics for Nuclear and Particle Physicists, Press Syn-dicate of the University of Cambridge, Cambridge CB2 1RP, UK,ISBN 0 521 37934 2, 1986.
Moller, B., Rarey, J., and Ramjugernath, D.: Estimation of thevapour pressure of non-electrolyte organic compounds via groupcontributions and group interactions, Journal of Molecular Liq-uids, 143, 52–63, doi:10.1016/j.molliq.2008.04.020, 2008.
Mønster, J., Rosenørn, T., Svenningsson, B., and Bilde,M.: Evaporation of methyl- and dimethyl-substitutedmalonic, succinic, glutaric and adipic acid particles atambient temperatures, J. Aerosol Sci., 35, 1453–1465,doi:10.1016/j.jaerosci.2004.07.004, 2004.
Nannoolal, Y., Rarey, J., Ramjugernath, D., and Cordes, W.: Esti-mation of pure component properties: Part 1. Estimation of thenormal boiling point of non-electrolyte organic compounds viagroup contributions and group interactions, Fluid Phase Equilib-ria, 226, 45–63, doi:10.1016/j.fluid.2004.09.001, 2004.
Nannoolal, Y., Rarey, J., and Ramjugernath, D.: Estimation of purecomponent properties: Part 3. Estimation of the vapor pres-sure of non-electrolyte organic compounds via group contribu-tions and group interactions, Fluid Phase Equilib., 269, 117–133,doi:10.1016/j.fluid.2008.04.020, 2008.
Nielsen, J. K., Maus, C., Rzesanke, D., and Leisner, T.: Charge in-duced stability of water droplets in subsaturated environment,Atmos. Chem. Phys., 11, 2031–2037, doi:10.5194/acp-11-2031-2011, 2011.
Pankow, J. F.: An absorption model of the gas/aerosol partition-ing involved in the formation of secondary organic aerosol, At-mos. Environ., 28, 189–193, doi:10.1016/1352-2310(94)90094-9, 1994.
Pankow, J. F.: Gas/particle partitioning of neutral and ionizingcompounds to single and multi-phase aerosol particles. 1. Uni-fied modeling framework, Atmos. Environ., 37, 3323–3333,doi:10.1016/S1352-2310(03)00346-7, 2003.
Pope, F. D., Tong, H.-J., Dennis-Smither, B. J., Griffiths, P. T.,Clegg, S. L., Reid, J. P., and Cox, R. A.: Studies of SingleAerosol Particles Containing Malonic Acid, Glutaric Acid, andTheir Mixtures with Sodium Chloride. II. Liquid-State VaporPressures of the Acids, J. Phys. Chem. A, 114, 10156–10165,doi:10.1021/jp1052979, 2010.
Prausnitz, J., Lichtenthaler, R., and de Azevedo, E.: Molecularthermodynamics of fluid-phase equilibria, Prentice-Hall Interna-tional Series in the Physical and Chemical Engineering Sciences,Prentice-Hall PTR, ISBN: 0139777458, 1999.
Ribeiro da Silva, M. A. V., Monte, M. J. S., and Ribeiro, J. R.: Stan-dard Enthalpies, Entropies, and Gibbs Functions of Sublimationof Four Alkyl-Substituted Malonic Acids, J. Chem. Eng. Data,45, 756–759, doi:10.1021/je000090n, 2000.
Ribeiro da Silva, M. A. V., Monte, M. J. S., and Ribeiro, J. R.:Thermodynamic study on the sublimation of succinic acid andof methyl- and dimethyl-substituted succinic and glutaric acids,J. Chem. Thermodyn., 33, 23–31, doi:10.1006/jcht.2000.0715,2001.
Riipinen, I., Koponen, I. K., Frank, G. P., Hyvarinen, A.-P., Van-hanen, J., Lihavainen, H., Lehtinen, K. E. J., Bilde, M., and Kul-mala, M.: Adipic and Malonic Acid Aqueous Solutions: SurfaceTensions and Saturation Vapor Pressures, J. Phys. Chem. A, 111,12995–13002, doi:10.1021/jp073731v, 2007.
Salo, K., Jonsson, A. M., Andersson, P. U., and Hallquist,M.: Aerosol Volatility and Enthalpy of Sublimation ofCarboxylic Acids, J. Phys. Chem. A, 114, 4586–4594,doi:10.1021/jp910105h, 2010.
Salo, K., Hallquist, M., Jonsson,A. M., Saathoff, H., Naumann, K.-H., Spindler, C., Tillmann, R., Fuchs, H., Bohn, B., Rubach, F.,Mentel, Th. F., Muller, L., Reinnig, M., Hoffmann, T., and Don-ahue, N. M.: Volatility of secondary organic aerosol during OHradical induced ageing, Atmos. Chem. Phys., 11, 11055–11067,doi:10.5194/acp-11-11055-2011, 2011.
Soonsin, V., Zardini, A. A., Marcolli, C., Zuend, A., and Krieger,U. K.: The vapor pressures and activities of dicarboxylic acidsreconsidered: the impact of the physical state of the aerosol,Atmos. Chem. Phys., 10, 11753–11767, doi:10.5194/acp-10-11753-2010, 2010.
Tsonopoulos, C. and Prausnitz, J.: Fugacity coefficients in vapor-phase mixtures of water and carboxylic acids, Chem. Eng. J., 1,273–278, doi:10.1016/0300-9467(70)85014-6, 1970.
www.atmos-chem-phys.net/13/6647/2013/ Atmos. Chem. Phys., 13, 6647–6662, 2013
6662 A. J. Huisman et al.: Vapor pressures of polyacids
Vander Auwera, J., Didriche, K., Perrin, A., and Keller, F.: Abso-lute line intensities for formic acid and dissociation constant ofthe dimer, J. Chem. Phys., 126, 124311, doi:10.1063/1.2712439,2007.
Verevkin, S. P., Wandschneider, D., and Heintz, A.: Determinationof Vaporization Enthalpies of Selected Linear and Branched C7,C8, C9, C11, and C12 Monoolefin Hydrocarbons from Transpi-ration and Correlation Gas-Chromatography Methods, J. Chem.Eng. Data, 45, 618–625, doi:10.1021/je990297k, 2000.
Washburn, E. W., West, C. J., and National Research Council (U.S.):International critical tables of numerical data, physics, chemistryand technology, vol. 1, McGraw-Hill, New York, 1926.
Yaws, C. L., Narasimhan, Prasad, K., and Gabbula, C.: Yaws’Handbook of Antoine Coefficients for Vapor Pressure (2ndElectronic Edition),http://www.knovel.com/web/portal/browse/display?EXT KNOVEL DISPLAY bookid=1183 (retrievedJanuary 2012), 2009.
Zardini, A. A., Krieger, U. K., and Marcolli, C.: White light Mie res-onance spectroscopy used to measure very low vapor pressuresof substances in aqueous solution aerosol particles, Opt. Express,14, 6951–6962, doi:10.1364/OE.14.006951, 2006.
Zhang, S. and Davis, E. J.: Mass transfer from a single micro-droplet to a gas flowing at low Reynolds Number, Chem. Eng.Commun., 50, 51–67, doi:10.1080/00986448708911815, 1987.
Zuend, A. and Seinfeld, J. H.: Modeling the gas-particle parti-tioning of secondary organic aerosol: the importance of liquid-liquid phase separation, Atmos. Chem. Phys., 12, 3857–3882,doi:10.5194/acp-12-3857-2012, 2012.
Zuend, A., Marcolli, C., Luo, B. P., and Peter, T.: A thermodynamicmodel of mixed organic-inorganic aerosols to predict activity co-efficients, Atmos. Chem. Phys., 8, 4559–4593, doi:10.5194/acp-8-4559-2008, 2008.
Zuend, A., Marcolli, C., Peter, T., and Seinfeld, J. H.: Computa-tion of liquid-liquid equilibria and phase stabilities: implicationsfor RH-dependent gas/particle partitioning of organic-inorganicaerosols, Atmos. Chem. Phys., 10, 7795–7820, doi:10.5194/acp-10-7795-2010, 2010.
Zuend, A., Marcolli, C., Booth, A. M., Lienhard, D. M., Soonsin, V.,Krieger, U. K., Topping, D. O., McFiggans, G., Peter, T., and Se-infeld, J. H.: New and extended parameterization of the thermo-dynamic model AIOMFAC: calculation of activity coefficientsfor organic-inorganic mixtures containing carboxyl, hydroxyl,carbonyl, ether, ester, alkenyl, alkyl, and aromatic functionalgroups, Atmos. Chem. Phys., 11, 9155–9206, doi:10.5194/acp-11-9155-2011, 2011.
Atmos. Chem. Phys., 13, 6647–6662, 2013 www.atmos-chem-phys.net/13/6647/2013/