analysis of faults in overhead transmission lines ......2.2.1 lightning 5 ... 3.3.1 single...
TRANSCRIPT

ANALYSIS OF FAULTS IN OVERHEAD TRANSMISSION LINES
Presented to the faculty of the Department of Electrical and Electronic Engineering
Department
California State University, Sacramento
Submitted in partial satisfaction of
the requirements for the degree of
MASTER OF SCIENCE
in
Electrical and Electronic Engineering
by
William Patrick Davis
FALL
2012

ii
THE ANALYSIS OF FAULTS IN OVERHEAD TRANSMISSION LINES
A Project
by
William P. Davis
Approved by:
__________________________________, Committee Chair
Turan Gonen, Ph.D.
__________________________________, Second Reader
Preetham Kumar, Ph.D.
____________________________
Date
iii
Student: William P. Davis
I certify that this student has met the requirements for format contained in the
University format manual, and that this project is suitable for shelving in the Library
and credit is to be awarded for the project.
__________________________, Graduate Coordinator ___________________
Preetham Kumar, Ph.D. Date
Department of Electrical and Electronic Engineering

iv
Abstract
of
ANALYSIS OF FAULTS IN OVERHEAD TRANSMISSION LINES
by
William P. Davis
When designing power transmission systems, electric utility companies are
expected to follow a set of standard specifications that are briefly described in this
research. The idea to be kept in mind is that during the planning and construction
phases of transmission lines, natural elements, such as trees for example, there will
be less of a chance of fault occurrences and therefore more power system reliability.
Faults in transmission lines are one of the elements that will affect the reliability of
the system. The more fault occurrences, the lesser the system reliability, since this
causes outages in the power system that may result in the interruption of service.
The electric utility companies are expected to provide the consumer a
continuous and also a high quality of service at a competitive and reasonable cost.
This means that they have to insure the reliability of the system to provide the
consumer with a service that is consistent with the safety of personnel and equipment
and meet their demands within not only the specifications of voltage and frequency
but with a high degree of reliability and within reasonable cost to the consumer.
_______________________, Committee Chair
Turan Gonen, Ph.D.
_______________________
Date

v
ACKNOWLEDGEMENTS
Thank you to Professors Gonen and Kumar as this would not have been possible
without both their help and guidance. To my family and friends for all the support
throughout the years and believing that this would one day be possible.
Also, I would like to thank, via Professor Gonen, the original undergraduate Power
Senior Project Group whose work was the initial basis for the production of this
report.
My especial gratitude to my beloved fiancée, Miss Amanda K. (Mandie) Ryan, for
without her contributing effort, the completion of this report would not have been
possible.
vi
TABLE OF CONTENTS
Page
Acknowledgments v
List of Tables vii
List of Figures viii
Chapter 1. INTRODUCTION 1
2. THE LITERATURE SURVEY 2
2.1 Transmission lines 2
2.1.1 Introduction 2
2.1.2 Requirement of Transmission Lines 2
2.1.3 Selection of Voltage for High-Voltage Transmission Lines 3
2.1.4 Choice of Conductors 4
2.2 The Nature and Causes of Faults 5
2.2.1 Lightning 5
2.2.2 Pollution 8
2.2.3 Fires 8
2.3 Types of Faults 9
2.4 Fault Detection 13
2.4.1 Fault Detection Using Composite Fiber-Optic 13
2.4.2 Fault Detection Using Neural Network 15

vii
3. MATHEMATICAL DESIGN 18
3.1 Introduction 18
3.2 Types of Faults 18
3.2.1 Shunt Faults 18
3.2.2 Series Faults 19
3.3 Shunt Fault Computation 20
3.3.1 Single Line-to-Ground Faults 20
3.3.2 Double Line-to-Ground Faults 25
3.3.3 Line-to- Line Faults 29
3.3.4 The Balanced Three-Phase Fault 31
3.4 Series Fault Computations 33
3.4.1 Open Line Open (OLO) 33
3.4.2 Two Line Open (TLO) 35
4. THE APPLICATION OF THE MATHEMATICAL MODEL 37
4.1 Introduction 37
4.2 Calculation of the Network Sequences 38
4.3 Single Line-to-Ground Fault 44
4.4 Double Line-to- Ground Fault 45
4.5 Line-to- Line Fault 50
4.6 The Balanced Three-Phase Fault 52

viii
4.7 Series Fault 52
5. MODEL SIMULATION OF THREE-PHASE COMPENSATED NETWORK..56
6. CONCLUSION 62
References 63

ix
LIST OF TABLES
Tables Page
Table 4.1 System Data 38

x
LIST OF FIGURES
Figures Page
Figure 2.1 Flashover Faults on Transmission Lines [6] 7
Figure 2.2 Configuration of Lightning Arrester [6] 7
Figure 2.3 Lightning Arrester Unit [6] 7
Figure 2.4 Lightning Arrester with Zinc Oxide [6] 7
Figure 2.5 Single Line-to-Ground Fault 11
Figure 2.6 Line-to-Line Fault 11
Figure 2.7 Double Line-to-Ground Fault 12
Figure 2.8 Three-Phase Fault 12
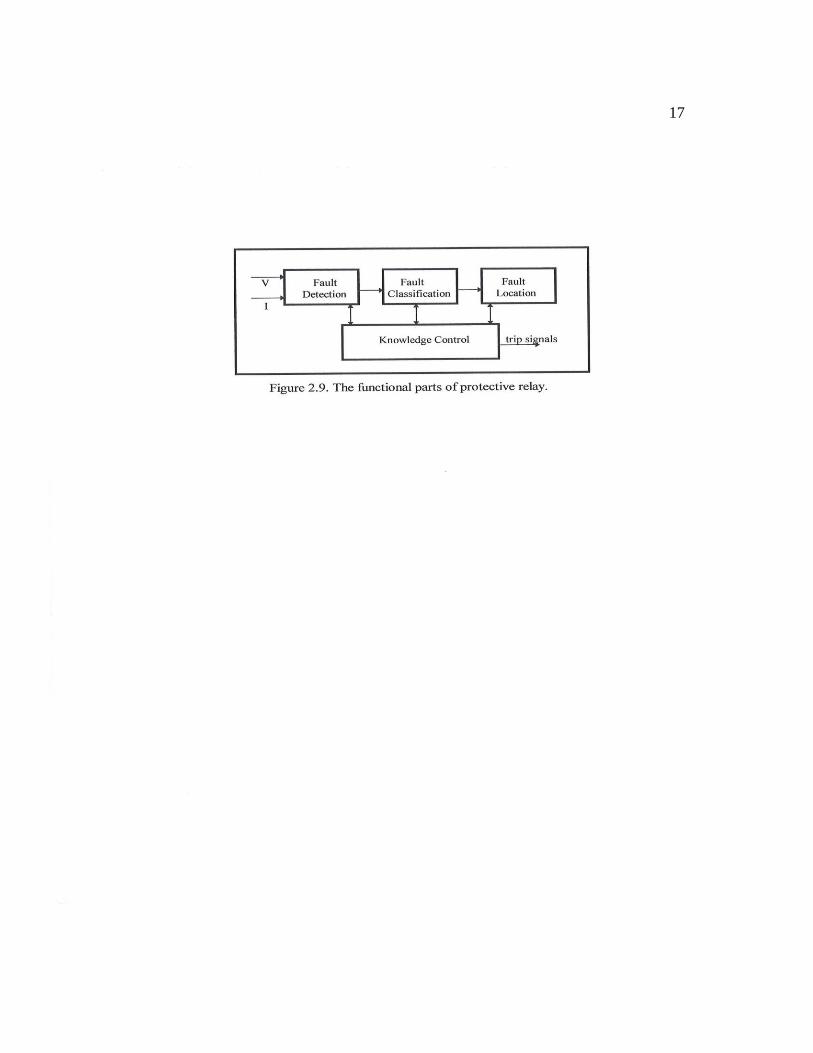
Figure 2.9 The functional parts of protective relay 17
Figure 3.1 Single Line-to-ground Fault Schematic 23
Figure 3.2 Equivalent Circuit for single Line-to-Ground Fault 23
Figure 3.3 Double Line-to-Ground Fault Circuit 28
Figure 3.4 Sequence Network for Double Line-to-Ground Fault 28
Figure 3.5 Example of Line to Line Fault 30
Figure 3.6 Line-to-Line Equivalent Circuit 30
Figure 3.7 A Balanced Three-Phase Fault 33
Figure 3.8-(a) One line open: general representation [8] 34
Figure 3.8-(b) One line open: connection of sequence networks [8] 34
Figure 3.9-(a) Two lines open: general representation [8] 36

xi
Figure 3.9-(b) Two lines open: interconnection of sequence networks [8] 36
Figure 4.1 System and fault location 39
Figure 4.2 Positive Sequence Network and steps in its reduction 39
Figure 4.3 Negative Sequence Network and its reduction 41
Figure 4.4 Zero Sequence Network and its Reduction 42
Figure 4.5 Sequence Network connection for SLG fault 48
Figure 4.6 Sequence network for DLG fault 48
Figure 4.7 Sequence network For LL fault 51
Figure 4.8 Sequence network for balanced 3Φ fault 51
Figure 4.9 Thevenin equivalent of positive, negative, and zero sequence networks_53
Figure 5.1 Simulink Model of 3-phase compensated network 57
Figure 5.2 Simulink Model output parameter block 58
Figure 5.3 (a) Output of Bus B1 59
Figure 5.3 (b) Output of Bus B2 60
Figure 5.3 (c) Output of Bus B3 61

1
Chapter One
INTRODUCTION
The Electric Power System is divided into many different sections. One of
which is the transmission system, where power is transmitted from generating
stations and substations via transmission lines into consumers. Both methods could
encounter various types of malfunctions is usually referred to as a “Fault”.
Fault is simply defined as a number of undesirable but unavoidable incidents
can temporarily disturb the stable condition of the power system that occurs when
the insulation of the system fails at any point. Moreover, if a conducting object
comes in contact with a bare power conductor, a short circuit, or fault, is said to have
occurred. The causes of faults are many, they include lighting, wind damage, trees
falling across transmission lines, vehicles or aircraft colliding with the transmission
towers or poles, birds shorting lines or vandalism.
In this study, the causes and effects of faults in the overhead transmission
lines were the focus of the research. Some of the many causes of faults, and some
detection methods will be discussed in chapter two (2). Chapter three (3) will
illustrate the mathematical model, and chapter four (4) will demonstrate the
application of this model for some hypothetical situations.

2
Chapter Two
THE LITERATURE SURVEY
2.1. Transmission lines
2.1.1 Introduction
The electric energy produced at generating stations is transported over high
voltage transmission lines to utilization points. In the early days (until 1917), electric
systems were operated as isolated systems with only point-to-point transmission at
voltages that are considered low by today’s standards.
2.1.2 Requirement of Transmission Lines
Transmission lines should transmit power over the required distance
economically and satisfy the electrical and mechanical requirements prescribed in
particular cases. It would be necessary to transmit a certain amount of power, as a
given power factor, over a given distance and be within the limit of given the
regulation, efficiency and losses. The lines should stand the weather conditions of
the locality in which they are laid. This would involve wind pressures and
temperature variation at the places and the lines should be designed for the
corresponding mechanical loading. The regulation would give the voltage drop
between the sending-end and the receiving-end. The possibility of a corona
formation and corresponding loss would be another consideration. The charging
current of the line depends on the capacity of the line and should not exceed the
limit. As far as the general requirements of transmission lines are concerned, the
lines should have enough capacity to transmit the required power, should maintain

3
continuous supply without failure, and should be mechanically strong so that there
are no failures due to mechanical breakdowns also. [2]
2.1.3 Selection of Voltage for High-Voltage Transmission Lines
With increase in the power to be transmitted over long distances, use of high
voltages for power transmission has been developed. However, a choice could be
made out of the standard voltages that are used in the country. The voltage selected
has to be economical and depends on the cost of the lines, cost of apparatus such as
transformers, circuit breakers, insulators, etc. This cost increases rapidly for voltages
in the range of 230 kV and above. For higher power, it is worthwhile to check
whether the required power can be transmitted using lower power voltages, e.g.
transmission at 230 kV using capacitors installed on the line instead of higher
voltages. The voltages used as standards in many countries 11 kV, 22 kV, and 33 kV
for short lines, 66 kV and 110 kV for medium lines and 132 kV, 166 kV, 230 kV and
above for long lines.
In the selection of voltage of transmission lines, the existing and future
voltage of
the other lines in the vicinity should be considered. This is required for the possible
interconnection of the grid lines. In such cases, it may be necessary to choose
voltages higher than the most economical voltage. Possible developments in the
location should also be considered in justifying the choice of voltage. The choice of
voltage is also liked with the conductor size, when transmitting the required power.

4
The power to be transmitted and the distance over which it is to be transmitted
together decide the voltage to a certain extent.
As regards to the distance of transmission, 11 kV and 33 kV lines are used
for short distances, while the other lines may be used for the appropriate distances.
This is just a very rough guide for preliminary work, to start detailed design of the
line required. The choice of conductors, etc. also affects the choice. In designing a
transmission line, It would, therefore, be worthwhile to consider two or three
possible voltages and two or three conductor sizes to obtain the required
characteristics of the line within the given limitations.
2.1.4 Choice of Conductors
The conductors available are hard-drawn copper or stranded conductors, or
ACSR conductors. For short lines with comparatively low voltages up to 33 kV,
copper conductors are used if available. For high-voltage lines, the increase in the
span and the weight of the conductors to be supported becomes an important
consideration. ACSR conductors are commonly used for high-voltage work. In most
countries where copper is not available in plenty and needs to be imported, it would
be worthwhile to use ACSR conductors wherever possible.
The size of the conductor selected depends on the length of the transmission
line, load on the line and the voltage of the line. For a given loss of energy,
expressed as percentage of the energy to be transmitted, the cross section of the
conductor as well as its weight varies inversely as the square of the voltage of the
line. The loss in the transmission line is 3I2r per unit length of the line, where r is the

5
resistance per unit length of the line. The current in the line depends on the voltage
and the power factor of the load to be supplied. As the voltage increases, the cross
section of the conductors reduces, and up to a certain extent, use of higher voltages
reduces the loss. However, for high voltages (above 166 kV) other losses should be
considered, i.e. due to leakage over insulators and Corona loss. The value of the
charging current also increases for the high voltages and this affects the line current.
The cost of the conductors depends on their weight. The safe current carrying
capacity in amperes for bare copper stranded overhead.
2.2 The Nature and Causes of Faults
The nature of a fault is simply defined as any abnormal condition, which
causes a reduction in the basic insulation strength between phase conductors, or
between phase conductors and earth or any earthed screens surrounding the
conductors. In practice, a reduction is not regarded as a fault until is it is detectable,
that is until it results either in an excess current or in a reduction of the impedance
between conductors, or between conductors and earth, to a value below that of the
lowest load impedance normal to the circuit. Thus a higher degree of pollution on an
insulator string, although it reduces the insulation strength of the affected phase, does
not become a fault until it causes a flashover across the string, which in turn
produces excess current or other detectable ab normality, for example abnormal
current in an arc-suppression coil. Following are some of the main causes:
2.2.1 Lightning

6
More than half of the electrical faults occurring on overhead power
transmission lines are caused by lightning (see Figure 2.1). The main conventional
approaches for reduction of the lightning flashover faults on power lines are
lowering of the footing resistance and employing of multiple shielding wires, and
differential insulation.

7

8
However, these methods have not been sufficient to prevent flashover faults.
In the mean time application of arresters to lines has been a better solution in recent
years. This alternate approach is to install an arrester to prevent the flashover of
insulator assemblies. It is important that the arrester should be strong enough in order
to withstand excessive lightning strikes. A newly developed suspension-type line
arrester has been developed by incorporating ZnO elements into the shed of a
conventional suspension insulator (Figures 2.3 and 2.4). It has an arrester function
along with the normal electrical and mechanical functions of a line insulator. It is a
gapless type that has the advantage of reliable surge absorption with no delay in
discharge. The new arrester holds promise not only for the prevention of lightning
faults, but also as means of achieving economical insulation in the overall
transmission systems. [6]
2.2.2 Pollution
Pollution is commonly caused by deposited soot or cement dust in industrial
areas, and by salt deposited by wind-borne sea-spray in coastal areas. A high degree
of pollution on an insulator string, although it reduces the insulation strength of the
affected phase, does not become a fault until it causes a flashover across the string,
which in turn reduces excess current or other detectable abnormality, for example
abnormal current in an arc-suppression coil.
2.2.3 Fires
The occurrence of fire under transmission lines is responsible for a great
number of line outages in many countries. Faults are mainly due to conductor to

9
ground short circuit at mid-span or phase-to-phase short circuit depending on line
configuration and voltage level. To reduce these outages to a minimum, the
clearance of existing lines must be increased in forests. Clearing and vegetation on
the line right of way in such areas is also a consideration. Another problem arising
from burning is the contamination of the insulators due to the accumulation of
particles (soot, dust) on its surfaces. In this case, the line insulation requirements
should be determined in such a way that the outages under fire could be reduced to a
minimum. [5]
Other causes of faults on overhead lines are trees, birds, aircraft, fog, ice,
snow loading, punctured or broken insulators, open-circuit conductors and abnormal
loading.
2.3 Types of faults
Power system faults may be categorized as shunt faults and series faults. The
most occurring type of shunt faults is Single Line-to-ground faults (SLG), which one
of the four types of shunt faults, which occur along the power lines. This type of
fault occurs when one conductor falls to ground or contacts the neutral wire. It could
also be the result of falling trees in a winter storm. This type could be represented as
in Figure 2.5.
The second most occurring type of shunt faults is the Line-to-Line fault (LL).
It is the result of two conductors being short-circuited. As in the case of a large bird
standing on one transmission line and touching the other, or if a tree branch fall on
top of the two of the power lines. This type could be represented as in Figure 2.6.

10
Third type of fault is the Double Line-to-Ground fault (DLG), Figure 2.7.
This can be a result of a tree falling on two of the power lines, or other causes. The
fourth and least occurring type of fault is the balanced three phase (Figure 2.8),
which can occur by a contact between the three power lines in many different forms.

11

12

13
Series faults can occur along the power lines as the “result of an unbalanced
series impedance condition of the lines in the case of one or two broken lines for
example. In practice, a series fault is encountered, for example, when lines (or
circuits) are controlled by circuit breakers (or fuses) or any device that does not open
all three phases; one or two phases of the line (or the circuit) may be open while the
other phases or phase is closed.” [8]
2.4 Fault Detection
2.4.1 Fault Detection Using Composite Fiber-Optic
In electric power supply services, power transmission lines are very
important and very indispensable. For that, power transmission lines are equipped
with various protection systems that are checked varies times periodically because of
the unexpected troubles that may destroy the lines. For the purpose of protecting
these lines, a new system was invented to discover the Fault Location using
Composite Fiber Optic Overhead Ground Wire (OPGW). This system deals mainly
with most causes of fault situations such as lightning, dew, snow, fog, or gales. This
new fault location system was developed to find out where electrical fault happened
on overhead power transmission lines by detecting the current induced in the ground
wire. Any fault situation needs the fastest processing in fixing the fault. For that, the
fault location system helps engineers to detect the point or the section where an
electrical fault happened in very logic time.
Since the fault information is uncertain, the new fault location deals with the
fault information as a current distribution pattern throughout the power line, and

14
applies Fuzzy Theory to realize the human-like manner of fault used by power
engineers. Mainly, the fault location method measures the current induced in the
OPGW at many points along the line, these points are various sensors mounted on
the tower and transmits the information to the central monitoring station through the
optical fiber within the OPGW. So the fault information system is mainly given by
sensing and data transmission. Electrical faults occurring on power transmission
lines can be classified into two types: grounding and short circuit fault.
The transmission that gets to the central monitor station deals with current
characteristic features. In order to locate the fault, engineers must use the features of
currents that deal with the phase angle and the amplitude and relate these features to
Fuzzy Theory. The idea arose of using Fuzzy Theory as a fault theory algorithm
similar to this kind of human thinking. There were some sets for Fuzzy theory: SdI
(large amplitude change) Sd(large phase angle change) SdIp (large angle change),
SIS2 (amplitude approximately half of saturation current Is) and finally SIn (amplitude
larger than normal). For that the possibility of grounding faults occurring can be
expressed by:
(2.1)
Maximum Fault grounding is expressed by
(2.2)
The possibility of short circuit fault is expressed
(2.3)

15
The maximum short circuit fault is expressed
(2.4)
Also, we have to know that the FI sensors divide all faults occurring in a section. In
general his system already has been applied to several commercial power
transmission lines and successfully located the sections of the faults [9].
2.4.2 Fault Detection Using Neural Network
As indicated before, protecting transmission is very important task in
safeguard electric power systems. For that, faults on transmission lines need to be
detected, classified, and located accurately. All these actions must be taken in very
short time to clear the fault. The new approach of neural network to fault
classifications for high speed protective relaying is a good manner in solving any
fault classification for high speed protective relaying is a good manner in solving any
fault happened to the transmission lines. Mainly this scheme is based on the use of
neural architecture and implementation of digital signal processing concepts. Figure
2.9 shows functional parts of protective relay. The protective relay need sampled
values of currents and voltages of three lines build inputs of the system. In general, a
knowledge control module controls all other parts of the relay and is responsible for
sending trip signals. The fault detection module is signals that a fault location
classification module uses samples of normalized currents (i) and voltages (v).
A1KHz sample rate is use to ensure that the fault type classification can be done in a
timely fashion. This module classifies weather a 1-phase-to-ground, 2-phase-to-
ground, phase-to-phase or a 3-phase fault has occurred. In the classification process,

16
arcing and non-arcing must be known in order to obtain a successful automatic
reclosing. Generally speaking, neural network classifies the fault into types. The first
type (1-phase, 2-phase, 3-phase faults) is fast 5-7 ms and reliable. The second type,
arcing and non-arcing faults support a successful automatic reclosing. [1]
17
18
Chapter Three
MATHEMATICAL DESIGN
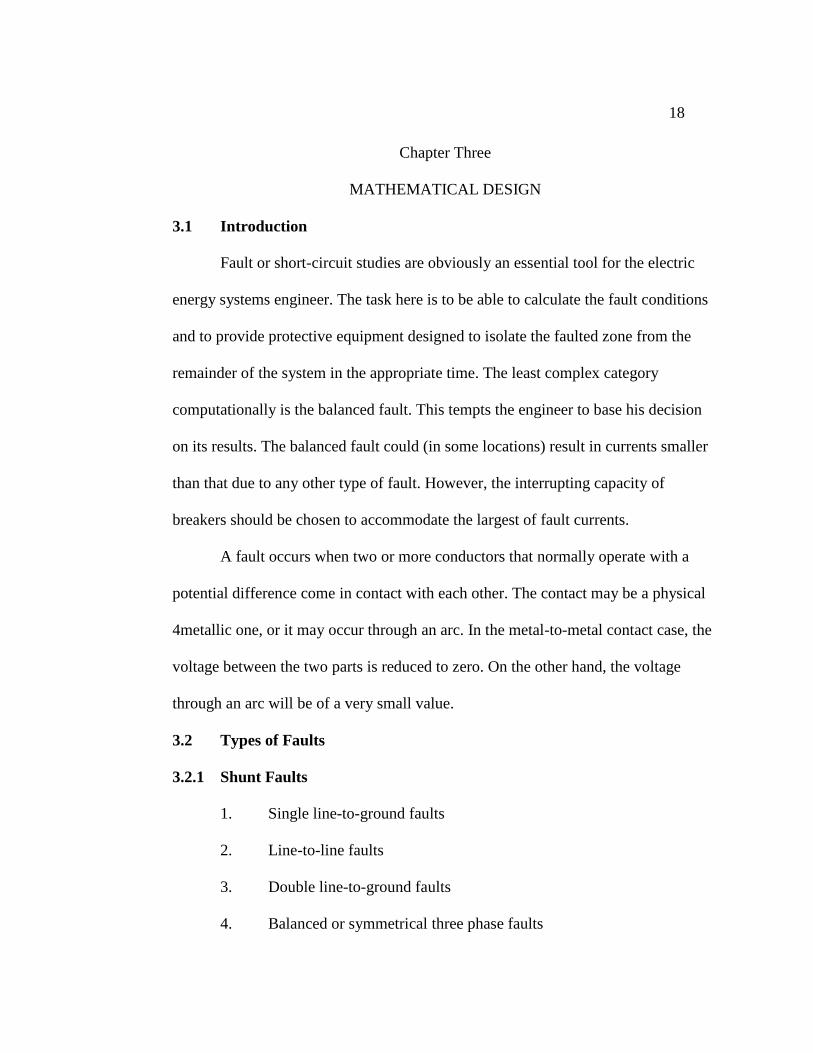
3.1 Introduction
Fault or short-circuit studies are obviously an essential tool for the electric
energy systems engineer. The task here is to be able to calculate the fault conditions
and to provide protective equipment designed to isolate the faulted zone from the
remainder of the system in the appropriate time. The least complex category
computationally is the balanced fault. This tempts the engineer to base his decision
on its results. The balanced fault could (in some locations) result in currents smaller
than that due to any other type of fault. However, the interrupting capacity of
breakers should be chosen to accommodate the largest of fault currents.
A fault occurs when two or more conductors that normally operate with a
potential difference come in contact with each other. The contact may be a physical
4metallic one, or it may occur through an arc. In the metal-to-metal contact case, the
voltage between the two parts is reduced to zero. On the other hand, the voltage
through an arc will be of a very small value.
3.2 Types of Faults
3.2.1 Shunt Faults
1. Single line-to-ground faults
2. Line-to-line faults
3. Double line-to-ground faults
4. Balanced or symmetrical three phase faults

19
Overhead lines are constructed of bare conductors. Wind, sleet, trees, cranes, kites,
airplanes, birds, or damage to supporting structure are causes for accidental faults on
overhead lines. Contamination of insulators and lightning over voltages will in
general result in faults. Deterioration of insulation in underground cables results in
short circuits. This is mainly attributed to aging combined with over loading. About
75 percent of the energy system’s faults are due to the shunt fault type and result
from insulator flashover during electrical storms. Only one in twenty faults are due
to the balanced fault.
3.2.2 Series Faults
1. One line open
2. Two line open
The series types of faults occur due to an unbalanced series impedance
condition of the lines. This could occur when fuses or any device, which does not
open all three phases, one or two phases, controls circuits. It is also the result of one
or two broken lines, or impedance inserted in one or two lines. Such faults could
occur as a result of one or two phases of the line open while the other phase or
phases are closed.
When the system impedances and admittances are constants the method of
symmetrical components can be used to determine fundamental frequency currents
and voltages in the system with one or two open conductors. The existing impedance
of a transformer is an example of impedance, which is not constant, but varies with
the applied voltage.

20
As a result of a fault, currents of high value will flow through the network to
the faulted point. The amount of current will be much greater than the desired
thermal ability of the conductors in the power lines or machines feeding the fault.
Which causes temperature to rise which in turn may cause damage by annealing of
conductors and insulation charring. In addition to this, the low voltage in the
neighborhood of the vault will render the equipment inoperative.
3.3 Shunt Fault Computation
3.3.1 Single Line –to- Ground Faults
Assume that the phase a is shorted to ground at the fault point F as shown in
figure 3.1. Phase b and c currents are assumed to be negligible, and we can thus write
The sequence currents are obtained as follows:
To find the positive sequence value we use
(3.1)
This gives
(3.2)
For the negative sequence current, we have
(3.3)
This gives

21
(3.4)
Likewise for the zero sequence current, we get
(3.5)
We can then conclude then that in the case of a single line-to-ground fault, the
sequence currents are equal, and we write
(3.6)
With the generators normally producing balanced three phase voltages, which are
positive sequence only, we can write
Let us assume that the sequence impedances to the fault are given by Z1, Z2, Z0. We
can write the following expressions for sequence voltages at the fault:
(3.7)
(3.8)
(3.9)
The fact that phase a is shortened to the ground is used. Thus
We also recall that
22
(3.10)
We conclude
(3.11)
Or

23
The resulting equivalent circuit is shown in Figure 3.2
24
We can now state the solution in terms of phase currents:
(3.13)
For phase voltages we have
(3.14)
(3.15)
The last two expressions can be derived easily from the basic relations.
For phase b, we have
(3.16)
Using equations 3.7, 3.8, and 3.9, we find that
Which reduces to
(3.19)
And since
(3.20)

25
We obtain
(3.21)
Similarly we get the result for phase c.
3.3.2 Double Line-to-Ground Faults
In this case, we will consider a general fault condition. We assume that phase
b has fault impedance of Zf ; phase c has a fault impedance of Zf ; and the common
line-to-ground fault impedance is Zg as shown in Figure 3.3.
The boundary conditions are as follows:
(3.22)
(3.23)
The potential difference between phase b and c is thus
(3.24)
Substituting in terms of sequence currents and voltages, we have
(3.25)
As a result, we get
(3.26)
The sum of the phase voltages is
(3.27)

26
In terms of sequence quantities this gives
(3.28)
Recall that since Ia = 0, we have
(3.29)
We can thus assert that
(3.30)
Substituting for Va0 from equation 3.26, we get
(3.31)
The above reduces to
(3.32)
Now we have
(3.33)
(3.34)
(3.35)
Consequently,
(3.36)
It is clear from equation (3.36) that the sequence networks are connected in
parallel, which could be seen in Figure 3.4. From the equivalent circuit we obtain the
positive sequence current
(3.37)

27
The negative sequence current in
(3.38)
Finally,
(3.39)

28

29
3.3.3 Line-to-Line Faults
In the case of line-to-line fault a short circuit occurs between two phases.
Assuming that phase a is the un-faulted phase, Figure 3.5 shows a three-phase
system with a line-to-line short circuit between phases b and c. The boundary
conditions in this case are
(3.40)
(3.42)
The first two conditions yield
(3.43)
Or
(3.44)
The voltage conditions give
(3.45)
which gives
(3.46)

30
Or
(3.47)
(3.48)
The equivalent circuit will take on the form shown in figure 3.6. Note that the zero
sequence network is not included since .

31
3.3.4 Balanced Three-Phase Vault
Let us now consider the situation with a balanced three-phase fault on phases
a, b, and c, all through the same fault impedance Zf. This fault condition is shown in
Figure 3.7. It is clear from inspection of this figure that the phase voltages at the fault
are represented by
(3.49)
(3.50)
(3.51)
The positive sequence voltages are obtained using the following
(3.52)
Using equations (3.49; 3.50 and 3.51), it was concluded that
(3.53)
However, for currents we get
(3.54)
The negative sequence voltage is similarly given by
(3.55)
The zero sequence voltage is also
(3.56)

32
For a balanced source we have
(3.57)
(3.58)
(3.59)
Combining equations (3.54 and 3.57), it was to conclude
(3.60)
As a result,
(3.61)
Combining equations (3.55 and 3.58) gives
Finally equations (3.56 and 3.59) give

33
3.4 Series Fault Computations
3.4.1 One Line Open (OLO)
From Figure 3.8, it can be observed that the line for one the open line
conductor in phase a is infinity, whereas the line impedances for the other two phases
have some finite values [8]. Therefore, the positive, negative, and zero sequence
currents can be expressed as
(3.62)
And by current division,
(3.64)

34
Or simply
(3.65)
Where
(3.66)

35
3.4.2 Two Line Open (TLO)
If two lines are open as shown in Figure 3.9, then the lime impedances for the
OLO in phases b and c are infinity, whereas the line impedance of phase a has some
finite [8]. Therefore,
And
(3.67)
By inspection of Figure 3.9, the positive, negative, and zero currents can be
expressed as
(3.68)

36

37
Chapter Four
THE APPLICATION OF THE MATHEMATICAL MODEL
4.1 Introduction
Fault calculation is the analysis of power system electrical behavior under
fault conditions, with particular reference to the effects of these conditions on the
power system current and voltage values. Together with other aspects of system
analysis, fault calculation forms and indispensable part of the whole function and
process of power system design. Correct design depends essentially on a full
knowledge and understanding of system behavior and on the ability to predict this
behavior for the complete range of possible system conditions. Accurate and
comprehensive analysis, and the means and methods of achieving it, are therefore of
essential importance in obtaining satisfactory power system performance and in
ensuring the continued improvement in performance which results from the
development and application of new methods and techniques.
The applications of power system analysis cover the full range of possible
system conditions, they being divisible into two main classes, namely conditions in
which the power system is operating in a normal healthy state, and others in which it
is subjected to one or more of a wide variety of possible fault conditions. The
analysis of these conditions and their effects on the power system is of particular
relevance to such considerations as:
(a) The choice of suitable power system management, with particular
reference to the configuration of the transmission or distribution network.

38
(b) The determination point of the required load and short-circuit ratings
of the power system plant.
(c) The design and application of equipment for the control and
protection of the power system.
4.2 Calculation of the Network Sequences
Given the following system, in Figure 4.1 in the case of a fault at F. Assume
the following data in p.u:
Table 4.1 System Data for figure 4.1
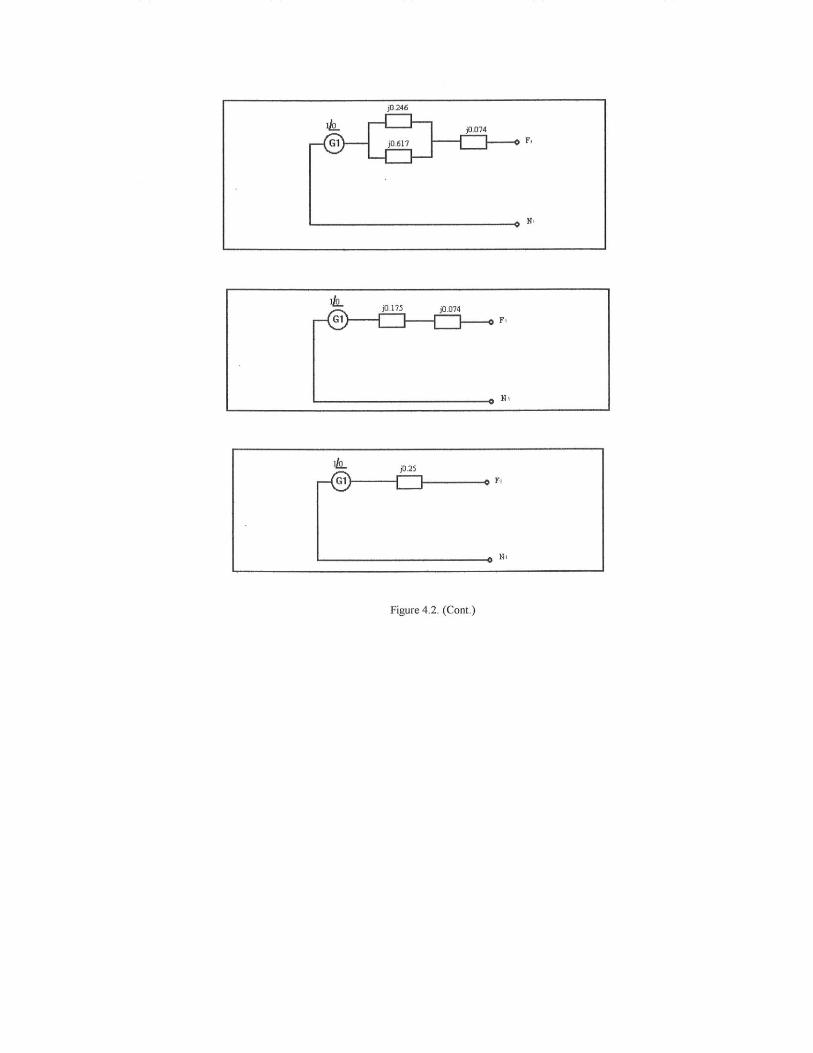
The positive, negative, and zero network sequences, were obtained using sequence
impedance reduction. The positive, negative, and zero network sequences are shown
in figures 4.2, 4.3, and 4.4 respectively.
Network component MVA rating Voltage rating (kV) X 1 (pu) X 2 (pu) X 0 (pu)
G 1 200 20 0.2 0.12 0.06
G 2 200 13.2 0.37 0.25 0.08
T 1 200 20 / 230 0.2 0.2 0.2
T 2 200 13.2 / 230 0.225 0.225 0.225
T 3 200 20 / 230
0.27 0.27 0.27
T 4 200 13.2 / 230 0.16 0.16 0.16
L 1 200 230 0.11 0.11 0.25
L 2 200 230 0.33 0.33 0.6

39
40

41

42

43

44
4.3 Single Line-to- Ground Fault
Using the data given earlier, assume there is a SLG and find the voltages and
currents at the fault point. The interconnection between the sequence networks for a
SLG is illustrated in Figure 4.5. The sequence network is connected in series for
SLG fault.
The sequence currents are given by
Therefore,
The sequence voltages are as follows
.
The phase voltages are thus

45
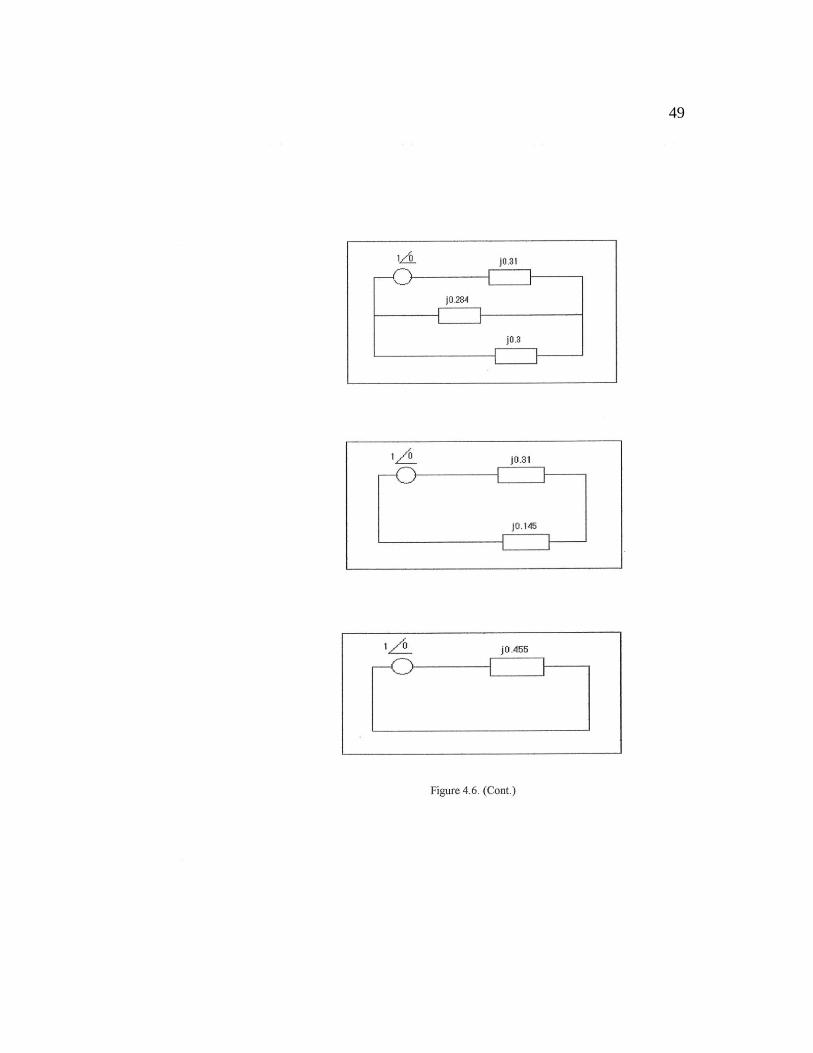
4.4 Double Line-to-Ground Fault
Using the sequence derived from the first example, assume having a DLG
fault with Zf = j0.06p.u and Zg = j0.025p.u. Find the voltages and currents at the fault
point. The sequence network connection is as shown in Figure 4.6.
Sequence currents are as follows:
Ia1 =

46
The sequence voltages are calculated as follows
The phase currents are obtained as
Phase Voltages are

47

48
49

50
4.5 Line-to-Line Fault
For the given network sequences in the first example, assuming a line to line
fault. From the sequence network connection in Figure 4.7, we can find sequence
currents at the fault point and sequence voltages thereby
The phase currents are thus
The sequence voltages are

51
The phase voltages are obtained as shown

52
4.6 The Balanced Three-Phase Fault
Using the calculated sequences in the first example, we can obtain the short
circuit current at the fault point for a balanced three-phase fault
4.7 Series Fault
Given the power system, in Figure 4.8, and in the case of a fault at F and Fꞌ,
assume the following data in p.u.
The positive, negative and zero network sequence, at fault points F and Fꞌ are
shown in Figure 4.9 using Thevenin’s equivalents.

53

54
Case 1. Assuming that there is a One Line Fault at phase (C). Positive, negative, and
zero sequence currents were calculated as shown.
In the case of fault at Phase (C)
Case 2
Assuming that there is a Two Line fault at phases (C-A). positive, negative, and zero
sequence currents were calculated as shown:

55
In case of fault at phase (C-A)

56
Chapter Five
MODEL SIMULATION OF THREE-PHASE COMPENSATED NETWORK
This chapter describes the simulation of the three-phase compensated
network, using the Simulink© modeling tool. The Simulink model is show below in
Figure 5.1
A three-phase, 60 Hz, 735 kV power system transmitting power from a
power plant consisting of six 350 MVA generators to an equivalent network through
a 600 km transmission line. The transmission line is split in two 300 km lines
connected between buses B1, B2, and B3. In order to increase the transmission
capacity, each line is series compensated by capacitors representing 40% of the line
reactance. Both lines are also shunt compensated by a 330 Mvar shunt reactance. The
shunt and series compensation equipments are located at the B2 substation where a
300 MVA 735/230 kV transformer with a 25 kV tertiary winding feeds a 230 kV,
250 MW load. The series compensation subsystems are identical for the two lines.
For each line, each phase of the series compensation module contains the series
capacitor, a metal oxide varistor (MOV) is protecting the capacitor, and a parallel
gap protecting the MOV. When the energy dissipated in the MOV exceeds a
threshold level of 30 MJ, the gap simulated by a circuit breaker is fired. CB1 and
CB2 are the two line circuit breakers.
The generators are simulated with a Simplified Synchronous Machine block.
Universal transformer blocks (two-windings and three-windings) are used to model
the two transformers. Saturation is implemented on the transformer connected at bus

57
B2. Voltages and currents are measured in B1, B2, and B3 blocks. These blocks are
Three-phase V-I Measurement blocks where voltage and current signals are sent to
the Data Acquisition block through Goto blocks.
Machine initialized for
P=1500 MW
Vt=13.8kV
Three-Phase Series Compensated NetworkThe 'Model initialization function' defined in the
Model Properties automatically sets the sample time Ts
to 50e-6 s
Discrete,
Ts = 5e-005 s.
A
B
C
a
b
c
Series
Compensation
(unit 2)
A
B
C
a
b
c
Series
Comp. 1
-C-
Pm
GEN
13.8e3V
1pu
-7.552deg.
B2
735e3V
1.03pu
7.354deg.
B3
735e3V
1pu
0deg.
B1
735e3V
1.012pu
16.39deg.
Line 2
(300 km)
Line 1
(300 km)A B CA B C
Fault
Breaker
-C-
E
?
Scopes
Data Acquisition
A
B
C
a
b
c
CB2
A
B
C
a
b
c
CB1
A
B
C
a
b
c
B3
A
B
C
a
b
c
B2
A
B
C
a
b
c
B1
E
m
A
B
C
SSM
Pm
6*350MVA
13.8 kV
A
B
C
a
b
c
6*350 MVA
13.8/735 kV
A B C
330 Mvar (2)
A B C330 Mvar (1)
A
B
C
a2
b2
c2
a3
b3
c3
300 MVA
735/230 kV
A
B
C
30,000 MVA
735 kV
A B C
250 MW
A B C
100 MW
Figure 5.1 Simulink Model of 3-phase compensated network
The output parameters of the simulation are shown in Figure 5.2 below, which has
three main sections: Bus B1 parameters, Bus B2 parameters, and Bus B3 parameters.

58
Sig_Cs1
1
Multimeter
Ia_MOV
Wa_MOV
Va_Cs
Iabc_B2
Vabc_B2
Iabc_B1
Vabc_B1
BUS B2
BUS B1
Vabc B1 (pu)
Iabc B1 (pu/100MVA)
Vabc B2 (pu)
Iabc B2 (pu/100MVA)
Va Cs (pu)
Ia MOV (A)
Energy MOVa (J)
Figure 5.2 Simulink Model output parameter block
The scope outpus for Buses 1, 2, and 3 are shown below in Figures 5.3 (a), (b) and
(c) respectively.

59
Figure 5.3 (a) Output of Bus B1

60
Figure 5.3 (b) Output of Bus B2

61
Figure 5.3 (c) Output of Bus B3

62
Chapter Six
CONCLUSION
The electric utilities companies are expected to provide consumers with a
continuous and high quality service at a competitive and reasonable cost. This means
that they have to insure the reliability of the system to provide consumers with a
service what is consistent with the safety personnel and equipment, and meet their
demands within specified voltage and frequency.
Faults in the transmission lines are one of the elements that the reliability of
the system is affected by. The more faults that take place, the less reliable the system
is, since they could cause outages in the power system, which may result in an
interruption of the service.
Therefore, when designing the power transmission systems, electric
companies are expected to follow the set of standard specifications that are briefly
described in chapter two of this research, keeping in mind that the further away
transmission lines are from natural elements, such as trees, the less faults
occurrences will be and the more reliable the power system will be.

63
REFERENCES
1. Dalstein, Thomas and Kulicke, Bernd (April 1995). Neural Network
Approach to Fault Classification for High speed Protective Relaying. IEEE
Transactions on Power Delivery, 10 (2), 1002-1009.
2. Deshpande, M.V. (1984) Electric Power Systems. 62-75. Tata McGrew-Hill
Publishing Company Limited.
3. Eaton, J. Robert, and Cohen, Edwin (1983).Electric Power Transmission
Systems,
(2nd
Ed.). Prentice-Hall Inc.
4. MacDonald (1969). Power System Protection, 1, The Electricity Council.
5. Fonseca, J.R., Tan, A.L., Monassi, V., Janquira, W.S., Silva, R.P.,
Assuncano, L.A.R., and Melo, M.O.C. (April 1990) Effects of Agricultural
Fires on the Performanceof Overhead Transmission Lines. IEEE Transactions
on Power Delivery, 5(2), 687-694.
6. Furukawa, Shuji, Usada, Osamu, Isozaki, Tashaki, and Irie, Tashaki (October
1989). Development and Application of Lightning Arresters for Transmission
Lines. IEEE Transactions on Power Delivery, 4(4), 2121-2127
7. Gonen, Turan, (1988). Electric Power Transmission System Engineering:
Analysis and Design. John Wiley & Sons.
8. Gonen, Turan (1987). Modern Power System Analysis. John Wiley and Sons.

64
9. Urasawa, K., Kanemaru, K., Toyota, S,. and Sugiyama, K. (October 1989).
New Fault Location System For Power Transmission Lines Using Composite
Fiber-Optic Overhead Grounding Wire (OPGW). IEEE Transactions on
Power Delivery, 4, 2005-2011.
10. Simulink Library Reference Manual, The Mathworks.