analysis of global competitiveness of selected industries and
TRANSCRIPT

Report # 1 in a Series of Transportation and Trade Studies of the Appalachian Region
Analysis of Global Competitiveness of Selected Industries and Clusters in the
Appalachian Region
For the Appalachian Regional Commission
Prepared by:
Jack Faucett Associates
4550 Montgomery Avenue Suite 300 North
Bethesda, MD 20814 301-961-8800
And
2 Oliver Street, 9th Floor Boston, MA 02109
617-338-6775
November 5, 2004

Table of Contents EXECUTIVE SUMMARY .......................................................................................................... 1
CHAPTER 1: INTRODUCTION................................................................................................ 8
CHAPTER 2: INDUSTRIAL ANALYSIS ................................................................................. 9
2A Manufacturing Industry Analysis ........................................................................... 9
2.1 Geographic Concentration......................................................................................................... 10
2.1.1 Electronic Components..................................................................................................... 10 2.1.2 Auto Parts ......................................................................................................................... 12 2.1.3 Machinery ......................................................................................................................... 13 2.1.4 Household Furniture ......................................................................................................... 15
2.2 Labor Costs................................................................................................................................ 17 2.3 Labor Productivity..................................................................................................................... 18 2.4 Capital Investment..................................................................................................................... 20 2.5 Capacity Utilization................................................................................................................... 21 2.6 Industry Concentration .............................................................................................................. 23 2.7 Regional Transactions ............................................................................................................... 27 2.8 Economic Impact Multipliers .................................................................................................... 27 2.9 Environmental Regulatory Costs............................................................................................... 29
2B The Services Industry............................................................................................. 33
2.10 The United States Educational Exports Sector.......................................................................... 34 2.11 U.S. Losing Educational Export Market Share to Other Countries........................................... 36 2.12 Appalachian International Student Facts ................................................................................... 37 2.13 Best Practices in International Programs at Higher Education Institutions............................... 38
2.13.1 Marshall University, WV.................................................................................................. 40 2.13.2 Clemson University, SC ................................................................................................... 42 2.13.3 Carnegie Mellon, PA ........................................................................................................ 44 2.13.4 Lee University, TN ........................................................................................................... 45 2.13.5 University of Scranton, PA............................................................................................... 46 2.13.6 Jefferson State Community College, AL .......................................................................... 48 2.13.7 Troy State University, AL ................................................................................................ 50 2.13.8 State University of New York (SUNY) ............................................................................ 52 ................................................................................................................ 53SUNY Fredonia .................................................................................................................. 57SUNY Buffalo
2.14 Recommendations for Developing an International Program ................................................... 61 2.15 Recruitment strategies ............................................................................................................... 63

CHAPTER 3: EXPORT MARKET ANALYSIS..................................................................... 65 3.1 Automobile Parts ....................................................................................................................... 66
3.1.1 NAFTA: Canada ............................................................................................................... 68 3.1.2 NAFTA: Mexico............................................................................................................... 68 3.1.3 Germany............................................................................................................................ 69 3.1.4 Sweden.............................................................................................................................. 70 3.1.5 Korea................................................................................................................................. 71
3.2 Household Furniture (Wood and upholstered) .......................................................................... 72 3.2.1 Asia/Pacific: Korea ........................................................................................................... 75 3.2.2 NAFTA: Canada ............................................................................................................... 75 3.2.3 NAFTA: Mexico............................................................................................................... 75 3.2.4 Middle East: Saudi Arabia ................................................................................................ 76 3.2.5 Middle East: United Arab Emirates (UAE) ...................................................................... 76
3.3 Machinery (Packaging and Food Processing) ........................................................................... 77 3.3.1 Asia/Pacific: China ........................................................................................................... 80 3.3.2 Asia/Pacific: Thailand....................................................................................................... 80 3.3.3 NAFTA: Canada ............................................................................................................... 81 3.3.4 NAFTA: Mexico............................................................................................................... 82 3.3.5 Latin America: Brazil ....................................................................................................... 82 3.3.6 Latin America: Argentina ................................................................................................. 83 3.3.7 Europe: Poland.................................................................................................................. 84
3.4 Microelectronics ........................................................................................................................ 85 3.4.1 NAFTA: Canada ............................................................................................................... 87 3.4.2 NAFTA: Mexico............................................................................................................... 88 3.4.3 Asia/Pacific: China ........................................................................................................... 89 3.4.4 Asia/Pacific: Taiwan......................................................................................................... 90 3.4.5 Eastern Europe & Russia .................................................................................................. 91
CHAPTER 4: TRANSPORTATION AND LOGISTICS ANALYSIS.................................. 93
4.1 Export Shipments from the Appalachian Region ...................................................................... 93 4.2 Routing and Modes from Appalachia to Ports of Lading.......................................................... 94
4.2.1 Exports by State ................................................................................................................ 95 4.2.2 Major Counties ................................................................................................................. 97 4.2.3 Identifying Routes............................................................................................................. 97 4.2.4 Major Ports ..................................................................................................................... 100 4.2.5 Port Pairings.................................................................................................................... 101
4.3 Transportation by Highway and Other Modes ........................................................................ 103 4.3.1 Highway-Rail Intermodal ............................................................................................... 109 4.3.2 Air ................................................................................................................................... 110
CHAPTER 5: FINDINGS, SUMMARY AND POLICY IMPLICATIONS ....................... 111
5.1 Findings: The Relationship between Firm Location and Export Patterns ............................... 111
5.1.1 Methodology................................................................................................................... 111 5.1.2 Results............................................................................................................................. 111
5.2 Summary and Policy Implications........................................................................................... 113

APPENDIX A: REGIONAL INDUSTRIAL ANALYSIS .................................................... 116
A-1: Review of Regional Production Trends .............................................................. 116 Alabama ........................................................................................................................................... 116 Georgia ........................................................................................................................................... 117 Kentucky ........................................................................................................................................... 117 Maryland ........................................................................................................................................... 118 Mississippi ........................................................................................................................................... 119 New York ........................................................................................................................................... 119 North Carolina ...................................................................................................................................... 120 Ohio ........................................................................................................................................... 121 Pennsylvania ......................................................................................................................................... 121 South Carolina ...................................................................................................................................... 122 Tennessee ........................................................................................................................................... 123 Virginia ........................................................................................................................................... 123 West Virginia ........................................................................................................................................ 124 Appalachian States................................................................................................................................ 125
A-2: Industry Analysis .................................................................................................. 126
Industrial Machinery............................................................................................................................. 126 Lumber and Wood Products ................................................................................................................. 128 Chemicals and Plastics.......................................................................................................................... 130 Automobiles, Auto-parts and Related Products .................................................................................... 133 Furniture, Fixtures and Related Products.............................................................................................. 135 Textiles and Related Products............................................................................................................... 138 Apparel and Related Products............................................................................................................... 141 Environmental Technologies ................................................................................................................ 143 Coal Mining .......................................................................................................................................... 144 Electronic Components ......................................................................................................................... 147 Medical Devices and Surgical Instruments........................................................................................... 147
APPENDIX B: TRADE FLOW MAPS .................................................................................. 149
EXECUTIVE SUMMARY This study assesses the opportunities and challenges posed by trade liberalization to regional producers and exporters of goods and services within the Appalachian Region. Utilizing a number of manufacturing industry clusters for case study research, the study analyzes the export potential of regional manufacturing industries and evaluates the transportation infrastructure needs for expanded trade operations and shipments. The six industry clusters were selected based on findings from prior Appalachian Regional Commission (ARC) studies, analysis of production and trade data, and discussions with representatives of the Export Trade Advisory Council (ETAC). These industry clusters include: auto parts, electronic components, wooden household furniture, upholstered household furniture, food processing machinery and packaging machinery. The study analyzed the overall competitiveness of these clusters based on an analysis of each sectors relative labor costs, labor productivity, capital investment trends, capacity utilization, industrial concentration, regional transactions, and environmental costs as they related to trends in foreign direct investment. In addition, the export potential of each sector was assessed based on regional analyses of world markets. A separate analysis was conducted of the export dynamics in service sector by focusing on the educational services sector in Appalachia. Competitiveness Analyses The competitiveness analyses were conducted based largely on statewide data due to the lack of regionally specific data. As a result, readers should be cautious about the inferences they draw from these results. In terms of relative labor costs, Appalachian states were generally competitive across the six industry case studies, although in the case of the food processing industry, labor costs were higher in three of the Appalachian states. Labor productivity trends were particularly positive in food processing, packaging machinery, auto parts and, to a lesser extent, electronic components. By contrast, labor productivity was relatively weak in upholstered and wooden furniture production. Capital investment trends were generally positive in the electronic components and auto parts sectors, although the lack of consistent data across all states limits the conclusions that can be drawn about the competitive position of these sectors. The upholstered and wooden household furniture industries in a number of Appalachian states had lower gross expenditures on capital investment than the national industry. An industry representative in Pennsylvania cited the increase in the number of domestic firms relocating to foreign countries with lower labor costs as the prime reason for the observed decline in the level of capital investment in the furniture industry within the area. Capacity utilization data is limited to industrial trends for the nation as a whole but the data do show that the two capital goods sectors (food processing and packaging machinery) were the most affected by the business cycle of 2000-2001. As for industrial concentration, the auto parts industry was the most concentrated as measured by the percentage share of shipments by the top four firms. In terms of the percentage of industry inputs and outputs that are purchased and sold within Appalachia, the upholstered household and wood furniture industries are the most integrated industry clusters within the Appalachian region. Over 50 percent of their inputs are purchased from Appalachian establishments, while more than 80 percent of their outputs are sold within Appalachia. According to a furniture industry representative, this trend can be attributed to the industry’s proximity to raw materials and the fact that many of the household furniture establishments in Appalachia are quite specialized and tend to serve specific niche markets within the region. The auto parts and electronic components sectors are the least integrated of the industry clusters, although the supplier links are still relatively strong with nearly 44 percent and 49 percent of intermediate goods purchased regionally. Analysis of the Appalachian states
Appalachian Regional Commission Global Competitiveness of Selected Industries and Clusters in The Appalachian Region
1

environmental regulatory context presents a diverse mix, ranging from positive for larger industrial states, to negative for smaller, less wealthy states.
Services & Exports The Appalachian region higher education network consists of over 250 universities, colleges, and community colleges. The net contribution by international students studying in the states comprising the Appalachian region amounted to $3.6 billion in the 2001 to 2002 academic year all of which translated to a substantial gain by Appalachian higher education institutions and businesses. On average, an international student studying in Appalachia contributed $20,500 to the region, mainly from funds generated in their country of origin. The study highlights best practices in recruiting foreign students by detailing the marketing efforts of eight different types of higher educational institutions within Appalachia to attract students from other countries. Overall, the case study finds significant potential in improving the recruitment of foreign students in the Appalachian Region, particularly by marketing the advantages of the community assets of the smaller towns and cities that host many of these colleges and universities. National policy issues, however, have affected the number of visas being issued nationally for incoming foreign students which has dampened the growth in foreign students enrolling in U.S. colleges and universities and these trends are affecting Appalachian institutions.
Manufacturing & Exports For Appalachian exporters of automotive parts, NAFTA economies (Canada and Mexico) present the largest export market. Established Western European markets (Germany and Sweden), Asia/Pacific (Korea), and Latin American markets (Argentina) also offer good prospects for future growth. For Appalachian wooden household and upholstered furniture manufacturers, NAFTA markets (Canada & Mexico), Germany, Korea, Saudi Arabia, and the United Arab Emirates represent leading export markets. Canada, Mexico, China, Poland, Argentina, Brazil and Thailand are leading markets for Appalachian exports of food processing and packaging machinery. China and Eastern European markets open many dynamic growth opportunities for exporting microelectronic components for Appalachian manufacturers. Asian economies such as Taiwan also offer opportunities for growth in future demand for U.S.-made microelectronics. In the manufacturing industry sector, exports represent over $5 billion annually to Appalachian manufacturers in auto parts, electronic components, food processing machinery, packaging machinery and wood furniture industries. The auto parts industry accounts for more than 65 percent of the value of total exports from Appalachia among the six target industries, followed by electronic components, which account for 30 percent. NAFTA economies (Canada and Mexico) present the largest export market for Appalachian exporters of automotive parts. Established Western European markets (Germany and Sweden), Asia/Pacific (Korea), and the Latin America (Argentina) markets also offer good prospects for future growth. Europe, Canada, and Asia are leading destinations for U.S. exports of food processing machinery and packaging machinery. China and Eastern European markets open many dynamic growth opportunities for exporting microelectronic components for Appalachian manufacturers. Asian economies such as Taiwan also offer opportunities for growth in future demand for U.S.-made microelectronics.
Appalachian Regional Commission Global Competitiveness of Selected Industries and Clusters in The Appalachian Region
2

Detroit MI, New York, NY (the port and JFK Airport) and Miami (the port and Miami International Airport) are the most import ports of export from Appalachia. For Detroit, this is expected in auto parts, but is also among the top four ports for electronic components, packaging machinery, upholstered furniture, and wood furniture. For food processing machinery, Detroit and New York City represent the top two ports and Miami is eighth. The port of Buffalo-Niagara Falls, NY, also is the point of export of significant value of goods in all six industries. New York City and Buffalo-Niagara Falls are the most important ports in states that include Appalachian counties for exporting commodities in the six target industries originating in the Region. Other important ports in ARC states for these six commodities, though the ports are not located in the Appalachian Region, are Charleston SC (electronic components, food processing machinery, packaging machinery, wood furniture), Norfolk VA (auto parts, food processing machinery, wood furniture), Baltimore, MD (auto parts, food processing machinery), Atlanta GA (electronic components) and Champlain-Rousse Point, NY food processing machinery). In addition to the ARC states, exports from Appalachian counties are routed though Texas (Laredo and Dallas-Fort Worth) and Jacksonville, Florida, and to a lesser extent, California (discovered from interviews). Regional Trade Flow: Export of Auto Parts Originating from Alabama (1998)
Michigan New York
Florida
For these six industries, transportation of goods from Appalachia to ports of landing is primarily by truck to seaports and airports for international export. Trucking volume in tonnage ranges from 86 percent of all volume in auto parts to 95 percent in wood and upholstered furniture. Rail transportation is relevant only in the auto parts industry and air transportation is significant when assessing the value of electronic components shipped. Rail is important in the auto parts industry, accounting for 7 percent of tonnage shipped within the United States shipped from states with Appalachian counties (but just 2% of the value shipped from ARC states). If the Appalachian average of 2.4 percent based on value is applicable to products shipped for export as
Appalachian Regional Commission Global Competitiveness of Selected Industries and Clusters in The Appalachian Region
3

well as general commodity flows, then rail is responsible for roughly $87 million of the $3.6 billion of auto parts exported by Appalachian companies. Air transportation is important in the electronic components industry. Nationally over 19 percent of the value in this sector is shipped within the U.S by air. About 4 percent of shipments from ARC states are shipped by air, but more than 28 percent of the value of electronic components report using parcel delivery services (which includes truck and air). If the Appalachian average of 4.1 percent based on value is applicable to products shipped for export as well as general commodity flows, then air transportation accounts for roughly $69 million of the $1.76 billion of electronic components sent to ports by Appalachian companies. In addition, $473 million corresponds to the 28.3 percent of the regional value of electronic components shipped by parcel services, and a portion of these millions is attributable to air cargo.
Relationships Between Firm Location and Export Patterns Based on interviews with manufacturing, trucking, and logistics firms, we developed four working hypotheses regarding the relationship between access to transportation and patterns of exports within the ARC. These hypotheses reflect one of the key findings of the interviews conducted, namely, that firms are more likely to export to those markets more easily reached given the location of the firm. To the extent these hypotheses are true, firms are more likely to report that transportation infrastructure is adequate. Because they focus on foreign markets with easy access, they have little experience and hence we received few reports of difficulties in accessing ports for international sales. Hypothesis 1: Because of the cost and time required to traverse the Appalachian Range, i.e., moving goods east to west in the Appalachian region, export patterns are shaped by whether states lie on the east or west side of the range. That is, we expect different trade patterns for states in the eastern and western portions of the ARC. Hypothesis 2: States in the eastern portion of the ARC will export more to Europe because of easier access to east coast ports. Hypothesis 3: States in the western portion of the ARC will export more within North America because of better direct access to key industrial areas in Canada and Mexico. Hypothesis 4: There will be little difference in eastern and western patterns of exports to Asia. Although the eastern ARC has more direct access to seaports, western ARC firms can more easily access West Coast ports, which have shorter travel times to Asia. Hypothesis 5: Differences in export patterns from Appalachia are minimized with a greater reliance on air transportation. This hypothesis could not be validated by available data.
Methodology To test these hypotheses, recent export data were compiled for selected states lying east and west of the Appalachian Range. The states in the eastern portion (ARC-EAST) include New Jersey, Delaware, Maryland, North Carolina and South Carolina and Virginia. The states in the western portion (ARC-WEST) include New York, Ohio, Kentucky, Tennessee, and West Virginia. Data were gathered on 2002 exports of the following products: Computer and Electronic Products (NAICS 334); Electrical
Appalachian Regional Commission Global Competitiveness of Selected Industries and Clusters in The Appalachian Region
4

Equipment, Appliances, and Components (NAICS 335); Transportation Equipment (NAICS 336); and Furniture and Fixtures (NAICS 337); and for comparison purposes, all manufactured products (NAICS 311-339). Results Data confirms each of the first four hypotheses. As shown in Table 1, export patterns differ significantly between ARC-EAST and ARC-WEST for each of the four sectors, as well as for all manufacturing. This confirms Hypothesis 1. There is also strong evidence for Hypothesis 2. As shown in Table 1, exports to Europe account for a greater proportion of ARC-EAST than ARC-WEST exports for each of the four individual sectors. Across the four sectors, exports to Europe accounted for 31 percent of ARC-EAST but only 22 percent of ARC-WEST exports. This differential is slightly greater than for all manufacturing as a whole, where the respective ratios were 31 percent and 25 percent.
Table 1: Export Patterns from Selected RC region States
(2002) NAICS 334 – Computer & electronic products ARC-EAST ARC-WEST
EUROPE 37 29% % ASIA 31% 28% NAFTA 20 33% % NAICS 335 – Elect. Equip., & components ARC-EAST ARC-WEST
EUROPE 28 24% % ASIA 18% 19% NAFTA 35 45% % NAICS 336 – Transportation Equip. ARC-EAST ARC-WEST EUROPE 43 23% % ASIA 9% 12% NAFTA 32 59% % NAICS 337 – Furniture & fixtures ARC-EAST ARC-WEST EUROPE 18 14% % ASIA 17% 7% NAFTA 36 64% % Average of Sectors 334-337 ARC-EAST ARC-WEST EUROPE 31 22% % ASIA 19% 16% NAFTA 31 50% % ALL MANUFACTURING ARC-EAST ARC-WEST EUROPE 31 25% % ASIA 22% 19% NAFTA 30 44% % Source: MISER. Calculations by EDR Group
The evidence for Hypothesis 3 is very strong. ARC-WEST exports to NAFTA accounted for a much higher proportion of exports in each of the four sectors than in ARC-EAST. On average across the four sectors, exports to NAFTA accounted for 50 percent of all ARC-WEST exports compared to just 31 percent for ARC-EAST. The differences in the four study sectors were greater than in manufacturing as a
Appalachian Regional Commission Global Competitiveness of Selected Industries and Clusters in The Appalachian Region
5

whole. However, the differential was greater even in all manufacturing, where NAFTA accounted for 44 percent of all ARC-WEST but only 30 percent of all ARC-EAST exports. Finally, the data also confirm Hypothesis 4, namely that there would be no large difference in exports to Asia from the two regions. As the data show, exports to Asia accounted for a higher proportion of ARC-EAST than ARC-WEST exports in two sectors (NAICS 334 AND 337), but a lower proportion in the two other sectors (NAICS 335 and 336). Across manufacturing, there was little difference in proportion of total exports shipped to Asia: these exports accounted for 22 percent of all ARC-EAST and 19 percent of all ARC-WEST exports. Relatively little activity is seen in east-west traffic across the Appalachian region for exports from the six target industries. Kennedy Airport in New York and Miami International Airport is much more heavily used than airports in Pittsburgh and Atlanta. Similarly, the ports of Detroit, New York, Buffalo and Miami are used more intensely for exports of commodities from these six industries than the ports of Charleston, Norfolk and Baltimore.
Motor Food Upholstered Wooden
Vehicle Processing Packaging Electronic Household Household
Destination Parts Machinery Machinery Components Furniture Furniture
Africa 0.6% 2.3% 1.4% 0.8% 0.9% 1.3%
Asia 11.1% 20.8% 12.5% 30.2% 18.0% 28.4%
Australia 1.2% 3.2% 3.9% 1.2% 0.9% 0.5%
Canada 65.6% 20.6% 26.1% 25.6% 48.9% 42.6%
Central America 0.2% 3.3% 3.1% 1.4% 3.4% 7.0%
Europe 10.3% 32.1% 38.1% 25.7% 22.3% 15.3%
Mexico 9.5% 8.5% 9.3% 9.9% 3.4% 3.0%
South America 1.5% 9.3% 5.6% 5.1% 2.2% 1.8%
Appalachian Exports by Industry and Destination(Percent of Appalachian Industry Exports)
Companies are located in places from where they can cost-effectively move products to ports that, in turn, can transport these commodities to desired international destinations. Access to various ports is hindered by gaps in the ADHS because the gaps increase time to key interstate routes. Companies prefer to ship though built-up ports which are easily accessible through the federal interstate system, and gaps in the ADHS system hinders access to ports (or effectively reduces cost-effective choices when considering which ports to use). As location is in part chosen by existing access considerations, gaps along ADHS corridors influence business location. Easy and cost effective connections to interstate highways, or the lack of the same, influence where firms locate and the economic development of Appalachian counties.
Appalachian Regional Commission Global Competitiveness of Selected Industries and Clusters in The Appalachian Region
6

Summary & Policy Implications Analysis and interviews with Appalachian companies have revealed two self-evident truths: first, the Interstate Highway System works, as it connects the ARC region with major northeast and Florida ship ports and airports; and second, companies prefer to ship though built-up ports which are easily accessible through the existing highway system at their current location. Very little activity is seen in east-west traffic across the Appalachian region for exports from these six industries. Kennedy Airport in New York and Miami International Airport in Florida are much more heavily used than airports in Pittsburgh and Atlanta. Similarly, the ports of Detroit, New York, Buffalo and Miami are used more intensely for exports of commodities from these six industries than the ports of Charleston, Norfolk and Baltimore. Roadways are by far the most important transportation facilities in the ARC region for the six target commodities. The importance of the Appalachian Development Highway System (ADHS) is fostering connections to Interstate Highways that in turn are connected to major ports of lading for the target industries. Secondarily, ADHS provides access to smaller airports in areas that produce a disproportionate amount of Appalachia’s electronic components. Sixteen ADHS corridors important to international trade in the target industries are in various states of partial completion. Thirteen of these corridors provide connections to interstate highways, which, in turn, connect Appalachia to key ports for export of the target commodities. If trade was the sole criterion for setting priorities among these corridors (and of course it is not) then ARC would need to decide if its priority is to reinforce existing use of ports and strengthen ADHS roadway connections to Florida, Michigan and New York, or encourage use of ports in ARC states, such as Charleston, Baltimore and the Pittsburgh Airport. In general, the national transportation system serves the region by providing access to external markets and supplies. However, there is some evidence that improving access to the national network through completion of key links in the ADHS would provide additional opportunities in the six industries studied in this research for expanded output and production locations. Such expansion of opportunities could lead to additional employment and a further distribution of economic development within the region. Discussions with the target industries in the region indicated that development patterns and logistics planning were influenced by the quality and availability of the transportation network. Manufacturers sought to reduce total logistics costs by selecting production locations with good network access, utilizing intermodal connections when available and cost effective, and by taking advantage of international markets. ARC can contribute to this market expansion by identifying and alleviating constraints in the transportation network and by improving the highway, rail and waterway transportation systems.
Appalachian Regional Commission Global Competitiveness of Selected Industries and Clusters in The Appalachian Region
7

CHAPTER 1: INTRODUCTION This study assesses the opportunities and challenges posed by trade liberalization to regional producers and exporters of goods and services within the Appalachian region. The study provides the industry and geographical detail for analyzing the export potential of regional industries. The study also evaluates the transportation infrastructure needs for expanded trade operations and shipments. In carrying out these analyses, the study focused on the specification of appropriate industry categories and geographies within the Appalachian region. We then pulled together literature and data sources relevant to that level of industry and combined it with a trade and transportation analysis framework. The initial set of manufacturing industry sectors considered include: lumber and wood products, household furnishings, and arts and crafts; industrial machinery; automobiles and auto parts; electronic components; medical instruments and supplies; plastics products; textiles, apparel and knitting mills; environmental products and services coal and mining equipment. The only service industry considered is the educational services industry. The final report is organized and written with the aim of providing policy makers and local economic development practitioners with information on potential opportunities and challenges for the global competitiveness of key industry clusters. Section two identifies key manufacturing and service industry clusters within the Appalachian region. Based on findings from prior ARC studies, discussions with representatives of the Export Trade Advisory Council (ETAC) and the analysis of production and trade data, we narrowed the number of industry clusters to evaluate in detail to six key manufacturing industry clusters. These include the following: the auto parts industry, the electronic components industry, the wooden household furniture industry, the upholstered household furniture industry, and the food processing machinery and packaging machinery industries. For the services industry, we focused on the educational services industry by highlighting Best Practices in International Student Programs within Higher Education Institutions in Appalachia. The analysis details the marketing efforts of eight different types of higher educational institutions within Appalachia to attract students from other countries. It also summarizes some of the approaches that have been implemented by other institutions. Section three identifies and evaluates potential markets in terms of growth, accessibility, and market prices. The identification of these markets were obtained primarily through interviews with business and economic experts familiar with the respective industry sectors. Section four consists of a transportation and logistics analysis. In this section we analyze the transportation trade flows between production centers and markets. For each geographic sub-region we noted the primary markets served and the transportation means used to deliver the products. This includes identifying the points of export (and associated export volume) used for each commodity, as well as a breakdown of the inland transportation nodes used to deliver products from production centers to U.S. export points. For comparison purposes, we also tabulate each port’s share of U.S. exports to a given market. In the fifth and final section, we summarize and present the key findings of the study.
Appalachian Regional Commission 8 Global Competitiveness of Selected Industries and Clusters in The Appalachian Region

CHAPTER 2: INDUSTRIAL ANALYSIS Chapter Two is divided into two major parts: the manufacturing industry analysis section and the services industry analysis section.
2A Manufacturing Industry Analysis The main purpose of the first section is to discuss key Appalachian manufacturing industry clusters with strong export potentials. In selecting the key industry clusters, the project team examined broad segments of the Appalachian economy including 12 major industry groups. Variables considered include, but are not limited to industry size, production value, employment, growth rates and export trends. The following are the initial set of 12 industry cluster candidates considered:
• Industrial Machinery • Lumber and Wood Products • Plastics Parts and Chemicals • Auto-parts and Related Products • Furniture and Related Products • Electronic Components • Textiles and Related Products • Apparel and Related Products • Environmental Technologies • Medical Equipments • Communications Services • Coal
More detailed discussions on the 12 industry groups can be found in Appendix A. Instead of focusing on all of these industry clusters, the ARC and the project team recognized the need to focus on a select group of industries with current or future prospects for growth in exports. In order to identify the Appalachian industry clusters with the strongest export potential, we analyzed a number of factors that influenced the overall health and competitiveness of an industry cluster. The factors are:
• Location and geographic distribution of the industries; • Current industry size and future growth potential; • Nature of the industry i.e. is it a traditional/mature sector or an emerging technology sector; • Export intensity; • Growth in foreign demand; • Competitive pressures; • Current trade relations; and • State/Federal initiatives (export promotion for targeted industries).
In addition to the factors listed above, extensive contributions and participation from industry representatives, and members of the Appalachian region’s Export Trade Advisory Council, provided necessary information on which the project team based its selection of six Appalachian export industry clusters. These six industries are well distributed within the region and are well positioned to become even more significant components in the region’s economy if the region takes advantage of the export
Appalachian Regional Commission 9 Global Competitiveness of Selected Industries and Clusters in The Appalachian Region

potential. These six industries will serve as the focal point for assessing the export potential of regional industry clusters in later sections of the study. The six industry clusters are:
• Electronic Components (SIC 3675, 3676, 3677, 3678, 3679) • Food Processing Machinery (SIC 3356) • Packaging Machinery (SIC 3565) • Wooden Household Furniture (SIC 2511) • Upholstered Household Furniture (SIC 2512) • Auto Parts (SIC 3714)
(SIC stands for Standard Industrial Classification) The rest of this section will be devoted to examining these six key industries in greater detail. The main issues to be addressed within these industries include:
• Geographic concentration; • Labor costs; • Labor productivity; • Capital investment; • Capacity utilization; • Industry concentration; • Regional transactions; • Economic impact multipliers; and • Regulatory issues.
2.1 Geographic Concentration
Employment Employment data by county for the year 2000 were obtained from the Minnesota IMPLAN Group's (MIG) regional input-output modeling system. To develop the data, MIG consolidates data from a wide variety of government sources and then applies proprietary algorithms to estimate points that are missing or are withheld for disclosure reasons. Geographic distributions of these data are reproduced visually in the following maps of Appalachian counties. The maps show where production centers are concentrated which will correlate to some extent with export movement origins. The maps can also be used to identify county gaps within, between, or around these clusters which may be able to take advantage of existing transportation and logistics infrastructure/services if production were to be stimulated.
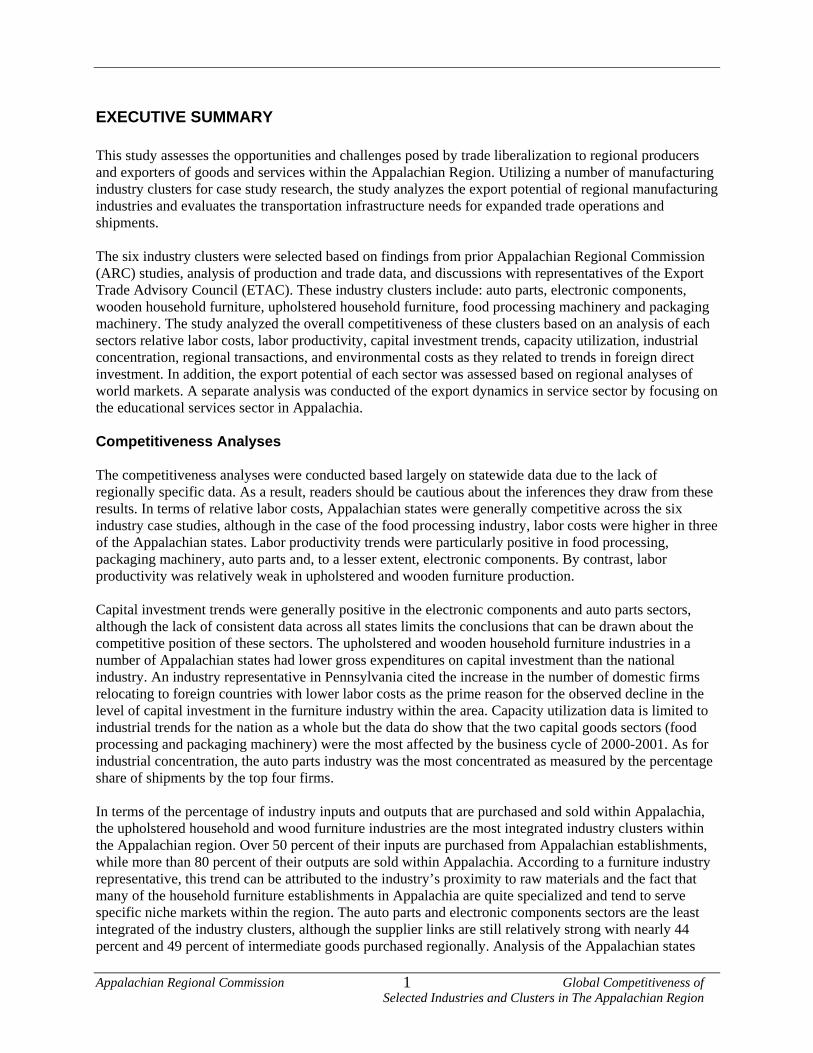
2.1.1 Electronic Components As shown in Exhibit 2-1, production of electronic components is concentrated in the northern and southern regions of Appalachia, with some production also taking place in the central region. Three large clusters can be distinguished: one comprising the production locations in Pennsylvania and New York, one comprising production locations in Tennessee, North Carolina, and South Carolina; and one comprising production locations in Alabama. The northern cluster is the largest and most successful of these clusters.
Appalachian Regional Commission Global Competitiveness of Selected Industries and Clusters in The Appalachian Region
10
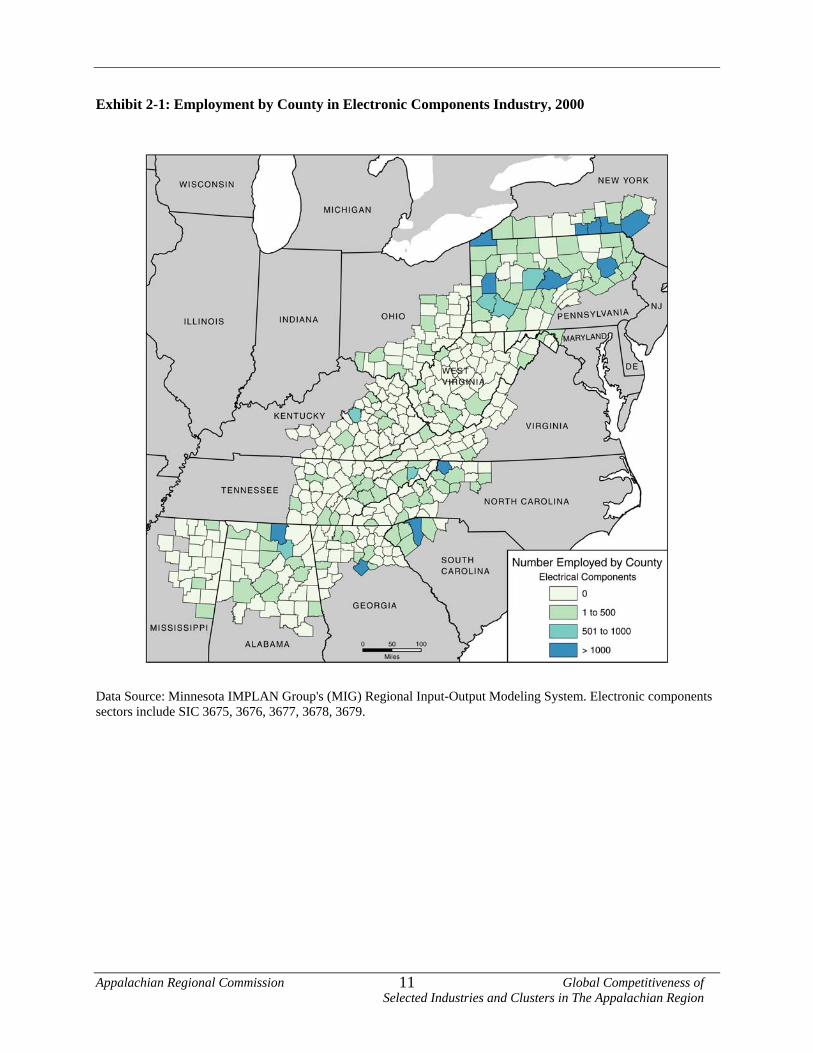
Exhibit 2-1: Employment by County in Electronic Components Industry, 2000
Data Source: Minnesota IMPLAN Group's (MIG) Regional Input-Output Modeling System. Electronic components sectors include SIC 3675, 3676, 3677, 3678, 3679.
Appalachian Regional Commission Global Competitiveness of Selected Industries and Clusters in The Appalachian Region
11
2.1.2 Auto Parts As depicted in Exhibit 2-2, the production of auto parts is widespread in the northern, central and southern regions of Appalachia. The largest concentrations occur in Appalachian counties within the central and southern regions. This includes the states of Alabama, Georgia, Tennessee, North Carolina, South Carolina, Kentucky, Virginia and Southern Ohio. A smaller cluster is distributed within northern Appalachia in the states of Ohio, Pennsylvania and New York. Exhibit 2-2: Employment by County in Automotive Parts Industry, 2000
Data Source: Minnesota IMPLAN Group's (MIG) Regional Input-Output Modeling System. Auto parts data from SIC 3714.
Appalachian Regional Commission 12 Global Competitiveness of Selected Industries and Clusters in The Appalachian Region

2.1.3 Machinery Exhibits 2-3 and 2-4 show that the production of food processing machinery and packaging machinery takes place in New York, Pennsylvania and Ohio, and along a corridor between southern Virginia and Alabama. Both clusters are fairly large, unevenly distributed and contain small pockets where production takes place.
Exhibit 2-3: Employment by County in Food Processing Machinery Industry, 2000
Data Source: Minnesota IMPLAN Group's (MIG) Regional Input-Output Modeling System. Food Processing Machinery Industry data from SIC 3556.
Appalachian Regional Commission 13 Global Competitiveness of Selected Industries and Clusters in The Appalachian Region

Exhibit 2-4: Employment by County in Packaging Machinery Industry, 2000
Data Source: Minnesota IMPLAN Group's (MIG) Regional Input-Output Modeling System. Packaging Machinery Industry data from SIC 3565.
Appalachian Regional Commission 14 Global Competitiveness of Selected Industries and Clusters in The Appalachian Region

2.1.4 Household Furniture As shown in Exhibit 2-5, production of upholstered household furniture is concentrated in the northern and southern regions of Appalachia, with little production taking place in the central region. Three large clusters can be distinguished: one comprising the production locations in Mississippi and Alabama, one comprising production locations in Tennessee, North Carolina, Georgia, South Carolina, Kentucky, and Virginia; and one comprising production locations in Pennsylvania, New York and Ohio. Exhibit 2-5: Employment by County in Upholstered Household Furniture Industry, 2000
Data Source: Minnesota IMPLAN Group's (MIG) Regional Input-Output Modeling System. Upholstered Furniture Industry data from SIC 2512.
Appalachian Regional Commission Global Competitiveness of Selected Industries and Clusters in The Appalachian Region
15

The geographic distribution of wooden household furniture is somewhat similar to that of upholstered household furniture. Exhibit 2-6 reveals three large production clusters, two in the southern region and one in the northern region. Exhibit 2-6: Employment by County in Wooden Household Furniture Industry, 2000
Source: Minnesota IMPLAN Group's (MIG) Regional Input-Output Modeling System. Wood furniture industry data from SIC 2511.
Appalachian Regional Commission Global Competitiveness of Selected Industries and Clusters in The Appalachian Region
16

2.2 Labor Costs Labor costs can be defined as the expenses on worker compensation and benefits. It is usually the single largest component of production costs. The cost of labor as a percentage of shipments refers to the share of labor costs in the value of produced goods. Appalachian industry clusters with higher labor costs as a percentage of shipments may be faced with higher production costs, lower profits, and pressure to raise prices. This directly affects their local and foreign competitiveness. Table 2-1 compares the share of labor costs as a percentage of shipments in Appalachian states to that of the entire U.S. A ratio greater than one suggests that local industry labor costs are higher than the national average. Table 2-1. Labor Costs
Food Motor Upholstered Wooden
Processing Packaging Electronic Vehicle Household Household
State Machinery Machinery Components Parts Furniture Furniture
labama 1.59 1.83 0.66 0.94 NA 0.92
eorgia 0.81 0.76 0.75 0.67 0.86 0.75
entucky NA 0.98 0.87 0.54 1.01 1.13
aryland NA 1.20 1.43 NA 0.99 1.26
ississippi NA NA 0.50 0.55 1.01 0.64
ew York 0.91 0.99 0.86 0.74 1.38 1.03
orth Carolina 1.23 1.08 0.57 0.58 1.00 1.07
o 0.91 1.03 0.71 0.73 1.25 0.71
nnsylvania 1.21 0.82 0.54 0.86 1.07 1.14
outh Carolina NA 0.96 0.97 0.52 NA 0.90
ennessee NA NA 0.84 0.57 1.06 1.13
irginia 1.05 1.23 1.02 0.63 0.95 1.05
est Virginia NA NA NA 0.78 NA 1.02
S 1.00 1.00 1.00 1.00 1.00 1.00
Cost of Labor as a Percentage of Shipments
(Ratio of State Shares to US Shares)
A
G
K
M
M
N
N
Ohi
Pe
S
T
V
W USource: U.S. Census Bureau, Department of Commerce. Calculations by JFA. The food processing machinery and packaging machinery industries had the highest incidence of relatively higher local labor costs. For the food processing machinery industry, labor costs were particularly higher than the national average in Alabama, North Carolina and South Carolina. In Alabama for example, labor costs were 59 percent higher than the food processing machinery industry’s national average. While in North Carolina it was 23 percent higher than the national average. One factor underlying this observed trend is the effect of relatively high hourly wages. Table 2-2 compares the hourly wages of Appalachian production workers to the national average. Hourly wages in the food processing machinery industry in Alabama was 32 percent higher than the national average. In North Carolina, hourly wages in the food processing machinery industry were 74 percent higher than the national average.
Appalachian Regional Commission Global Competitiveness of Selected Industries and Clusters in The Appalachian Region
17

Table 2-2. Hourly Wages
Food Motor Upholstered Wooden
Processing Packaging Electronic Vehicle Household Household
State Machinery Machinery Components Parts Furniture Furniture
labama 1.32 1.36 1.24 2.39 NA 0.76
eorgia 1.64 1.57 1.01 1.25 0.81 0.89
entucky NA 1.92 0.95 1.33 0.77 0.93
aryland NA 1.81 1.15 NA 1.24 0.95
ississippi NA NA 0.84 1.14 1.15 0.70
ew York 1.63 1.46 1.27 2.33 1.29 1.15
orth Carolina 1.74 1.57 1.41 1.44 1.15 1.04
hio 1.46 1.42 1.28 2.08 1.40 0.94
nnsylvania 1.41 1.70 1.41 1.77 1.10 1.04
outh Carolina NA 2.08 1.27 1.33 NA 0.97
ennessee NA NA 1.24 1.37 1.03 0.97
irginia 1.44 1.62 1.64 1.40 0.95 0.92
est Virginia NA NA NA 1.52 NA 0.94
S 1.00 1.00 1.00 1.00 1.00 1.00
(Ratio of Average State Wage to US Average Wage)
Hourly Wages for Production Workers
A
G
K
M
M
N
N
O
Pe
S
T
V
W
Source: U.S. Census Bureau, Department of Commerce. Calculations by JFA. U
The auto parts industry is the only Appalachian industry where labor costs were lower than the national average despite much higher local hourly wages. To explain this observed trend, we would have to consider the effect of labor productivity. Differences in labor productivity are a key determinant of wage differences between regional industry clusters. A higher level of labor productivity would explain why despite higher hourly wages, labor costs still accounted for a lower share of auto parts industry shipments when compared to the national average. The wooden household furniture industry in most Appalachian states had relatively lower labor costs than the national average. This trend can also be partly explained by the fact that hourly wages in most of Appalachia’s wooden household furniture industries were much lower than the national average.
2.3 Labor Productivity Labor productivity measures the quantity of output produced for a given hour of labor input. For a particular industry within Appalachia or the U.S., labor productivity is the output per person employed in that industry. Table 2-3 compares average state productivity to average national productivity for select industries. A ratio higher than one implies that labor productivity in the state industry is higher than the national industry. A ratio lower than one would suggest that the local industry is less productive. These ratios have important ramifications for Appalachian industry clusters because productivity gains are the main determinants of improvements in material standard of living. More productive workers and/or regions tend to command higher wages and salaries than less productive workers/regions.
Appalachian Regional Commission 18 Global Competitiveness of Selected Industries and Clusters in The Appalachian Region

Table 2-3. Labor Productivity
Food Motor Upholstered Wooden
Processing Packaging Electronic Vehicle Household Household
State Machinery Machinery Components Parts Furniture Furniture
labama 1.12 1.09 1.83 2.19 NA 0.74
eorgia 3.21 5.48 1.95 1.68 0.73 1.05
entucky NA 3.70 1.53 2.05 0.65 0.84
aryland NA 1.87 1.38 NA 1.11 0.93
ississippi NA NA 1.44 1.64 1.02 1.11
ew York 2.75 2.87 2.30 2.34 0.91 1.50
orth Carolina 1.90 2.27 3.53 2.52 1.08 0.99
o 2.98 3.47 2.23 2.03 1.37 1.96
ennsylvania 1.96 3.99 5.07 2.18 1.01 1.01
outh Carolina NA 3.16 1.75 2.42 NA 0.93
ennessee NA NA 1.79 2.10 0.97 0.78
rginia 1.72 ? 2.46 2.03 0.94 0.86
est Virginia NA NA NA 1.71 NA 0.92
S 1.00 1.00 1.00 1.00 1.00 1.00
Labor Productivity: Dollars of Value Added Per Production Worker Hour
(Ratio of Average State Productivity to US Average Productivity)
A
G
K
M
M
N
N
Ohi
P
S
T
Vi
W
Source: U.S. Census Bureau, Department of Commerce. Calculations by JFA. U
Labor productivity in a number of Appalachian states’ wooden household furniture industries was much lower than the national average. Wooden household furniture industries in Alabama, Kentucky, Tennessee and Virginia recorded particularly lower levels of labor productivity. Since hourly wages tend to equate labor productivity under competitive conditions, it is not surprising that the wooden household furniture industry in Appalachia had lower hourly wages than the national average (see Table 2-3 above). Lower labor and consequently production costs help the furniture industry’s competitiveness in the short-run. However, in order to compete effectively in the long run and especially in foreign markets with much lower labor costs, Appalachian states with lower labor productivities than the national average would need to improve on the productivity of their laborers. Appalachian state industries such as food processing machinery, packaging machinery, auto parts and electronic components were earlier observed to have higher hourly wages and labor costs than the national average. These industries also have higher levels of labor productivity than their national counterparts. A good example cited earlier is the auto parts industry. For each Appalachian state, labor productivity in the auto parts industry exceeded the national average. Since differences in labor productivity are a key determinant of wage differences between industries, the higher level of labor productivity explains why labor costs and hourly wages were higher in these industries. Advances in technology and improvements in education and training are key factors that affect labor productivity. Given the technology intensive nature of the food processing machinery, packaging machinery, auto parts and electronic components industries, Appalachian states could further enhance labor productivity by investing more in training and new technologies.
Appalachian Regional Commission Global Competitiveness of Selected Industries and Clusters in The Appalachian Region
19

2.4 Capital Investment Capital investment measures additions to an industry’s fixed productive assets. Table 2-4 compares capital investment by Appalachian states to the national average. A ratio higher than one suggests a higher level of capital investment by the state industry while a ratio lower than one suggests that the state industry is lagging behind the national industry in capital investments. Increases in capital investment tend to enhance labor productivity, lower production costs and improve the industry’s overall level of competitiveness. Table 2-4. Capital Investment
Food Motor Upholstered Wooden
Processing Packaging Electronic Vehicle Household Household
State Machinery Machinery Components Parts Furniture Furniture
labama 1.08 0.92 1.51 1.60 NA 0.81
eorgia 1.65 0.56 NA 2.02 0.98 0.70
entucky NA 0.77 NA NA 0.94 0.78
aryland NA 1.45 4.20 NA 0.29 1.13
ississippi NA NA NA 0.88 0.37 0.93
ew York 0.57 0.93 1.49 1.40 0.71 2.49
orth Carolina 0.95 0.57 1.43 1.51 0.51 0.72
hio 1.23 1.11 2.26 2.43 NA 1.45
ennsylvania NA 0.61 1.77 1.63 0.49 1.00
uth Carolina NA 1.52 2.65 1.80 NA 0.73
ennessee NA NA 1.70 1.86 0.67 0.74
irginia 1.46 1.29 13.10 1.86 0.51 1.23
est Virginia NA NA NA NA NA 1.23
S 1.00 1.00 1.00 1.00 1.00 1.00
Capital Investment: Dollars of Investment Per Dollar of Output
(Ratio of State Investment Share to US Investment Share)
A
G
K
M
M
N
N
O
P
So
T
V
W U
Source: U.S. Census Bureau, Department of Commerce. Calculations by JFA. Capital investment in the electronic components and auto parts industries exceeded the national average in most Appalachian states. For example, in Virginia, capital investment in the electronic components industry was 13 times greater than the national average. With the exception of Mississippi, capital investment in the auto parts industry was anywhere from 40 percent to more than 100 percent higher than the national average. The electronic components industry in some Appalachian states is backed by a strong research and development base which includes a number of federal and state funded research and development facilities. The higher level of capital investment enhances the productivity of these industries in Appalachia and their level of competitiveness. The upholstered and wooden household furniture industries in a number of Appalachian states had lower gross expenditures on capital investment than the national industry. An industry representative with the Alleghany Hardwoods Utilization Group in Pennsylvania cited the increase in the number of domestic firms relocating to foreign countries with lower labor costs as the prime reason for the observed decline in the level of capital investment in the furniture industry within the area.
Appalachian Regional Commission Global Competitiveness of Selected Industries and Clusters in The Appalachian Region
20

2.5 Capacity Utilization Table 2-5 and the subsequent graphs show trends in capacity utilization for the selected industries. The data are not available at the regional level and are therefore reported only for the entire U.S. The figures reflect the percentage of full production that is currently being produced. As such, they are used for a number of purposes: to denote the amount of slack in the economy, to forecast changes in investment, to reflect the amount of demand relative to supply, and to serve as an indicator for changes in inflation or deflation. Although measurement difficulties lessen the usefulness of a single figure, the trends in the statistics are valuable for assessing changes in an industry or the economy over time. Declines in utilization can be brought about by a number of things, including reduced demand, increased foreign competition, and technological change. Increases can result from output expansions or the demise of marginal firms. Many economists consider a capacity utilization rate of 84 percent to be a threshold value, and rates above that are believed to be associated with inflationary risks. As can be seen, many of the selected industries were above or close to that threshold in the early to mid 1990s. In the year 2000, only upholstered furniture and electronic components had values above 80 percent, with the rate for electronic components falling precipitously the following year in 2001. It can also be seen that the selected industries tend to follow the same trend exhibited for the entire manufacturing sector. This observation is corroborated in the following table which quantifies and compares the trends in the utilization ratios over time.1 It is important to note the relatively sharp declines seen in the food processing machinery industry and the packaging machinery industry. As industries that produce capital investment goods, both are relatively more sensitive to economic downturns when cash flow is tight in industries that use their products. Table 2-5. Capacity Utilization for Selected Appalachian Industries
Trend-line Statistics for Capacity Utilization Ratios Average Ratio
Industry
Beta
R2 1991-2001 1999-2001 Food Processing Machinery -1.9 0.85 73.6 67.0 Packaging Machinery -2.69 0.94 75.5 63.0 Electronic Components -1.03 0.19 77.1 73.0 Motor Vehicle Parts -0.52 0.25 78.1 75.7 Upholstered Household Furniture -0.88 0.42 82.4 80.7 Wooden Household Furniture -1.33 0.56 79.1 73.3 Total Manufacturing -1.05 0.65 74.1 69.7
Source: Survey of Plant Capacity Current Industrial Reports, U.S. Census Bureau.
1 The beta coefficients associated with the slopes of all of the respective linear trend lines are negative. Capacity utilization rates for food processing machinery, packaging machinery and wooden household furniture declined faster over the period than what was seen for total manufacturing, while the rates of the other selected industries declined at a relatively slower pace. With the exception of wooden household furniture, the R2 values reveal a similar finding.
Appalachian Regional Commission Global Competitiveness of Selected Industries and Clusters in The Appalachian Region
21

Capacity UtilizationHousehold Furniture: Wooden
0
10
20
30
40
50
60
70
80
90
100
1991 1992 1993 1994 1995 1996 1997 1998 1999 2000 2001
Wooden Household Furniture Manufacturing
Capacity UtilizationHousehold Furniture: Upholstered
0
10
20
30
40
50
60
70
80
90
100
1991 1992 1993 1994 1995 1996 1997 1998 1999 2000 2001
Upholstered Household Furniture Manufacturing
Capacity UtilizationAutomotive Parts
0
10
20
30
40
50
60
70
80
90
100
1991 1992 1993 1994 1995 1996 1997 1998 1999 2000 2001
Motor Vehicle Parts Manufacturing
Capacity UtilizationElectronic Components
0
10
20
30
40
50
60
70
80
90
100
1991 1992 1993 1994 1995 1996 1997 1998 1999 2000 2001
Electronic Components Manufacturing
Capacity UtilizationFood Processing Machinery
0
10
20
30
40
50
60
70
80
90
100
1991 1992 1993 1994 1995 1996 1997 1998 1999 2000 2001
Food Processing Machinery Manufacturing
Capacity UtilizationPackaging Machinery
0
10
20
30
40
50
60
70
80
90
100
1991 1992 1993 1994 1995 1996 1997 1998 1999 2000 2001
Packaging Machinery Manufacturing
Appalachian Regional Commission 22 Global Competitiveness of Selected Industries and Clusters in The Appalachian Region

2.6 Industry Concentration The Herfindahl-Hirschman Index (HHI) provides a good assessment of industry concentration. In measuring the level of concentration, the HHI uses the market shares of all firms in the industry but places more weight on the larger firms. Table 2-6 presents the industry concentration ratios for select Appalachian industry clusters. Within Appalachia, of the six industry clusters considered, the auto vehicle parts industry had the highest HHI (659). Of the 4,767 firms in the auto parts industry, the four largest auto parts companies accounted for more than 41 percent of auto parts shipments. The largest fifty firms represent a little over one percent of the total number in the industry. Yet, they account for more than 70 percent of total auto parts industry shipments. Table 2-6. Industry Concentration
Herfindahl-Herschmann
Number of Index for 50
Industry Companies 4 8 20 50 Largest Companies
Food Processing Machinery 573 19.1% 27.1% 41.0% 60.0% 140
Packaging Machinery 644 16.6% 26.2% 44.3% 63.1% 145
Electronic Components 5,652 34.3% 42.8% 54.2% 65.5% 414
Motor Vehicle Parts 4,767 41.6% 49.3% 61.0% 70.7% 659
Upholstered Household Furniture 1,566 31.5% 39.1% 53.7% 68.7% 301
Wooden Household Furniture 3,677 25.7% 36.5% 50.5% 64.3% 238
Largest Comp
(Percent)
Industry Concentration
Value of Shipments Accounted for by the 4, 8, 20, and 50
Source: U.S. Census Bureau, Department of Commerce. Calculations by JFA. The high tech electronic components industry cluster also recorded a relatively high HHI, with the four largest firms accounting for over 34 percent of total industry shipments. For each industry, Tables 2-7 to 2-12 present more information on establishment sizes by number of employees.
Appalachian Regional Commission Global Competitiveness of Selected Industries and Clusters in The Appalachian Region
23

Table 2-7. Establishment Size: Electronic Components
Total
State Establishments <100 100-499 500+
Alabama 57 78.95% 17.54% 3.51%
Georgia 53 84.91% 11.32% 3.77%
Kentucky 23 73.91% 26.09% 0.00%
Maryland 63 90.48% 9.52% 0.00%
Mississippi 11 72.73% 18.18% 9.09%
New York 286 81.47% 15.38% 3.15%
North Carolina 116 68.97% 23.28% 7.76%
Ohio 169 85.80% 11.83% 2.37%
Pennsylvania 279 80.29% 14.70% 5.02%
South Carolina 30 50.00% 36.67% 13.33%
Tennessee 39 79.49% 17.95% 2.56%
Virginia 72 72.22% 23.61% 4.17%
West Virginia 5 80.00% 20.00% 0.00%
United States 5,973 80.76% 15.37% 3.87%
Distribution of Establishments by Size Class: Electronic Components
Percent of Establishments by Number of Employees
Source: U.S. Census Bureau, Department of Commerce.
Table 2-8. Establishment Size: Motor Vehicle Parts
Total
State Establishments <100 100-499 500+
Alabama 73 73.97% 21.92% 4.11%
Georgia 109 73.39% 22.94% 3.67%
Kentucky 132 43.94% 46.21% 9.85%
Maryland 36 80.56% 19.44% 0.00%
Mississippi 52 53.85% 36.54% 9.62%
New York 185 84.86% 9.19% 5.95%
North Carolina 148 68.92% 22.97% 8.11%
Ohio 462 60.61% 29.65% 9.74%
Pennsylvania 160 80.00% 16.25% 3.75%
South Carolina 90 48.89% 40.00% 11.11%
Tennessee 172 62.79% 27.33% 9.88%
Virginia 77 67.53% 25.97% 6.49%
West Virginia 12 58.33% 25.00% 16.67%
United States 5,526 73.56% 20.68% 5.75%
Percent of Establishments by Number of Employees
Distribution of Establishments by Size Class: Motor Vehicle Parts
Source: U.S. Census Bureau, Department of Commerce.
Appalachian Regional Commission Global Competitiveness of Selected Industries and Clusters in The Appalachian Region
24

Table 2-9. Establishment Size: Food Processing Machinery
Source: U.S. Census Bureau, Department of Commerce.
Total
State Establishments <50 50-99 100+
Alabama 1 100.00% 0.00% 0.00%
Georgia 21 76.19% 4.76% 19.05%
Kentucky 5 60.00% 0.00% 40.00%
Maryland 6 100.00% 0.00% 0.00%
Mississippi 3 66.67% 33.33% 0.00%
New York 29 93.10% 6.90% 0.00%
North Carolina 11 36.36% 36.36% 27.27%
Ohio 26 73.08% 3.85% 23.08%
Pennsylvania 18 88.89% 5.56% 5.56%
South Carolina 3 100.00% 0.00% 0.00%
Tennessee 5 100.00% 0.00% 0.00%
Virginia 9 66.67% 22.22% 11.11%
West Virginia 0 NA NA NA
United States 577 82.84% 9.36% 7.80%
Distribution of Establishments by Size Class: Food Processing Machinery
Percent of Establishments by Number of Employees
Table 2-10. Establishment Size: Packaging Machinery
Total
State Establishments <50 50-99 100+
Alabama 7 71.43% 14.29% 14.29%
Georgia 19 84.21% 5.26% 10.53%
Kentucky 7 42.86% 14.29% 42.86%
Maryland 6 66.67% 16.67% 16.67%
Mississippi 1 100.00% 0.00% 0.00%
New York 30 80.00% 13.33% 6.67%
North Carolina 20 85.00% 15.00% 0.00%
Ohio 40 75.00% 10.00% 15.00%
Pennsylvania 36 75.00% 16.67% 8.33%
South Carolina 5 40.00% 20.00% 40.00%
Tennessee 3 100.00% 0.00% 0.00%
Virginia 7 42.86% 28.57% 28.57%
West Virginia 1 100.00% 0.00% 0.00%
United States 643 77.29% 12.91% 9.80%
Distribution of Establishments by Size Class: Packaging Machinery
Percent of Establishments by Number of Employees
Source: U.S. Census Bureau, Department of Commerce.
Appalachian Regional Commission Global Competitiveness of Selected Industries and Clusters in The Appalachian Region
25

Table 2-11. Establishment Size: Upholstered Household Furniture
Total
State Establishments <50 50-99 100+
Alabama 16 87.50% 0.00% 12.50%
Georgia 37 89.19% 2.70% 8.11%
Kentucky 11 81.82% 0.00% 18.18%
Maryland 7 71.43% 14.29% 14.29%
Mississippi 103 50.49% 8.74% 40.78%
New York 82 97.56% 1.22% 1.22%
North Carolina 266 57.52% 14.29% 28.20%
Ohio 36 88.89% 5.56% 5.56%
Pennsylvania 56 92.86% 0.00% 7.14%
South Carolina 13 92.31% 0.00% 7.69%
Tennessee 45 66.67% 17.78% 15.56%
Virginia 27 74.07% 3.70% 22.22%
West Virginia 0 NA NA NA
United States 1,585 80.44% 6.69% 12.87%
Distribution of Establishments by Size Class: Upholstered Household Furniture
Percent of Establishments by Number of Employees
Source: U.S. Census Bureau, Department of Commerce.
Table 2-12. Establishment Size: Wooden Household Furniture
Total
State Establishments <50 50-99 100+
Alabama 65 78.46% 13.85% 7.69%
Georgia 90 90.00% 5.56% 4.44%
Kentucky 38 92.11% 5.26% 2.63%
Maryland 46 91.30% 4.35% 4.35%
Mississippi 34 85.29% 2.94% 11.76%
New York 252 90.08% 5.56% 4.37%
North Carolina 212 69.81% 5.19% 25.00%
Ohio 153 97.39% 0.65% 1.96%
Pennsylvania 193 93.26% 4.66% 2.07%
South Carolina 35 88.57% 0.00% 11.43%
Tennessee 78 82.05% 5.13% 12.82%
Virginia 109 70.64% 4.59% 24.77%
West Virginia 11 90.91% 0.00% 9.09%
United States 3,913 89.83% 4.27% 5.90%
Distribution of Establishments by Size Class: Wooden Household Furniture
Percent of Establishments by Number of Employees
Source: U.S. Census Bureau, Department of Commerce.
Appalachian Regional Commission Global Competitiveness of Selected Industries and Clusters in The Appalachian Region
26

2.7 Regional Transactions Table 2-13 shows the percentage of industry inputs and outputs that are purchased and sold within Appalachia. The upholstered household and wood furniture industries are the most integrated industry clusters within the Appalachian region. Over 50 percent of their inputs are purchased from Appalachian establishments, while more than 80 percent of their outputs are sold within Appalachia. According to a furniture industry representative, this trend can be attributed to the industry’s proximity to raw materials and the fact that many of the household furniture establishments in Appalachia are quite specialized and tend to serve specific niche markets within the region. Table 2-13. Regional Transactions
Percentage of Intermediate Employee Compensation Percent of Industry
Inputs Purchased from as a Percent of Output Sold Within
Industry Appalachian Establishments Industry Output Appalachia
Motor Vehicle Parts 43.9% 20.9% 45.7%
Food Processing Machinery 50.7% 40.3% 68.9%
Packaging Machinery 57.1% 27.3% 66.2%
Electronic Components 49.0% 21.1% 40.1%
Upholstered Household Furniture 53.2% 31.3% 85.9%
Wooden Household Furniture 58.7% 29.0% 91.0%
Regional Economic Impact Statistics
Data Source: Appalachian Regional Commission. The electronic components and auto parts industries are the least integrated within the Appalachian region. Both of these industries are high tech industry clusters that require a variety of high tech inputs that may not be available within Appalachia. Also, given the nature of their outputs, they tend to cater to a much broader market outside Appalachia.
2.8 Economic Impact Multipliers Economic Impact Multipliers estimate the total impact of an initial change in spending in a particular sector of the economy. It measures changes that occur in the level of local employment, income, output, sales and wealth. Table 2-14 presents economic impact multipliers for various industries within the Appalachian region. The economic impact multipliers were generated from a model of 410 Appalachian counties. The model takes into account forward and backward linkages between industries. Industries with higher multipliers generate more economic benefits within the Appalachian region.
Appalachian Regional Commission 27 Global Competitiveness of Selected Industries and Clusters in The Appalachian Region

Personal Personal
Industry Employment Output Income Industry Employment Output Income
Agriculture 1.45 1.89 1.96 Leather Products Mfg 2.25 1.83 2.24
Metal Mining 2.47 1.62 2.20 Non-metallic Mineral Products Mfg 2.52 1.82 1.84
Coal Mining 3.86 1.93 2.00 Primary Metal Mfg 3.37 1.81 2.25
Petroleum Mining 2.98 1.90 2.89 Fabricated Metal Products Mfg 2.27 1.72 1.93
Non-metallic Minerals Mining 2.10 1.80 1.72 Other Machinery MFG 2.79 1.93 2.23
Construction 2.33 2.00 2.12 Food Products Machinery 2.05 1.93 1.78
Food Mfg 3.57 1.81 2.90 Packaging Machinery 2.88 1.98 2.20
Tab
le 2
-14.
Eco
nom
ic Im
pact
Mul
tiplie
r
Tobacco Products Mfg 17.51 1.75 5.46 Other Electrical Equipment Mfg 2.68 1.79 2.07
Textile Products Mfg 2.52 2.07 2.42 Micro Electronic Components Mfg 2.72 1.91 2.41
Apparel Products Mfg 2.44 2.15 2.82 Other Transportation Equipment Mfg 3.26 1.80 2.38
Wood Products Mfg 2.57 2.14 2.46 Motor Vehicle Parts and Accessories 3.00 1.81 2.24
Wood Household Furniture 2.06 2.02 2.15 Instruments Mfg 2.89 1.96 2.20Upholstered Household Furniture 2.00 1.99 2.02 Miscellaneous Mfg 1.86 1.70 1.83
Other Furniture Mfg 2.45 1.94 2.30 Transportation Services 2.27 2.05 2.04
Paper Products Mfg 3.15 1.78 2.38 Communications and Utilities 3.60 1.79 2.25
Printing and Publishing 2.14 1.83 1.94 Wholesale Trade 2.10 1.84 1.73
Chemical Products Mfg 4.66 2.03 2.56 Retail Trade 1.39 1.81 1.62
Petroleum Products Mfg 11.73 1.99 6.76 Finance, Insurance and Real Estate 2.23 1.58 2.09
Appalachian Regional Commission 28 Global Competitiveness of Selected Indust
ries and Clusters in The Appalachian Region
Rubber and Plastic Products 2.73 2.01 2.40Mfg Services 1.74 2.07 1.73
So
Dat
ace
: n
Reg
iona
lss
ion.
A
ppal
achi
a C
omm
iur

2.9 Environmental Regulatory Costs In 1991, a U.S. Senator from Oklahoma (David Boren) introduced the International Pollution Deterrence Act, legislation that would have used import tariffs to counteract the supposedly higher environmental compliance costs faced by U.S. industry. It was assumed that U.S. environmental regulations significantly impinged upon U.S. competitiveness, and in particular, with respect to developing countries.2 However, some studies have found little impact, noting that most U.S. trade is with other developed countries that impose similar levels of environmental regulation. In addition, there is a theoretical proposition known as the Porter Hypothesis which posits that environmental regulation promotes innovation and therefore competitiveness. The issue continues to be debated and the empirical studies that have attempted to bolster or detract from the argument have not had much success. In fact, there is not a clear cut answer to any of these competing positions in the academic literature. Two of the main reasons for this are the lack of data and the inability to adequately measure compliance costs incurred by businesses. The empirical problems make it difficult to accurately gauge the state-to-state differences in regulatory impacts. Such comparisons are important to be able to efficiently isolate and address areas that could improve competitiveness. Below, we report some of the mixed results that have been reported in the literature: these should be taken with a grain of salt. Table 2-15 presents the results of calculations developed using data from the 1999 Pollution Abatement Costs and Expenditures report published by the U.S. Department of Commerce. The numbers represent the per-unit cost for each state divided by the per-unit cost for the U.S. as a whole. With the exception of Georgia, similar patterns can be seen for both investment outlays and operating expenses: in other words, Maryland, New York, North Carolina and Virginia show per-unit expenditures below those of the U.S. while the remaining Appalachian states reveal figures that are above the corresponding U.S. values. Note that the ratios for South Carolina and West Virginia are significantly greater than the ratios presented for the other states. One problem with the numbers in the table is that they don't take into account industry mix and therefore don't accurately reflect a state's regulatory stringency. For example, states that have relatively higher concentrations of polluting industries will have relatively higher numbers. This does not mean that for a given industry one state's environmental regulations are more stringent than another state's. Ideally, one would like to do cross-state comparisons for each industry and then aggregate the results into a single cross-state comparison. Arik Levinson at Georgetown University has attempted to address this issue by developing a regulatory stringency index that takes into account differences in industry mix across states.3 The index is developed using data on pollution abatement costs, which are assumed to be related to environmental regulatory stringency when other factors are taken into account. The index is reproduced below in Table 2-16. Relatively higher numbers are associated with relatively higher regulatory compliance costs on businesses. Eight of the thirteen Appalachian states fall above the median index (0.945) while five fall below it. West Virginia and Mississippi both have indexes that are in the fourth quadrant and are ranked third and seventh respectively. Keep in mind that the data used to develop the index are somewhat dated, 1977 to 1994, and may not accurately reflect the state of affairs that exists today. For example, note that California has an index below the median score and is ranked 29th in terms of regulatory stringency: a conclusion that would seem to be somewhat questionable. 2 The flip-side of the coin is also being hotly debated: i.e., that international trade causes environmental degradation. 3 Levinson, Arik. “Pollution Abatement Costs and Foreign Direct Investment Inflows to U.S. States,"Georgetown University, May 20, 2001.
Appalachian Regional Commission 29 Global Competitiveness of Selected Industries and Clusters in The Appalachian Region

GSP
2.00
0.83
1.80
0.49
1.97
0.
40
0.73
1.73
1.26
3.29
1.43
0.90
3.73
Emp.
1.69
0.81
1.64
0.51
1.61
0.
50
0.68
1.51
1.15
2.70
1.25
0.92
3.31
Tota
l Cos
t Per
Es
t.
1.74
0.87
1.69
0.50
1.61
0.
46
0.71
1.72
1.24
2.76
1.41
0.94
2.76
GSP
2.17
0.78
1.38
0.16
2.18
0.
42
0.64
1.00
0.96
5.71
1.16
0.49
3.35
Emp.
1.83
0.77
1.25
0.17
1.78
0.
53
0.60
0.87
0.88
4.68
1.01
0.51
2.97
Oth
er C
osts
Per
Es
t.
1.88
0.83
1.30
0.16
1.79
0.
49
0.63
0.99
0.95
4.80
1.14
0.52
2.48
GSP
1.85
0.72
1.85
0.52
1.95
0.
40
0.98
2.19
1.23
1.54
1.54
1.13
3.76
Emp.
1.56
0.70
1.68
0.54
1.59
0.
51
0.83
1.91
1.12
1.26
1.33
1.16
3.34
Ope
ratin
g C
ost P
er
Est.
1.60
0.76
1.74
0.53
1.59
0.
47
0.87
2.18
1.21
1.29
1.51
1.18
2.78
GSP
2.23
1.18
2.13
0.78
1.81
0.
35
0.39
1.28
1.68
5.36
1.46
0.72
4.07
Emp.
1.88
1.16
1.94
0.81
1.47
0.
43
0.37
1.12
1.54
4.39
1.27
0.74
3.62
Cap
ital C
ost P
er
Est.
1.93
1.25
2.01
0.80
1.48
0.
40
0.38
1.27
1.66
4.50
1.43
0.76
3.01
St
ate
Ala
bam
a
Geo
rgia
Ken
tuck
y
Mar
ylan
d
Mis
siss
ippi
N
ew Y
ork
Nor
th
Car
olin
a O
hio
Pen
nsyl
vani
a
Sou
th
Car
olin
a Te
nnes
see
Virg
inia
Wes
t Virg
inia
Tab
le 2
-15:
Pol
lutio
n A
bate
men
t Cos
ts a
nd E
xpen
ditu
res
Sour
ce: L
evin
son,
Arik
. “Po
llutio
n A
bate
men
t Cos
ts a
nd F
orei
gn D
irect
Inve
stm
ent I
nflo
ws t
o U
.S. S
tate
s,”
Geo
rget
own
Uni
vers
ity, M
ay 2
0, 2
001.
Appalachian Regional Commission 30 Global Competitiveness of Selected Industries and Clusters in The Appalachian Region
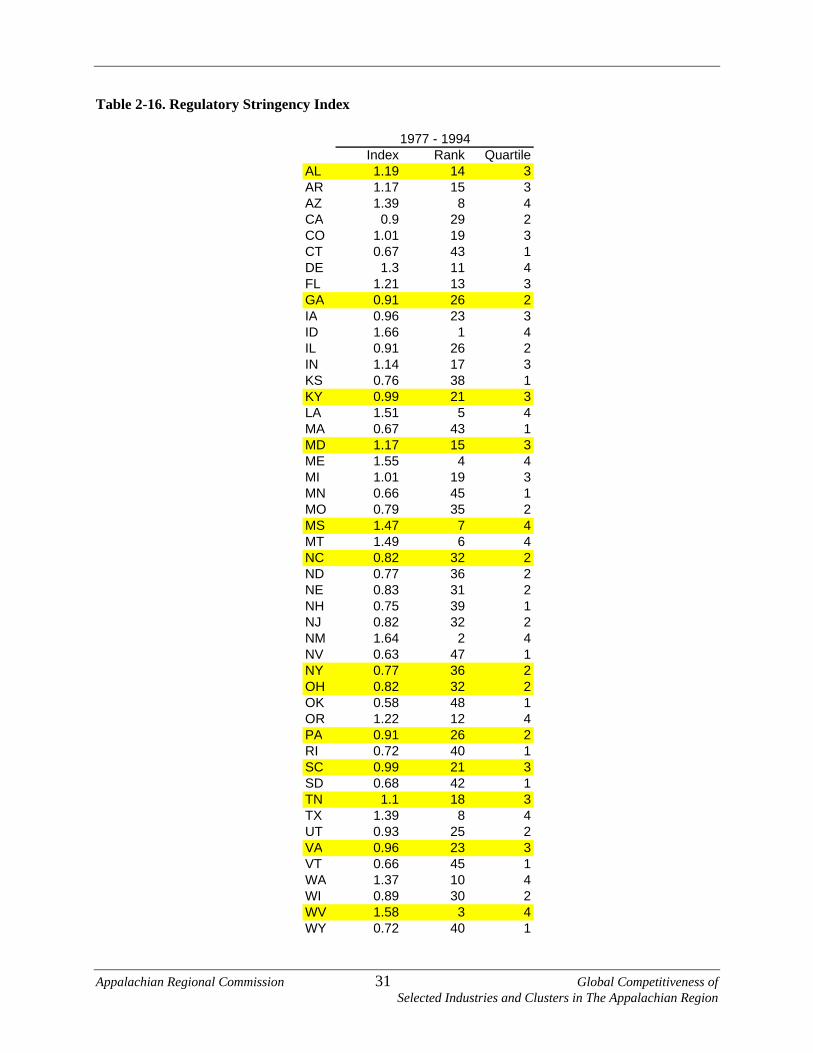
Table 2-16. Regulatory Stringency Index
Index Rank QuartileAL 1.19 14 3AR 1.17 15 3AZ 1.39 8 4CA 0.9 29 2CO 1.01 19 3CT 0.67 43 1DE 1.3 11 4FL 1.21 13 3GA 0.91 26 2IA 0.96 23 3ID 1.66 1 4IL 0.91 26 2IN 1.14 17 3KS 0.76 38 1KY 0.99 21 3LA 1.51 5 4MA 0.67 43 1MD 1.17 15 3ME 1.55 4 4MI 1.01 19 3MN 0.66 45 1MO 0.79 35 2MS 1.47 7 4MT 1.49 6 4NC 0.82 32 2ND 0.77 36 2NE 0.83 31 2NH 0.75 39 1NJ 0.82 32 2NM 1.64 2 4NV 0.63 47 1NY 0.77 36 2OH 0.82 32 2OK 0.58 48 1OR 1.22 12 4PA 0.91 26 2RI 0.72 40 1SC 0.99 21 3SD 0.68 42 1TN 1.1 18 3TX 1.39 8 4UT 0.93 25 2VA 0.96 23 3VT 0.66 45 1WA 1.37 10 4WI 0.89 30 2WV 1.58 3 4WY 0.72 40 1
1977 - 1994
Appalachian Regional Commission 31 Global Competitiveness of Selected Industries and Clusters in The Appalachian Region
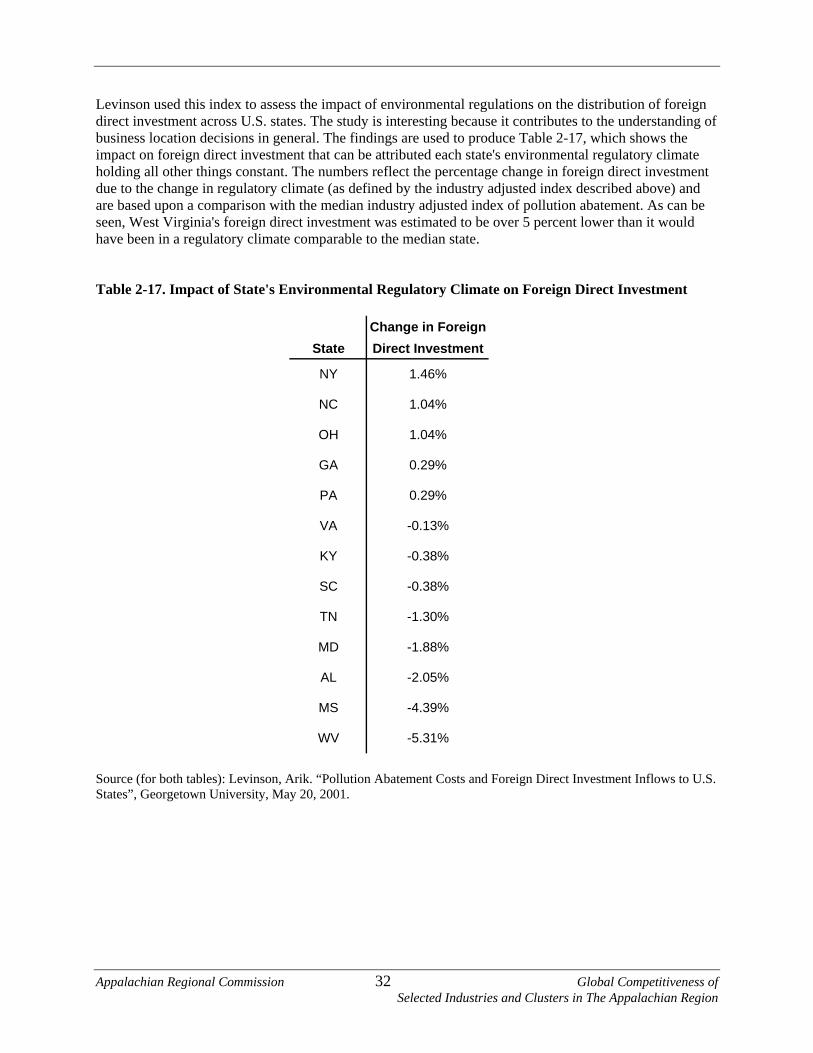
Levinson used this index to assess the impact of environmental regulations on the distribution of foreign direct investment across U.S. states. The study is interesting because it contributes to the understanding of business location decisions in general. The findings are used to produce Table 2-17, which shows the impact on foreign direct investment that can be attributed each state's environmental regulatory climate holding all other things constant. The numbers reflect the percentage change in foreign direct investment due to the change in regulatory climate (as defined by the industry adjusted index described above) and are based upon a comparison with the median industry adjusted index of pollution abatement. As can be seen, West Virginia's foreign direct investment was estimated to be over 5 percent lower than it would have been in a regulatory climate comparable to the median state. Table 2-17. Impact of State's Environmental Regulatory Climate on Foreign Direct Investment
ource (for both tables): Levinson, Arik. “Pollution Abatement Costs and Foreign Direct Investment Inflows to U.S.
Change in ForeignState Direct Investment
NY 1.46%
NC 1.04%
OH 1.04%
GA 0.29%
PA 0.29%
VA -0.13%
KY -0.38%
SC -0.38%
TN -1.30%
MD -1.88%
AL -2.05%
MS -4.39%
WV -5.31%
SStates”, Georgetown University, May 20, 2001.
Appalachian Regional Commission 32 Global Competitiveness of Selected Industries and Clusters in The Appalachian Region

2B The Services Industry The services sector is the largest component of the U.S. economy, accounting for 20.3 percent of all economic activity (See Exhibit 2-7 below). The United States is also the world’s leading producer and exporter of services. U.S. services exports more than doubled over the last decade—increasing from $155.6 billion in 1990 to $323.4 billion in 2003. U.S. services exports also consistently exceeded services imports, contributing to a favorable trade balance (see Table 2-18 below). With advances in information systems and technology making U.S. services more readily available to the rest of the world, U.S. services exports are projected to grow well into the future. Exhibit 2-7: Average Share of U.S. GDP by Industry (1990 - 2001)
Manufacturing, 16.8%
Transportation and public utilities, 8.5%
Wholesale trade, 6.8%
Retail trade, 9.0% Finance, insurance, and real estate, 18.9%
Services, 20.3%
Government, 12.5%
Agriculture, forestry, and fishing, 1.6% Mining, 1.4%
Construction, 4.2%
Source: U.S. Bureau of Economic Analysis. Table 2-18. Exports and Imports of U.S. Services (US $ billions)
1990 1991 1992 1993 1994 1995 1996155.7 17Services Exports 3.3 187.4 195.9 210.8 228.9 250.2
7.4.8
.596.1 88.2 87.7 79.6 70 66.4 62.9Differnce
Year
122.3 123.6 123.6 128.1 137.7 146.1 1533.4 49.7 63.8 67.8 73.1 82.8 92
1997 1998 1999 2000 2001 2002 2003267.6 275.1 294 311.9 303.6 309.1 323.4171.5 186.9 206.3 232.3 233.6 242.7 260
YearServices ExportsServices Imports
Services ImportsDiffernce
Source: U.S. Bureau of Economic Analysis.
Appalachian Regional Commission 33 Global Competitiveness of Selected Industries and Clusters in The Appalachian Region

Education and training services are areas where U.S. expertise remains largely unparalleled. The educational services sector comprises establishments that provide instruction and training in a wide
ariety of subjects and is the fifth largest U.S. service sector export. During the 2001 to 2002 academic ion to the U.S.
conomy. This figure is based on tuition figures from the College Board, enrollment figures from the Institute of International Education's Open Doors 2002 rep culated from C ough t s wages and purchases of go ls the contribution to t y by foreign students. T Economy by Internati 2001 to 2002
vyear, the 583,000 international students who studied in the U.S. contributed nearly $12 bill
4eort, and living expenses cal
ollege Board figures.5 These contributions flow thr he community aods and services. Table 2-19 detai he U.S. econom
able 2-19. Contribution to U.S. onal Students in
Number of Foreign Students 582,996 Contribution from Tuition and Fees to U.S. Economy 6,7$ 55,000,000 Contribution from Living Expenses $9,498,000,000 Total Contribution by Foreign Students $16,253,000,000 Less U.S. Support (29.1%) - $4,727,000,000 Plus Dependents’ Living Expenses + $425,000,000 Net Contribution to U.S. Economy by Foreign Students and their Families:
$11,952,000,000
Source: NAFSA; Association of International Educators 2001-2002. Given the importance of the educational services sector, this section of the study focuses on the export of higher education services in Appalachia. The main goal is to highlight Best Practices in International
tudent Recruitment Programs within Higher Education Institutions in Appalachia. To accomplish this, the later part of this section examines and details the marketing efforts of eight different types of higher
er countries. These representative stitutions were selected based on inputs from industry experts and higher education professionals within
me om Asian countries, with India as the lead country of origin. Asian countries and developing countries
have been the leading countries of origin over the past ten years, and U.S. higher education institutions have targeted these countries to market their educational programs. Students from European countries and other countries with established higher education systems are less inclined to study in the U.S. due to lower educational costs, government educational subsidies, and availability of quality education in their home countries.6 Table 2-21 lists the fifteen leading countries of origin for international students.
S
educational institutions within Appalachia to attract students from othinthe Appalachian region. The sample was also chosen to represent institutions in the northern, central and southern subregions of Appalachia.
2.10 The United States Educational Exports Sector In the 2001 to 2002 academic year, institutions around the United States hosted nearly 550,000 international students from over a hundred countries. From Table 2-20, it can be determined that international students chose to study at universities located in a variety of areas, not solely in large metropolitan areas. International students studying in the 2001 to 2002 academic year primarily cafr
4 NAFSA Association of International Educators. The Economic Benefits of International Education to the United States of America: A Statistical Analysis. (2002).
6 Dr. Stephen Dunnett, SUNY Buffalo, interview by Krute Singa, telephone, 8 August 2003.
5 NAFSA Association of International Educators. The Economic Benefits of International Education to the United States of America: A Statistical Analysis. (2002).
Appalachian Regional Commission 34 Global Competitiveness of Selected Industries and Clusters in The Appalachian Region

Table 2-20. Top 10 Institutions with the Highest Number of International Students, 2001-2002 Academic Year
Rank Institution City State
International Student Enrollment
Total Enrollment
1 University of Southern California Los Angeles CA 5,950 29,813 2 New York University New York NY 5,504 37,134 3 Columbia University New York NY 5,116 22,425 4 Purdue University Main Campus West Lafayette IN 4,695 37,871 5 University of Texas at Austin Austin TX 4,673 50,616 6 Boston University Boston MA 4,412 27,767 7 Ohio State University Main Campus Columbus OH 4,302 48,477 8 University of Illinois at Urbana-Champaign Champaign IL 4,287 37,684 9 University of Michigan - Ann Arbor Ann Arbor MI 4,149 38,248 10 University of Florida Gainesville FL 3,884 45,937
Source: Open Doors, Institute of International Education 2002. Table 2-21. Leading Countries of Origin for International Students, 2001 to 2002
Rank Place of Origin 2000/2001 2001/2002 2000/2001 % Change
% of U.S. Foreign Student Total
1 India 54,664 66,836 22.3 11.5 2 China 59,939 63,211 5.5 10.8 3 Korea, Republic of 45,685 49,046 7.4 8.4 4 Japan 46,497 46,810 0.7 8.0 5 Taiwan 28,566 28,930 1.3 5.0 6 Canada 25,279 26,514 4.9 4.5 7 Mexico 10,670 12,518 17.3 2.1 8 Turkey 10,983 12,091 10.1 2.1 9 Indonesia 11,625 11,614 -0.1 2.0 10 Thailand 11,187 11,606 3.7 2.0 11 Germany 10,128 9,613 -5.1 1.6 12 Brazil 8,846 8,972 1.4 1.5 13 Pakistan 6,948 8,644 24.4 1.5 14 United Kingdom 8,139 8,414 3.4 1.4 15 Colombia 6,765 8,068 19.3 1.4
Source: Open Doors, Institute of International Education 2002.
Appalachian Regional Commission 35 Global Competitiveness of Selected Industries and Clusters in The Appalachian Region

A large percentage of international students come to the U.S. to major in the business, engineering, and computer science fields. Table 2-22 details the fields of study for international students in the 2001 to 2002 academic year. Table 2-22. Fields of Study Among Foreign Students, in 2001 to 2002
Field of Study 2001/2001 Foreign Students
2001/2002 Foreign Students
% of Total
% Change
TOTAL 547,867 582,996 100.0 6.4 Business & Management 106,043 114,885 19.7 8.3 Engineering 83,186 88,181 15.1 6.0 Mathematics & Computer Sciences 67,825 76,736 13.2 13.1 Other 57,235 59,785 10.3 4.5 Social Sciences 42,367 44,667 7.7 5.4 Physical & Life Sciences 38,396 41,417 7.1 7.9 Undeclared 35,779 36,048 6.2 0.8 Fine & Applied Arts 34,220 33,978 5.8 -0.7 Health Professions 22,430 24,037 4.1 7.2 Intensive English Language 23,011 21,237 3.6 -7.7 Humanities 16,123 18,367 3.2 13.9 Education 14,053 15,709 2.7 11.8 Agriculture 7,200 7,950 1.4 10.4
Source: Open Doors, Institute of International Education 2002.
2.11 U.S. Losing Educational Export Market Share to Other Countries U.S. market share is steadily declining in international student market. The number of all international students who selected the U.S. for study decreased by approximately ten percent between 1982 and 1995. This is reflective of the United States’ hesitation to consider the international student market an asset to the economy. Other countries including the Untied Kingdom, Canada, Australia, and New Zealand have launched aggressive recruitment strategies to attract foreign students, reaping the foreign policy, economic, and educational benefits that international students bring.7 Australia, Canada and the United Kingdom, have developed national priorities and comprehensive strategies to attract larger numbers of international students. Countries in which English is not a primary language, including Germany, Japan, and France are establishing programs to attract international students with some classes taught in English. Other nations have taken on a broader internationalization orientation that involves a mix of long and short-term study by international students on campus, satellite campuses and joint programs abroad, and distance education.8 The decline in U.S. market share does not reflect decline in international demand for U.S. higher education. Demand does exist as many foreign students prefer a U.S. education. Rather, the decline is a result of government imposed barriers to studying in the U.S., the high costs to finance an U.S. education, and the complexity of the U.S. higher education system. Due to the attacks on September 11, 2001, strict
7 NAFSA Association of International Educators. In America’s Interest: Welcoming International Students: Report of the Strategic Task Force on International Student Access. (2003), 6. 8 Schneider, Michael. Others’ Open Doors: How Other Nations Attract International Students. Implications for U.S. Educational Exchange. (2000), 3.
Appalachian Regional Commission 36 Global Competitiveness of Selected Industries and Clusters in The Appalachian Region

security and visa procedures have affected the rate of international students.9 Though more stringent security measures are necessary for U.S. security, creating difficulties for international students to enter the country for study may produce more U.S. animosity in the future. International students are foreign policy assets; the more international students are hindered from attending higher education institutions in the U.S., the less political allies the U.S. may have in the future.
2.12 Appalachian International Student Facts The Appalachian region higher education network consists of over 250 universities, colleges, and community colleges. There are approximately 220 higher education institutions in Appalachia with international student enrollment. Table 2-23 lists the higher education institutions in the area under the jurisdiction of the Appalachian Regional Commission with the highest numbers of enrolled international students. Table 2-23. Institutions in the Appalachian Region with the Highest Number of International Student Enrollment in 2001 and 2002 (Top 20)
Institution City State
International Student Enrollment 2001
International Student Enrollment 2002
Total Enrollment
Cornell University Ithaca NY 3,024 3,181 19,420 Carnegie Mellon University Pittsburgh PA 2,118 2,395 8,588 Virginia Polytechnic Institute & State University Blacksburg VA 1,592 2,087 25,000 West Virginia University Morgantown WV 1,133 1,207 22,774 Ohio University Main Campus Athens OH 1,189 1,168 19,661 SUNY - Binghamton University Binghamton NY 966 1,028 12,820 Mississippi State University MS State MS 1,004 1,022 University of Tennessee, Knoxville Knoxville TN 959 972 26,000 University of Alabama at Birmingham Birmingham AL 815 910 16,542 University of Alabama Tuscaloosa AL 882 885 19,171 Clemson University Clemson SC 833 847 17,101 Duquesne University Pittsburgh PA 713 654 9,555 Indiana University of PA Indiana PA 467 624 13,410 University of Alabama in Huntsville Huntsville AL 448 479 6,754 Hocking Technical College Nelsonville OH 267 340 5,051 Lock Haven University of Pennsylvania Lock Haven PA 414 338 4,125 La Roche College Pittsburgh PA 267 293 1,908 Jefferson State Community College Birmingham AL 390 239 8,076 Gadsden State Community College Gadsden AL 238 231 5,192 Edinboro University of Pennsylvania Edinboro PA 187 230 7,498
Source: Open Doors, Institute of International Education 2002. Similar to the international student profile of the United States, the leading country of origin for international students studying in Appalachian states, in the 2001 to 2002 academic year was India, followed by China, the Republic of Korea, and Japan. Table 2-24 details the leading countries of origin
9 NAFSA Association of International Educators. In America’s Interest: Welcoming International Students: Report of the Strategic Task Force on International Student Access. (2003), 6.
Appalachian Regional Commission 37 Global Competitiveness of Selected Industries and Clusters in The Appalachian Region

for foreign students studying in the Appalachian Region states. Recruitment in Asian states is a high priority though some higher education institutions are actively recruiting students from developing countries through the development of research exchanges and joint degree programs between a U.S. university and a university in the developing country. Examples of these relationships are provided in Section 2.13, Best Practices in International Programs at Higher Education Institutions. Table 2-25 ranks the primary fields of study among international students in Appalachian higher education institutions. Table 2-24. Leading Country of Origin for Foreign Students in Appalachian Region States, 2001 to 2002
Country of Origin % of Total Foreign StudentsA
Total Number
India 12.7% 22,598 China 11.7% 20,889 Republic of Korea 9% 16,097 Japan 6% 10,938 Canada 4% 6,795 Taiwan 1.5% 2,627 Total 44.9% 79,944
A Total Number of Foreign Students in Appalachian States, 177,865, from Table 2-26. Source: Open Doors, Institute of International Education, 2002. Table 2-25. Primary Fields of Study Among Foreign Students in Appalachian Region States
Rank Field of Study 1 Business and Management 2 Engineering 3 Math and Computer Science 4 Physical and Life Sciences 5 Other 6 Undeclared
Source: Open Doors, Institute of International Education, 2002. The net contribution by international students studying in the states comprising the Appalachian region amounted to $3.6 billion in the 2001 to 2002 academic year all of which translated to pure profit by Appalachian higher education institutions and businesses. On average, an international student studying in Appalachia contributed $20,500 to the region, mainly from funds generated in their country of origin.
2.13 Best Practices in International Programs at Higher Education Institutions Several universities and colleges in the Appalachian region have successfully implemented an international program to recruit, foster, and assist a foreign student population on campus. To promote the establishment of international student programs in additional higher education institutions in Appalachia, eight international program coordinators from colleges and universities in and around the Appalachian region were interviewed. The interviews provided information on how to establish an international program, how to recruit students, services to provide international applicants and accepted students, and how to promote economic liaisons between the international population and the local community and state.
Appalachian Regional Commission 38 Global Competitiveness of Selected Industries and Clusters in The Appalachian Region

Table 2-26. Contribution to State Economies in the Appalachian Region by International Students 2001-2002
State
Number of Foreign Students
Contribution from Tuition and Fees
Contribution from Living Expenses
Total Contribution by Foreign Students
Less U.S. Support
Plus Dependents’ Living Expenses
Net Contribution to State Economy by Foreign Students and their Families:
Alabama 6,040 $46,544,000 $81,796,000 $128,340,000 ($34,495,000) $3,442,000 $97,288,000Georgia 11,991 $140,786,000 $186,714,000 $327,501,000 ($102,792,000) $8,716,000 $233,425,000Kentucky 4,789 $39,731,000 $61,180,000 $100,911,000 ($28,048,000) $2,799,000 $75,662,000Maryland 13,947 $150,281,000 $219,398,000 $369,678,000 ($83,288,000) $8,763,000 $295,154,000Mississippi 2,381 $18,109,000 $36,986,000 $55,095,000 ($11,643,000) $1,213,000 $44,665,000New York 62,053 $850,626,000 $1,080,522,000 $1,931,148,000 ($619,296,000) $51,495,000 $1,363,347,000N.Carolina 8,960 $109,463,000 $141,185,000 $250,648,000 ($86,481,000) $7,080,000 $171,248,000Ohio 19,384 $243,934,000 $317,707,000 $561,641,000 ($198,773,000) $16,703,000 $379,571,000Penn. 24,014 $389,135,000 $393,713,000 $782,848,000 ($253,435,000) $18,025,000 $547,437,000S.Carolina 3,731 $35,825,000 $61,923,000 $97,748,000 ($33,380,000) $2,947,000 $67,315,000Tennessee 5,867 $69,991,000 $88,462,000 $158,453,000 ($40,952,000) $3,357,000 $120,857,000Virginia 12,600 $136,345,000 $196,356,000 $332,701,000 ($79,507,000) $7,990,000 $261,184,000W Virginia 2,108 $17,724,000 $33,201,000 $50,926,000 ($17,993,000) $1,477,000 $34,410,000Total 177,865 $2,248,494,000 $2,899,143,000 $5,147,638,000 ($1,590,083,000) $ 134,007,000 $3,657,187,410
Source: NAFSA: Association of International Educators 2001-2002. The eight international programs were picked based on the following criteria:
• undergraduate and graduate level foreign student admissions • number of foreign students in attendance • scale and method of recruiting efforts • size of institution • cost of tuition • affiliation (religious) • local economic development involvement
International program coordinators were interviewed by telephone for the following universities and colleges: Marshall University, WV Clemson University, SC Carnegie Mellon University, PA Lee University, TN University of Scranton, PA Jefferson State Community College, AL Troy State University, AL State University of New York (SUNY)
SUNY Fredonia SUNY Buffalo
Appalachian Regional Commission 39 Global Competitiveness of Selected Industries and Clusters in The Appalachian Region

2.13.1 Marshall University, WV Size of Institution: 12,000 undergraduate and 4,000 graduate students total between the main campus, medical center, South Charleston campus, and online Location: Huntington, West Virginia Degrees Offered: Bachelors and Masters Type of Institution: Public Regional University with accreditations Size of International Program: 400 international students, undergraduate and graduate, from 50 countries Interviewee: Dr. Will Edwards, Director, Marshall Center for International Studies10
Marshall University is located in the Appalachian region. It hosts an average of 400 international students a year from 50 countries, mainly those in Asia, the Middle East, Europe and South America. On average, international students stay for 3 years, though there are students who participate in the one year exchange programs available at Marshall. Many students commence their education at Marshall in Learning English for Academic Purposes (L.E.A.P.), an intensive English language program, and then transfer to an undergraduate or graduate program. International student enrollment numbers depend on world conditions. Marshall’s international program suffered low enrollment levels from Asian countries during the Asian stock market crash, the period immediately following September 11, 2001, and the Severe Acute Respiratory Syndrome (SARS) outbreak. The most popular major for international students is business as Marshall has a national accreditation for its business school through the Association to Advance Collegiate Schools of Business (AACSB). The Information Systems major is the second most popular major, followed by the sciences and liberal arts. The L.E.A.P. program has averaged 40 to 60 students total per semester in all three levels, beginner, intermediate, and advanced. The objectives of Marshall University’s international program are both cultural and economic. The Marshall community is enriched by the presence of a variety of cultures. The university benefits economically from the international students ability to pay full tuition as no financial aid is given to the students. Marshall Center for International Studies Recruitment Strategy The Marshall Center for International Studies engages in a variety of activities to recruit international students. The Center has cultivated and established several relationships with embassies, recruitment agents, and foreign universities to promote the University. The strategies successful in attracting international students to Marshall include:
1. Web-based marketing. Web based marketing sites exist; for example, English-as-a-Second-Language websites charge a fee of $100 per year, per page. Listing through these types of websites has proven successful for Marshall.
10 Dr. Will Edwards, interview by Krute Singa, telephone, 9 September 2003.
Appalachian Regional Commission 40 Global Competitiveness of Selected Industries and Clusters in The Appalachian Region

2. Recruiting Agents. Countries like Thailand and Vietnam only work with agents. Agents are affiliated with Fulbright, IEE, and provide private counseling and application assistance.
3. Recruitment Fairs. Recruitment fairs are established through a private enterprise. To participate in the fair, there is a fee to set up a booth.
4. Market share data and research. The market data provided by the Institute of International Education, Open Doors database is analyzed to determine the leading countries of origin and academic programs for international students.
5. Department of Commerce. Marshall coordinates with the Department of Commerce in targeting similar areas and countries.
6. Southern Growth Policy Board, Global Strategies Advisory Council. Marshall is associated with the Council to study export data, including educational exports. The Council involves thirteen states, some from Appalachia.
7. Embassies. Marshall recruits students by forming a relationship with a country’s embassy. 8. Foreign Universities. Creating a relationship and establishing programs with a foreign university
allows for students and faculty from both universities to take advantage of educational opportunities without difficulty.
9. Word of Mouth. International students who have completed study at Marshall provide the best form of advertisement, informing their friends and relatives of the programs at Marshall.
Establishing a relationship with a foreign university is most effectively undertaken when faculty and the faculty’s department are involved in the negotiations and program details. The Center for International Studies initiates the process, recruiting the appropriate faculty to aid in designing the program. Dr. Edwards emphasized the importance of establishing relationships with embassies, foreign universities, private businesses, and recruitment agents. These relationships require substantial investments of time and resources during the initial years, though once established, yield great benefits and results. For example, the Business Department at Marshall sought to create a business exchange program with China. It worked with a private corporation in China for seven years before the program became established. At present, the program is successful in attracting mid-level Chinese business professionals to engage in the English language program and business classes offered by Marshall. This example demonstrates the level of persistence and time investment required to create successful programs. Once the program is established, time and commitment are necessary to maintain the relationship. The success of Marshall’s international program is also due to the relative ease with which international students can acquire information about Marshall and the international program. Marshall University’s main webpage has a link to an international page where international students can discover more information about admission requirements, international student services and support, multi-cultural affairs and events, and L.E.A.P., the intensive English program. It is beneficial to have clear, quick, and informative links for international students as it implies that the University is a place where they feel welcomed. Basically, there are no costs involved in running the Center. The web based fees for web-based marketing are negligible and the costs of traveling to recruitment fairs are recovered when two students are recruited from the fair, though the number of students recruited from the fairs is far more than two. Essentially, the program pays for itself and the local community earns money as well from foreign student spending on food, cars, and activities.
Appalachian Regional Commission 41 Global Competitiveness of Selected Industries and Clusters in The Appalachian Region

2.13.2 Clemson University, SC Size of Institution: Undergraduate 13,750, graduate 3,100 Location: Clemson, South Carolina Degrees Offered: Bachelors, Masters, and Doctorate Type of Institution: Public University Size of International Program: 870 international students, undergraduate and graduate, from 73 countries Interviewee: Bonnie Holaday, Dean of the Graduate School and Associate Vice Provost for Research11
Clemson University is classified by the Carnegie Foundation as a Doctoral/Research University-Extensive, a category comprising less than four percent of all universities in the United States. The University is committed to internationalizing as can be seen by the level of faculty involvement in international programs, the international activities database, and the attendance of approximately 850 international students per year from over seventy countries to attend both undergraduate and graduate programs. International Service and Diversity Programs (ISDP) is generally the office with which prospective international students and visitors have their first contact with Clemson. The ISDP acts as liaison between the INS (Immigration and Naturalization Services) and all international students on the campus, whether they are undergraduate or graduate students, faculty, staff or exchange visitors. ISDP creates and coordinates program development by student affairs units and works co-operatively with all offices involved in developing international programs or services at Clemson University. ISDP advises students and refers them as needed to other services on campus. ISDP staff are members of NAFSA, the Association of International Educators. The development of international programs is mainly administered by faculty members and their departments. The international students are hosted by departments. Faculty members at Clemson are heavily involved in the international program, lending their expertise and knowledge about a particular country or region to help establish and manage the programs. They attend national meetings, including the European Council of Graduate Education, as well as professional meetings. Faculty members develop relationships with foreign universities and their relationships with foreign professors allow for recruitment of qualified international students. In an effort to promote internationalization of the university, the International Initiatives Committee has developed a data bank of international activities at Clemson University. The purpose of this data bank is to facilitate strategies for promoting internationalization and to provide faculty and students with an avenue for exploring existing international programs and areas of expertise within the university. The Database includes:
• over 400 Clemson University professors who have international experience and connections; • over 500 international programs in 66 countries on six continents; and • over 400 international projects.
11 Bonnie Holaday, interview by Krute Singa, telephone, 9 June 2003.
Appalachian Regional Commission 42 Global Competitiveness of Selected Industries and Clusters in The Appalachian Region

The Faculty Database is formatted to allow for an easy search of international activities of a particular faculty member. The Regional Database lists the Clemson University international activities occurring in particular countries and regions. The data is primarily sorted by six major regions of the world: Europe, Asia (including Russia), the Middle East and North Africa, Sub-Saharan Africa, the Americas, and Oceania. The College Database provides information on international activities conducted by a particular college or department. The data are primarily sorted by the following colleges or programs:
• Agriculture, Forestry, and Life Sciences • Arts, Architecture, and Humanities • Business and Behavioral Science • Engineering and Science • Health, Education, and Human Development • Miscellaneous programs (Graduate School, Asian Studies)
Clemson differentiates between international programs and projects. International Programs are international activities occurring continuously with other faculty members or units at Clemson University. These activities exist independent of any particular faculty member. International Projects are individual international activities, often of relatively short duration that are dependent on involvement of a particular faculty member. In addition to the database, the main Clemson University webpage provides an accessible link for prospective students to an international page with information on applications, life at Clemson, and other background information on the university.
Appalachian Regional Commission 43 Global Competitiveness of Selected Industries and Clusters in The Appalachian Region

2.13.3 Carnegie Mellon, PA Size of Institution: Undergraduate 5,400, graduate 2800, doctoral 1300 Location: Pittsburgh, Pennsylvania Degrees Offered: Bachelors, Masters, and Doctorate Type of Institution: Private Research University Size of International Program: 2300 total international students: undergraduate 580, graduate 1000, doctoral 750, from over 95 countries Interviewee: Trevor Rusert12
Carnegie Mellon is a national research university of about 8,000 students and 3,000 faculty, research and administrative staff. The University is committed to providing a global education for its students, expanding its international offerings and increasing its presence on a global scale. Increasing diversity, in all aspects of university life and fostering the economic development of southwestern Pennsylvania, are top priorities. Carnegie Mellon is highly ranked in the fields of computer science, engineering, and business. The University attracts many international students who pay attention to rankings and are drawn to those programs as a result. As international students do not receive any financial aid or scholarships, the strength of Carnegie Mellon’s academic programs generates international student enthusiasm. Even though Carnegie Mellon attracts many international students by the ranking of its academic departments, the University actively recruits foreign students through a number of activities. It purchases names through SAT services, recruiting American and international students with scores over 1350. Faculty and staff attend recruitment fairs, traveling in the fall throughout countries in Asia and South America. In addition, Carnegie Mellon has established several relationships with councilors at foreign high schools to inform students about the University’s programs and aid in the recruiting process. Prospective and newly admitted international students have the opportunity to participate in online chat sessions to be able to communicate instantly with administrative staff, faculty, and U.S. students majoring in computer science, engineering, and business. Faculty and their academic departments are highly involved in establishing and maintaining international programs and also recruiting students, especially for the graduate and doctoral levels. Faculty members and administrative staff who are familiar with international education systems form an international committee to review international applications. Admission is based on SAT scores, high school background, academic records, resumes, and recommendations. International students at Carnegie Mellon come from over 95 countries. Singapore is the top international feeder, followed by Hong Kong, India, Malaysia, Korea, Canada, and Japan. As recruitment efforts are mainly focused on Asian countries, the majority of international students are from Asia. Due to the particular circumstances and requirements faced by Asian students, Carnegie Mellon allows deferments up to 3 years to counteract visa problems, global issues, and military commitments. 12 Trevor Rusert, interview by Krute Singa, telephone, 9 June 2003.
Appalachian Regional Commission 44 Global Competitiveness of Selected Industries and Clusters in The Appalachian Region

2.13.4 Lee University, TN Size of Institution: Undergraduate 3,400, graduate 230 Location: Cleveland, Tennessee Degrees Offered: Bachelors and Masters Type of Institution: Private Christian Liberal Arts University Size of International Program: 160 international students, undergraduate and graduate, from 37 countries Interviewee: Renee Williams, International Admissions Coordinator13 Lee is the largest church-related institution in Tennessee, and the second largest private school, behind Vanderbilt University. Lee University is owned and operated by the Church of God which is headquartered in Cleveland, Tennessee. Lee engages in limited recruitment activities. The majority of international students apply after learning about the University through family members and friends who have or are attending Lee. International students are also attracted to Lee’s Christian affiliation. Lee University’s website is another tool effective in attracting prospective students. The main Lee University webpage provides an accessible link for prospective students to an international page with information on applications procedures, tuition costs, housing, visa applications, and other background information on the university. Lee recruits students through fairs and Christian youth rallies. International admissions staff regularly travel to the Bahamas, Caribbean, and Canada to attend the youth rallies to inform prospective students about the academics and services Lee offers. The main countries of origin for foreign students at Lee differ from most higher education institutions in the U.S. as Lee specifically recruits Christian students. The countries represented in the 2002 to 2003 academic year ranked as follows:
1. Bahamas 2. Korea 3. Haiti / Japan 4. Jamaica / Trinidad 5. Canada 6. China / Kenya / Nigeria / South Africa
Lee University is a good example of a small university that is able to maintain an international student population from countries like the Bahamas, Haiti, and Kenya. These countries are not generally or actively recruited by many institutions as they contain few students who are able to afford education in the United States. Lee University also demonstrates that an international program does not have to be large or have to recruit from Asian or European countries to be successful. Maintaining a small program and targeting students from select countries will enrich the campus and local communities as long as the international students receive quality education and support. 13 Renee Williams, interview by Krute Singa, telephone, 10 June 2003.
Appalachian Regional Commission 45 Global Competitiveness of Selected Industries and Clusters in The Appalachian Region

2.13.5 University of Scranton, PA Size of Institution: Undergraduate 3,700, graduate 1000 Location: Scranton, Pennsylvania Degrees offered: Bachelors, Masters, and Associates Type of Institution: Private Catholic and Jesuit Liberal Arts University Size of International Program: 25 international students, undergraduate and graduate, from 12 countries Interviewee: James Goonan, Director of Graduate Admissions14
The University of Scranton is the oldest and largest university in Northeastern Pennsylvania and is committed to serving the region’s professional, political, religious, cultural and business communities. Part of this commitment is manifested in Scranton’s international program. In order to expand the population of Northeastern Pennsylvania and to enrich the area’s cultural and economic outlook, the University has welcomed international students since 1940. The international student population at Scranton is small, averaging twenty to twenty-five students per year from twelve countries. The main countries of origin are China, India, Taiwan, and Thailand. The majority of students are interested pursuing degrees in business administration, software engineering, and chemistry. The international students receive personalized guidance and assistance throughout their stay at Scranton. The international program is successful as it considers the needs of potential students, conducting market research to learn what is important to foreign students. These needs have to be satisfied to create a successful international program that will endure and grow over time. For example, to attract Middle Eastern students, Scranton converted a property near campus into a mosque to satisfy the students’ demands for a prayer space. The addition of the mosque increased the application rate by Middle Eastern students. This example illustrates that not only is it important to understand and listen to foreign student needs, it is equally as important to understand their cultures and remain flexible to best create an environment comfortable to foreign students. Scranton actively recruits international students. Staff members analyze market data provided by the Institute of International Education, Open Doors database to determine the leading countries of origin and academic programs for international students. They travel internationally, visiting cities to speak to government, schools, and students and participate in international education fairs. There is established communication with advisors in foreign embassies responsible for educational advising, and with international alumni who will meet with and answer questions from prospective students. Scranton also utilizes the SAT and GRE databases to disseminate information to interested students. The information is available translated into the students’ native languages. International students at Scranton mainly come from Asian countries as the University has focused most of its recruitment efforts there. Scranton is currently establishing relationships with Latin American countries to recruit students. There are a few European students who study at Scranton; the limited numbers are mainly due to the fact that Europeans have access to quality education for negligible cost. 14 James Goonan, interview by Krute Singa, telephone, 11 June 2003.
Appalachian Regional Commission 46 Global Competitiveness of Selected Industries and Clusters in The Appalachian Region

Being a Jesuit Universities, Scranton has agreements with other Jesuit Universities worldwide to exchange students and faculty. Developing personal relations with foreign advisors, school officials, and alumni, as well as traveling to the same countries every year, are important methods by which to develop an international program. Building personal relations requires time and dedication, and is a long process, sometimes taking years before results show and programs established. However, once some relationships and programs are secured, the process becomes easier and new relationships are developed with increased ease. The educational export market is facing increased growth and fierce competition. According to Goonan, it is becoming difficult to compete aggressively with schools from Australia, New Zealand, Canada, and the United Kingdom. These governments have recognized the rewards from the market and are consequently offering financial aid and have created straightforward visa application procedures. The U.S. government has not promoted the sector as openly, offering few financial incentives and creating difficult and confusing visa procedures for foreign students. Education is the strongest export product that the U.S. can currently promote. It brings in billions of dollars in revenue and enhances U.S. community and student life.
Appalachian Regional Commission 47 Global Competitiveness of Selected Industries and Clusters in The Appalachian Region

2.13.6 Jefferson State Community College, AL Size of Institution: 8,100 students Location: Birmingham, Alabama Degrees offered: Associates Type of Institution: 2 Year Community College Size of International Program: 500 international students, undergraduate and graduate, from 10 countries Interviewee: Alesha Kegler, Office Assistant, International Student Program15
Jefferson State is a two year community college, accredited by the Commission on Colleges of the Southern Association of Colleges and Schools. The College offers more than 120 University Transfer Programs, 40 Career Programs and numerous Certificate Programs. These programs are offered during the day, evening, weekends and via the Internet. Staff members of the International Student Program do not actively recruit students. The College is listed in international school directories but foreign students mainly learn about Jefferson State through their family members, friends, and other alumni. Of the 500 students enrolled, over half are from East and West Africa, particularly Kenya and Tanzania. Other countries of origin include China, Pakistan, and Nepal. Most international students obtain a 2 year degree and then transfer to another college to acquire their bachelor’s degree. The Jefferson State main webpage has an accessible and noticeable link to the International Student Program page that relays information on admission requirements, application procedures, English proficiency, forms, costs, and placement testing. Jefferson State’s successful international program illustrates the integral role community colleges play in the educational exports sector. Judith T. Irwin, Director of International Programs and Services at the American Association of Community Colleges, highlights the importance of community colleges in educating and training individuals to behave successfully in a multicultural and technologically global environment. Community colleges constitute the largest segment of higher education in the United States. They include nearly 1,200 institutions with an enrollment of 11 million students, 6 million of whom are seeking a degree or certificate. Most community colleges provide open access, enabling both U.S. and international students to take high-quality courses at low-cost.16 Foreign students are more aggressively seeking a degree from two-year institutions, taking advantage of the short-term specialized training, ESL programs, and the opportunity to transfer into a four-year college or university.17
15 Alesha Kegler, interview by Krute Singa, telephone, 20 June 2003. 16 Irwin, Judith T. Community Colleges: Changing Individuals, Meeting Global Needs. 17 Chase, Audree. Community Colleges’ Role in Recruiting International Students. 1998.
Appalachian Regional Commission 48 Global Competitiveness of Selected Industries and Clusters in The Appalachian Region

There is a common misconception that international students only apply to specific metropolitan areas in the United States. However, the enrollment rates at community colleges around the U.S. indicate differently. For example, a large number of two-year institutions in Texas, such as Tarrant County Junior College in Forth Worth, attract Mexican students but currently enroll more students from Africa, India, Sweden, Greece, Canada and the Philippines. As in the case of Jefferson State, Tarrant County estimates that most of these students learn about their institution by word-of-mouth advertising, though it does advertise in various study abroad magazines.18
As part of its effort to enhance global education, the American Association of Community Colleges (AACC) has launched a Community College International Recruitment initiative to assist institutions with their international recruiting efforts and to elevate the profile of community colleges in global education and exchange. This will be accomplished primarily through a series of international recruitment fairs designed solely for two-year institutions. The recruitment fairs will be available on-line as well, thus extending their reach to students worldwide at no cost. In addition, AACC is developing both an International Student Study Guide to inform international students about American community colleges and a Web site to specifically address the questions and interests of international students. Information on these community college international recruitment services is available at www.aacc.nche.edu /internationalrecruitment.19
The Tidewater Community College presents a good example in their internationalization efforts. The College is comprised of four campuses in Virginia, located in the cities of Chesapeake, Norfolk, Portsmouth, and Virginia Beach. Its internationalization effort focused on faculty ownership and curriculum development. A group of core faculty worked cooperatively to secure state funding to develop an international curriculum. The state funds were utilized to send faculty abroad to pursue own development and to prepare updated modules of curriculum that would bring students into personal contact with events around the world. This process also established relationships with foreign institutions. Faculty from all disciplines were encouraged to take advantage of the international opportunities, even faculty in fields that are traditionally left out of internationalization efforts, including accounting, math, horticulture, and nutrition. The result is awareness throughout the college that all courses have potential for including international content and focus.20
The grants and funds secured by the Tidewater Community College for its international education program include the following:21
• State Council of Higher Education for Virginia, Funds for Excellence (for faculty/curriculum development seminars for one-month study with selected experts
• U.S. Department of Education, Fulbright-Hays Group Projects Abroad (for faculty/curriculum development seminars for four to six weeks in a country)
• U.S. Department of Education, Title VI-A for language and international projects • U.S. Department of Education, Fund for the Improvement of Postsecondary Education (FIPSE)
Disseminating Proven Reforms
18 Chase, Audree. Community Colleges’ Role in Recruiting International Students. 1998. 19 Irwin, Judith T. Community Colleges: Changing Individuals, Meeting Global Needs. 20 Global Community College. Tidewater Community College’s Internationalization Effort: Focusing on Faculty Ownership and Curriculum Development. 21 Global Community College. Tidewater Community College’s Internationalization Effort: Focusing on Faculty Ownership and Curriculum Development.
Appalachian Regional Commission 49 Global Competitiveness of Selected Industries and Clusters in The Appalachian Region

2.13.7 Troy State University, AL Size of Institution: 5,100 students at Troy campus, 25,000 worldwide Location: Troy, Alabama Degrees offered: Bachelors and Masters Type of Institution: Public University Size of International Program: 400 international students, undergraduate and graduate, from 50 countries Interviewee: Dr. Susan Aldridge, Vice President22
Troy State University (TSU) is comprised of five geographic regions with approximately 50 branches and teaching sites located in five countries and fourteen states. The campus located in Troy, Alabama is the main campus. The branches and sites are primarily based on or near military installations and serve military and civilian personnel and their dependents stationed on the bases. However, native populations are also welcomed to attend the branch schools or any school within the network. Campuses are located in the following areas:
• Atlantic Region: Norfolk Naval Station, Virginia; Washington, D.C. • Florida/Western Region: Davis-Monthan AFB, AZ; Ft. Carson, CO; Ft. Lewis, WA;, Ft. Walton
Beach, FL; Holloman AFB, NM; MacDill AFB, Tampa, FL; Malmstrom AFB, MT; New Orleans, LA; Pensacola Naval Air Station, Orlando, FL.
• Pacific Region: Anderson AFB, Guam; Camp Zama, Japan; Camp Henry, Hikam AFB, Hawaii; Kadena, Japan; Misawa AB, Japan; Osan AB, Korea; Fleet Activities Sasebo, Japan; Yokota, Japan; Yokosuka, Japan; Yongsan Army Garrison, Korea.
• Southeast Region: Ft. Benning, GA; Albany, GA; Augusta, GA; Atlanta, GA; Brunswick, GA; Ft. Bragg, NC.
The international branches are located in Hong Kong, India, Malaysia, Taiwan, Thailand, and Vietnam. Bangkok, Mumbai, and Hanoi, are new locations while campuses and branches in Japan and Korea have existed for over ten years. The campuses overseas vary in size, and are sometimes located on campuses of foreign universities. Troy State is seeking to add more locations while maintaining quality control by assessing degree programs, market competition, and demand for campuses. Troy State retains a long history in the commitment to internationalization. Most of the international students are full time undergraduate and graduate students, some of which receive scholarships. These scholarships include the following:
• International Student Exchange Scholarship: This scholarship, worth $1,000.00 per year is given to ten first time undergraduate students for one academic year. It entails a service requirement including participation in the International Student Cultural Organization (ISCO) annual festival and Community Service Projects that involve international awareness.
• Honor's Student Scholarship: This scholarship is for international undergraduate students who have completed 30 semester hours of credit at TSU and have a GPA of 3.0 or higher. It is $2,000 per year and is applicable as long as the student maintains a 3.0 GPA.
22 Dr. Susan Aldridge, interview by Krute Singa, telephone, 27 July 2003.
Appalachian Regional Commission 50 Global Competitiveness of Selected Industries and Clusters in The Appalachian Region
• Graduate Assistantships & Fellowships: Graduate Assistantships up to $9,500.00 per year are available through the Major Departments.
Troy State actively recruits international students. Staff from the Center for International Programs as well as faculty and administrative staff travel to foreign universities and attend education fairs. There exists a sophisticated network of people familiar with Troy State and many international students learn of Troy State through word of mouth. Though the University has campuses in some of the countries targeted for recruitment, Troy State encourages prospective students to attend school in the United States. This allows international students opportunity to experience life in the U.S., enhance the local culture, and promote local economic development. Troy has an easily accessible webpage for international students, relaying information on application procedures, costs, tuition, financial aid, English proficiency, and admissions criteria. Local Economic Development TSU is dynamically involved in the development of the local economy through international relations and coordination. The University is committed to bringing economic activities to Alabama by encouraging partnerships between international and U.S. firms. Troy State only establishes initial contact between the firms. It does not assume a managerial role once the partnership has been instituted. For example, if a former international student is looking to set up an office in Alabama, the University connects the student with banks and the economic development office, to facilitate the process. Troy State is committed to determining the right partnerships that will connect international students and foreign companies with jobs, the import and export market, key individuals in state and overseas, and U.S. businesses. The right partnerships are found through industry research, consulting the Chamber of Commerce, and market studies to ascertain the types of businesses located in the area and gain familiarity with small business owners. Most of the international-U.S. business relationships are facilitated by the College of Business at Troy State. The Business Departments also maintains programs that train foreign corporate executives in U.S. business practices. The executives are brought to Alabama where they meet with top officials and Troy State students, and gain familiarity with the economic climate of Alabama. This has proven to be a successful program, forming many business alliances. The executives usually attend one class at Troy State before returning to their home country. Establishing an economic development policy requires time and commitment as it takes many years to build relationships. Establishing campuses overseas necessitates up front work, involving talks with the education ministry of the country, deciding whether to set up the campus as a joint venture with a local institution or as a foreign organization, and discerning how to set up infrastructure necessary to meet academic standards without spending taxpayer money. Most importantly, the internationalization requires the commitment and support of the top officials of the University. The Chancellor, Board of Trustees, and staff and faculty throughout the system endorse the international focus. Dr. Aldridge emphasized that the international program could not subsist if top level encouragement did not exist. Internationalization is a concept and mindset that must permeate throughout the institution.
Appalachian Regional Commission 51 Global Competitiveness of Selected Industries and Clusters in The Appalachian Region

2.13.8 State University of New York (SUNY) Size of Institution: 403,000 on 64 campuses Location: New York State Degrees offered: Bachelors, Masters, and Associates Type of Institution: Public Size of International Program: 10,000 international students, undergraduate and graduate, from 170 countries Interviewees: Dr. John Rider Lori Thompson, Director for International Partnerships, Office of International Programs23
The State University of New York’s 64 campuses are divided into four categories, based on educational mission, the kinds of academic opportunities available, and degrees offered. The State University offers students a wide diversity of educational options, short-term vocational/technical courses, certificate programs, baccalaureate degrees, graduate degrees, and post-doctoral studies. The University offers access to almost every field of academic or professional study within the system offering 6,400 courses of study overall. Not all of the SUNY campuses have an international program. SUNY Binghamton has the largest international student population. The average length of stay for the international students is two to four years, depending on the school attended. Approximately half of the SUNY institutions are community colleges. Dr. Rider and Ms. Thompson are the system administrators for international programs campus wide. The main Office of International Programs initiates some programs with foreign universities campuses and coordinates with the campuses as well as providing overall information and facts about the international program. The individual campuses maintain their international programs and admissions. Dual Diploma Programs One of the recent programs the central Office of International Programs instigated is the Dual Diploma International Joint Program between select SUNY campuses and Turkish universities. The program allows undergraduate Turkish students to study in both the U.S. and Turkey, develop English language skills, and earn two undergraduate degrees from both SUNY and a Turkish University. The areas of study offered are economics, business, and global affairs. The SUNY campuses involved in the program are SUNY Binghamton, SUNY New Paltz, and SUNY Maritime College, while in Turkey, there are five universities involved. Turkish students pay tuition at home university and pay SUNY out of state tuition fees though they are eligible for financial aid from SUNY. The program was initiated in fall of 2003 in Turkey and the students will attend one of the three SUNY campuses in winter or spring 2004. For now, the program is available only for Turkish students but it may be opened to U.S. students as well, especially Turkish American students, once the program is more firmly established. The program is only for matriculating students. 23 Dr. John Rider and Lori Thompson, joint interview by Krute Singa, telephone, 25 July 2003
Appalachian Regional Commission 52 Global Competitiveness of Selected Industries and Clusters in The Appalachian Region

The development and establishment of the program required two years. The program was first promoted in 2000 when SUNY submitted and was awarded the New York State Linkages Grant for $125,000 to be utilized only for the travel expenses generated for the development of the program. The grant allowed SUNY officials to travel to Turkey for conferences and negotiations to decide on the subject areas and program details. A nine-member advisory committee was also established, involving the University Chancellor, Vice Chancellor of International Programs, Provosts at the three SUNY campuses, and directors for international programs from the campuses. On the Turkish side, the President for the Higher Educational Council and vice presidents from the universities participated. The establishment of the dual degree program was successfully facilitated as the Turkish university system is organized under a central office that coordinates all universities. Therefore, SUNY negotiated only with the central office to set up the program with the five universities. To aid in recruitment for the program, two Turkish agents were hired to provide information and application assistance. As a result of the efforts placed in this program, other joint research projects have developed:
• Turkey will be sending funded PhD students to develop research in the U.S.; • Istanbul Technical University is negotiating with SUNY Buffalo to establish a joint program in
earthquake research; and • A Dual Diploma program with Russia. Currently, there is a faculty and student exchange program
between SUNY and Moscow State University. Preliminary talks have occurred for a dual diploma program as well. However, difficulties in organization have been encountered as there is no central education office in Russia with which SUNY can coordinate as there was in Turkey.
SUNY Campus Best Practices Though the central office is responsible for infusing the international commitment throughout the SUNY campuses, they are not responsible for institutionalizing international programs at the campus level. Many of the campuses have high commitment to internationalization through innovative programs for international students and involvement in local economic development through coordination with foreign businesses. Examples of two campuses involved in such activities are SUNY Fredonia and SUNY Buffalo.
SUNY Fredonia Size of Institution: Undergraduate 4,900, graduates 400 Location: Fredonia, New York Degrees offered: Bachelors and Masters Type of Institution: Public University Size of International Program: 40 international students, undergraduate and graduate, from 15 - 20 countries Interviewee: Dr. Richard Goodman, Director of International Programs24
24 Dr. Richard Goodman, interview by Krute Singa, telephone, 30 July 2003.
Appalachian Regional Commission 53 Global Competitiveness of Selected Industries and Clusters in The Appalachian Region

The State University of New York at Fredonia is located in a rural region, halfway between New York City and Chicago. It offers a wide variety of majors in the arts, humanities, and the natural and social sciences, as well as professional programs in many areas. SUNY Fredonia is known for its business and music schools as well as speech therapy certificate programs. SUNY Fredonia is a relatively small school, averaging 5,000 students total, undergraduate and graduate. Its international student population is proportionate to the size of the institution, averaging 40 students per year. Most students pursue a bachelor’s degree, though the international graduate student population is increasing. SUNY Fredonia’s location is appealing to many foreign students as the rural area provides a safe and friendly environment. While the majority of international students are from Japan, there is a diversity of countries represented at SUNY Fredonia. The countries of origin include:
• Bahamas • Canada • France • Germany • Ghana • Haiti • Hong Kong • Japan • Pakistan • Russia • South Korea • Switzerland • Turkey
Recruitment and Admission Criteria Though SUNY Fredonia actively recruits students by sending faculty and staff to foreign countries to attend international education fairs, its reputation and international connections through alumni and business partners are primarily the reason why the international program continues to be successful. For example, Fredonia has established numerous business partnerships in Japan and other countries in Asia. These business partners send their children and family members to study at Fredonia. The University does not print brochures or advertise its international program due to the costs, though it is listed through SUNY in an international school directory. The Internet is also a valuable tool for prospective students, and Fredonia maintains an accessible link to its International Education Center webpage from the main University page, communicating information on applications, life on campus, support services, immigration application and information, and visa application procedure. International students are admitted based on the following criteria:
• Test of English as a Foreign Language exam (TOEFL) score • Past academic performance in high school or college • Ability of students to meet financial requirements
Financial Aid and Exchange Programs Fredonia does not offer financial aid to international students, though a small number of scholarships are available. Foreign students are required to pay the out of state tuition fee. In an effort to make education at SUNY Fredonia more financially accessible, several exchange agreements have been or in the process
Appalachian Regional Commission 54 Global Competitiveness of Selected Industries and Clusters in The Appalachian Region

of being developed. The agreements are primarily with countries that are economically underdeveloped or have government subsidized education. The exchanges will allow international students and U.S. students to study for one semester or year at SUNY Fredonia and the partnering foreign institution respectively. The program is a joint venture, designed to ensure that both international and U.S. students receive the best possible education and care. Developing the exchange programs required time and commitment. Communication is essential in the negotiating process. SUNY Fredonia initiated contact by visiting foreign institutions and exchanging information about academic programs. Fredonia faculty were enlisted in evaluating the academic programs offered by the foreign institutions. Fredonia will only partner with foreign universities of which it has personal knowledge and interaction with university officials. It is important to understand and be familiar with all universities on a firsthand basis. Several exchange programs have been established following these criteria, including one with an American University in Bulgaria, which started 8 years ago, and another with Aichi University of Education in Japan, a national university subsidized by the government. Dr. Goodman emphasized that exchange programs require patience and time. Relationships evolve naturally and slowly, but once a few have been established, setting up additional programs will become easier. As Fredonia’s reputation in international education has become recognized, foreign universities have also approached Fredonia to create exchange partnerships. Economics SUNY Fredonia has an Office of International Programs. The “programs” aspect is important as it indicates that the office not only is concerned with education, but also other factors associated with internationalization, including economic activity. Fredonia is personally involved with the economic vitality of local region, working with local businesses and industry leaders to expand their operations abroad, and acting as a liaison between local community and foreign markets. SUNY Fredonia’s economic assistance has proven successful; several local companies have conducted business with foreign companies. Dr. Goodman, Director of the Office of International Programs, maintains close contact with local community, continually striving to convince local businesses to think internationally. He and his staff have given numerous free presentations and seminars for the local business community. These seminars inform the community of the business opportunities available abroad, proper business conduct and custom according to country, and who to contact at the University to receive assistance in initiating international business relationships. Universities are well respected in both domestic and foreign business communities and local companies who are linked to universities have more credibility. Throughout his thirty-three year tenure at the Office of International Programs, Dr. Goodman has developed and maintained partnerships with business leaders throughout the world, especially in Japan. As his international focus is Japan, he has traveled there extensively, meeting with education officials as well as business executives. Once he has established partnerships, he makes it a point to meet with the officials and executives every time he travels to Japan. This way, Dr. Goodman maintains the connection and also demonstrates an understanding of Japanese business culture which places great importance on communication and personal interaction. He has also maintained contact with alumni from Hong Kong who have provided business connections, contacts and opportunities. One student who studied at SUNY Fredonia in 1970 is a finance director of the Hong Kong Airport and generously established a fund for the School of Business to promote international business. Business relationships were established with Hong Kong before the island was economically successful. Relationships with economically developing countries are important as they will be helpful in the future. One relationship leads to another, expanding the number of opportunities, if these relationships are properly maintained.
Appalachian Regional Commission 55 Global Competitiveness of Selected Industries and Clusters in The Appalachian Region

As Fredonia is a rural area, the food professing industry is the strongest sector and has the highest potential to be involved in the international market. In the 1980’s, it was not common for local businesses to be involved in international markets. To promote internationalization, the Office of International Programs coordinated with U.S. and foreign government agencies to facilitate three international trade fairs, taking local businesses to:
1. The International Wine Trade Show in Japan, 2. The Seoul American Food Fair in Korea for agricultural meetings, and 3. Furniture trade shows in various locations in Asia.
As a result of the International Wine Trade Show in Japan, local wineries export locally produced wine to Japan. This relationship has further been enhanced as the Japanese wine importers have sent their children to study at SUNY Fredonia. The trade fairs are one example of the activities that SUNY Fredonia has coordinated with local and international businesses. Other activities include a High Tech Mission with Japan. Japanese business professionals were invited to meet local businesses, resulting in strong partnerships with Japan that continually produces more contacts and relationships. These partnerships not only enhance the business community, but the University as well. SUNY Fredonia and Dr. Goodman’s commitment to economic development is an example of how Appalachian institutions, many of which are similar in size and location to SUNY Fredonia can become involved in international programs. Dr. Goodman has helped create a remarkable program that has lead to international investment and local business partnerships with foreign firms in a region that is mainly rural. He has assessed the market strengths of the region and relayed the information to businesses abroad. His commitment to keeping in touch with alumni is also providing good business opportunities. His belief that each relationship is real and personal has brought and continues to generate rewarding results. How to Establish International Economic Linkages to the Local Community To become involved in local and international market alliances requires commitment to community outreach. Institutions contain most of the resources required to establish international relationships and foster local economic development. Resources that can be tapped include the following:
• cataloguing the foreign experiences and backgrounds of faculty and staff, • assigning one person or office to act as outreach officer and talk to local and international
businesses, • enlisting the help of the Business School, and • inventorying the resources available at the institution.
Along with gathering the available resources, there has to be a change in the institution’s mindset. International student programs at institutions can do more than just process students. The role of the international program can be expanded to encompass a variety of international activities to create an atmosphere of cultural diversity on and off campus, including catalyzing contact with local businesses, launching informational seminars on what types of international opportunities exist for the local business community, and teaching intercultural communication to establish understanding of different business practices. Institutions have the resources and the ability to connect people from various backgrounds economically, politically, and culturally. If institutions are not able to undertake the level of commitment to local economic development as SUNY Fredonia, there are still many activities they can engage in to assist their local region in globalizing. Institutions have enough resources to convey helpful economic information. It is useful to inventory these
Appalachian Regional Commission 56 Global Competitiveness of Selected Industries and Clusters in The Appalachian Region

resources so that when local businesses do enlist an institution’s aid, they can be guided to the most appropriate resource and contact. SUNY Fredonia and its local community has benefited from the international programs. Students and the community have been culturally enriched and have become increasingly educated about foreign cultures. Local business has been stimulated through international student spending and alliances formed with foreign businesses. The University strongly believes that its role, especially since it is a state funded institution, is to assist the local community and its students achieve global awareness while maintaining ties to the region and values.
SUNY Buffalo Size of Institution: Undergraduate 17,290, graduate and professional 8,600 Location: Buffalo, New York Degrees offered: Bachelors, Masters, Doctoral, Professional Type of Institution: Public University Size of International Program: 3,700 international students, undergraduate and graduate Interviewee: Dr. Stephen Dunnett, Vice Provost for International Education25
SUNY Buffalo is the largest of the SUNY campuses. It is a member of the Association of American Universities, and is among the nation's top research-intensive public universities. The University offers strong medical, engineering, and computer science research and educational opportunities, and has a university wide commitment to public service and outreach to both local and global communities. SUNY Buffalo is primarily a graduate campus though it is attracting an increasing number of undergraduate students. The international student program averages 3,700 students per year, with two-thirds pursuing a graduate degree. Most students are matriculating, though there are approximately 100-150 students on one year exchange programs. Of the international students, 65 percent are from Asian countries. Latin American and African students tend not to apply to New York State or Appalachia as they are unable to afford the education. European student enrollments are declining as the European higher education institutions are of high quality and there is little value added to study at a U.S. institution. Therefore, Asian students comprise the majority of the international student population as they have the financial means and are high quality students. In 2003, the top 11 countries of origin for international graduate students were:
25 Dr. Stephen Dunnett, interview by Krute Singa, telephone, 8 August 2003.
Appalachian Regional Commission 57 Global Competitiveness of Selected Industries and Clusters in The Appalachian Region

1. India 2. China 3. Korea 4. Taiwan 5. Canada 6. Japan
7. Singapore 8. Malaysia 9. Romania
10. Germany 11. Turkey
The top 10 countries of origin for international undergraduate students are:
1. Korea 2. Malaysia 3. India 4. Japan 5. China
6. Taiwan 7. Canada 8. Indonesia 9. Pakistan
10. Singapore SUNY Buffalo offers some financial assistance to international students, the bulk of the aid going to graduate students for research assistantships or teaching assistantships. Fifteen to 20 percent of graduate students are supported by assistantships which give a stipend and waive tuition fees. Other graduate students study on fellowships or tuition scholarship programs, such as the Fulbright. There is some financial aid for undergraduate students as well. Approximately forty merit scholarships and a few tuition scholarships are handed out to students from countries the University is trying to attract. It is important to have a scholarship program to attract international students as the cost of education in the United States is too expensive for students of developing countries to afford. As building economic, political and cultural relationships with developing countries will be beneficial to the U.S. in the future, it is important to establish these relationships through hosting the students from these countries. Recruitment SUNY Buffalo actively recruits students through college fairs and recruitment fairs. However, most of the international students learn about the University through alumni and through their home universities for research opportunities. The Internet has also proven a useful tool and the SUNY Buffalo website provides an accessible link to an international student page from the main page. The University also contracts with Linden Educational Services, a non-profit company that arranges overseas recruitment fairs and trips. Linden Educational Services assists regionally accredited U.S. universities in their efforts to recruit, enroll, and serve international students. Linden staff members are professionals in international education, experienced overseas travelers and active members of NAFSA: Association of International Educators. The Linden Tours travel to Asia, Latin America and the Middle East to provide opportunities for admissions officials to meet international students who are interested in studying in the United States. The Linden webpage offers valuable information for international students about the U.S. education system, types of degrees offered, definitions of community college, college, and university, and testing requirements. Their website is found at www.lindentours.com. SUNY Buffalo has established numerous exchange relationships with institutions all around the world. Most of these exchanges were built with the assistance and foreign experience of faculty and staff. The relationships are based on a commonality of interest; the foreign university should be a good fit in terms of academics, atmosphere, and dedication. The exchanges that have been established resulted from a variety of demands, including:
• Academic interests. For example, researchers in the earthquake engineering department wanted links and research exchange partnerships to be set up with other centers around the world.
• Cultural interests. The exchange program with the Maharaja Sayajirao University of Baroda in India resulted from the desire of Indian American students to learn more about their culture and
Appalachian Regional Commission 58 Global Competitiveness of Selected Industries and Clusters in The Appalachian Region

have the opportunity to study abroad to learn about their heritage. To comply with their request, SUNY Buffalo solicited suggestions from the Indian community of Buffalo and also researched websites of higher education institutions in India. The University’s criteria for picking the potential exchange institution were based on 1) whether the institution’s goals and standards fit with that of SUNY Buffalo, 2) a location near an international point of entry but not in a large city, and 3) a strong humanities and social science program. After extensive research, the University selected the Maharaja Sayajirao University of Baroda (MSUB), initiating negotiations by sending a delegation. MSUB also benefited from the exchange through the medical educational options available at SUNY Buffalo. Currently, the SUNY-Baroda program is growing. Those in medicine and sciences at SUNY Buffalo go to Baroda to study abroad, signifying a growing appreciation for Indian education.
• Staff interests. Many staff members at SUNY Buffalo are immigrants who provided links and contacts to their home country and institutions to set up exchange programs.
• Faculty interests. For example, faculty from Romania established exchange programs with institutions in Poland and Romania.
Once exchange programs are established, the contacts and ties that result between the foreign institutions and SUNY Buffalo are extended to the community to aid in the building of business partnerships. Over time, the relationships that form between faculty, cities, and students on the exchange lead to economic development. Goals of SUNY Buffalo’s International Program The main goals of having an international student program for SUNY Buffalo are the cultural, financial, and economic benefits gained through interaction with foreign students, institutions, and businesses. Cultural Having an international presence globalizes the mindset and environment not only of the university, but the surrounding communities as well. Presently, U.S. students are not globally minded. Many do not even learn a second language. The goal of the international program at SUNY Buffalo is therefore to improve the global competitiveness of graduates and to instill an understanding of the rest of the world’s geography, language, and culture. The program seeks to break down barriers between cultures. The program is an educational tool for U.S. students as well as foreign students. The more foreigners who come to the U.S. take an appreciation of U.S. customs and products back to their home countries. They become U.S. allies and supporters of U.S. goods and services, and connect with the U.S. when they would like to engage in business opportunities. With each foreign student who embraces the U.S. lifestyle, the U.S. gains an ally and friend. Financial The financial gains of hosting an international student population are substantial and apparent. The SUNY Buffalo out-of-state tuition fee is $10,000 per year while in-state tuition is $4,000 per year. Foreign students pay the out-of-state tuition and the $6,000 differential is entirely kept by the University. As the University attracts approximately 4,000 students per year, each paying $10,000, it generates $40 million, nearly half of which stays on campus. This amount does not count incidentals and recreational spending by the international students that benefits the economies of the surrounding communities. When counting incidentals, nearly $60 million flows into Western New York from international students.
Appalachian Regional Commission 59 Global Competitiveness of Selected Industries and Clusters in The Appalachian Region

Economic With the relationships established through the international program, SUNY has and continues to promote and assist in improving the global competitiveness of businesses in New York State. The problem that SUNY Buffalo is faced with is the reluctance of local companies to compete globally as there is little knowledge of foreign markets and companies. The University has engaged in numerous activities to help local businesses participate in the global market, including:
• Providing consultation services and training in language, culture, and geography, as well as foreign market risk analysis.
• Receiving and sending trade delegations to foreign countries. • Fostering partnerships between local and foreign companies. The Business and Management
Departments at SUNY Buffalo helps connect U.S. business people with foreign companies, sometimes enlisting foreign alumni to receive the U.S. professionals in their home country.
• Supplying educated labor. International students bring linguistic and specialized skills and have strong work ethics. Additionally, the University produces students skilled in science and technology, management, computer science, and engineering who are recruited not only by U.S. forms, but by foreign businesses as well.
• Coordinating between local and state governments and foreign governments. Overall, the goal of the University is to break down misconceptions of foreign people and cultures through its extensive educational, outreach, recruitment and economic development efforts. As Dr. Dunnett states, the U.S. is becoming increasingly globalized in all aspects including culture, politics, and economics. It is therefore crucial for U.S. students to be exposed to international ideas and customs to develop an understanding of the world and to be able to compete effectively on a global scale.
Appalachian Regional Commission 60 Global Competitiveness of Selected Industries and Clusters in The Appalachian Region

2.14 Recommendations for Developing an International Program A comprehensively internationalized campus can foster an invaluable learning environment and effectively provide global experiences for both U.S. and foreign students.26 Institutions should promote diversity and cultural learning. Even if the institution is not diverse, it can be successful in convincing its students to understand other lifestyles and in broadening mindsets.27
It is important to remember that not all international students want to study in a large metropolitan area in the United States. Small towns provide a sense of community and provide a way for foreigners to see a U.S. lifestyle that is not normally encountered in a big city. As their view is already distorted by American sitcoms and political climate, small towns can improve an international student’s perspective to understand that there is more to the U.S. than fast cars and a big economy. These students then take back a positive image of the U.S..28
To establish an international program or to enhance an existing program, it is recommended to engage in the following:
• Establish clear commitment to internationalization and publicize this commitment so that international students feel safe in applying.
• Clearly articulate the goals of the international program.29 • Imbed internationalization in the co-curriculum, through international events, festivals,
lectures, and films.30 International students should be encouraged to contribute to the internationalization by giving presentations on their culture and countries.
• Form an international project team, led by a senior administrator to institute the international program.31
• Enlist support and involvement from top officials in the institution, including the president and chief academic officers. Time commitment and interest from leadership is essential.32
• Obtain faculty buy-in by:33 providing opportunities for faculty to travel and teach in foreign universities and conduct
research abroad. funding faculty international development
• Enlist the assistance of academic departments with recruiting and establishing international programs.34
26 Connell, Christopher. Internationalizing the Campus: Profiles of Success at Colleges and Universities. (2003), 11. 27 Connell, Christopher. Internationalizing the Campus: Profiles of Success at Colleges and Universities. (2003), 22. 28 Connell, Christopher. Internationalizing the Campus: Profiles of Success at Colleges and Universities. (2003), 32. 29 Engberg, David and Green, Madeleine F. Promising Practices: Spotlighting Excellence in Comprehensive Internationalization. (2002), 16. 30 Engberg, David and Green, Madeleine F. Promising Practices: Spotlighting Excellence in Comprehensive Internationalization. (2002), 16. 31 Engberg, David and Green, Madeleine F. Promising Practices: Spotlighting Excellence in Comprehensive Internationalization. (2002), 16. 32 Engberg, David and Green, Madeleine F. Promising Practices: Spotlighting Excellence in Comprehensive Internationalization. (2002), 11. 33 Engberg, David and Green, Madeleine F. Promising Practices: Spotlighting Excellence in Comprehensive Internationalization. (2002), 13. 34 Engberg, David and Green, Madeleine F. Promising Practices: Spotlighting Excellence in Comprehensive Internationalization. (2002), 14.
Appalachian Regional Commission 61 Global Competitiveness of Selected Industries and Clusters in The Appalachian Region

• Provide a venue for interaction between international and U.S. students. For example, Kapi’olani Community College in Hawaii has an International Café that provides a comfortable venue for international and UC student to congregate and learn from one another. Students give presentations about their culture and history at the café.35
• Take special measures to ensure that international students are integrated in the campus.36 • Show personal attention to prospective students by answering emails and questions. Keep
communication open throughout the application process and once the student is admitted and attending.37
• Provide support services for international students • Acquire funding through:
Federal and state grants38 Private fund raising39 Partnerships with business40 Funding sources: grants are given by the National Endowment for the Humanities, U.S.
Department of Education’s Title VI funding for international education programs, the Freeman Foundation which supports Asian studies on U.S. campuses, among many others. Grants can be used to pay for faculty exchanges, enrichment programs, visiting scholars, and library acquisitions to purchase more international books and journals.41
• Offer financial aid incentives to attract more diverse students and provide an easy mechanism to find out about these opportunities.42 There exist a number of ways international students can acquire financial aid:
Private loans to foreign students and families, particularly loans that permit co-signers from abroad.
Private funding: For example, Citi-Assist International Loans and Citi-Assist International Loans are both offered by Citibank. These loans have been operating successfully for years and only require that the student be enrolled at a participating school.
Institution and private cooperative loans. For example, the Duke MBA Opportunity Loan allows international students attending the Fuqua School of Business at Duke University in North Carolina, to borrow up to $30,000 per academic year with a 5 percent disbursement fee and interest rate of prime plus 2 percent. The partnership is a good example of the type of cooperation between institutions and the business community, in this case, Duke’s business school, SLM Corporation, and HEMAR Insurance Corporation.
35 Engberg, David and Green, Madeleine F. Promising Practices: Spotlighting Excellence in Comprehensive Internationalization. (2002), 15. 36 Engberg, David and Green, Madeleine F. Promising Practices: Spotlighting Excellence in Comprehensive Internationalization. (2002), 17. 37 Connell, Christopher. Internationalizing the Campus: Profiles of Success at Colleges and Universities. (2003), 22. 38 Engberg, David and Green, Madeleine F. Promising Practices: Spotlighting Excellence in Comprehensive Internationalization. (2002). 39 Engberg, David and Green, Madeleine F. Promising Practices: Spotlighting Excellence in Comprehensive Internationalization. (2002). 40 Engberg, David and Green, Madeleine F. Promising Practices: Spotlighting Excellence in Comprehensive Internationalization. (2002). 41 Connell, Christopher. Internationalizing the Campus: Profiles of Success at Colleges and Universities. (2003), 7. 42 NAFSA Association of International Educators. In America’s Interest: Welcoming International Students: Report of the Strategic Task Force on International Student Access. (2003), 20.
Appalachian Regional Commission 62 Global Competitiveness of Selected Industries and Clusters in The Appalachian Region

Tuition scholarships. The University of Oregon system offers out of state tuition remission to internationals if in return they provide services to the campus and local community including provision of translation services for local businesses and talks and presentations at local elementary schools about their countries and cultures.43
Publicly funded scholarship programs should be directed at countries or regions where they would serve a strong U.S. foreign policy interest. Areas including Africa where citizens are not able to afford a U.S. education and the country’s economic development is important to U.S. interests.44
• Design an accessible, user friendly, and understandable international admissions webpage located on the main webpage of the institution. International students usually look for the “prospective students” link on the main page. At a minimum, international students should be provided clear and easy access to:45
School description with costs and housing information International undergraduate and graduate admissions Proportion of international students at that university and class profiles Quotes from international students Requirements and documents that apply to international students Current information on visa with new SEVIS regulations.
2.15 Recruitment strategies
• Establish relationships with overseas education agents and brokers, American schools and other institutions abroad.46
• Host or attend higher education fairs abroad.47 • Use alumni to provide information about programs and application materials.48 • Recruit students in new and emerging markets where economies are growing (such as South
Africa).49 • Promote community colleges. Over the past few years, the number of international students
attending community colleges has grown by 9 percent compared with a 2 percent decrease in the number of international students attending four year institutions. Community colleges can be a solution to the problem of decreasing numbers of internationals coming to the United States.50
43 NAFSA Association of International Educators. In America’s Interest: Welcoming International Students: Report of the Strategic Task Force on International Student Access. (2003), 21. 44 NAFSA Association of International Educators. In America’s Interest: Welcoming International Students: Report of the Strategic Task Force on International Student Access. (2003), 21. 45 Education USA. How to Create an Internationally Friendly Website. 46 Wolanin, Thomas R. Strategies for Increasing the Enrollments of International Students in U.S. Postsecondary Education. (2000). 47 Wolanin, Thomas R. Strategies for Increasing the Enrollments of International Students in U.S. Postsecondary Education. (2000). 48 Wolanin, Thomas R. Strategies for Increasing the Enrollments of International Students in U.S. Postsecondary Education. (2000). 49 United States Information Agency and Educational Testing Service. U.S. Leadership in International Education: The Lost Edge. (1998). 50 United States Information Agency and Educational Testing Service. U.S. Leadership in International Education: The Lost Edge. (1998).
Appalachian Regional Commission 63 Global Competitiveness of Selected Industries and Clusters in The Appalachian Region

Interests of students, universities and colleges would benefit by the creation of a more coordinated, disciplined, and focused marketing of U.S. higher education. It could be a self-sustaining entity or managed by the Appalachian Regional Commission and would provide products and services including marketing, management, training, and information on the higher education institutions in the Appalachian region. The entity can be funded by the member institutions, Federal and state governments, and businesses.51
51 United States Information Agency and Educational Testing Service. U.S. Leadership in International Education: The Lost Edge. (1998).
Appalachian Regional Commission 64 Global Competitiveness of Selected Industries and Clusters in The Appalachian Region

CHAPTER 3: EXPORT MARKET ANALYSIS The following sections provide discussions on the international markets that have the best growth potential for Appalachian products. In particular, the discussions focus on six select industries that we identified to have growth potential in the ARC region. These manufacturing sectors based in the ARC region have competitive advantages in trade, and ample opportunities to flourish in the region through exporting their products to the global marketplace. The six industries are:
• Automobile parts • Household furniture
Wooden household furniture Upholstered household furniture
• Machinery Packaging machinery Food processing machinery
• Microelectronics Global market locations targeted for the six industries are very diverse. Markets include NAFTA economies (Canada and Mexico), Latin American countries (Argentina and Brazil), to Asian markets (Japan, Korea, China, Thailand and Taiwan), European economies such as Germany and Sweden, and eastern bloc countries like Poland, Hungary, Slovakia and Russia. The six industry sectors face a variety of issues and barriers competing in the assorted selection of global market opportunities. Table 3-1 presents a distribution of Appalachian exports by industry and destination. Table 3-1. Foreign Markets
Motor Food Upholstered Wooden
Vehicle Processing Packaging Electronic Household Household
Destination Parts Machinery Machinery Components Furniture Furniture
frica 0.6% 2.3% 1.4% 0.8% 0.9% 1.3%
sia 11.1% 20.8% 12.5% 30.2% 18.0% 28.4%
ustralia 1.2% 3.2% 3.9% 1.2% 0.9% 0.5%
anada 65.6% 20.6% 26.1% 25.6% 48.9% 42.6%
entral America 0.2% 3.3% 3.1% 1.4% 3.4% 7.0%
urope 10.3% 32.1% 38.1% 25.7% 22.3% 15.3%
ico 9.5% 8.5% 9.3% 9.9% 3.4% 3.0%
outh America 1.5% 9.3% 5.6% 5.1% 2.2% 1.8%
Appalachian Exports by Industry and Destination(Percent of Appalachian Industry Exports)
A
A
A
C
C
E
Mex
S
Sources: ITA, MISER, U.S. DOC through IMPLAN. Calculations by JFA.
Appalachian Regional Commission 65 Global Competitiveness of Selected Industries and Clusters in The Appalachian Region

3.1 Automobile Parts The automotive industry is the largest manufacturing industry in the United States. No other single industry is linked to as much of U.S. manufacturing or generates as much retail business and employment. The automotive parts industry serves two market segments—the original equipment market (OEM) for parts that get used directly in the production of vehicles, and the replacement/repair parts for after-market consumption. This industry group is classified as NAICS 3363.52 The U.S. businesses in this industry group include producers of stampings, carburetors, pistons, rings, valves, lighting, batteries, electrical equipment and other motor vehicle parts. The U.S. automotive parts industry has shipped over $200 billion in 2000, of which an estimated total of $38 billion (18%) was exported. The industry group has seen a decline (-5.5%) in employment between 1997 and 2001. However, its total value of shipment rose slightly from 1997 to 2001 by +5 percent (see Table 3-2). Table 3-2. Motor Vehicle Parts Manufacturing (NAICS 3363) Sector
Year Employees Total Value of Shipment ($1,000)
2001 736,003 186,838,6142000 802,575 204,336,0851999 799,174 202,797,0091998 789,564 184,476,0311997 779,913 178,511,569
Source: U.S. Department of Commerce: Bureau of the Census. Automobile parts exports increased from 1997 to 2001. Although the value of exports has declined in recent years, a longer term trend reflects upward tendencies in automobile parts exports (see Table 3-3). Table 3-3. Trade Data for Motor Vehicle Parts Manufacturing (NAICS 3363) Year 1997 1998 1999 2000 2001 Value of Exports (US $ millions)
36,230
36,716
39,280
42,288
39,076
Years 1997-98 1998-99 1999-2000 2000-2001 1997-2001 Change in Value 1.3% 7.0% 7.7% -7.6% 7.9% Source: U.S. Department of Commerce: Bureau of the Census; International Trade Administration (ITA) and Jack Faucett Associates (JFA). For Appalachian exporters of automotive parts, NAFTA economies (Canada and Mexico) present the largest export market, accounting for nearly 80 percent of all U.S. exports of automotive parts in 2002. The fastest growing market, in terms of the world region, is in Eastern Europe (Czech Republic, Hungary, Poland and Russia), with nearly 38 percent increase in U.S. exports from 2001 to 2002. However, the total export value to this market is a meager $95 million in 2002.53
Because the growth of the U.S. automotive parts industry is mainly affected by U.S. motor vehicle manufacturers’ continued demand for improved quality and lower costs, future growth for U.S.
52 NAICS – North American Industry Classification System 53 U.S. Census Bureau
Appalachian Regional Commission 66 Global Competitiveness of Selected Industries and Clusters in The Appalachian Region

automotive parts suppliers will continue to be technology-dependent. The U.S. market continues to demand more products meeting stringent environmental regulations, safety features, and fuel efficiency. The U.S. automotive parts industry increasingly supplies lightweight body materials, mechanical components, and safety parts. Such technology driven products can command better value-added returns in the global marketplace. There are a number of free trade agreements (FTA), some multilateral and others bilateral, that affect U.S. and Appalachia’s exports of automotive parts. For example, the U.S.-Central America Free Trade Agreement offers the potential for improved export and investment opportunities for the U.S. automotive industry. In 2002, the Central American economies purchased $133 million in U.S. auto parts. While the market currently has a limited size and purchasing power, the FTA can have the potential benefits in the long run. The CACM member nations signed a free trade agreement with the Dominican Republic in 1998 and are currently negotiating a free trade agreement with South American economies (MERCOSUR). Other economies with free trade agreements with CACM members are Chile, Mexico, Venezuela and Columbia. Another set of free trade agreements is known as the Free Trade Area of the Americas (FTAA). While it may provide a framework under which the U.S. automotive parts industry can better integrate its operations in the Western hemisphere, the multiplicity of existing and other FTAs being negotiated prevent clear assessment of outcomes for U.S. exporting opportunities. FTAA covers Northern, Central and Southern Americas from Canada to Argentina. There are FTAs like NAFTA, CACM, Andean Pact, U.S.-Chile FTA and MERCORSUR. Currently, there are negotiations taking place concerning MERCORSUR-EU, Mexico-EU FTA, MERCOSUR-Andean Pact, Mexico-Brazil auto agreement and Mexico-MERCOSUR FTA. FTAA may evolve to eliminate tariffs and other trade barriers for U.S. auto parts suppliers to all Americas in the long run. Exhibit 3-1 presents the distribution of Appalachia’s motor vehicle parts exports by state. Exhibit 3-1: Appalachian Motor Vehicle Parts Exports (State Share of Appalachian Exports)
0%
5%
10%
15%
20%
25%
Alabab
ama
Georgi
a
Kentuc
ky
Marylan
d
Mississ
ippi
New Y
ork
Sources: ITA, MISER, U.S. DOC through IMPLAN. Calculations by JFA.
N P Sorth C
arolin
aOhio
enns
ylvan
ia
outh
Carolin
a
Tenne
ssee
Virgini
a
West V
irgini
a
Appalachian Regional Commission 67 Global Competitiveness of Selected Industries and Clusters in The Appalachian Region

Competing in the global marketplace, the U.S. has three major competitors, Japan, Germany and France, as major exporters of automotive parts in the world. They command 12.8 percent, 12.8 percent, and 7.7 percent of the total global exports of auto parts respectively. The U.S. accounts for 19.6 percent of the total exports in the world market of automotive parts.54 For Appalachian exporters of automotive parts, NAFTA countries (Canada and Mexico), established Western European markets (Germany and Sweden), Asia/Pacific (Korea), and the Latin American (Argentina) markets offer good prospects for future growth. These markets provide either a large enough market size and/or disproportionately larger shares of U.S.-made goods in their import markets.
3.1.1 NAFTA: Canada The Canadian automotive parts market is estimated to be $45 to 50 billion in size. Over 80 percent of the market is served by foreign imports, and much of the imports originate from the U.S. The U.S. continues to be Canada’s principal supplier of automotive parts, accounting for over 86 percent of the total market. Currently, Appalachia’s manufacturers and suppliers of automotive parts to Canada are in the best possible position to take advantage of the Canadian market. While there are other foreign competitors (Japanese and European automotive parts manufacturers) completing against U.S. firms in Canada, the U.S. parts and aftermarket products dominate much of the Canadian market. The U.S. market position will remain unchanged for some time, and will continue to provide good exporting opportunities for suppliers located in the Appalachian region. Exporting to Canada from the U.S. is very straight-forward. There are virtually no trade barriers or impediments concerning automotive parts, components and aftermarket accessories. The U.S.-Canada Free Trade Agreement (FTA) went into effect in 1989. As a result, virtually all tariffs on U.S products entering Canada have been eliminated. NAFTA went into effect in 1994, removing some of the few remaining barriers. While some non-tariff barriers remain, trading of automobile parts between U.S. and Canada faces very few obstacles.
3.1.2 NAFTA: Mexico The automotive industry is one of the largest and fastest growing manufacturing sectors in Mexico.55 Auto parts and aftermarket supplies industry also represent a significant portion of the manufacturing sector in Mexico, and has been growing rapidly. The total market in Mexico for automotive parts and supplies is valued at more than $150 billion in 2002, with imports accounting for about 30 percent of the total market (see Table 3-4). The market for automotive parts in Mexico grew by 14.1 percent in 2001, and one estimate for the market growth rate in 2002 is put at 12.2 percent. One of the factors fueling an expanding automotive parts market in Mexico is the aging of existing vehicles. Local production of auto parts increased by 13.8 percent from 2001 to 2002, while imports increased by 8.7 percent during the same period. Competing in the Mexican auto parts market are German and Japanese suppliers. In 2001, the U.S. had a market share of 66 percent. Germany had a market share of 7.4 percent while Japan had a market share of 6.1 percent. The U.S. market share may decline when the newly completed Mexico-European Union free trade agreement comes into effect, liberalizing trade in automobiles and components.
54 U.S. Automotive Parts Industry/Market Assessment, Office of Automotive Affairs, Transportation and Machinery, International Trade Administration, U.S. Department of Commerce, May 2003 55 U.S. & Foreign Commercial Service and U.S. Department of State, 2003
Appalachian Regional Commission 68 Global Competitiveness of Selected Industries and Clusters in The Appalachian Region

Table 3-4. Mexican Auto Parts Market (UD $ billions) 2000 2001 2002
115.3 134.3 152.9 Total Market 87.5 101.5 117.7 Local Production 35.6 42.0 46.0 Imports 7.8 9.2 10.8 Exports
Imports from U.S. 23.4 27.6 32.5 Source: U.S. Department of Commerce: Bureau of the Census; International Trade Administration (ITA) and Jack Faucett Associates (JFA). For the Appalachia based suppliers, there are currently no major import barriers to auto parts market in Mexico because of NAFTA. This agreement removed all previous trade barriers and duties for several products improved from the U.S. including auto parts. The U.S. suppliers have been enjoying competitive advantage over European and Asian competitors. However, the newly completed free trade agreement between Mexico and the EU may increase a level of competition between American suppliers and European ones in near future.
3.1.3 Germany Most major German auto makers tend to outsource high technology components and parts. This trend of outsourcing high-tech components can deliver German auto makers cost savings in a competitive global market. At the same time, such trend presents business opportunities for Appalachia’s OEM suppliers of high-tech automotive parts. Increased investments by German firms such as those made by BMW in South Carolina and DaimlerChrysler in Alabama also provide further marketing opportunities for Appalachian parts manufacturers to German auto makers, and facilitate export opportunities of U.S. parts to Germany. Coupled with this favorable trend, German market for imported automotive parts and components is expected to grow at a moderate pace and the U.S. is expected to maintain its market share. Table 3-5 below shows market size data for auto parts in Germany. Table 3-5. Market Size Data for Automobile Parts and Accessories (US $ millions) 1999 2000 2001 2002-2004
Growth % Import Market 11,286 10,769 9,860 0-5% Local Production 38,020 37,076 41,860 Exports 5,854 5,846 16,744 Total Market 43,452 41,999 34,976 0-5% Imports from U.S. 1,680 1,784 1,711 0-5%
Source: U.S. Department of Commerce: Bureau of the Census; International Trade Administration (ITA) and Jack Faucett Associates (JFA). German automobile manufacturers are reputed for the quality and durability of their products. Their investment in research and development is relatively high. According to one estimate, German auto makers account for nearly 30 percent of all research and development investments that take place in Germany. In part due to a very competitive global auto market, and in part due to a high research and development cost, German manufacturers have been seeking lower production costs.
Appalachian Regional Commission 69 Global Competitiveness of Selected Industries and Clusters in The Appalachian Region

By importing and outsourcing specialized components from abroad, they have achieved this goal. American parts have earned a good reputation among German buyers over the years. As shown in Table 3-5 above, the German imports market for auto parts is small. However, there is an upside opportunity for U.S. exporters. There is a slight increase in imports from the U.S. between 1999 and 2001, and a gradual growth in this sector is expected. Main competitors in the German auto parts import market are the U.S., U.K., France, Japan, Belgium, Austria and Italy. Amongst the competitors, the U.S. accounts for most of the import market share—17 percent. U.K. is estimated to hold roughly ten percent of German import market share. Japan also controls about 10 percent of the import market. There are no major trade barriers preventing Appalachian firms from entering the German market. This is due to EU-U.S. FTA. Customs duties for automotive parts and accessories into Germany are about five percent.
3.1.4 Sweden Sweden is a good marketplace for high-end, technically sophisticated automotive parts and aftermarket accessories. Automotive components related to ‘safety’ or ‘environment’ aspects of vehicles have higher prospects in the Swedish import market. In addition, parts and products related to the Swedish climate such as engine heaters, roof rack systems for transporting cargo and skis face positive outlook in both OEM and aftermarket auto parts market. In 2000, the total imports of automotive parts into Sweden were estimated to be over $2.6 billion. The import market in Sweden is expected to grow at an annual average rate of 5 percent between 2001 and 2003. During the same period, the total amount of imports of auto parts from the U.S. to Sweden is expected to grow by 5 percent as well. The Swedish auto parts imports market presents positive growth potential for U.S. and Appalachia based suppliers. Suppliers that provide brake systems, steering systems, gearboxes, transmissions and body parts have great exports prospects in the Swedish market. Competing in Sweden, U.S. suppliers hold a relatively minor market position compared to their German counterparts. German suppliers are the by far the largest group that sell automotive parts to Sweden, with a market share of 33 percent among imported automotive parts, components, accessories and other supplies. Other European countries like the U.K. and Belgium have a strong foothold in the Swedish automotive import market. While not a dominant player in Sweden by the absolute measure, U.S.-made automotive parts are very competitive and successful. It is estimated that U.S. imports of auto parts and components account for about 5.4 percent of the Swedish imports market. However, the figure does not include U.S.-made parts that enter Sweden via other non-Swedish European ports. If these items were counted, U.S. imports of auto parts and supplies may amount to 7 or 8 percent of all auto parts imports in Sweden. Exporting to Sweden faces no impediments as there are no barriers. Customs duties are relative low at 3 to 4.5 percent for most automotive parts and supplies. There is a value added tax of 25 percent on all such products regardless of origin—thus locally made parts do not gain much advantage over any foreign products using domestic tax structures.
Appalachian Regional Commission 70 Global Competitiveness of Selected Industries and Clusters in The Appalachian Region

3.1.5 Korea While the Korean economy has yet to completely rebound from the 1997 financial crisis, there are signs of growth in the economy in recent years. In 2000, it is estimated that Korea’s automotive parts and accessories market grew by 11 percent over 1999, and had a total value over $17 billion. In the same year, the Korean automotive parts and accessories market imported over $1.2 billion. It is projected that between 2002 and 2004, the overall market size will increase at an annual average rate of 5 percent. As the overall market demand increases, it is also anticipated that imports will increase faster than domestic supplies. Imports of automotive parts and accessories account for 6-7 percent of the total market demand because most of the OEM and aftermarket demand is met locally by Korean and joint-international venture firms. Major international partners that participate in the joint ventures include Delphi (U.S.), Bosch (Germany), Valeo (France), and Visteon (U.S.). Over the years, international firms have been increasing their operations and investment in the Korean market. The number and sizes of the Korean auto parts suppliers tend to be smaller than what is observed in the global automotive market. Whereas Korea now has only two major automobile manufacturers, both in the top 20 assemblers in the world, Korea does not have a parts supplier that is in the world’s top 50. There are many smaller suppliers ranging from 500 to 600. This number is expected to dwindle to 200 to 300 in near future, according to industry experts. It is expected that the import market will grow slightly. Currently, direct imports of automotive parts and accessories into Korea are primarily supplied by Japan, the U.S. and Germany. In 2000, Japanese suppliers filled nearly 50 percent of the total imports while the U.S. accounted for about 21 percent of total imports, valued at $253 million. German firms accounted for 11 percent of total imports in the same year. There are opportunities for U.S. and Appalachian suppliers to gain more of the import market share in coming years. Table 3-6 displays market size data for auto parts and accessories in Korea. Table 3-6. Market Size Data for Automobile Parts and Accessories (OEM and Aftermarket) (US $ millions) 1999 2000 2001
(projected) 2002-2003 (projected)
Import Market 950 1,206 1,200 9% Local Production 16,546 18,100 18,000 5% Exports 1,679 1,746 1,800 7% Total Market 15,817 17,560 17,400 5% Imports from U.S. 208 253 252 10%
Source: U.S. Department of Commerce: Bureau of the Census; International Trade Administration (ITA) and Jack Faucett Associates (JFA). While, a great majority of the total auto parts and accessories market is supplied by either domestic manufacturers or joint-venture companies, the Korean market for auto parts still requires foreign imports for several core components and parts, such as automatic transmissions, electronic engine parts, and airbags. Korean suppliers are not as competitive in the more technologically advanced segments of automotive parts, and continue to depend on foreign imports to provide solutions with newer technology. After Japan, the U.S. is the second largest foreign supplier to Korea. Japan’s solid market position is in part due to its geographic and cultural proximity. Also, many Korean auto makers have had technology transfers from Japan for decades, resulting in Japan’s dominant market share in automotive parts imports. The U.S. and European competitors must compete under less favorable circumstances in terms of prices, technical services, and transportation costs. There is a tariff rate set at 8 percent of the CIF (cost,
Appalachian Regional Commission 71 Global Competitiveness of Selected Industries and Clusters in The Appalachian Region

insurance and freight) value when importing automotive parts and accessories into Korea. However, circumstances may be improving for U.S. suppliers as more favorable views on foreign automobiles gradually take a hold among the general public in Korea. In addition, a recent acquisition of the bankrupt Daewoo Motor Company by GM (in October 2002), and revival of Daewoo automobile production in Korea under a new management (GM Daewoo) would introduce more U.S.-made parts to Korean automotive industry sector. Although there are good prospects in Korea for U.S. suppliers of automotive parts and components, there are barriers to exports. Exporting to Korea is encumbered by the lack of transparency in rule making in the regulatory system which is one of the principal problems cited by exporters. It is alleged that Korean officials exercise certain discretion in applying laws that are drafted using broad language, resulting in inconsistency in application and uncertainty among businesses. Such vague laws or regulations may be reinterpreted and then applied differently depending on business cases at different times. These transparency-related problems affect market entry in automotive sectors. Furthermore, Korean markets still hold an anti-import bias that affects auto sectors in particular. While there are no evident campaigns against imports currently, the legacy of anti-import activities dating back decades tends to negatively impact the market entry momentum of some U.S. suppliers. Korean government agencies are mending such bias by equipping several official fleets with imported automobiles in recent years. As attitudes towards imported automobiles improve, there will be more favorable views on imported automobile parts and components.
3.2 Household Furniture (Wood and upholstered) U.S. household furniture industry is classified as NAICS code 337. Under this broad classification, upholstered household furniture manufacturing and non-upholstered wood household furniture manufacturing sub-sectors are classified as NAICS 337121 and 337122, respectively. They produce household furniture and related articles as classifications titles indicate. Combined, this industry group has shipped nearly $20 billion worth of merchandise in 2001. During the same year, the industry group had over 210,000 workers. The sector has experienced slightly increasing shipment volumes and employment in recent years, but the overall trend is fairly flat. Upholstered household furniture manufacturing (NAICS 337121) sector had its value of shipment increase by over 13 percent between 1997 and 2001. During the same period, the value of non-upholstered wood household furniture manufacturing shipments rose by 5 percent. While the total value of industry output has risen in recent years, employment has not kept up with the increase in output (see Tables 3-7 and 3-8). Table 3-7. Upholstered Household Furniture Manufacturing (NAICS 337121) Sector
Year
Employees Total Value of Shipment ($1,000)
2001 88,025 9,318,252 2000 94,248 9,608,430 1999 94,010 9,601,031 1998 92,426 8,971,462 1997 89,215 8,232,635
Appalachian Regional Commission 72 Global Competitiveness of Selected Industries and Clusters in The Appalachian Region

Table 3-8. Non-upholstered Wood Household Furniture Manufacturing (NAICS 337122) Sector
Year
Employees Total Value of Shipment ($1,000)
2001 122,774 11,860,891 2000 133,884 12,990,611 1999 134,169 12,995,810 1998 132,404 12,372,652 1997 127,703 11,318,807
Source (for both tables): Annual Survey of Manufacturers, Industry Statistics, U.S. Census Bureau, Dec. 20, 2002. The furniture industry in the U.S. has been losing domestic market share to imports for the past two decades despite being amidst a very robust housing market. In the upholstered furniture sector, U.S. exports exceed imports. In the wood household (non-upholstered) furniture sector, however, the U.S. has been losing most of the furniture market share to the imports in recent years. During the 1990s, the U.S. trade imbalance for the wooden household furniture sector increased by 400 percent from -$1.9 billion in 1990 to -$7.3 billion in 2000.56 The data suggests that the U.S. household furniture industry has been experiencing increasing competition in the global marketplace. Internationalization of distribution and production in the global economy has affected the furniture industry as well. Open markets have allowed furniture trade to move ahead at a very fast pace. The trade of furniture has grown much more rapidly than furniture consumption. Currently, the largest import markets for furniture are the U.S., Germany, France, U.K., and Japan. For the U.S. furniture manufacturers, NAFTA (Canada & Mexico) area, Germany, Korea, Saudi Arabia, and the United Arab Emirates represent leading export markets. Respectively, Exhibits 3-2 and 3-3 present the distribution of Appalachia’s upholstered and wooden household furniture exports by state.
56 “Competitiveness of U.S. Wood Furniture Manufacturers – Lessons learned from the softwood moulding industry.” Forest Products Journal, Vol. 51., No. 7/8 (July/August 2001)
Appalachian Regional Commission 73 Global Competitiveness of Selected Industries and Clusters in The Appalachian Region

Exhibit 3-2: Appalachian Upholstered Household Furniture (State Share of Appalachian Exports)
0%
5%
10%
15%
20%
25%
Alabab
ama
Georgi
a
Kentuc
ky
Marylan
d
Mississ
ippi
New Y
ork
North C
arolin
aOhio
Penns
ylvan
ia
South
Carolin
a
Tenne
ssee
Virgini
a
Wes
t Virg
inia
Exhibit 3-3: Appalachian Wooden Household Furniture (State Share of Appalachian Exports)
0%
5%
10%
15%
20%
25%
30%
35%
40%
45%
Alabab
ama
Georgi
a
Kentuc
ky
Marylan
d
Mississ
ippi
New Y
ork
North C
arolin
aOhio
Penns
ylvan
ia
South
Carolin
a
Tenne
ssee
Virgini
a
West V
irgini
a
Sources for both: ITA, MISER, U.S. DOC through IMPLAN. Calculations by JFA.
Appalachian Regional Commission 74 Global Competitiveness of Selected Industries and Clusters in The Appalachian Region

3.2.1 Asia/Pacific: Korea In 2002, Korea was the 6th largest export market for the U.S. The nation's retail industry has helped the recovery of the domestic economy since the currency crisis in 1997, exhibiting rapid growth in 1999 and 2000. In fact, the market size of the domestic retail market, in terms of sales, has continued to grow at an average annual growth rate of about 8 percent since 1999, and reached 115 trillion in 2001, or 24 percent of the nation's GDP. According to the Korean National Statistical Office, in 2002, consumer confidence reached its highest level since November 1998. Average household income has risen considerably, and the average monthly spending for urban salaried workers’ households on goods and services is increasing. Such trends in increased consumer spending on furniture is reflected in increased export of household and upholstered furniture from the U.S. to Korea in 2002 as shown in Table 3-9. Table 3-9. U.S. Export: Household and Upholstered Furniture (FAS Value. US $1,000) 1996
1997 1998 1999 2000 2001 2002 % change 01-02
Korea 14,286 16,003 2,129 5,910 9,933 7,001 19,047 172.0% Note: F.A.S. represents the value of shipments via freight, air and ships including freight charges, insurance and other costs. Source: U.S. Department of Commerce: Bureau of the Census; International Trade Administration (ITA). Korea’s average tariff rate was 8.9 percent in 2001 and Korea will reduce tariffs to zero on most of all products in the furniture sector by 2004. Although there are good prospects in Korea for U.S. suppliers of household furniture, there are barriers to exports.
3.2.2 NAFTA: Canada The Canadian furniture market, especially the household wooden and upholstered furniture sectors, has undergone renewed growth in the last several years in part due to a strong housing market, a robust demand for home renovation, and stronger consumer confidence. Market demand for household furniture in Canada is largely a function of the rate of household formation, housing construction starts and income growth. The housing sector has remained relatively healthy despite recent economic downturns. Canada’s total furniture market is estimated to be about $4 billion, and this market is projected to grow at an average annual rate of 10 percent over the next several years. The Canadian household furniture sector accounts for 35-40 percent of the total furniture market. Approximately 45 percent of this market is attributed to wooden furniture, and 30 percent to upholstered furniture. U.S. exports of furniture products to Canada take a predominant position in Canada’s import market. Over 70 percent of all furniture imported into Canada originates from the U.S. While imports from China, Italy, Taiwan, Malaysia and Mexico also compete with the U.S.-made household furniture products in Canada, their combined import market share adds to less than one third of that of the U.S. furniture suppliers. This success of U.S. furniture suppliers over others can be attributed to geographic proximity, common design, similar quality demand, tariff-free entry, and familiar distribution channels.
3.2.3 NAFTA: Mexico The size of the Mexican household furniture market is valued to be well over $500 million. The Mexican wooden furniture market alone is estimated to be over $400 million. From 1996 to 2002, the total value of U.S. exports of household wooden furniture and upholstered furniture products increased from $60 million to $84 million (an increase of 40 percent in six years).
Appalachian Regional Commission 75 Global Competitiveness of Selected Industries and Clusters in The Appalachian Region

The major trading partners in this sector are the U.S., Spain, Italy, China, Canada and Taiwan. American suppliers hold a dominant market share of nearly 70 to 75 percent in the Mexican furniture import market, and the others hold relatively smaller market shares. For Appalachia based suppliers, there are no major import barriers to the household furniture market in Mexico as part of NAFTA. NAFTA removed all previous trade barriers and duties for several products imported from the U.S. including household furniture products. American manufacturers face duty free imports, while imports from other countries into the Mexican market face an average of 25 percent import duties. In addition, American suppliers enjoy geographical proximity and a good reputation built over many years of competing in Mexico. While others must compete in the marketplace with higher tariffs, they must also incur greater transportation costs. However, it is anticipated that American suppliers will begin to face more competition from European counterparts. There is a recently signed Mexico-European Community Free Trade Agreement, under which tariffs on European wooden furniture fell from 25 percent to zero starting in 2003.
3.2.4 Middle East: Saudi Arabia The Saudi market is the largest furniture market in the Middle East, and is relatively protected. It is estimated to be about $600 million of which 60 percent is for household furniture. The Saudi furniture market is mainly served by imported products. Seventy percent of furniture sold is imported while 30 percent of market demand is met by domestic production. However, this ratio is gradually shifting as Saudis domestic production share is increasing. The whole market is expected to grow at an annual rate of 7 to 8 percent for the coming 3 or 4 years. The U.S. market share is one of the largest amongst the foreign competitors. The main suppliers for the Saudi furniture market include Italy, Asian producers, France, Spain and the U.S. Italy holds the largest share in the market with about 22 percent. The Far East suppliers hold about 7 percent. France has a 6 percent share and Spain about 5 percent. American suppliers have about 16 percent. While Italy holds the largest market share, its position has been declining. The U.S. exports of furniture to Saudi Arabia have been rising at a very rapid rate, taking away some of the Italian share of the market. From 1999 to 2001, the Saudi household furniture market experienced increases in imports from U.S. suppliers at an annual average rate of 10 percent. Demand for American furniture is high among affluent and middle class Saudis. It is especially high among the population segments that have spent time in the U.S. Wooden furniture is very popular, and American or Canadian wood products are in high demand. Exporting to Saudi Arabia is not without barriers. The Saudi market is not fully open. There is a 5 percent custom duty levied on all imports of furniture. In addition to facing tariff barriers, U.S. suppliers must overcome non-tariff, and otherwise technical obstacles. While there are no standards in effect on imported furniture, religious concerns prohibit any likeness or replica of human and animal forms on furniture products. Imported goods are inspected to ensure no carvings or engravings displaying such figures.
3.2.5 Middle East: United Arab Emirates (UAE) Although the United Arab Emirates (UAE) furniture market is relatively small compared to that of Saudi Arabia, the UAE furniture market has grown at a very remarkable pace in recent years. It has experienced a double-digit rate of annual growth since 1999. According to one estimate, the market size will grow at a rate of 10 to 12 percent over the next several years. In 1999, the UAE furniture market was estimated to be about $255 million.
Appalachian Regional Commission 76 Global Competitiveness of Selected Industries and Clusters in The Appalachian Region

Construction and tourism are two sectors of the UAE economy that have in part fueled demand for household furniture. Imported household furniture meets roughly 80 percent of the total market demand household furniture. Meeting this demand, Italian suppliers have secured a strong foothold in the imported furniture marketplace with a market share of 28 percent. U.S. suppliers are second with 11 percent of the imported furniture market in the UAE. Demand for American-style wooden furniture is the driving force behind increased growth in exports from the U.S. Such wooden furniture accounts for over 80 percent of all furniture exported to the UAE from the U.S. Overwhelming segments (over 80%) of the UAE population have been to the U.S. for vacation, business or education. As a result, the vast majority of the UAE population is very familiar with American-style wooden household furniture. In addition, a substantial population segment of expatriates living in the UAE proves to be a good market segment for U.S. suppliers. The value of the U.S. export share is expected to grow by an average of 18 percent annually for several years as there are strong preferences for American wooden furniture. Exporting to the UAE is a fairly straight-forward process. Unlike other Middle Eastern markets, there are no significant trade barriers to the importation and sale of household furniture in the UAE. Customs duties are 4 percent.
3.3 Machinery (Packaging and Food Processing) U.S. packaging machinery and food processing machinery industry sub-sectors are classified in NAICS code 333993 and 333294, respectively. They produce very specialized machines and tools such as packaging equipment and processing equipment for food, dairy, beverage and related sanitary processes. This industry shipped nearly $4.8 billion worth of merchandise in 2001. During the same year, the industry had over 1,500 establishments employing about 45,000 workers. The sector has experienced declining shipment volumes and employment in recent years. The total value of packaging machinery manufacturing (NAICS 333993) shipments decreased by over 13 percent between 1997 and 2001. During the same period, the value of food products machinery (NAICS 333294) shipments shrunk by 5 percent (see Tables 3-10 and 3-11). Table 3-10. Packaging Machinery Manufacturing (NAICS 333993) Sector Year Employees Total Value of Shipment
($1,000) 2001 27,923 4,229,635 2000 29,259 4,615,645 1999 31,000 4,689,757 1998 32,385 4,928,283 1997 32,109 4,900,477
Appalachian Regional Commission 77 Global Competitiveness of Selected Industries and Clusters in The Appalachian Region

Table 3-11. Food Product Machinery Manufacturing (NAICS 333294) Sector Year Employees Total Value of Shipment
($1,000) 2001 17,733 2,707,791 2000 18,376 2,860,402 1999 19,102 2,899,710 1998 19,054 2,906,838 1997 18,898 2,857,928
Source (for both tables): Annual Survey of Manufacturers, Industry Statistics, U.S. Census Bureau, Dec. 20, 2002. Between 1997 and 2001, U.S. exports of packaging and food processing machinery have fallen by 20 percent, while imports of such industrial equipment swelled by over 30 percent during the same period.57 Such trends are also noticeable in the industry data collected for 2001. The industry, in 2001, faced growing U.S. domestic market demand, while experiencing a decline in both exports and shipments to the domestic market. Some imports would satisfy the unmet demand in the marketplace. The total exports of packaging and food processing machinery, as a percent of total U.S. shipments, have been declining in recent years. In 2001, exports accounted for 15.5 percent of total shipments, down from 17.1 percent in 2000, 17.8 percent in 1999, and 21 percent in 1997.58
Although this industry has been experiencing reduced value of total shipments in recent years, the long term trend continues to mirror the growing global demand. For thirty years, “the estimated value of world trade in processed foods has increased by an average annual rate of more than 10 percent.” In addition, over 2/3 of agricultural products traded in the international market is in processed food and beverages. More markets face increasing demand for processed food and beverages as developing countries experience economic and cultural changes stemming from industrialization, urbanization and rising wealth. It is expected that worldwide demand for processed foods will continue to increase in the future.59
In the global marketplace, the following countries are leading markets for U.S. exports of food processing and packaging machinery: Canada; Mexico; China; Thailand; Poland; Argentina; and Brazil. Considerations were given to total value exported to these markets as well as growth rates, economic forecasts, trade barriers and other factors.60
In addition to these markets, Japan, the EU, Australia and other locations present opportunities for exporting packaging and food processing equipment. The following section will discuss potential markets, opportunities and possible barriers of trade in terms of region, country, market size, type of barriers and export outlook: Exhibits 3-4 and 3-5 present the distribution of Appalachia’s food processing machinery and packaging machinery exports by state respectively.
57 Office of Machinery, International Trade Administration (ITA), U.S. Department of Commerce (webpage updated 10/2002) 58 PMMI Eighth Annual Shipments & Outlook Study (2003) 59 Office of Machinery, ITA, U.S. Department of Commerce 60 ditto
Appalachian Regional Commission 78 Global Competitiveness of Selected Industries and Clusters in The Appalachian Region

Exhibit 3-4: Appalachian Food Processing Machinery Exports (State Share of Appalachian Exports)
0%
5%
10%
15%
20%
25%
30%
Alabab
ama
Georgi
a
Kentuc
ky
Marylan
d
Mississ
ippi
New Y
ork
North C
arolin
aOhio
Penns
ylvan
ia
South
Carolin
a
Tenne
ssee
Virgini
a
Wes
t Virg
inia
Exhibit 3-5: Appalachian Packaging Machinery Exports (State Share of Appalachian Exports)
0%
10%
20%
30%
40%
50%
60%
70%
Alabab
ama
Georgi
a
Kentuc
ky
Maryland
Mississ
ippi
New York
North C
arolin
aOhio
Penns
ylvan
ia
South
Carolina
Tennes
see
Virginia
West V
irginia
Sources for both: ITA, MISER, U.S. DOC through IMPLAN. Calculations by JFA.
Appalachian Regional Commission 79 Global Competitiveness of Selected Industries and Clusters in The Appalachian Region

3.3.1 Asia/Pacific: China China is one of the world’s fastest growing markets despite recent downturns in the global economy. Rapid development and success among the Chinese are increasingly altering traditional diet and eating preferences. As China modernizes, people have less time to prepare food in traditional ways. With less time to make traditional meals and a growing appetite for western-style packaged food items, there is rising demand for processed, packaged food products. Currently, China only processes about 25 percent of its total food output. In comparison, the U.S. and other developed economies have over 90 percent of their food processed and packaged. China’s growing market for handling, processing and packaging food products calls for investing in more equipment to meet the demand. In a way, the rush for food processing and packaging equipment has already begun. According to the U.S. Department of State Commercial Service, China’s market has seen tremendous expansion, and there is much more growth potential. A total of $18.1 billion worth of food processing and packaging equipment entered China in 1998. In 1994, China imported such equipment valued at only $800 million. An increase of over 126 percent from 1994 to 1998 offers an indication of fast growing demand for processed, packaged food products in China. Chinese domestic output of the food processing and packaging industry has picked up, and is expected to increase at a rate of 13 to 14 percent per year. In addition, there is a growing need to upgrade existing equipment for the industry. U.S. exports to China face a very competitive market. Mainly, equipment originating from Japan, the EU (primarily Germany) and Taiwan dominate China’s imports market for food processing and packaging machinery. Japanese equipment exports to China currently account for about 27 percent of the total imports. European, particularly German, machinery manufacturers have a strong presence in China. Germany controls nearly 22 percent of the imported food processing machinery market. The Taiwanese control about 16 percent of the imports market, while U.S. exporters have a market share of about six percent. While opportunities exist, barriers to China’s food processing and packaging equipment market for many U.S. and Appalachian firms are numerous. High tariffs constitute an effective import barrier. Under the WTO bilateral agreement, China’s industrial tariffs will fall from an overall average of about 17 percent to an average of 9.4 percent. While import tariffs are falling after China’s accession to the WTO, there are still other institutionalized non-tariff barriers. Chinese import quotas are largely non-transparent. Import licensing and other administrative control systems add more obstacles in penetrating China’s lucrative imports market for food processing and packaging equipment. Other non-institutional barriers may be overcome by many U.S. companies by investing in understanding the needs and culture of Chinese end-users. According to some Chinese industry sources, Americans’ lack of familiarity with Chinese culture and customs weakens their market competitiveness whereas Japanese and German exporters cater to China’s needs with higher satisfaction rates.
3.3.2 Asia/Pacific: Thailand Thailand is another growing market that may bring positive opportunities for the U.S. manufacturers of food processing and packaging machinery. Increases in investment, export demand, and domestic sales of processed foods have been translated to a rising demand for food processing and packaging equipment. Thai food companies have been investing in equipment and materials to meet local and international demand for packaged food products. Trade sources estimate a double-digit growth rate for the market for food packaging equipment over the next few years. Equipment used in filling, closing, sealing, and labeling of bottles, cans, boxes, bags and other containers used in packing food items are expected to present ample opportunities for foreign equipment in the next several years. There are ongoing talks
Appalachian Regional Commission 80 Global Competitiveness of Selected Industries and Clusters in The Appalachian Region

between Thailand and the U.S. concerning a bilateral free trade agreement. This agreement stands to affect automotive, textile and agricultural products that Thailand exports to the U.S. While the current pursuit of an agreement between the two economies may impact foreign multinational corporations involved in automotive and clothing industries, many Thai food processing and other packaging businesses may draw benefits from a future bilateral agreement between the two economies. Increasing activities in the packaging and food processing industry will in turn create demand for additional equipment, much of which comes from foreign, including American, suppliers. The market for packaging and processing machinery in Thailand is a competitive one. There is little competition from Thai domestic packaging equipment manufacturers. The Thai food processing and packaging industry imports much of its equipment from Japan, Germany and Italy. In 1999, Japanese suppliers had a market share of 21 percent, followed by Germany 14.5 percent, and Italy 13.6 percent. The U.S. had a market share of 12.7 percent in 1999. Many foreign suppliers face similar competition as Thailand promotes an open market and free economy. There are no restrictions or technical standards imposed by the Thai government. Food processing and packaging equipment faces no import tariffs. While the marketplace is level, food regulations and standards that govern Thai food exporters in the international export markets tend to benefit U.S. suppliers of food processing and packaging equipment. One barrier some of the U.S. exporters face is that of the non-tariff/non-institutional kind. U.S. suppliers generally provide larger scaled, high-technology packaging and processing equipment and much of the Thai food industry cannot utilize larger U.S. machines. Small and medium businesses in the Thai food industry either cannot afford hefty investments or find larger scale equipment unsuitable. While many American machines used in packaging and food processing command a good reputation for quality and advanced technology, scale and cost of products often range outside what local food processors can afford. Provision of smaller, versatile and more scalable products may erode this obstacle.
3.3.3 NAFTA: Canada In the NAFTA area, Canada presents a large marketplace that is an open-market economy that is close in terms of both geography and culture. One sub-sector in the Canadian food processing and packaging equipment segment is the meat processing equipment industry. Canada’s meat processing sector expends more than $5.5 billion a year on materials and supplies. Of the spending on supplies and materials for the meat processing sector, meat processing equipment accounts for nearly $40 million a year, and the industry is expected to increase spending on the machinery at an annual average growth rate of 4-5 percent for next several years. Growth outlook on this sector is optimistic. In 1999, U.S. companies had an import market share of 50 percent in Canada. This large market share has been relatively unchanged since the late 1980s. In the Canadian market, main competitors include the Netherlands with 16 percent of the import market share, Germany with 14 percent, Italy with 6.5 percent, and Switzerland with four percent. The dominant market position held by U.S. manufacturers is well secured according to trade experts. Similarities in eating habits, packaging requirements, and technical codes and standards between the U.S. and Canada promote a favorable competitive environment for American exporters. Further, there are no significant trade barriers or restrictive practices impeding U.S.-Canada trade. Following provisions under NAFTA, Canadians importing U.S. food processing and packaging equipment face no import duties.
Appalachian Regional Commission 81 Global Competitiveness of Selected Industries and Clusters in The Appalachian Region

3.3.4 NAFTA: Mexico The Mexican market for processed foods has been expanding at a rapid rate since 1995. Given the mounting market demand, Mexico’s food processing industry has been growing as well in order to keep pace. Mexico’s total market for food processing and packaging equipment, including parts, was over $3 billion in 2000, and there are over 13,000 registered food-processing firms in the country. The Mexican market is expected to grow by 10 to 12 percent annually in next several years. According to Asociacion Mexicana de Envasey Embalaje (Mexican Process and Packaging Association), the growth in consumption of processed and/or packaged foods is anticipated to increase at an average rate of 15 to 20 percent annually. As appetites for processed, prepared food products rise among Mexicans, and increased demand for such food products applies pressure to foods suppliers, the Mexican food industry must upgrade infrastructure and equipment to meet the market demand. Some sources indicate that the Mexican packaging industry is about five years behind the U.S. packaging industry. Further, there are no significant trade barriers or restrictive practices impeding U.S.-Mexico trade. Following provisions under NAFTA, Mexican establishments importing U.S. food processing and packaging equipment face no import duties. Imports of food processing equipment have no restrictions but are subject to strict labeling requirements and compliance with mandatory standards. The U.S. suppliers of food processing and packaging equipment have a very dominant position in the Mexican import marketplace. American manufacturers of food processing equipment have benefited from NAFTA in part due to the low import duties. Almost all of the equipment is exempt from duties compared to non-NAFTA countries, which must pay 23 to 30 percent of tariff rates for the same equipment. The geographic proximity of Mexico to the U.S. border, results in lower transportation costs for U.S.-Mexican trade. Further, Mexicans are more accustomed to doing business with U.S. companies. U.S. import market share has increased over the years and more than half of food processing equipment imported to Mexico is from the U.S.
3.3.5 Latin America: Brazil The total value of the Brazilian market for food processing and packaging machinery is estimated to exceed $450 million. According to estimates, nearly 70 percent of the market demand is met by domestic production while the remaining 30 percent of the market is served by foreign imports. Imports from the U.S. make up approximately 14 percent of the total imports market with Italy (27%) and Germany (21%) holding significant import market shares. Brazil has a mature food processing and packaging industry. While much of the demand for equipment is met domestically, many technically advanced, sophisticated machines are supplied by foreign manufacturers. Many small and medium sized Brazilian food processing and packaging firms tend to purchase domestically produced packaging and processing equipment while larger firms and multinational firms operating in Brazil often turn to foreign suppliers for equipment. These larger businesses also seek highly advanced, automated, efficient machines. Regulatory and market trends point to more sophisticated technology and higher efficiency in food processing and packaging in Brazil. Many U.S.-made machines and products have a good reputation for advanced technology and high quality. The U.S. industry supplying equipment to Brazilian food processing and packaging businesses have good prospects in providing machinery with higher efficiency levels, automated devices and new technology. U.S. companies exporting to Brazil face a number of tariff and non-tariff types of trade barriers. While virtually all imports from its MERCOSUR partners enter Brazil duty-free, U.S. suppliers experience a distinct disadvantage entering the market in Brazil. As a member of MERCOSUR, Brazil implements the
Appalachian Regional Commission 82 Global Competitiveness of Selected Industries and Clusters in The Appalachian Region
MERCOSUR Common External Tariff (CET). Capital goods such as machines used in food processing and packaging, mostly bear a 14 percent tariff. The Brazilian Government imposes a series of restrictions in the importation of used equipment, parts, pieces and accessories. Regulation No. 370 (Portaria) of the Brazilian Ministry of Industry, Commerce and Tourism dated November 28, 1994 establishes the rules and regulations for importing these products into Brazil. Transfer of manufacturing plants from overseas to Brazil that generate new jobs, increase exports and result in cost reduction are exempt from these restrictions. Because of the substantial price difference between used and new machines, there is a niche market for used machines in Brazil, although the procedures for gaining import approval are complicated. Import duties on refurbished machines are the same as on new products; however, even when the new machine is exempt from the Tax over Industrial Product, the tax is levied on imported used machines. The Brazilian Government, through the Foreign Trade Secretariat and the Industrial Policy Secretariat, authorizes imports of used food processing and packaging machinery, provided they are not produced in Brazil nor can they be replaced by locally-made equipment that performs the same functions of the imported machinery. The import authorization will only be granted if no local producer can prove that domestic production of a similar product exists. This proof must be provided to the Foreign Trade Secretariat within thirty days from publication in the Brazilian Daily Registry (Diario Oficial da Uniao).
3.3.6 Latin America: Argentina Total market for packaging equipment in Argentina is estimated to be over $100 million. Virtually all (roughly 90%) of the packaging equipment in Argentina is imported. The main suppliers for Argentina are Italy, Germany and the U.S. Italy is the leader with 31.5 percent of the import market while Germany holds over 20 percent of the market. The U.S. is ranked third among packaging equipment exporters to Argentina with 12 percent of the market share. European competitors in the marketplace have been able to provide more competitive financial terms, thus gaining additional market share. Among food processing, meatpacking, and sugar packaging equipment sub-sectors, the U.S. ranks first in exports. The Argentine market for food processing equipment is estimated to be over $70 million. This market is also mostly dominated by imported equipment. The main suppliers for Argentina’s food processing machines include American, German, Italian, French, Spanish and Brazilian companies. Together, they account for more than 70 percent of food processing equipment imported to Argentina. In 1999, the import market share for the U.S. was 20 percent. Italy held 19.5 percent; Germany 11.8 percent; France 11.2 percent; Brazil 8.8 percent; and Spain 6.4 percent. In terms of quality, local production offers little competition. Imported equipment provides superior products to the Argentine market. The U.S.-made machinery is recognized for quality. Additional offering of attractive payment terms can increase the competitive position of U.S.-based suppliers of food processing equipment in Argentina. Even though the import market has decreased, mainly due to a serious economic downturn in Argentina, projections forecast increasing market share and imports from U.S. suppliers in coming years. Outlook for U.S. and Appalachian food processing machines in Argentina is fair despite difficult economic conditions. The U.S. increased its market share from 17 percent in 2001 to 21 percent in 2002. Table 3-12 shows information concerning market size and potential of Argentine food processing equipment and related packaging machine subsectors.
Appalachian Regional Commission 83 Global Competitiveness of Selected Industries and Clusters in The Appalachian Region

Table 3-12. Argentine Market for Food Processing and Packaging Equipment 2000 2001 2002 Projected Growth
(%) Total Market 78 57 44 5% Local Production 27 25 20 10% Exports 13 13 12 8% Imports 64 45 33 5% Imports from U.S. 19 8 7 10%
Source: unofficial estimates based on Argentine Customs data and other sources. Argentina has eliminated much of non-tariff barriers and specific import duties over the recent years. The intra-MERCOSUR tariffs are currently at zero. Most extra-MERCOSUR tariffs for food processing and packaging equipment are 14 percent. In addition to trade barriers stemming from tariffs, exporting to Argentina faces cumbersome customs procedures that pose obstacles to legitimate trade activities. Argentina has import monitoring mechanisms, similar to an import-licensing regime, which affect roughly 20 percent of all imports. U.S. suppliers also complain that unwieldy certificates of origin requirements introduce added burdens for them.
3.3.7 Europe: Poland In the European marketplace, Poland is becoming increasingly attractive for foreign investors and exporters. Its food processing and packaging equipment segment has a prominent place in the Polish economy, and is well positioned to take advantage of the country’s agricultural output. The Polish food processing industry is undergoing modernization, and the industry is expected to continue rapid development. In addition, Polish consumers have been experiencing a rise in purchasing power, and preference for processed/packaged food items is increasing. These trends encourage the demand for food processing and packaging equipment. In 1999, the equipment market was estimated to be about $340 million. Only about 13 percent of market needs are met by Polish domestic production. The rest is supplied by foreign imports. Machines originating from the EU (i.e. Germany, Italy) dominate the imports market, in part, due to their proximity, and lower cost of transportation. The value of food processing and packaging machines from the U.S. accounted for over three percent of food processing equipment imports in 1999. While U.S.-made equipment is not well known in Poland, it is expected that imports from the U.S. will increase at an estimated annual growth rate of two percent. The U.S.-made machines have burdens of higher price. Other key factors of competition such as productivity, after-sale service and specialization of machineries can enhance sales in Poland as American machines currently have a good reputation. Penetrating the Polish market for food processing and packaging equipment, some of the tariff and non-tariff barriers must be overcome. In terms of tariffs, machines imported from the U.S., including Appalachian manufacturers, face higher customs rates than those imported from the EU, other European nations, and other developing nations. Current customs tariff codes for U.S. food processing equipment range from 5 to 9 percent. Since Poland joined the EU in 2004, U.S. exporters can have tariffs on U.S.-produced machinery to reflect EU levels. In terms of non-tariff trade barriers, Poland’s inefficient and slow legal system can impede the ability of exporters and investors to conduct business there. U.S. firms have complained frequently that the Polish court system is slow and unreliable, preventing many U.S suppliers of machinery from protecting their investments, rights and business interests there. Ineffective court cases that do not resolve disputes or punish the infringing entity tend to result in lost business
Appalachian Regional Commission 84 Global Competitiveness of Selected Industries and Clusters in The Appalachian Region

opportunities for U.S. suppliers. Such deficiencies limit the ability of U.S. firms to enforce the terms of contracts with their Polish business partners.
3.4 Microelectronics Manufacturing segments that make up the microelectronics industry produce semiconductors, printed circuit boards, electron tubes, capacitors, resistors, inductors and other electronic connectors and components are examples of manufactured microelectronics products. Their products reflect, by and large, light-weight, high-value items requiring speedy yet flexible transportation of the goods. Largely, the microelectronics group can be classified under NAICS code 334—Computer and Electronic Product Manufacturing. While these establishments have experienced rapid growth in the past five to ten years, they also faced precipitous drops in market demand for high-technology commodities as the recent downturn in the economy has been suppressing economic activities in the tech sector. The following tables (3-13 and 3-14) will attest to both the enormity of the microelectronics industry value and the difficult times the industry has been facing in recent years. Both employment and total value of shipment have declined from 1997 to 2001. It is worthwhile to note that the total value of shipment of the microelectronics industry eclipsed a half trillion dollars in 2000. With economic recovery on the way, the sector will regain some ground in coming years. Table 3-13. Computer and Electronic Product Manufacturing (NAICS 334) Sector
Year Employees Total Value of Shipment ($1,000)
2001 1,598,766 429,470,8412000 1,652,745 510,638,4861999 1,610,202 467,059,3961998 1,686,623 443,767,1121997 1,691,146 439,381,300
Table 3-14. Semiconductor and Other Electronic Component Manufacturing (NAICS 3344) Sector
Year Employees Total Value of Shipment ($1,000)
2001 566,864 124,215,4332000 614,083 166,670,9531999 586,221 146,798,8721998 585,395 133,193,1131997 587,313 139,083,873
Source (for both tables): Annual Survey of Manufacturers, Industry Statistics, U.S. Census Bureau, Dec. 20, 2002. Following general trends of the economy and the industry group, the sector’s export volume and value of shipment also fluctuate over the years. While the export shipment volume dropped since 2000, a longer term trend shows that it has been up slightly from $42 billion in 1998 to $44 billion in 2002 (see Table 3-15). It is worthwhile to note that the Asian region consistently received nearly one half of all microelectronics exports from the U.S. from 1998 to 2002. Despite the economic downturn, over the five year period from 1998 to 2002, U.S. exports of microelectronics to Asia increased by 14 percent in five years. As shown in Table 3-16, U.S. exports of semiconductors to China drastically rose between 1998 and 2002, roughly by a multiple of three. Another notable marketplace is Eastern Europe. While the absolute size of the market is still relatively small, the market poses growth potential. From 1998 to 2002,
Appalachian Regional Commission 85 Global Competitiveness of Selected Industries and Clusters in The Appalachian Region

the total exports of microelectronics to Eastern Europe increased by 160 percent (from $46 million in 1998 to $120 million in 2002). Exports to Canada have experienced some fluctuation while exports to Latin America have remained fairly steady over the years. Table 3-15. Microelectronics Exports from the U.S. to the World
1998 1999 2000 2001 2002 NAICS 334 Microelectronics In 1,000 Dollars
Canada 4,140,889 4,500,106 5,488,675 3,559,192 2,528,103Latin America 7,810,413 9,353,477 12,211,708 9,233,214 7,800,756EU 5,654,909 6,375,107 8,792,565 7,237,169 5,530,089Eastern Europe 46,825 60,824 100,176 74,708 120,953Russia 17,497 16,273 21,229 24,026 21,395Asia 24,033,613 31,050,427 39,150,542 27,361,644 27,408,724Oceania 154,009 153,519 175,114 148,474 138,230Other 666,504 873,290 1,303,427 976,400 770,282World 42,524,659 52,383,023 67,243,436 48,614,827 44,318,532
Sources: Data on this site have been compiled from tariff and trade data from the U.S. Department of Commerce, the U.S. Treasury, and the U.S. International Trade Commission. Table 3-16. Semiconductors Top 20 U.S. Exports and Total
1998 1999 2000 2001 2002 NAICS 334413 Semiconductors In 1,000 Dollars Malaysia 3,610,407 4,410,584 5,030,203 3,618,863 4,439,023Philippines 3,276,776 3,997,519 4,697,596 4,315,552 4,406,583Taiwan 2,119,334 2,594,733 3,845,048 3,014,346 3,520,697Korea 3,197,280 5,633,241 5,435,274 3,049,292 3,329,186Mexico 2,386,251 3,177,717 4,487,737 3,382,329 2,497,241Japan 2,282,738 2,800,683 3,295,506 2,558,123 2,054,715Singapore 2,463,820 2,541,024 2,977,516 1,805,386 1,559,269Germany 635,278 784,419 1,042,321 1,178,938 1,317,490Canada 2,643,684 2,786,539 3,302,162 1,833,674 1,294,241China 440,620 641,848 685,815 946,060 1,237,502Hong Kong 1,355,931 1,751,153 1,904,789 1,339,887 1,227,889Thailand 1,073,777 1,175,709 2,099,641 1,523,231 758,399United Kingdom 1,026,315 1,153,542 1,405,185 1,019,909 728,549Costa Rica 12,296 139,900 219,195 241,553 726,069Netherlands 265,179 317,888 333,519 341,641 474,155France 547,975 540,433 801,200 496,804 348,097Brazil 225,839 372,080 629,738 487,791 260,926Ireland 227,979 302,831 377,148 306,027 223,638Israel 116,705 165,161 408,188 285,891 211,725Italy 153,706 202,230 399,703 246,886 192,315Subtotal, Top 20: 28,061,889 35,489,231 43,377,482 31,992,182 30,807,711All Other: 992,823 1,126,080 1,450,793 1,462,457 929,877Total 29,054,712 36,615,311 44,828,274 33,454,639 31,737,587
Sources: Data on this site have been compiled from tariff and trade data from the U.S. Department of Commerce, the U.S. Treasury, and the U.S. International Trade Commission.
Appalachian Regional Commission 86 Global Competitiveness of Selected Industries and Clusters in The Appalachian Region
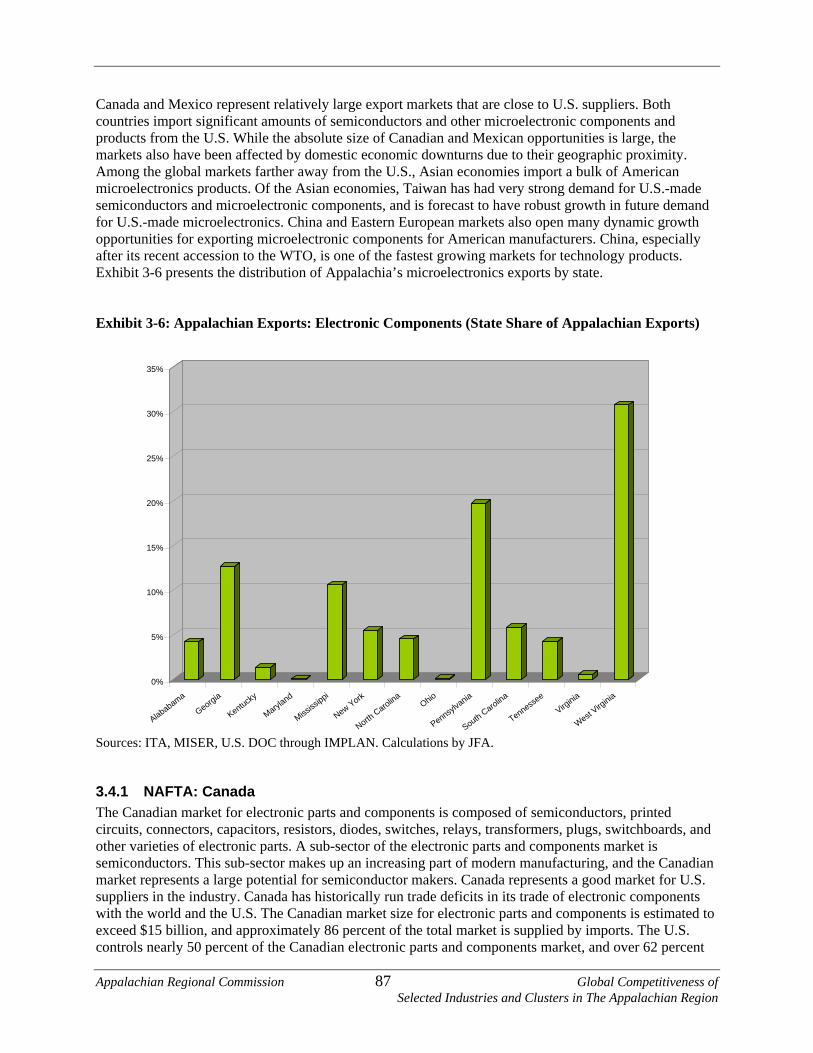
Canada and Mexico represent relatively large export markets that are close to U.S. suppliers. Both countries import significant amounts of semiconductors and other microelectronic components and products from the U.S. While the absolute size of Canadian and Mexican opportunities is large, the markets also have been affected by domestic economic downturns due to their geographic proximity. Among the global markets farther away from the U.S., Asian economies import a bulk of American microelectronics products. Of the Asian economies, Taiwan has had very strong demand for U.S.-made semiconductors and microelectronic components, and is forecast to have robust growth in future demand for U.S.-made microelectronics. China and Eastern European markets also open many dynamic growth opportunities for exporting microelectronic components for American manufacturers. China, especially after its recent accession to the WTO, is one of the fastest growing markets for technology products. Exhibit 3-6 presents the distribution of Appalachia’s microelectronics exports by state. Exhibit 3-6: Appalachian Exports: Electronic Components (State Share of Appalachian Exports)
0%
5%
10%
15%
20%
25%
30%
35%
Alababama
Georgia
Kentucky
Maryland
Mississ
ippi
New York
North Carolina
Ohio
Pennsylvania
South Carolina
Tennessee
Virginia
West Virg
inia
Sources: ITA, MISER, U.S. DOC through IMPLAN. Calculations by JFA.
3.4.1 NAFTA: Canada The Canadian market for electronic parts and components is composed of semiconductors, printed circuits, connectors, capacitors, resistors, diodes, switches, relays, transformers, plugs, switchboards, and other varieties of electronic parts. A sub-sector of the electronic parts and components market is semiconductors. This sub-sector makes up an increasing part of modern manufacturing, and the Canadian market represents a large potential for semiconductor makers. Canada represents a good market for U.S. suppliers in the industry. Canada has historically run trade deficits in its trade of electronic components with the world and the U.S. The Canadian market size for electronic parts and components is estimated to exceed $15 billion, and approximately 86 percent of the total market is supplied by imports. The U.S. controls nearly 50 percent of the Canadian electronic parts and components market, and over 62 percent
Appalachian Regional Commission 87 Global Competitiveness of Selected Industries and Clusters in The Appalachian Region

of all electronic parts and component imports into Canada. Table 3-17 shows electronic components that Canada imported most in 2001. Trade experts anticipate that U.S. suppliers of electronic components will continue to enjoy a very receptive market in Canada. As more Canadian-based companies engage in the manufacturing of electronics systems, more parts and components will be necessary. Taking advantage of proximity and a very dominant market position, U.S. suppliers of microelectronic components have good outlook in exporting opportunities to Canada. Table 3-17. Top 5 Electronic Components Canada Imported in 2001 Product U.S.$ (in millions) Integrated circuits 4,330 Switches, relays and plugs 2,714 Wire and cable 2,413 Cathode-ray tubes 2,294 Printed circuits 1,211
Source: International Trade Administration (ITA).
3.4.2 NAFTA: Mexico Much of Mexico’s electronic components market is dominated by foreign imports. This industry is a significant sector for the Mexican economy, and is an evolving one. Mexico imports many electronic components and produces finished or intermediary products and (re)exports the assembled products. After NAFTA, this industry has grown both in terms of size and scale. The industry has moved into new product lines away from traditional markets. It is a very important industry in Mexico and involves automotive electronics, network equipment, game consoles, printers, high capacity servers, storage media and even semiconductor design. The industry imports 92 percent of necessary parts and 85 percent of the imports are provided by U.S. suppliers. The U.S. holds a dominant market position in the Mexican electronics component market. Geographic proximity and inexpensive labor provide Mexico with opportunities to import foreign microelectronic components and assemble intermediary or final products that get shipped to the U.S. and other global markets with much more value added. Multinational technology firms such as HP, IBM, Siemens, Kodak, Sony, Samsung, and Mitsubishi have manufacturing plants in Baja California and Guadalajara, among many other locations inside Mexico. Texas Instruments and Siemens are examples of growing specialty microelectronics segments in Guadalajara. They are venturing in automotive electronics. Others produce computers (laptops), telecommunication equipment, computer peripherals (printers) and circuit boards. Table 3-18 summarizes market size data for electronics parts in Mexico. Table 3-18. Market Size Data for Imported Electronics Parts and Accessories (US $ millions) 2000 2001 2002Import Market 42,347 30,010 27,000Local Production 438 501 550Total Market 42,785 30,510 27,550Imports from U.S. 33,071 26,650 21,000
Source: U.S. Department of Commerce: Bureau of the Census; International Trade Administration (ITA).
Appalachian Regional Commission 88 Global Competitiveness of Selected Industries and Clusters in The Appalachian Region

Mexico still represents an attractive marketplace for exporting microelectronic components. The market has recovered somewhat from 2000-2002 economic slowdown which dampened the overall demand for the microelectronics sector. Renewed growth in 2003 coupled with proximity of U.S. suppliers to the Mexican market and the low transportation costs contributes to the U.S. dominant market position in Mexico. The top five electronic components imported from the U.S. to Mexico are: integrated circuits; cathode-ray tubes; printed circuits; switches, relays and plugs; and capacitors. Under NAFTA, it is advantageous for Mexican businesses to import electronic components from U.S. suppliers. NAFTA affords virtually duty-free trade of electronic components, and improved customs procedures. In addition, geographic proximity allows short lead time and lower transportation costs.
3.4.3 Asia/Pacific: China China with its rapidly growing export industries, combined with swelling trade deficits in the U.S., has been viewed as a serious economic competitor in recent years. As China has been forging its economy as a future economic power with its exports, its domestic marketplace has been expanding very quickly. With its accession to the WTO, China’s emerging domestic market poses abundance of opportunities for foreign exporters. China is one of the fastest growing IT markets in the world, and recently passed Australia to become the second largest market in Asia after Japan. In the past two years, China’s IT industry has been growing at an annual rate of over 30 percent. Last year, China’s IT market size exceeded $22 billion, according to International Data Corporation (IDC). China’s market is expected to grow to be a $40 billion marketplace by 2006, according to IDC. Much of the market (over 70%) is attributed to hardware purchases while the rest of the market consists of software and IT services. Trade of IT hardware products between the U.S. and China has tripled between 1998 and 2002. U.S. exports to China have been growing much slower than China’s exports of computer and related items to the U.S., leading to a significant trade deficit in this area. The U.S. exports of IT hardware products to China amounted to nearly $580 million in 2002. China shipped over $9 billion worth of computer equipment to the U.S. in the same year. China’s accession to the WTO is expected to encourage more IT exports from the U.S. to China as some tariffs levied on IT hardware products are adjusted. Relative to other sectors and the IT software segment, the Chinese market for IT hardware is comparatively open. For various reasons, the Chinese government is willing to allow greater competition in the hardware segment—especially after China’s accession to the WTO. China has signed the Information Technology Agreement (ITA) as a condition of joining the WTO. The ITA began eliminating tariffs starting in 2002, and eliminating tariffs on 2/3 of the products by January 2003. Tariffs on all remaining products are scheduled to disappear by 2005. Industry experts estimate that the U.S. saved about $500 million in tariffs in 2002 alone. While many large U.S. companies such as IBM, Dell, HP and Compaq already have a good foothold in China, many U.S. suppliers face competition from domestic producers and regional suppliers from Taiwan, Japan and Korea. Chinese domestic competition is very fierce. Chinese PC makers hold over a half of the domestic market demand. Multinational firms such as IBM and HP had to form local joint ventures in order to penetrate and gain market access into China. Despite its accession to the WTO, local Chinese technology companies maintain close-knit relationship with large government and other official buyers. Cost is a key factor in gaining competitive advantage in China. Dell, known for its operational efficiency and scalable and inexpensive hardware, lowered prices in China, only to be countered by a 14
Appalachian Regional Commission 89 Global Competitiveness of Selected Industries and Clusters in The Appalachian Region

percent discount offered by a Chinese PC giant, Legend. Legend and other Chinese producers maintain a strong foothold in the domestic PC market in China. Internationally, many U.S. companies must face stiff competition from regional foreign suppliers from Taiwan, Japan and Korea. Along with the U.S. firms, these foreign suppliers also face similar limitations and challenges entering China. With additional market access projected with China’s entrance into the WTO, the U.S. must improve pricing structure and services to better compete in a more open marketplace. There are also other barriers. U.S. Department of Commerce export licensing applies to technologies that may have “dual-use” for both civilian and military purposes. China, while committed to the WTO agreements, still has several trade barriers. China recently announced a new import standard, “China Compulsory Certification.” PCs, portable (laptop) computers, monitors, printers, multipurpose printer/fax/copy machines, scanners, power supply units, game consoles, leaning machines, servers and others must carry the China Compulsory Certification Mark (CCC) starting May 2003. The certification process is another hindering step for U.S. exporters.
3.4.4 Asia/Pacific: Taiwan Taiwan has been an important industry leader in technology, especially in the semiconductor sector. In recent years, the global economic downturn and slow market demand for IT products have affected most industrialized nations and electronics component marketplaces around the world. Despite the slow economy, Taiwan’s market for semiconductors has seen improvements, and its market is recovering. The Taiwanese market for electronics parts and components can offer U.S. suppliers an opportune place to increase their market share. Economic slowdown has reduced Taiwan’s market for semiconductors from $16 billion in 2000 to $10 billion in 2001. While such reduction is a drastic one, the market still represents substantial business opportunities. U.S. exports of electronic components, including semiconductors, improved by 16.5 percent from 2001 to 2002 (from $3.2 to $3.7 billion). Current conditions provide U.S. suppliers with good footing especially in light of the recent withdrawal of Japanese competitors from Taiwan’s DRAM market. U.S suppliers now have secured the third largest market share in Taiwan’s semiconductors import market, over their Japanese counterparts. Tables 3-19 and 3-20 display data reflecting Taiwan’s strength in semiconductors and data showing U.S. exports of microelectronic components to Taiwan. Table 3-19. Taiwan’s Market for Semiconductors 2001 2002 2003 Projected Avg. Annual
Growth Rate Total Market 10,056 10,100 11,850 10-15% Local Production 6,510 7,500 6,900 15-20% Exports 2,987 3,900 4,500 15-20% Import Market 6,533 6,500 6,900 10-15% Imports from U.S. 784 780 830 10-15%
Source: U.S. Department of Commerce: Bureau of the Census; International Trade Administration (ITA).
Appalachian Regional Commission 90 Global Competitiveness of Selected Industries and Clusters in The Appalachian Region

Table 3-20. U.S. Exports of Electronic Components to Taiwan 1998-2002 (in $1000) 1998 1999 2000 2001 2002 %Change
2001-2002 Taiwan 2,346,588 2,807,356 4,092,048 3,187,444 3,713,279 16.5%
Source: International Trade Administration (ITA). U.S. suppliers of electronic components and parts to Taiwan face competition from Malaysia, the Philippines and Japan. In 2001, the three countries held Taiwan’s import market shares of 18.4 percent, 16.6 percent and 11.8 percent respectively. Japanese firms, principal competitors of U.S. suppliers, have been losing market share in recent years. Meanwhile, U.S. producers have been enjoying increased sales in the segments of micro-components, logic ICs, DRAMs, microprocessors and analog ICs. The U.S. products are well received, and generally carry a reputation of superior technology, quality and performance in Taiwan’s import market. Currently, Taiwan uses a tariff system based on the Harmonized System, and the duty on imported products is defined on an ad valorem basis. There are no import duties for semiconductors and U.S. technical standards are generally accepted in Taiwan.
3.4.5 Eastern Europe & Russia Economies of Eastern Europe and Russia offer tremendous business opportunities for U.S. firms supplying microelectronics products, parts and accessories. These economies have begun opening up, and liberalization process creates prospects for U.S. exporters. The Russian market for the IT sector represents a growing and dynamic market for U.S. suppliers. The Russian market for the IT hardware segment is expected to grow at a double-digit annual growth rate. The market size increased at a 20 percent rate from 2001 to 2002. The Russian IT market size in 2002 was estimated to be $3.9 billion. The Hungarian IT sector is also a dynamic marketplace that is growing fast. It is estimated that the market size in 2002 was around $4.7 billion and the sector would experience a healthy growth rate of over 8 percent in 2003. In Slovakia, the IT market is estimated to be about $450 million at an 11 percent growth rate. For 2003 onward, the IT market growth in Slovakia is expected to range from 10 to 13 percent annually. In Russia, the total number of computers was over 11 million in 2001, which was an increase of over 6 percent from 2000. There is significant room for growth in this market. Only about 15 percent of Russia’s computer segment demand is met by imports. The rest of the demand is met by locally assembled, manufactured products. While Russian manufacturers provide low-cost assembled PCs, other system components including printers, peripherals, servers and networking hardware are mostly imported. Russia’s IT imports market is very receptive to U.S. suppliers and their products. Larger companies such as IBM, HP/Compaq, Microsoft, Sun Microsystems and others have strong presence in the Russian market already. Major groups in Russia that are end-users of IT products, microelectronics parts and components are multinational companies, government agencies and Russian companies. Market access to Russia is fairly straightforward according to many analysts. U.S. exporters generally report few problems. In Slovakia, the IT market was estimated to be around $450 million with an 11 percent annual growth rate in 2002. It is expected that the market will increase in size at an annual rate ranging from 10 to 13 percent in coming years. Much like other Eastern European bloc economies, recent liberalization processes in Slovakia have provided export opportunities for many American microelectronics suppliers. Robust
Appalachian Regional Commission 91 Global Competitiveness of Selected Industries and Clusters in The Appalachian Region

demand for technology in both consumer and corporate sectors has been fueling a rapid increase in the IT market. The number of Internet users in Slovakia more than tripled between 1997 and 2001. Competing in Slovakia is not without challenge. European competitors such as Germany, France, UK, Sweden and Finland have a clear advantage in geographical and cultural proximity with Slovak markets. Besides the market competition, U.S. microelectronics suppliers face few problems. Market access to Slovakia is fairly straightforward. Import/export documentation is similar to that of EU countries. Most high-tech western technology can flow into Central and Eastern Europe without U.S. export licenses. In Hungary, the domestic computer hardware equipment market is estimated to be over $450 million. If network equipment and telecommunication hardware were counted, the market potential may exceed one billion. The segment has been growing at a very high annual growth rate ranging from 7 to 8 percent in recent years. An estimated 2 million PCs are used in Hungary, and about 1.6 million people are using the Internet. With increasing demand for technology and computers, Hungary represents an emergent and energetic market for U.S. microelectronics suppliers. PC sales in Hungary have had significant increases from 2001 to 2002. The overall PC market expanded by 10 percent and demand for laptops grew by over 30 percent during the same period. Larger multinational corporations such as IBM, HP/Compaq, Microsoft, Sun Microsystems and others have a strong presence in Hungary. Many U.S. companies have a solid foothold in Hungary, and represent a majority in several different market sub-segments (i.e. markets for servers, consumer PCs, printers and other peripherals, and components). The Hungarian government has identified the IT sector as a priority economic sector, and is actively supporting business and individual access to IT. Such initiatives include direct spending of over $100 million in 2001; and over $150 million in 2002. Principal opportunities in Hungary for exporting U.S. microelectronics include individual consumers of IT products (computers, peripherals), Hungarian businesses (servers, peripherals, laptops and components) and Hungarian manufacturers (components). Market access to Hungary is favorable. Although Hungary has not signed the 1996 Singapore Treaty that stipulates duty rates on import of IT products, there are no import duties on computers, storage units, printers and other equipment from the U.S. Summary
♦ For Appalachian exporters of automotive parts, NAFTA economies (Canada and Mexico) present the largest export market. Established Western European markets (Germany and Sweden), Asia/Pacific (Korea), and Latin American markets (Argentina) also offer good prospects for future growth.
♦ For Appalachian wooden household and upholstered furniture manufacturers, NAFTA markets
(Canada & Mexico), Germany, Korea, Saudi Arabia, and the United Arab Emirates represent leading export markets.
♦ Canada, Mexico, China, Poland, Argentina, Brazil and Thailand are leading markets for
Appalachian exports of food processing and packaging machinery.
♦ China and Eastern European markets open many dynamic growth opportunities for exporting microelectronic components for Appalachian manufacturers. Asian economies such as Taiwan also offer opportunities for growth in future demand for U.S.-made microelectronics.
Appalachian Regional Commission 92 Global Competitiveness of Selected Industries and Clusters in The Appalachian Region

CHAPTER 4: TRANSPORTATION AND LOGISTICS ANALYSIS The purpose of Chapter 4 is to identify routes and modes used to bring products produced in Appalachia to United States ports for export, and thereby note strengths and weaknesses of the ARC transportation network (see http://www.arc.gov/index.do?nodeId=62 for an overview of the Appalachian transportation system). As a starting pointing, we focus on export of six groups of commodities produced in Appalachia:
• Auto parts • Electronic components • Wood furniture • Upholstered furniture • Food processing machinery • Packaging machinery
Developing the route and mode analysis requires the following steps:
1. Quantifying exports by value and volume from the ARC in the above target industries. These data are presented in aggregate, by ARC county and state.61
2. Identifying ports of lading of exports of these counties from ARC, pairing counties of origin with destination ports.
3. Making inferences from the data developed in Step 2 to analyze modal splits and routing from Appalachia to major ports used for exporting the target commodities. These data are supported and enriched by interviews with ARC-based shippers of these commodities and representatives from the logistics industry
4.1 Export Shipments from the Appalachian Region By far, the value of auto parts is the largest exported product group from ARC among the six industries that this study addresses, followed by electronic components (see Table 4-1). Together these two commodities account for more than 95 percent of the value of exports of the six product groupings, while wood furniture, upholstered furniture, food processing machinery and packaging machinery in aggregate account for 4.6 percent of the total. As a five-year average, these six commodity groups exported from ARC account for 3.3 percent of the value of the $169.5 billion of exports from Appalachian states (statewide totals for all commodities). Table 4-1. Exports from Appalachian Counties by Value
$ Millions 1998-2002 Percent of Total (rounded) Auto Parts $3,634 65.4% Electronic Components $1,673 30.1% Wood Furniture $ 114 2.1% Upholstered Furniture $ 61 1.1% Food Processing Machinery $ 60 1.1% Packaging Machinery $ 15 0.3%
Totals $5,557 100% Sources: ITA, MISER, U.S. DOC through IMPLAN, JFA
61 The aggregation of ARC counties within a state’s borders.
Appalachian Regional Commission 93 Global Competitiveness of Selected Industries and Clusters in The Appalachian Region

Considering just the six targeted commodities, 43 percent of the value of exports from these industries shipped from ARC states originates in Appalachian counties (see Table 4-2). This ranges from almost 50 percent of the value of auto parts and upholstered furniture to 21 percent of the value of food processing machinery that are exported overall from the 13 states. Table 4-2. Exports from Appalachian States and Counties. Appalachian counties are responsible for more than 40 percent of exports of targeted commodities generated by constituent states.
Exports from ARC States ($millions)
Exports from ARC Counties
($millions)
Percent Exported from ARC States that Originate
in ARC Region Auto Parts $ 7,510 $ 3,634 48.4% Electronic Components $ 4,662 $ 1,673 35.9% Wood Furniture $ 352 $ 114 32.4% Upholstered Furniture $ 129 $ 61 47.4% Food Processing Machinery $ 284 $ 60 21.1% Packaging Machinery $ 54 $ 15 27.9%
Totals $ 12,991 $ 5,557 42.8% Sources: ITA, MISER, U.S. DOC through IMPLAN. Calculations by EDR Group and JFA.
4.2 Routing and Modes from Appalachia to Ports of Lading Unfortunately, there is not a single data source to trace routing of commodities from points of origin to points of lading. The largest three issues confronted are:
1. Export data are available from state to port, but not from county to port.
2. Publicly accessible modal data are not available in industry specific detail or by sub-state geography.
3. Databases that were used use different industry and commodity classification systems, requiring translations between industry codes and commodity codes, and among varying industry and commodity codes. This project at different junctures used databases in NAICS, SIC, BEA sectoring, Harmonized Commodity Codes, SITC and, STCC.62
This analysis, therefore, involves a series of sources. Data accumulated per county by Minnesota Implan Group, Inc. (IMPLAN) from federal data sources (most notably the U.S. Department of Commerce) is the basis for county-specific economic activity and the rate of exports among the six commodities. The Massachusetts Institute of Social and Economic Research (MISER) and the International Trade Administration of the U.S. Department of Commerce (ITA) were the sources for exports by commodity and value from state to country of destination and domestic ports of lading.63 The Freight Analysis Framework (U.S. Department of Transportation) and the Commodity Flow Survey (U.S. Department of Transportation and U.S. Department of Commerce) provide insights on the modal splits from point of origin to points of lading. Finally, we contacted manufacturers, common carriers and logistics firms to mine their insights regarding transporting goods for export.
62 NAICS – North American Industry Classification System; SIC – Standard Industrial Classification; BEA – Bureau of Economic Analysis of the U.S. Department of Commerce; SITC -Standard International Trade Classification; STCC - Standard Transportation Commodity Code. 63 Annual values of exports per commodity from 1998 through 2002 were averaged. In this way, annual fluctuations are not a factor.
Appalachian Regional Commission 94 Global Competitiveness of Selected Industries and Clusters in The Appalachian Region

4.2.1 Exports by State Data gleaned from IMPLAN, ITA and MISER are the basis for estimating the original state and county of lading of exports by value generated from the ARC region for each of the six targeted commodities. Data available from 1998 through 2002 was averaged to account for year to year fluctuations. Overall, the annual value of the six target commodity groups exported from Appalachian counties is over $5 billion per year. Counties in West Virginia, Tennessee and Alabama account for roughly 50 percent of the total (see Table 4-3). Note that counties in these three states are the leaders in the export of auto parts, by far the largest of the six commodity groupings, and West Virginia is also a prominent exporter of electronic components, which is the region’s second largest industry of the six as shown in Table 4-1, above.
Table 4-3. Exports from ARC Counties. The aggregated export value of the six target commodities show the disproportionate strength of West Virginia, Tennessee and Alabama due to these states’ strengths in auto parts and electronics. Appalachian counties are aggregated by state.
State (Totals of ARC Counties)
Average Value of Exports, 1998-2002
Percent of Total ARC Exports
West Virginia Total $ 988,838,386 19.2% Tennessee Total $ 853,066,380 16.6% Alabama Total $ 715,891,138 13.9% Pennsylvania Total $ 404,569,700 7.9% Georgia Total $ 381,575,320 7.4% Ohio Total $ 301,621,607 5.9% Maryland Total $ 274,323,608 5.3% South Carolina Total $ 257,808,513 5.0% North Carolina Total $ 254,895,432 5.0% Virginia Total $ 200,359,053 3.9% Mississippi Total $ 200,005,821 3.9% New York Total $ 178,367,325 3.5% Kentucky Total $ 132,493,424 2.6%
Total $ 5,143,815,708 100.0% Note: Totals have been rounded Sources: ITA, MISER, U.S. DOC through IMPLAN. Calculations by EDR Group and JFA.
In examining the value of exports from Appalachia aggregated by state for each of the six target industries, only in auto parts, by far the largest industry among the six, do as many as six of ARC’s 13 constituent states generate significant values of exports (Tennessee, Alabama, West Virginia, Ohio, Maryland and Georgia). Together these six states account for 79 percent of auto parts exported from the region (see Table 4-4). Examining value as well as percentage is important because exports of the auto parts industry are nearly two-thirds of the six industries. Thus 5.5 percent of auto parts exports from the Region is worth roughly $200 million, while 5.5 percent shares of upholstered furniture and food processing machinery exports are worth about $3 million and less than $1 million in packaging machinery. Overall, the states identified as the leading exporters per target industry in Table 4-4 account for $4.2 billion annually, or 77 percent of all exports of these six commodity groups from Appalachia. Of the $4.2 billion, Appalachian counties in the eight states that are prominent exporters of auto parts and electronic components account for almost $4.1 billion, which is almost 74 percent of the total value of exports from Appalachia in these six industries.
Appalachian Regional Commission 95 Global Competitiveness of Selected Industries and Clusters in The Appalachian Region

Table 4-4. States Generating Major Proportion of Exports in Targeted Commodities
Commodity Group State of Origin (Totals of ARC Counties)
Percent of all Exports from ARC
Average Value of Exports 1998-2002
Auto Parts Tennessee 22.0% $ 800,112,160 Alabama 20.0% $ 726,714,042 West Virginia 15.1% $ 550,122,530 Ohio 8.3% $ 300,132,899 Maryland 7.6% $ 277,241,407 Georgia 5.5% $ 200,573,076
Subtotal Auto Parts 78.6% $2,854,896,115
Electronic Components
West Virginia 30.7% $ 514,311,720
Pennsylvania 19.7% $ 330,103,131 Georgia 12.7% $ 211,814,781 Mississippi 10.6% $ 176,679,628
Subtotal Electronic Components 73.7% $1,232,909,260
Wood Furniture North Carolina 40.6% $46,461,756 New York 26.1% $29,861,739 Subtotal Wood Furniture 66.8% $76,323,495
Upholstered Furniture
Tennessee 24.4% $14,871,673
Alabama 21.3% $13,002,790 Pennsylvania 20.3% $ 12,373,721 North Carolina 16.2% $ 9,912,413
Subtotal Upholstered Furniture 82.1% $50,160,597
Food Processing Machinery
Pennsylvania 27.9% $16,834,722
Georgia 20.1% $12,101,464 South Carolina 14.1% $ 8,525,894 Ohio 12.1% $ 7,265,702
Subtotal Food Processing Machinery 74.2% $44,727,781
Packaging Machinery South Carolina 64.8% $ 9,692,613 Georgia 16.0% $ 2,393,219
Subtotal Packaging Machinery 80.8% $12,085,832
Total all Commodity Groups 76.9% $ 4,271,103,080 Note: The five-year average of auto parts exports from Appalachian counties in South Carolina total roughly $150 million, per year. However, average exports in 2001 and 2002 are $200 million, which is most likely the influence of the BMW plant in the state. Note: Totals have been rounded. Sources: ITA, MISER, U.S. DOC through IMPLAN. Calculations by EDR Group and JFA.
Appalachian Regional Commission 96 Global Competitiveness of Selected Industries and Clusters in The Appalachian Region

4.2.2 Major Counties The foregoing analysis provides a framework to identify the leading counties in ARC that export the six targeted commodities and to pinpoint origins for cargo shipments. The top value exporting counties from ARC are:
• Auto Parts – Cabell, WV • Electronics – Logan, WV • Food Processing Machinery – Hall, GA • Packaging Machinery – Greenville, SC • Upholstered Furniture – Hamblen, TN • Wood Furniture – Chautauqua, NY
A more detailed accounting of leading exporting counties per commodity from Appalachia and the five-year average value of exports per county are listed below in Table 4-5. As expected, the leading counties that export each of the six targeted commodities generally fall into the leading states presented above in Table 4-4, given that the totals presented above are the sums of ARC counties with state borders. Exceptions are:
• Greenville, South Carolina is the fourth leading exporter of electronic components.
• Pennsylvania counties in ARC make Pennsylvania the second leading state in the region for export of electronic components. However, no single county is among the leading six counties that export in this commodity group. Instead, Pennsylvania produces goods for export among nine counties, which total over $173 million in value.
• Pulaski, Virginia is the fifth leading exporter of food processing machinery (although this is a very small industry in comparison to auto parts and electronics).
• Holmes, Ohio and Lowndes, Mississippi are respectively Appalachia’s fourth and fifth largest export counties of wood furniture, although these two states do not account for significant exports overall. (This is also a relatively small industry and values of exports are heavily concentrated in the top two counties in the ARC region.)
4.2.3 Identifying Routes We identified major routes for carrying commodities to export through the following methods.
1. Identify level of exports by state and county in ARC for each of the six targeted industries (sources U.S. Department of Commerce data through IMPLAN, MISER, International Trade Administration, calculations by Jack Faucet Associates (JFA) and EDR Group).
2. Identify major exporting states and counties in each of the six targeted industries (sources: U.S. Department of Commerce data through IMPLAN, MISER, International Trade Administration, calculations by JFA and EDR Group).
3. Identify states of lading in each of the six targeted industries originating in ARC (sources: U.S. Department of Commerce data through IMPLAN, MISER, International Trade Administration, calculations by JFA and EDR Group).
4. Identify gateway ports for exports in each of the six targeted commodities (sources: step 3 above, additional calculations by EDR Group).
5. Identify routes between major producing states/counties in ARC and primary ports of lading.
Appalachian Regional Commission 97 Global Competitiveness of Selected Industries and Clusters in The Appalachian Region

Table 4-5. Average Value of Exports 1998-2002. West Virginia hosts the counties that export the highest value of auto parts and electronics from the ARC region.
Commodity Group County State Average Value of Exports 1998-2002
(millions) Auto Parts Cabell WV $ 394
Limestone AL $ 283 Washington MD $ 270 Clermont OH $ 156 Putnam TN $ 122 Tuscaloosa AL $ 122 Blount TN $ 120
Electronics Logan WV $ 182 Gwinnet GA $ 153 Oktibbeha MS $ 131 Greenville SC $ 74 Wood WV $ 71 Mercer WV $ 56
Luzerne PA $ 35 Food Processing Machinery Hall GA $ 8
Clearfield PA $ 8 Highland OH $ 6 Spartenburg SC $ 4 Pulaski VA $ 3 Allegheny PA $ 3
Packaging Machinery Greenville SC $ 7 Spartenburg GA $ 3 Gwinnett SC $ 2
Upholstered Furniture Hamblen TN $ 5 Rhea TN $ 4 Alexander NC $ 4 Lycoming PA $ 3 McKean PA $ 2 Caldwell NC $ 2 Claiborne TN $ 2 Marion AL $ 2
Wood Furniture Chautauqua NY $ 22 Caldwell NC $ 16 Burke NC $ 4 Homes OH $ 2 Lowndes MS $ 2 McDowell NC $ 2
Sources: ITA, MISER, U.S. DOC through IMPLAN. Calculations by EDR Group and JFA.
Appalachian Regional Commission 98 Global Competitiveness of Selected Industries and Clusters in The Appalachian Region

States of Lading
We identified states of lading (where a product leaves the U.S.) that account for more than 73 percent of the value of exports for the six target industries from Appalachian counties over the five year timeframe of 1998-2002. By individual commodity group, the percentage of exports shipped to these states for international export range from 68 to 76 percent of ARC exports (see Table 4-6).
• The most significant states of lading for ARC commodities are Michigan, New York and Florida. These are major states of lading for each of the commodity groups (except that Michigan is not a major state of lading for packaging machinery).
• Other key states of lading are South Carolina, Maryland and Texas for food processing machinery and South Carolina and Texas for packaging equipment.
• Note that with the exception of Maryland and South Carolina, the targeted commodities are being shipped outside of states with Appalachian counties for export.
Table 4-6. Significant States of Lading. Led by exports of auto parts, the most significant states of lading for ARC commodities are Michigan, New York and Florida.
Commodity Group State of Lading
Percent of all Exports from ARC
Average Value of Exports 1998-2002
Auto Parts Michigan 36.1% $ 1,313,172,274 NY 32.4% $ 1,176,913,391 Florida 7.5% $ 271,064,338
Subtotal Auto Parts 76.0% $ 2,761,150,003 Food Processing Machinery Michigan 13.4% $ 8,085,731
New York 16.9% $ 10,165,953 Texas 16.1% $ 9,689,612 South Carolina 8.4% $ 5,058,858 Florida 8.2% $ 4,932,236 Maryland 7.5% $ 4,498,103
Subtotal Food Processing Machinery 70.4% $ 42,430,493 Packaging Machinery Florida 11.6% $ 1,736,169
NY 19.2% $ 2,872,162 South Carolina 17.4% $ 2,607,247 Texas 20.1% $ 3,012,852
Subtotal Packaging Machinery 68.3% $ 10,228,430 Electronic Components Florida 12.6% $ 209,974,369
Michigan 22.0% $ 367,915,248 NY 33.3% $ 557,645,076
Subtotal Electronic Components 67.9% $ 1,135,534,692 Upholstered Furniture Florida 15.4% $ 9,381,064
Michigan 28.2% $ 17,210,832 NY 26.6% $ 16,264,175
Subtotal Upholstered Furniture 70.2% $ 42,856,070 Wood Furniture Florida 21.2% $ 24,248,372
Michigan 14.6% $ 16,668,612 NY 35.4% $ 40,448,251
Subtotal Wood Furniture 71.2% $ 81,365,236 Total all Commodity Groups 73.3% $ 4,073,564,926 Sources: ITA, MISER, U.S. DOC through IMPLAN. Calculations by EDR Group and JFA. Note: Totals have been rounded.
Appalachian Regional Commission 99 Global Competitiveness of Selected Industries and Clusters in The Appalachian Region

4.2.4 Major Ports Ports of lading were identified in the following method.
• MISER provides port specific data from exports originating in ARC states by commodities. (Data for point of origin are available on a state basis).
• Leading ports within the states of lading per industry were identified from the MISER data. • Judgments were exercised when considering the geography of ARC and the location of key ports.
For example, though Detroit and Port Huron are major ports in Michigan, it is likely that shippers of products originating in ARC and exported through Michigan will not bypass Detroit and truck goods 60 miles further north to Port Huron.
Literally, hundreds of ports nationally are identified as gateways for the six targeted commodities. Narrowing the ports to those in key states of lading, and several others that are prominent nationally and are in or tangential to Appalachia, we have identified the probable main ports of lading for ARC produced exports of the six target commodities (see Table 4-7). Table 4-7. Main Ports of Lading for Appalachian Exports. Key ports of lading for exports in target industries from Appalachia are Detroit and New York, including JFK Airport.
Auto Parts • Detroit MI • New York, NY (including the
Port of NY and JFK International Airport)
• Buffalo-Niagara Falls, NY • Miami (including the Port of
Miami and Miami International Airport)
• Jacksonville, FL Other Norfolk, VA Baltimore, MD Laredo, TX
Electronic Components • JFK International Airport • Buffalo-Niagara Falls, NY • Detroit, MI • Miami, FL (including the
Port of Miami and Miami International Airport)
Other Charleston SC Atlanta GA Dallas-Fort Worth TX
Food Processing Machinery • Detroit, MI • New York, NY (including the
Port of NY and JFK International Airport)
• Buffalo-Niagara Falls, NY • Champlain-Rousse Pt., NY • Baltimore, MD • Charleston SC • Laredo, TX • Detroit, MI • Miami, FL (including the
Port of Miami and Miami International Airport)
Other Norfolk, VA
Packaging Machinery • Charleston SC • New York, NY • Buffalo-Niagara Falls, NY • Laredo, TX • Miami, FL (including the
Port of Miami and Miami International Airport)
Upholstered Furniture • Detroit MI • New York, NY • Buffalo-Niagara Falls, NY • Miami (Including the Port of
Miami and Miami International Airport)
• Jacksonville, FL
Wood Furniture • Detroit MI • New York, NY • Buffalo-Niagara Falls, NY • Miami, FL • Jacksonville, FL Other Charleston SC Norfolk, VA
Source: MISER, calculations by EDR Group.
Appalachian Regional Commission 100 Global Competitiveness of Selected Industries and Clusters in The Appalachian Region

4.2.5 Port Pairings Based on the research above, we identified 185 count-to-port pairings (see Table 4-8) and tested 79 by hypothesizing probable routes from county of production to port. These routes were buttressed with findings from interviews with regional manufacturers. The results indicate that routing is heavily oriented to interstate highways that bring products on a north-south axis from Appalachia to ports in Michigan, New York and Florida, and secondarily east-west to ports in South Carolina, Virginia and Texas. Table 4-8. Identified County to Port Routes by Commodity Group
Commodity Group Number of County to Port Routes Auto Parts 55 Electronic Components 36 Food Processing Machinery 24 Packaging Machinery 19 Upholstered Furniture 25 Wood Furniture 26
Total 185 The Appalachian Development Highway System (ADHS) feeds into these key interstates—but is not (and is not necessarily designed to be) an alternative route (see http://www.arc.gov/index.do?nodeId=1006 for maps and data identifying the system and corridors by alphabetical designations assigned by ARC). Through interviews with manufacturers and logistics companies, we identified the interstate highways that are the backbone of shipments of the six target commodity groups to ports of lading. In Table 4-9, we present segments of the ADHS that feeds into these key interstate highways (and one U.S. highway).
Table 4-9. Key Port Connections in Appalachia.
ADHS Corridors Highway Endpoints by State with Appalachian Counties Direct Indirect
Key Port Connections
I—95 Georgia to New York M New York City, Miami and Baltimore, connects to I-26 to Charleston and I-64 to Norfolk
I-26 North Carolina to South Carolina
W B Charleston, Connects to I-95, Connects to I-81 for eventual connections to Buffalo/Niagara Falls and Champlain.
I-85 Alabama to Virginia W, A1, A, B, H Norfolk and I-95 to New York and Florida I-70 Ohio - Pennsylvania C B/B1, C,
D Connects to I-77 to Lake Erie for eventual connection to Detroit and to I-79 for eventual connection to Buffalo/Niagara Falls and Champlain
I-40 Tennessee to North Carolina B, A W, K Connects to I-75 to Detroit, I-26 to Charleston, I-85 and I-95 for eventual connects to NY, Norfolk and Florida
I-81 North Carolina to New York B, T, M S, Q, H,
L, N, O, U, P, F, G, R, I
Connects to I-90 to Buffalo/Niagara Falls, I-87 to Champlain, i-26 to Charleston (and from I-26 to I-95), I-64 to Norfolk, I80 to New York City
I-77 South Carolina to Pennsylvania
D, G, L, Q
B/B1 Connects to I70 and I-26 and I-90 for eventual connection to Detroit
Hwy 321 Tennessee to South Carolina J Connects to I-40, I-20 and I-85 Note: Other highways mentioned are U.S. Highways 321 and 119. Indirect connection to an Interstate Highway is defined as when an ADHS Highway connects to an Interstate through one other Interstate or ADHS highway. Source: Telephone Interviews; EDR Group.
Appalachian Regional Commission 101 Global Competitiveness of Selected Industries and Clusters in The Appalachian Region

The ADHS system connects to key interstate highways for transporting target commodities to ports. Secondly, we tested potential origins and port destinations. Our findings show that the ADHS is particularly positioned for the transport of auto parts, semi-conductors, upholstered furniture and wood furniture (see Table 4-10). Eleven of 66 routes tested in these four sectors use the ADHS. Additional development of the ADHS would assist firms that now export packaging machinery and wood furniture, by lowering costs of shipments from plant to port. Table 4-10. ADHS Highways Identified for Commodity Transportation
ADHS Highway
Location by State Connections to Interstate Highways
Key Port Connections
J Kentucky to Tennessee at the Alabama and Georgia borders
I-75, I-59 I-75 is a direct link to Detroit, connects to I-10 to Jacksonville and linkage to Miami, and I-81 for eventual links to New York. I-59 enters Texas through Alabama.
L Intra-West Virginia I-77, I-79 I-77 goes to Lake Erie for eventual connection to Detroit and connects to I-26 to Charleston and I-64 to Norfolk. I-79 connects to I-90 for connections to Buffalo/Niagara Falls, to Champlain via I-87 and to Detroit via I-94.
C Intra-Ohio I-70, I-71 See Table 4-9 or key ports associated with I-70. See above for I-77.
B-1 Intra -Ohio, immediately south of C
same as above
O Pennsylvania Connects to I-80 and I-70
See Table 4-9for key ports associated with I-70. I-80 connects to New York City. And I-90 for eventual connections to Detroit, Buffalo/Niagara and Champlain. Connects indirectly to I_90 and then to Buffalo/Niagara Falls and Detroit
U Pennsylvania to New York
Connects to I-80, connects with ADHS Highway T
See above for I-80.
T Lake Erie at the New York - Pennsylvania border and intra-New York
I-90, I-390, I-81, I-87
See Table 4-9 for key ports associated with I-81. I-90 connects to Buffalo/Niagara \falls and to Detroit via I-94. I-87 connects to Champlain.
Source: Telephone Interviews; Mapquest; EDR Group. Sixteen of the 23 corridors of the ADHS have not been completed. In most cases, the level of construction is far greater than the portions remaining to be finished. However, the disjunctions, though small, affect speed of transport. In some cases, noted below in Table 4-11, corridors in multiple states are complete in one state, but not a second jurisdiction. Table 4-11 lists ADHS corridors identified by telephone surveys or by routes tested as part of this study that are incomplete. Corridors in bold provide direct connections to interstate highways that serve ports or were identified in telephone interviews. Corridors not bold were identified as indirect connections to interstate highways between key points of origin of target commodities and key ports of lading for those commodities (indirect connection is defined as when an
Appalachian Regional Commission 102 Global Competitiveness of Selected Industries and Clusters in The Appalachian Region
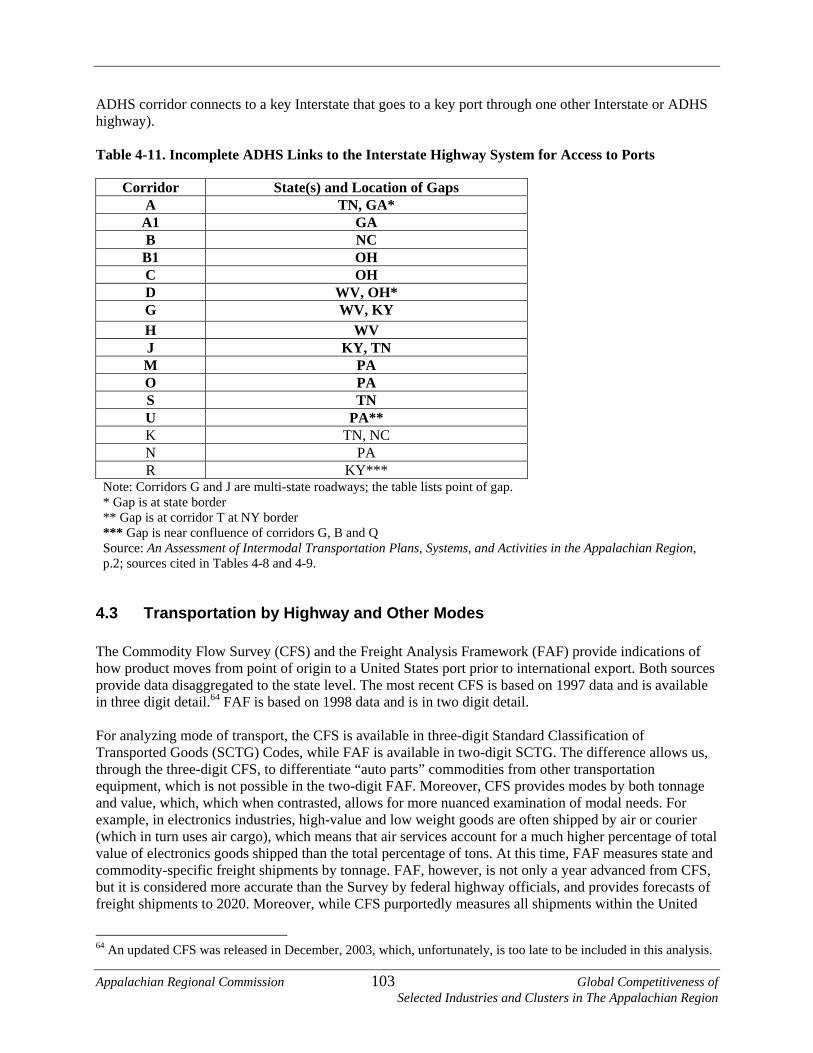
ADHS corridor connects to a key Interstate that goes to a key port through one other Interstate or ADHS highway). Table 4-11. Incomplete ADHS Links to the Interstate Highway System for Access to Ports
Corridor State(s) and Location of Gaps A TN, GA*
A1 GA B NC
B1 OH C OH D WV, OH* G WV, KY H WV J KY, TN M PA O PA S TN U PA** K TN, NC N PA R KY***
Note: Corridors G and J are multi-state roadways; the table lists point of gap. * Gap is at state border ** Gap is at corridor T at NY border *** Gap is near confluence of corridors G, B and Q Source: An Assessment of Intermodal Transportation Plans, Systems, and Activities in the Appalachian Region, p.2; sources cited in Tables 4-8 and 4-9.
4.3 Transportation by Highway and Other Modes The Commodity Flow Survey (CFS) and the Freight Analysis Framework (FAF) provide indications of how product moves from point of origin to a United States port prior to international export. Both sources provide data disaggregated to the state level. The most recent CFS is based on 1997 data and is available in three digit detail.64 FAF is based on 1998 data and is in two digit detail. For analyzing mode of transport, the CFS is available in three-digit Standard Classification of Transported Goods (SCTG) Codes, while FAF is available in two-digit SCTG. The difference allows us, through the three-digit CFS, to differentiate “auto parts” commodities from other transportation equipment, which is not possible in the two-digit FAF. Moreover, CFS provides modes by both tonnage and value, which, which when contrasted, allows for more nuanced examination of modal needs. For example, in electronics industries, high-value and low weight goods are often shipped by air or courier (which in turn uses air cargo), which means that air services account for a much higher percentage of total value of electronics goods shipped than the total percentage of tons. At this time, FAF measures state and commodity-specific freight shipments by tonnage. FAF, however, is not only a year advanced from CFS, but it is considered more accurate than the Survey by federal highway officials, and provides forecasts of freight shipments to 2020. Moreover, while CFS purportedly measures all shipments within the United
64 An updated CFS was released in December, 2003, which, unfortunately, is too late to be included in this analysis.
Appalachian Regional Commission 103 Global Competitiveness of Selected Industries and Clusters in The Appalachian Region

States, FAF includes a database that measures shipments that are U.S. bound for international export. Even at three digit detail, CFS forces a consolidation and rough approximation of several of the targeted sectors, particularly wood and upholstered furniture, and food processing and packaging machinery. At the three-digit level, the following classifications are used:
• For auto parts - Parts and accessories for motor vehicles, except motorcycles and armored vehicles
• For food processing machinery and packaging machinery - Other machinery • For semiconductor and other electronic parts - Electronic components and parts • For wood furniture and upholstered furniture - Furniture mattresses and mattress supports, lamps,
lighting fittings Shipments of the targeted commodities from ARC states show a similar profile to national averages. When measured by tonnage, roughly 90 percent, goods are shipped from the Region by truck. Table 4-12 compares mode shipments from ARC to national averages, and also compares mode shipments by tonnage to mode shipments by value, both from ARC and nationwide. The modal relationships between tonnage shipped and value shipped for auto parts, “other machinery” and furniture are similar, though slightly a higher percentage of tonnage is shipped by truck (as a single mode), and shipments by value show a slightly higher reliance on air (and parcel services) and rail. Less than half of the value of electronic components and parts are shipped by truck as a single mode. Nationally, nearly 58 percent of value in this sector is shipped by air or parcel service. In ARC states, CFS shows that 89 percent of the tonnage and 42 percent of the value is shipped by truck in this electronics sector, and a strong emphasis is seen in parcel services for value—this is similar to the national profile. FAF at the two-digit level also shows an overwhelming use of ground transportation to ship products originating in ARC states to ports for international export. As FAF provides mode and commodity information at the two digit level, the following sectors are used:
• 25 – Furniture/fixtures for upholstered furniture and wood furniture; • 35 – Machinery, except electrical for food processing machinery and packaging machinery. Note,
this sector includes all non-electrical machinery; • 36 – Electrical machinery, equipment and supplies. This sector includes finished consumer
products as well as components; • 37 – Transportation Equipment, including fully assembled transportation vehicles and parts for all
modes.
Appalachian Regional Commission 104 Global Competitiveness of Selected Industries and Clusters in The Appalachian Region

Table 4-12. Mode Splits. Mode splits of shipments from ARC states by tonnage and value of shipment is similar to the U.S. profile.
Tonnage from ARC by percentage $ Value from ARC by percentage
Modes Other machinery
Electronic compnts. & parts
Auto parts
Wood &. uphstd. furniture
Modes Other machinery
Electronic compnts. & parts
Auto parts
Wood &. uphstd. furniture
Truck 88.3% 88.6% 85.7% 95.4% Truck 74.8% 41.9% 87.2% 93.2% Rail 0.1% 0.0% 6.9% 0.0% Rail 0.1% 0.0% 2.4% 0.0% Water 0.0% 0.0% 0.0% 0.0% Water 0.0% 0.0% 0.0% 0.0% Air (includes truck and air)
0.3% 0.9% 0.2% 0.0% Air (includes truck and air)
1.5% 4.1% 0.8% 0.1%
Parcel, U.S. Postal Service or courier
3.5% 2.2% 1.7% 0.8% Parcel, U.S. Postal Service or courier
17.6% 28.3% 5.9% 2.7%
Truck and rail
4.1% 0.0% 0.0% 0.0% Truck and rail
1.7% 0.0% 0.2% 0.0%
Other & unknown modes
2.6% 0.3% 1.9% 0.9% Other & unknown modes
3.4% 0.5% 2.1% 0.9%
Tonnage in USA by percentage $ Value in USA by percentage
Modes Other machinery
Electronic compnts. & parts
Auto parts
Wood &. uphstd. furniture
Modes Other machinery
Electronic compnts. & parts
Auto parts
Wood &. uphstd. furniture
Truck 87.2 79.9 84.2 93.9 Truck 72.6 35.6 83.6 91.2 Rail 0.7 0.3 9.7 0.8 Rail 0.5 - 3.8 0.4 Water - - - - Water - - - - Air (includes truck and air)
1 2.4 0.6 0.2 Air (includes truck and air)
2.7 19.2 1.7 0.6
Parcel, U.S. Postal Service or courier
4.2 8.5 1.6 2 Parcel, U.S. Postal Service or courier
18.2 38.5 6.2 4.6
Truck and rail
2 5.8 1.3 0.7 Truck and rail
0.8 0.5 1.8 0.5
Other & unknown modes
4.9 3.1 2.5 2.4 Other & unknown modes
5.1 6.1 2.8 2.7
Source: U.S. Commodity Flow Survey. Note the “ARC state” portions of this table are statewide averages among states that include ARC counties.
Roughly 94 to 98 percent of furniture, machinery, and electrical machinery, equipment and supplies are transported to ports by truck, as measured by tonnage in 1998 (see Table 4-13). Only transportation equipment uses another mode significantly, rail. Although this sector includes transport of fully assembled automobiles, rail cars and aircraft, along with parts for each industry, the auto parts sector shown above in the CFS presents a similar profile to FAF. FAF also includes volume and mode projections to 2020, displayed in Table 4-14. The total increase of tonnage projected is more than 63 million tons from 21.6 million tons in 1998, an increase of nearly 42 million tons, nearly tripling base year totals for these four sectors.
Appalachian Regional Commission 105 Global Competitiveness of Selected Industries and Clusters in The Appalachian Region

Table 4-13. Modes of Shipment for Exports. Shipment of tonnage for selected commodities from ARC states shipped for international export is overwhelmingly by highway.
Furniture/fixtures Machinery except
electrical Electrical machinery/ equipment/supplies
Transportation equipment
Highway 98% 94% 95% 84% Air 0% 1% 2% 0% Water 0% 0% 0% 0% Rail 2% 5% 3% 15% Source: FAF International Commodity Flows, U.S. Department of Transportation. States refer to whole states that include Appalachian counties.
• By mode, 37.2 million of the additional tons (89%) are expected to be transported by highway
and 4.2 million tons (10%) by railroad. Projections in FAF of 2020 flows originating in ARC for international shipments in these industries show a similar mode split as 1998.
• By industry, more than 21 million tons of the increased tonnage is expected to be in transportation equipment and almost 13 million of the increase is predicted for the machinery except electrical sector.
• Overall tonnage for furniture and fixtures; machinery except electrical; and electrical machinery, equipment and supplies, are expected to more than triple, while tonnage in the transportation equipment sector is forecast to grow by a factor of 2.8.
Table 4-14. Selected Commodities from ARC States to International Gateways by Tons
Tons 1998 Forecast Tons 2020
Increased tons forecast, 1998-2020
Forecast Ratio of Increase 2020:1998
Furniture/fixtures 1,343,676 4,125,788 2,782,113 3.07 Machinery except electrical
5,843,814 18,496,591 12,652,776 3.17
Electrical machinery/ equipment/supplies
2,464,916 7,710,897 5,245,981 3.13
Transportation equipment 11,948,256 33,057,860 21,109,605 2.77 Total 21,600,661 63,391,136 41,790,475 2.93 Note: Totals have been rounded. Source: FAF International Commodity Flows.
Figures 4-1 through 4-6 below illustrate the export of the six target commodity groups from Appalachian states to key ports on the base maps of FAF international commodity flows. The routing illustrated for each commodity group is based on analysis described in Sections 4.1 and 4.2 above and is derived from MISER, ITA and county-based economic data developed by federal sources and assembled by IMPLAN. The maps shown in Figures 4-1 through 4-6 represent routes of exports from the leading state of origin in Appalachia (aggregation of Appalachian counties within state borders) to the major state of lading for each of the six target commodity groups. Additional maps showing routes from other states are provided in an appendix to this chapter.65
65 Sources for each figure are found in the preceding analysis and FAF. All calculations reported in the figures refer to the total value of exports for each commodity group.
Appalachian Regional Commission 106 Global Competitiveness of Selected Industries and Clusters in The Appalachian Region

Figure 4-1, Auto Parts & Upholstered Furniture. Exports of auto parts from Tennessee counties constitute 22 percent of total exports in this industry from Appalachia, and Tennessee counties also account for more than 24 percent of the exports of upholstered furniture from Appalachia. For both commodity groups, the primary ports for export from the Region are in Michigan, New York, and Florida.
Florida
New York Michigan
Figure 4-2, Food Processing Machinery. Pennsylvania accounts for approximately 28 percent of the value of food processing machinery exported from the Appalachian region. Key ports for exports are in Michigan New York, Maryland, South Carolina, Florida and Texas.
a
New York
Flori
Maryland
Michigan
Texas
Appalachian Regional Commission 107 Selected Industries and C
South Carolin
da
Global Competitiveness of lusters in The Appalachian Region

Figure 4-3, Packaging Machinery. South Carolina accounts for almost 65 percent of Appalachia’s exports of packaging machinery. Major ports of lading are in New York, Florida, Texas, as well as South Carolina.
N
Florida
ew York
Texas
South Carolina
Figure 4-4, Electronic Components. Electronics represent the second largest export industry in the Appalachian region among the six targeted in this study, and almost 31 percent of the regions total value originates in West Virginia. The leading ports of lading for this commodity group are in Michigan, New York, and Florida.
Florida
Michigan
New York
Appalachian Regional Commission 108 Global Competitiveness of Selected Industries and Clusters in The Appalachian Region
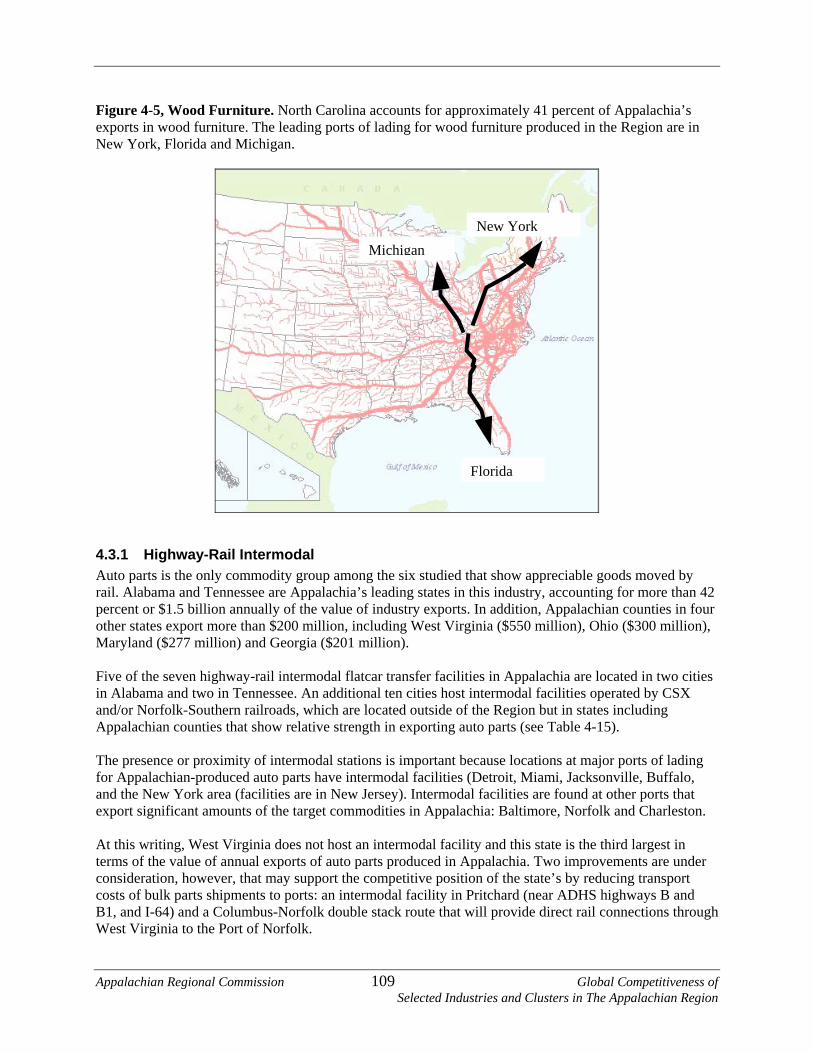
Figure 4-5, Wood Furniture. North Carolina accounts for approximately 41 percent of Appalachia’s exports in wood furniture. The leading ports of lading for wood furniture produced in the Region are in New York, Florida and Michigan.
New YorkMichigan
Florida
4.3.1 Highway-Rail Intermodal Auto parts is the only commodity group among the six studied that show appreciable goods moved by rail. Alabama and Tennessee are Appalachia’s leading states in this industry, accounting for more than 42
ercent or $1.5 billion annually of the vp alue of industry exports. In addition, Appalachian counties in four 0 million), Ohio ($300 million),
Fiv se fl inin Alabama an tio ermand/or Norfolk h ar f the RegAppalachian counties that show relative stre auto parts (see Table 4-1 The presence intermodal stations is im tant becausf i to parts have intermodal ilities (Detrand the New York area (facilities are in New Jersey). Intermodal facexport significant amounts of the target commodities in Appalachia: At this writing, West Virginia does not host an intermodal facility and this state is the third largest in t e value of annual exports of auto parts produced in Appalachia. Two improvements are under cc : an intermodal facility in Pritchard (near ADHS highways B and B1, and I-64) and a Columbus-Norfolk double stack route that will provide direct rail connections through West Virginia to the Port of Norfolk.
other states export more than $200 million, including West Virginia ($55aryland ($277 million) and Georgia ($201 million). M
e of the ven highway-rail intermodal
d two in Tennessee. An addiouthern railroads, whic
atcar transfer facilities nal ten cities host int
ated outside o
Appalachia are located in two cities odal facilities operated by CSX
ion but in states including -S e locngth in exporting 5).
or proximity of por e locations at major ports of lading or Appalach an-produced au fac oit, Miami, Jacksonville, Buffalo,
ilities are found at other ports that Baltimore, Norfolk and Charleston.
erms of thonsideration, however, that may support the competitive position of the state’s by reducing transport osts of bulk parts shipments to ports
Appalachian Regional Commission 109 Global Competitiveness of Selected Industries and Clusters in The Appalachian Region

Table 4-15. Intermodal Facilities Support for Export of Auto Parts
ities /
State Value of Auto Parts
Exports from Appalachia (Average 1998-2002)
Locations of TOFC/ COFC Facilities in
Appalachia
Locations of Intermodal FacilOperated by CSX Railroad and
or Norfolk Southern Railroad Alabama $727 Million Birmingham (2), --
Huntsville Georgia $201 Million -- Atlanta (3), Austell, Savannah (2) Maryland $277 Million -- Baltimore (2) Ohio Cincinnati, Cleveland, Columbus, $300 Million --
Toledo Tennessee $800 Million Kingsport, Knoxville Memphis (2), Nashville West Vi n
-- -- $550 Million rgi ia
So e n; www.c
urc s: An Assessment of Intermodal Transportation Plans, Systems and Activities in the Appalachian Regiosxi.com and www.nscorp.com.
4.3.2 Air Air transportation is significant for electronic components among the six target industries. Four states,
for almost 74 percent of the value of West Vexpo rports, of whicommercial air h D important conn in Ta
ir accoun for almo of Appalachia’s electronic com orts 37 use air ts, of whic x are commer
sylvania, with a 20 percent share, is the home of Pittsburgh International Airport, the largest airport in Appalachia, and Harrisburg International Airport is located just east of the ARC portion
• Georgia accounts for 13 percent and Hartsfield International Airport in Atlanta—the largest al airp
ccess
l
irginia, Pennsylvania, Georgia and Mississippi account from Appalachia for this industry. Together these four srts tates host 367 ai
orts are in Appalachia and Aeach of these states (see
ch 37 are HS highways serve as
ble 4-16). Among the ports. Eigectors to s
teen of the cmaller comme
:
ommercial airprcial airports
four major exporting states
• West Vosts
ginia, ting st 31 percent h i
ponents exph public por s cial.
• Penn
of the Commonwealth.
commerci ort in the United States is immediately adjacent to the region.
• Mississippi companies in Appalachia export 11 percent of the value of the region’s electroniccomponents and as is served by commercial airports in Columbus and Tupelo.
Table 4-16. Airport Access in Appalachia. ADHS highways play an important role in providing a to moderately sized commercial airports in states accounting for a high proportion of value in electronic components exported from Appalachia.
State Total Airports in State
Total Commercial
Airports
Commercial Airports in Appalachia
Significant Commercial Airports Adjacent to
Appalachia
ADHS Highways Serving Commercia
Airports West Virginia 37 6 6 B, G, L Pennsylvania 138 15 10 Harrisburg M, V, O, P Georgia 109 9 Atlanta A/A1 Mississippi 83 7 2 V Totals 367 37 18 Sources: and Activities in the Appalachian Region, Federal Av
An Assessment of Intermodal Transportation Plans, Systems iation Administration, www.AirNav.com.
Appalachian Regional Commission 110 Global Competitiveness of Selected Industries and Clusters in The Appalachian Region

CHAP
5.1 indings: The Relationship between Firm Location and Export Patterns Based ohypotheses regarding the relationship between access to transportation and patterns of exports within the ARC. Tmore likthese hy
ecause ce and hence we ceived
nge, i.e.,
moving goods east to west in the Appalachian region, export patterns are shaped by whether t or west side of the range. That is, we expect different trade patterns for states estern portions of the ARC.
use
rth
HYPOTHESIS 4: There will be little difference in eastern and western patterns of exports to Asia. Although the eastern ARC has more direct access to seaports, western ARC firms can more
orts, which have shorter travel times to Asia.
nsportation. This hypothesis could not be validated by available data.
lina and Virginia. The states in the western portion (ARC-EST) include New York, Ohio, Kentucky, Tennessee, and West Virginia. Data were gathered on 2002
S
.1.2 Results
-EAST than ARC-WEST exports for each of the four individual sectors.
TER 5: FINDINGS, SUMMARY AND POLICY IMPLICATIONS
F
n interviews with manufacturing, trucking, and logistics firms, we developed four working
hese hypotheses reflect one of the key findings of the interviews conducted, namely, that firms are ely to export to those markets more easily reached given the location of the firm. To the extent potheses are true, firms are more likely to report that transportation infrastructure is adequate: they focus on foreign markets with easy access, they have little experienb
re few reports of difficulties in accessing ports for international sales.
HYPOTHESIS 1: Because of the cost and time required to traverse the Appalachian Ra
states lie on the easin the eastern and w HYPOTHESIS 2: States in the eastern portion of the ARC will export more to Europe becaof easier access to east coast ports. HYPOTHESIS 3: States in the western portion of the ARC will export more within NoAmerica (NAFTA region) because of better direct access to key industrial areas in Canada and Mexico.
easily access West Coast p
HYPOTHESIS 5: Differences in export patterns from Appalachia are minimized with a greater reliance on air tra
5.1.1 Methodology To test these hypotheses, recent export data were compiled for selected states lying east and west of the Appalachian Range. The states in the eastern portion (ARC-EAST) include New Jersey, Delaware, Maryland, North Carolina and South CaroWexports of the following products: Computer and Electronic Products (NAICS 334); Electrical Equipment, Appliances, and Components (NAICS 335); Transportation Equipment (NAICS 336); and Furniture and Fixtures (NAICS 337); and for comparison purposes, all manufactured products (NAIC311-339).
5Data confirm each of the four hypotheses. As shown in Table 5-1, export patterns differ significantly between ARC-EAST and ARC-WEST for each of the four sectors, as well as for all manufacturing. This confirms Hypothesis 1. There is also strong evidence for Hypothesis 2. As shown in Table 5-1, exports to Europe account for a greater proportion of ARC
Appalachian Regional Commission 111 Global Competitiveness of Selected Industries and Clusters in The Appalachian Region

Across the four sectors, exports to Europe accounted for 31 percent of ARC-EAST but only 22 percent of ring as a whole, where the
spective ratios were 31 and 25 percent.
nce for Hypothesis 3 is very strong. ARC-WEST export AFTA unted for a much proportion of exports in each of the four sectors than in ARC-EAST. On average across the four
of all ARC-WE pared to just 31 tudy in manufacturing as a all m TA accounted for 44
all ARC-WEST but only 30 percent of all ARC-EAST rts.
he data also confirm Hypothesis 4, namely that there would be no large difference in exports to ow, exports to A proportion of ARC-
n ARC-WEST exports in two sectors (NAICS 334 AND ), but a r proportion in the two ors (NAICS 335 and 336). Across manufacturing, there ittle di ce in proportion of
shipped to Asia: these exports accounted for 22 percent of all ARC-EAST and 19 percent of
. Export Patterns from Selected States in the ARC R , 2002
34 – Computer & electronic products ARC-EA
ARC-WEST exports. This differential is slightly greater than for all manufacture The evide s to N accohigher sectors, exports to NAFTA accounted for 50 percent percent f
ST exports comor ARC-EAST. The differences in the four s
whole. However, the differential was greater even in sectors were greatanufacturing
e, where NAF
r than
percent of expo Finally, tAsia from the two regions. As the data sh sia accounted for a higherEAST tha
ct 337
w lowe
other se as l fferentotal exports all ARC-WEST exports. Table 5-1 egion NAICS 3 ST ARC-WEST EUROPE 37% 29% ASIA 31% 28% NAFTA 20% 33% NAICS 335 – Elect. Equip., appliances & components ARC-EAST ARC-WEST EUROPE 28% 24% ASIA 18% 19% NAFTA 35% 45% NAICS 336 – Transportation Equipment ARC-EAST ARC-WEST EUROPE 43% 23% ASIA 9% 12% NAFTA 32% 59% NAICS 337 – Furniture & fixtures ARC-EAST ARC-WEST EUROPE 18% 14% ASIA 17% 7% NAFTA 36% 64% Average of Sectors 334-337 ARC-EAST ARC-WEST EUROPE 31% 22% ASIA 19% 16% NAFTA 31% 50% ALL MANUFACTURING ARC-EAST ARC-WEST EUROPE 31% 25% ASIA 22% 19% NAFTA 30% 44% Source: MISER. Calculations by EDR Group.
Appalachian Regional Commission 112 Global Competitiveness of Selected Industries and Clusters in The Appalachian Region
Relatively little activity is seen in east-west traffic across the Appalachian region for exports from the six target industries. Kennedy Airport in New York and Miami International Airport in Florida are much more heavily used than airports in Pittsburgh and Atlanta. Similarly, the ports of Detroit, New York, Buffalo and Miami are used more intensely for exports of commodities from these six industries than the ports of Charleston, Norfolk and Baltimore. Companies are located in places from where they can cost-effectively move products to ports that, in turn, can transport these commodities to desired international destinations. Access to various ports is hindered by gaps in the ADHS because the gaps increase time to key interstate routes. Companies prefer to ship though built-up ports which are easily accessible through the federal interstate system, and gaps in the ADHS system hinders access to ports (or effectively reduces cost-effective choices when considering which ports to use). As location is in part chosen by existing access considerations, gaps along ADHS corridors influence business location. Easy and cost effective connections to interstate highways, or the lack of the same, influence where firms locate and the economic development of Appalachian counties.66
5.2 Summary and Policy Implications Based upon findings from prior ARC studies, analysis of production and trade data, and discussions with ETAC representatives, we selected six key industry sectors to serve as the focal point for assessing the strengths, weaknesses, opportunities and challenges faced by regional producers and exporters of goods and services within the Appalachian Region. The six industry clusters include: auto parts, electronic components, wooden household furniture, upholstered household furniture, food processing machinery and packaging machinery. Exports represent over $5 billion annually to Appalachian manufacturers in auto parts, electronic components, food processing machinery, packaging machinery and wood furniture industries. The auto parts industry accounts for more than 65 percent of the value of total exports from Appalachia among the six target industries, followed by electronic components, which account for 30 percent. This means that any aggregate reporting will tilt towards trends in the auto parts industry. For Appalachian exporters of automotive parts, NAFTA economies (Canada and Mexico) present the largest export market. Established Western European markets (Germany and Sweden), Asian/Pacific (Korea), and Latin American (Argentina) markets also offer good prospects for future growth. Table 5-2 presents the distribution of Appalachian exports by industry and destination. For Appalachian wooden and upholstered household furniture manufacturers, the NAFTA region (Canada & Mexico), Germany, Korea, Saudi Arabia, and the United Arab Emirates represent leading export markets. Europe, Canada, and Asia are leading destinations for U.S. exports of food processing machinery and packaging machinery. China and Eastern European markets open many dynamic growth opportunities for exporting microelectronic components for Appalachian manufacturers. Asian economies such as Taiwan also offer opportunities for growth in future demand for U.S.-made microelectronics.
66 In addition, though out of the scope of this study, the limitation that ground access places on demand at certain ports may limit the development of those ports.
Appalachian Regional Commission 113 Global Competitiveness of Selected Industries and Clusters in The Appalachian Region

Table 5-2. Foreign Markets - Distribution of Appalachian Exports
Motor Food Upholstered Wooden
Vehicle Processing Packaging Electronic Household Household
Destination Parts Machinery Machinery Components Furniture Furniture
frica 0.6% 2.3% 1.4% 0.8% 0.9% 1.3%
ia 11.1% 20.8% 12.5% 30.2% 18.0% 28.4%
ustralia 1.2% 3.2% 3.9% 1.2% 0.9% 0.5%
anada 65.6% 20.6% 26.1% 25.6% 48.9% 42.6%
ntral America 0.2% 3.3% 3.1% 1.4% 3.4% 7.0%
ope 10.3% 32.1% 38.1% 25.7% 22.3% 15.3%
exico 9.5% 8.5% 9.3% 9.9% 3.4% 3.0%
outh America 1.5% 9.3% 5.6% 5.1% 2.2% 1.8%
Appalachian Exports by Industry and Destination(Percent of Appalachian Industry Exports)
A
As
A
C
Ce
Eur
M
S
Sources: ITA, MISER, U.S. DOC through IMPLAN. Calculations by EDR Group and JFA. Detroit MI, New York, NY (the port and JFK Airport) and Miami (the port and Miami International Airport) are the most import ports of export from Appalachia. Detroit is expected in auto parts, but it is also among the top four ports for electronic components, packaging machinery, upholstered furniture, and wood furniture. For food processing machinery, Detroit and New York City represent the top two ports and Miami is eighth. The port of Buffalo-Niagara Falls, NY, also is the point of export of a significant amount of goods in all six industries. New York City and Buffalo-Niagara Falls are the most important ports in states that include Appalachian counties for exporting commodities in the six target industries originating in the Region. Other important ports in ARC states for these six commodities, though not located in the Appalachian Region, are Charleston, South Carolina (electronic components, food processing machinery, packaging machinery, wood furniture); Norfolk, Virginia (auto parts, food processing machinery, wood furniture); Baltimore, Maryland (auto parts, food processing machinery); Atlanta, Georgia (electronic components); and Champlain-Rousse Point, New York (food processing machinery). In addition to the ARC states, exports from Appalachian counties are routed though Texas (Laredo and Dallas-Fort Worth) and Jacksonville, Florida, and to a lesser extent, California (discovered from interviews). For these six industries, transportation of goods from Appalachia to ports of lading is primarily by truck to seaports and airports for international export. Trucking volume in tonnage ranges from 86 percent of all volume in auto parts to 95 percent in wood and upholstered furniture. Rail transportation is relevant only in the auto parts industry and air transportation is significant when assessing the value of electronic components shipped. Rail is important in the auto parts industry, accounting for 7 percent of tonnage shipped within the United States from states with Appalachian counties (but just 2 percent of the value shipped from ARC states). If the Appalachian average of 2.4 percent based on value is applicable to products shipped for export as well as general commodity flows, then rail is responsible for roughly $87 million of the $3.6 billion of auto parts exported by Appalachian companies. Air transportation is important in the electronic components industry. Nationally over 19 percent of the value in this sector is shipped within the U.S. by air. About four percent of shipments from ARC states are shipped by air, but more than 28 percent of the value of electronic components report using parcel
Appalachian Regional Commission 114 Global Competitiveness of Selected Industries and Clusters in The Appalachian Region

delivery services (which includes truck and air). If the Appalachian average of 4.1 percent based on value is applicable to products shipped for export as well as general commodity flows, then air transportation accounts for roughly $69 million of the $1.76 billion of electronic components sent to ports by Appalachian companies. In addition, $473 million corresponds to the 28.3 percent of the regional value of electronic components shipped by parcel services, and a portion of these millions is attributable to air cargo. Policy Implications Analysis and interviews with Appalachian companies have revealed two truths: first, the Interstate Highway System works, as it connects the ARC region with major northeast and Florida ship ports and airports; and second, companies prefer to ship through built-up ports which are easily accessible through the existing highway system at their current location. Very little activity is seen in east-west traffic across the Appalachian region for exports from these six industries. Kennedy Airport in New York, and Miami International Airport in Florida are much more heavily used than airports in Pittsburgh and Atlanta. Similarly, the ports of Detroit, New York, Buffalo and Miami are used more intensely for exports of commodities from these six industries than the ports of Charleston, Norfolk and Baltimore. Roadways are by far the most important transportation facilities in the ARC region for the six target commodities. The importance of the Appalachian Development Highway System (ADHS) is fostering connections to Interstate Highways that in turn are connected to major ports of lading for the target industries. Secondarily, ADHS provides access to smaller airports in areas that produce a disproportionate amount of Appalachia’s electronic components. Sixteen ADHS corridors important to international trade in the target industries are in various states of partial completion. Thirteen of these corridors provide connections to interstate highways, which, in turn, connect Appalachia to key ports for export of the target commodities. If trade was the sole criterion for setting priorities among these corridors (and of course it is not) than ARC will need to decide if its priority is to reinforce existing use of ports and strengthen ADHS roadway connections to Florida, Michigan and New York, or encourage use of ports in ARC states, such as Charleston, Baltimore and the Pittsburgh Airport. In general, the national transportation system serves the region by providing access to external markets and supplies. However, there is some evidence that improving access to the national network through completion of key links in the ADHS would provide additional opportunities in the six industries studied in this research for expanded output and production locations. Such expansion of opportunities could lead to additional employment and a further distribution of economic development within the region. Discussions with the target industries in the region indicated that development patterns and logistics planning were influenced by the quality and availability of the transportation network. Manufacturers sought to reduce total logistics costs by selecting production locations with good network access, utilizing intermodal connections when available and cost effective, and by taking advantage of international markets. ARC can contribute to this market expansion by identifying and alleviating constraints in the transportation network and by improving the highway, rail and waterway transportation systems.
Appalachian Regional Commission 115 Global Competitiveness of Selected Industries and Clusters in The Appalachian Region

APPENDIX A: REGIONAL INDUSTRIAL ANALYSIS The first section of Appendix A conducts a growth and shift share analysis of major industry groups in each of the 13 Appalachian States for the period 1986 to 2000. By comparing the growth trends in the regional industry to the national industry, this analysis helps us identify Appalachian industries with strong growth records. The second section narrows the analysis and focuses more on individual industries within the Appalachian region. Here, we review industry output intensity ratios, employment trends and export intensity ratios. The average annual growth rate for each industry was calculated utilizing real 1996 GSP (Gross State Product) data from the Bureau of Economic Analysis of the Department of Commerce. Industries were classified based on their two-digit SIC code.
A-1: Review of Regional Production Trends
Alabama During the 15-year period spanning from 1986 to 2000, the industrial machinery and electronic equipment industries in Alabama recorded double-digit average annual growth rates of 10.24 percent and 10.53 percent respectively. The manufacture of primary metals and motor vehicles also grew at average annual rates of 6.09 percent and 7.09 percent respectively. The apparel industry is the only industry that experienced a negative growth rate during the 15-year period. Table A-1 below presents average annual growth rates for major two-digit industries in the State of Alabama. Table A-1. Two-Digit Analysis for Major Industry Sectors in Alabama Two-Digit Industry State Avg Annual Growth Rate U.S. Avg Annual Growth Rate Shift Share
(1986 - 2000) (1986 - 2000) %State / %U.S. Farms 5.33% 3.68% 1.55 Metal mining 9.90% 7.41% 1.43 Coal mining 4.22% 5.35% 0.84 Lumber & wood 1.72% 0.13% 13.55 Furniture & Fixtures 3.03% 2.27% 1.33 Primary metals 6.09% 2.08% 3.14 Fabricated metals 2.98% 2.38% 1.34 Industrial machinery 10.24% 10.59% 1.04 Electronic equipment 10.53% 13.84% 0.81 Motor vehicles 7.09% 2.82% 2.69 Textile mill products 1.84% 1.13% 1.75 Apparel & other prod. -1.26% -0.87% 1.55 Paper products 0.28% 0.31% 0.98 Chemicals 1.64% 4.28% 0.41 Rubber & plastics 1.53% 6.16% 0.27 Source: Bureau of Economic Analysis of the Department of Commerce.
Appalachian Regional Commission 116 Global Competitiveness of Selected Industries and Clusters in The Appalachian Region
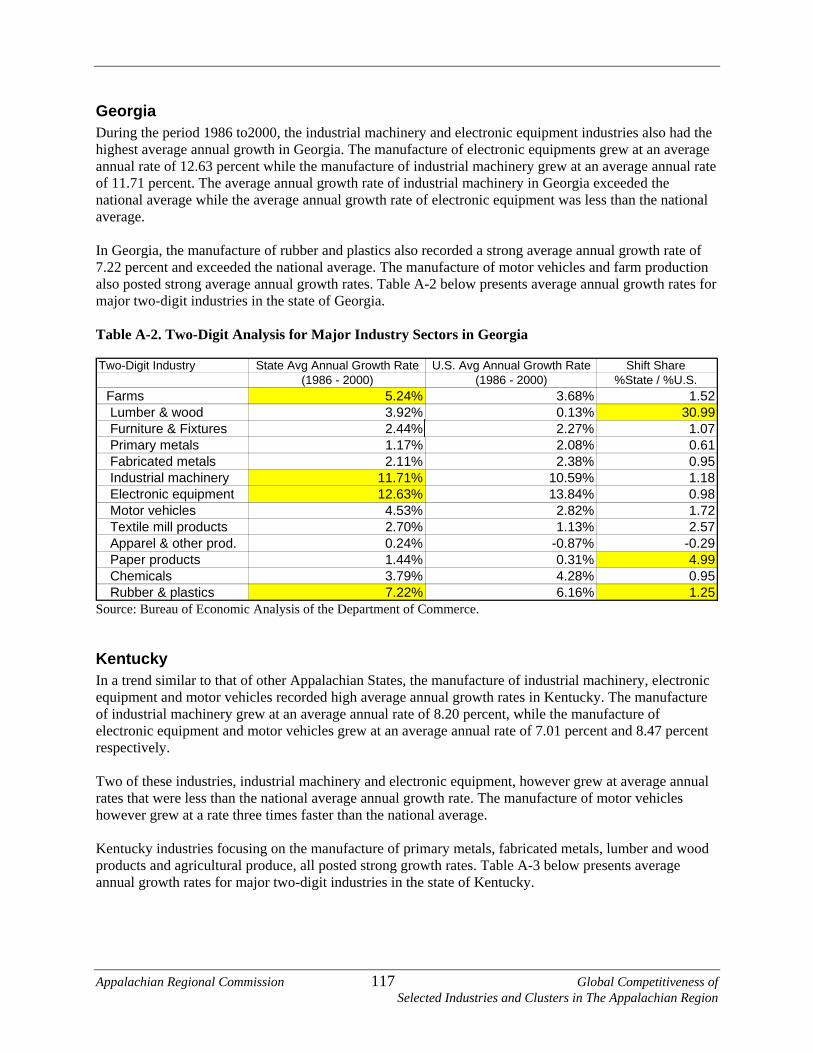
Georgia During the period 1986 to2000, the industrial machinery and electronic equipment industries also had the highest average annual growth in Georgia. The manufacture of electronic equipments grew at an average annual rate of 12.63 percent while the manufacture of industrial machinery grew at an average annual rate of 11.71 percent. The average annual growth rate of industrial machinery in Georgia exceeded the national average while the average annual growth rate of electronic equipment was less than the national average. In Georgia, the manufacture of rubber and plastics also recorded a strong average annual growth rate of 7.22 percent and exceeded the national average. The manufacture of motor vehicles and farm production also posted strong average annual growth rates. Table A-2 below presents average annual growth rates for major two-digit industries in the state of Georgia. Table A-2. Two-Digit Analysis for Major Industry Sectors in Georgia Two-Digit Industry State Avg Annual Growth Rate U.S. Avg Annual Growth Rate Shift Share
986 - 2000) %State / %U.S. rms 5.24% 3.68% 1.52
Lumber & wood 3.92% 0.13% 30.99 Fixtures 2.44% 2.27% 1.07
roducts 2.70% 1.13% 2.57
0.956.16% 1.25
(1986 - 2000) (1 Fa
Furniture & Primary metals 1.17% 2.08% 0.61 Fabricated metals 2.11% 2.38% 0.95 Industrial machinery 11.71% 10.59% 1.18 Electronic equipment 12.63% 13.84% 0.98 Motor vehicles 4.53% 2.82% 1.72 Textile mill p Apparel & other prod. 0.24% -0.87% -0.29 Paper products 1.44% 0.31% 4.99 Chemicals 3.79% 4.28% Rubber & plastics 7.22% ource: Bureau of Economic Analysis of the Department of Commerce.
a trend similar to that of other Appalachian States, the manufacture of industrial machinery, electronic equipment and motor vehicles recorded high average annual growth rates in Kentucky. The manufacture of industrial machinery grew at an average annual rate of 8.20 percent, while the manufacture of electronic equipment and motor vehicles grew at an average annual rate of 7.01 percent and 8.47 percent respectively. Two of these industries, industrial machinery and electronic equipment, however grew at average annual rates that were less than the national average annual growth rate. The manufacture of motor vehicles however grew at a rate three times faster than the national average. Kentucky industries focusing on the manufacture of primary metals, fabricated metals, lumber and wood products and agricultural produce, all posted strong growth rates. Table A-3 below presents average annual growth rates for major two-digit industries in the state of Kentucky.
S
Kentucky In
Appalachian Regional Commission 117 Global Competitiveness of Selected Industries and Clusters in The Appalachian Region

Table A-3. Two-Digit Analysis for Major Industry Sectors in Kentucky Two-Digit Industry State Avg Annual Growth Rate U.S. Avg Annual Growth Rate Shift Share
(1986 - 2000) (1986 - 2000) %State / %U.S. Farms 4.65% 3.68% 1.35 Coal mining 4.63% 5.35% 0.93 Lumber & wood 5.15% 0.13% 40.70 Furniture & Fixtures 4.58% 2.27% 2.01 Primary metals 6.70% 2.08% 3.46 Fabricated metals 6.66% 2.38% 2.99 Industrial machinery 8.20% 10.59% 0.83 Electronic equipment 7.01% 13.84% 0.54 Motor vehicles 8.47% 2.82% 3.21 Textile mill products 6.24% 1.13% 5.93 Apparel & other prod. 1.75% -0.87% -2.15 Paper products 3.98% 0.31% 13.77 Chemicals 3.76% 4.28% 0.94 Rubber & plastics 5.97% 6.16% 1.04 Source: Bureau of Economic Analysis of the Department of Commerce.
Maryland In Maryland, the average annual growth rates of industrial machinery and electronic equipment continued to dominate the manufacturing scene. The manufacture of electronic equipment grew at an annual average rate of 9.67 percent while the manufacture of industrial machinery grew at an average annual rate of 8.33 percent. However, both industries grew at average annual rates that were less than their corresponding national average. The manufacture of motor vehicles, apparel and paper products recorded negative average annual growth rates during the 1986 to 2000 period. Unlike the other states considered thus far, textile mill products recorded a strong average annual growth rate in Maryland (7.98 percent). Textile mill products also grew at an average annual rate that was at least seven times more than the national average annual growth rate for textile mill products. The manufacture of chemicals and plastic products also recorded strong growth rates that exceed the national average annual growth rate. Table A-4 below presents average annual growth rates for major two-digit industries in the state of Maryland. Table A-4. Two-Digit Analysis for Major Industry Sectors in Maryland Two-Digit Industry State Avg Annual Growth Rate U.S. Avg Annual Growth Rate Shift Share
986 - 2000) %State / %U.S. Farms 2.56% 3.68% 0.74
8.23% 5.35% 1.65
0.75-1.75
products 7.98% 1.13% 7.597% 2.72
0.31% -7.75Chemicals 5.17% 4.28% 1.29
Rubber & plastics 5.85% 6.16% 1.02
(1986 - 2000) (1
Coal mining Lumber & wood 0.10% 0.13% 0.81 Furniture & Fixtures 1.23% 2.27% 0.54 Primary metals 0.24% 2.08% 0.13 Fabricated metals 2.92% 2.38% 1.31 Industrial machinery 8.33% 10.59% 0.84 Electronic equipment 9.67% 13.84% Motor vehicles -4.60% 2.82% Textile mill Apparel & other prod. -2.22% -0.8 Paper products -2.24%
Source: Bureau of Economic Analysis of the Department of Commerce.
Appalachian Regional Commission 118 Global Competitiveness of Selected Industries and Clusters in The Appalachian Region

Mississippi During the 1986 to 2000 period, the manufacture of industrial machinery had the highest average annual growth rate in the state of Mississippi—11.7 percent. The electronic equipment and motor vehicle industries also recorded strong average annual growth rates of 8.95 percent and 6.83 percent respectively. The manufacture of lumber and wood products in Miss ppi grew twelve times faster than the national, while the apparel industry experienced a negative average annual growth. Table A-5 below presents average annual growth rates and shift share estimates for major two-digit industries in the state of Mississippi. Table A-5. Two-Digit Analysis for Major Industry Sectors in Mississippi
issi
Two-Digit Industry State Avg Annual Growth Rate U.S. Avg Annual Growth Rate Shift Share (1986 - 2000) (1986 - 2000) %State / %U.S.
Farms 5.55% 3.68% 1.62 Lumber & wood 1.56% Furniture & Fixtures 4.26%
0.13% 12.332.27% 1.87
Primary metals 4.47% 2.08% 2.30tals 1.88% 2.38% 0.84
achinery 11.70% 10.59% 1.18
2.597
1.79% 0.31% 4.91
Chemicals 5.79% 4.28% 1.451.30
Fabricated me Industrial m Electronic equipment 8.95% 13.84% 0.69 Motor vehicles 6.83% 2.82% Textile mill products 2.71% 1.13% 2.5 Apparel & other prod. -1.46% -0.87% Paper products 1.42 Rubber & plastics 7.51% 6.16%
ew York The manufacture of industrial machinery and electronic equipment again had the highest average annual growth rates (8.06 percent and 10.11 percent respectively). Both industries however grew at average annual rates that were less than the national average. The chemical industry and the rubber and plastics industry experienced positive growth rates (2.17 percent and 4.34 percent respectively) but grew at considerably lesser rates than the national average. During the 1986 to 2000 period, seven industries including the manufacture of lumber and wood, furniture and fixtures, primary metals, motor vehicles, apparel, textile and paper products experienced negative average annual growth rates. Table A-6 below presents average annual growth rates and shift share estimates for major two-digit industries in the state of New York.
Source: Bureau of Economic Analysis of the Department of Commerce.
N
Appalachian Regional Commission 119 Global Competitiveness of Selected Industries and Clusters in The Appalachian Region

Table A-6. Two-Digit Analysis for Major Industry Sectors in New York Two-Digit Industry State Avg Annual Growth Rate U.S. Avg Annual Growth Rate Shift Share
986 - 2000) %State / %U.S. Farms 2.29% 3.68% 0.67
0.30% 7.41% 0.0472
5.82
0.78
80
0.31% -1.62Chemicals 2.17% 4.28% 0.54
% 0.75
(1986 - 2000) (1
Metal mining Lumber & wood -0.72% 0.13% -5. Furniture & Fixtures -0.37% 2.27% -0.16 Primary metals -1.55% 2.08% -0.80 Fabricated metals 0.55% 2.38% 0.2 Industrial machinery 8.06% 10.59% 0 Electronic equipment 10.11% 13.84% Motor vehicles -0.10% 2.82% -0.04 Textile mill products -2.19% 1.13% -2.0 Apparel & other prod. -2.93% -0.87% 3.6 Paper products -0.47% Rubber & plastics 4.34% 6.16 ource: Bureau of Economic Analysis of the Department of Commerce.
North Carolina In a trend that is becoming quite consistent amongst Appalachian states, the manufacture of industrial machinery and electronic equipment again experienced the highest average annual growth rates in North Carolina. The industrial machinery industry grew at an average annual rate of 13.09 percent, exceeding the national average by more than three percent. The manufacture of electronic equipment grew at an average annual rate of 12.06 percent but it did not exceed the national average rate. Agricultural production, chemical production and motor vehicle production all recorded strong average annual growth rates in North Carolina. Table A-7 below presents average annual growth rates and shift share estimates for major two-digit industries in the state of North Carolina. Table A-7. Two-Digit Analysis for Major Industry Sectors in North Carolina
S
Two-Digit Industry State Avg Annual Growth Rate U.S. Avg Annual Growth Rate Shift Share (1986 - 2000) (1986 - 2000) %State / %U.S.
Farms 6.42% 3.68% 1.87 Lumber & wood 0.67% 0.13% 5.28 Furniture & Fixtures 1.15% 2.27% 0.50 Primary metals 4.45% 2.08% 2.30 Fabricated metals 4.06% 2.38% 1.83 Industrial machinery 13.09% 10.59% 1.32 Electronic equipment 12.06% 13.84% 0.93 Motor vehicles 5.85% 2.82% 2.22 Textile mill products 0.10% 1.13% 0.10 Apparel & other prod. -0.83% -0.87% 1.01 Paper products 0.02% 0.31% 0.08 Chemicals 6.77% 4.28% 1.70 Rubber & plastics 5.48% 6.16% 0.95 Source: Bureau of Economic Analysis of the Department of Commerce.
Appalachian Regional Commission 120 Global Competitiveness of Selected Industries and Clusters in The Appalachian Region

Ohio In Ohio, all major two-digit industries experienced positive average annual growth rates with the exception of the apparel industry. As observed in previous states examined, the manufacture of industrial machinery and electronic equipment witnessed the highest average annual growth rates. Both industries however grew at rates less than the national average. The average annual growth rate for lumber and wood production was 30 times higher than the national average. Table A-8 below presents average annual growth rates and shift share estimates for major two-digit industries in the state of Ohio. Table A-8. Two-Digit Analysis for Major Industry Sectors in Ohio Two-Digit Industry State Avg Annual Growth Rate U.S. Avg Annual Growth Rate Shift Share
986 - 2000) %State / %U.S. rms 3.85% 3.68% 1.12
Coal mining 4.31% 5.35% 0.86 4.79% 0.13% 37.84
50.74
es 1.80% 2.82% 0.68
0.87 Rubber & plastics 4.19% 6.16% 0.73
(1986 - 2000) (1 Fa
Lumber & wood Furniture & Fixtures 3.49% 2.27% 1.53 Primary metals 1.34% 2.08% 0.69 Fabricated metals 1.77% 2.38% 0.79 Industrial machinery 8.45% 10.59% 0.8 Electronic equipment 9.61% 13.84% Motor vehicl Textile mill products 3.71% 1.13% 3.53 Apparel & other prod. -3.35% -0.87% 4.11 Paper products 0.48% 0.31% 1.68 Chemicals 3.48% 4.28%
Source: Bureau of Economic Analysis of the Department of Commerce.
Pennsylvania The manufacturers of industrial machinery and electronic equipment also recorded strong growth rates in Pennsylvania. The manufacture of industrial machinery grew at an average annual rate of 8.06 percent but did not exceed the national average for industrial machinery. The manufacture of electronic equipment grew at an average annual rate of 13.17 percent and exceeded the national average for electronic equipments. Coal mining, chemical production and plastics production also recorded strong average annual growth rates that exceeded the corresponding national average. Table A-9 below presents average annual growth rates and shift share estimates for major two-digit industries in the state of Pennsylvania.
Appalachian Regional Commission 121 Global Competitiveness of Selected Industries and Clusters in The Appalachian Region

Table A-9. Two-Digit Analysis for Major Industry Sectors in Pennsylvania Two-Digit Industry State Avg Annual Growth Rate U.S. Avg Annual Growth Rate Shift Share
(1986 - 2000) (1986 - 2000) %State / %U.S. Farms 3.16% 3.68% 0.92 Coal mining 5.54% 5.35% 1.11 Lumber & wood 1.89% 0.13% 14.92 Furniture & Fixtures 1.04% 2.27% 0.46 Primary metals 1.15% 2.08% 0.59 Fabricated metals 1.88% 2.38% 0.84 Industrial machinery 8.60% 10.59% 0.87 Electronic equipment 13.17% 13.84% 1.02 Motor vehicles -0.42% 2.82% -0.16 Textile mill products 1.96% 1.13% 1.86 Apparel & other prod. -2.63% -0.87% 3.22 Paper products 0.92% 0.31% 3.17 Chemicals 6.93% 4.28% 1.73 Rubber & plastics 6.85% 6.16% 1.19 Source: Bureau of Economic Analysis of the Department of Commerce.
South Carolina Metal mining grew at an annual average rate of 47.2 percent in South Carolina. This is six times higher than the national average annual growth rate for metal mining. The manufacture of industrial machinery, electronic equipment and motor vehicles also recorded double digit average annual growth rates in South Carolina. The motor vehicle industry grew at an average annual rate of 17.16 percent, growing eight times faster than the national industry. The manufacture of lumber and wood products and textile products all recorded negative growth rates. Table A-10 below presents average annual growth rates and shift share estimates for major two-digit industries in the state of South Carolina. Table A-10. Two-Digit Analysis for Major Industry Sectors in South Carolina Two-Digit Industry State Avg Annual Growth Rate U.S. Avg Annual Growth Rate Shift Share
986 - 2000) %State / %U.S. Farms 6.93% 3.68% 2.02 Metal mining 47.20% 7.41% 6.83 Lumber & wood -0.27% 0.13% -2.13 Furniture & Fixtures 1.84% 2.27% 0.81 Primary metals 2.37% 2.08% 1.22 Fabricated metals 3.86% 2.38% 1.74 Industrial machinery 13.54% 10.59% 1.37 Electronic equipment 12.03% 13.84% 0.93 Motor vehicles 17.16% 2.82% 6.52 Textile mill products -0.06% 1.13% -0.06 Apparel & other prod. -3.54% -0.87% 4.34 Paper products 1.58% 0.31% 5.48 Chemicals 0.15% 4.28% 0.04 Rubber & plastics 8.21% 6.16% 1.43
(1986 - 2000) (1
Source: Bureau of Economic Analysis of the Department of Commerce.
Appalachian Regional Commission 122 Global Competitiveness of Selected Industries and Clusters in The Appalachian Region

Tennessee During the period 1986 to 2000, the manufacture of primary metals increased by an average annual rate of 9.21 percent in Tennessee, while the manufacture of rubber and plastics grew at an average annual rate of 5.74 percent. Again, as observed in other Appalachian states, the manufacture of industrial machinery and electronic equipment recorded the highest growth rates. Table A-11 below presents average annual growth rates and shift share estimates for major two-digit industries in the state of Tennessee. Table A-11. Two-Digit Analysis for Major Industry Sectors in Tennessee Two-Digit Industry State Avg Annual Growth Rate U.S. Avg Annual Growth Rate Shift Share
(1986 - 2000) (1986 - 2000) %State / %U.S. Farms 2.58% 3.68% 0.75 Metal mining 5.19% 7.41% 0.75 Coal mining 0.03% 5.35% 0.01 Lumber & wood 1.62% 0.13% 12.79 Furniture & Fixtures 0.89% 2.27% 0.39 Primary metals 9.21% 2.08% 4.75 Fabricated metals 1.95% 2.38% 0.88 Industrial machinery 10.67% 10.59% 1.08 Electronic equipment 11.87% 13.84% 0.92 Motor vehicles 10.79% 2.82% 4.10 Textile mill products 1.59% 1.13% 1.51 Apparel & other prod. -3.74% -0.87% 4.58 Paper products 0.08% 0.31% 0.26 Chemicals 2.35% 4.28% 0.59 Rubber & plastics 5.74% 6.16% 1.00 Source: Bureau of Economic Analysis of the Department of Commerce.
Virginia The manufacture of industrial machinery and motor vehicles had the highest average annual growth rates in Virginia. The manufacture of industrial machinery grew at an average annual rate of 12.65 percent and exceeded the national average for industrial machinery. The manufacture of motor vehicles increased at an average annual rate of 10.97 percent, which was four times higher than the national average. The manufacture of rubber and plastics also grew at an impressive average annual rate of seven percent and exceeded the national average annual growth rate for rubber and plastics by 21 percent. With the exception of apparel manufacturers and textile mill products, no industry in Virginia experienced a negative growth rate. Table A-12 below presents average annual growth rates and shift share estimates for major two-digit industries in the State of Virginia.
Appalachian Regional Commission 123 Global Competitiveness of Selected Industries and Clusters in The Appalachian Region

Table A-12. Two-Digit Analysis for Major Industry Sectors in Virginia Two-Digit Industry State Avg Annual Growth Rate U.S. Avg Annual Growth Rate Shift Share
986 - 2000) %State / %U.S. Farms 3.59% 3.68% 1.04
8.89% 7.41% 1.290.65
28
079
4.28% 0.391.22
(1986 - 2000) (1
Metal mining Coal mining 3.26% 5.35% Lumber & wood 0.52% 0.13% 4.11 Furniture & Fixtures -0.45% 2.27% -0.20 Primary metals 4.45% 2.08% 2.30 Fabricated metals 1.27% 2.38% 0.57 Industrial machinery 12.65% 10.59% 1. Electronic equipment 6.11% 13.84% 0.47 Motor vehicles 10.97% 2.82% 4.17 Textile mill products -1.12% 1.13% -1. Apparel & other prod. -4.07% -0.87% 4.9 Paper products 0.07% 0.31% 0.25 Chemicals 1.56% Rubber & plastics 7.00% 6.16%
West Virginia West Virginia is the only state in Appalachia where the manufacture of industrial machinery and electronic equipment did not record the highest average annual growth rates. Metal mining, motor vehicle and rubber and plastics recorded the highest average annual growth rates. Metal mining grew at an average annual rate of 15 percent while motor vehicles and rubber and plastics grew at an average annual rate of 13.29 percent and 11.02 percent respectively. The average annual growth rate in all three West Virginia industries exceeded their corresponding national average growth rate. The manufacture of lumber and wood products also recorded a strong average annual growth rate. The manufacture of wood and lumber products grew at an average annual rate of 6.26 percent, and grew 40 times faster than the national average annual growth rate for lumber and wood products. Again, the manufacture of apparel recorded a negative growth rate. Table A-13 below presents average annual growth rates and shift share estimates for major two-digit industries in the state of West Virginia. Table A-13. Two-Digit Analysis for Major Industry Sectors in West Virginia
Source: Bureau of Economic Analysis of the Department of Commerce.
Two-Digit Industry State Avg Annual Growth Rate U.S. Avg Annual Growth Rate Shift Share 986 - 2000) %State / %U.S.
Farms 1.43% 3.68% 0.4215.00% 7.41% 2.17
1.09
0.301.44
10.59% 0.7813.84% 0.52
r vehicles 13.29% 2.82% 5.041.13% 5.24
-0.87% 4.53 Paper products 3.40% 0.31% 11.76 Chemicals 2.57% 4.28% 0.64 Rubber & plastics 11.02% 6.16% 1.92
(1986 - 2000) (1
Metal mining Coal mining 5.46% 5.35% Lumber & wood 6.26% 0.13% 49.50 Furniture & Fixtures 4.46% 2.27% 1.96 Primary metals 0.57% 2.08% Fabricated metals 3.21% 2.38% Industrial machinery 7.68% Electronic equipment 6.71% Moto T extile mill products 5.51%
Apparel & other prod. -3.69%
Source: Bureau of Economic Analysis of the Department of Commerce.
Appalachian Regional Commission 124 Global Competitiveness of Selected Industries and Clusters in The Appalachian Region

Appalachian States are analysis for major industries in all 13 Appalachian states
ombined. Industries with positive growth rates, but shift share ratios below one, have more opportunities Chart A-1 below presents a shift shcfor future growth since they are currently performing below the national average. Examples of such industries include electronic equipment, chemicals, coal mining and furniture and fixtures. Chart A-1. Shift Share Analysis for Major Industries in Appalachia
1.20
2.08
0.89
16.54
Farms
Metal mining
Coal mining
Lumber & wood
0.93
1.61
1.21
1.03
0.78
2.38
2.27
Furniture & Fixtures
Primary metals
Fabricated metals
Industrial machinery
Electronic equipment
Motor vehicles
. Textile mill prod
Two-
Dig
it In
dust
ries
2.61
2.92
1.08
2.00 4.00 6.00 8.00 10.00 12.00 14.00 16.00 18.00
d
Paper products
Rubber & plastics
Avg. Annual Growth Rate
0.89 Chemicals
. Apparel & other pro
0.00
Source: Bureau of Economic Analysis of the Department of Commerce.
Appalachian Regional Commission 125 Global Competitiveness of Selected Industries and Clusters in The Appalachian Region

A-2: Industry Analysis This section conducts an analysis of major industry groups in the Appalachian region. The analysis will assist in identifying key industry sectors that will serve as the focal point in later analyses. The Gross State Product data used were obtained from the Bureau of Economic Analysis of the Department of Commerce while import/export/ trade data were obtained from the International Trade and Economic Statistics segment of Export.Gov (the U.S. Government Export Portal).67
Industrial Machinery Industry Overview The industrial machinery industry is a major industrial group defined by the two-digit SIC code 35. It includes a diverse body of establishments engaged in manufacturing engines and turbines; farm and garden machinery; elevators and conveying equipment; construction, mining and oil field machinery;
machinery; pumps, roller earings, compressors and power transmissions for industrial machines; computer and peripheral quipment and office machinery.68 Within the Appalachian region, manufacturers of industrial machinery
eville-Spartanburg metropolitan area of South Carolina in the Johnstown and ittsburgh, Pennsylvania area.
s n
e region.
While the industrial machinery industry is a leading and important element of the Appalachian region’s onomies of Appalachian states is still
elow the national average—implying that there is room for expansion. Table A-14 presents output tensity indices for the industrial machinery sector in Appalachian states. It compares the industry’s
l below the ational average.
manufacture of metalworking, textile, woodworking, paper and printingbeare clustered in the GreenP The industrial machinery industry in Appalachia is a well-established, technology intensive sector that idominated by small and mid-size firms. A study commissioned by the Appalachian Regional Commissio(ARC) identified the industrial machinery sector as one of the three industries (value-chains) with thstrongest evidence of localized clustering within the Appalachian Output Intensity Analysis
manufacturing sector, the contribution of the industry to the ecbinimpact on the local economy to the industry’s impact on the national economy. Relative to the national economy, the industrial machinery sector has had a greater impact on the economies of Kentucky, North Carolina, Ohio, Pennsylvania, South Carolina and Tennessee. The output intensity index for all Appalachian states however shows that the region is performing weln
gement and Budget, 1987. 67 http://www.export.gov/trandestatistics.html 68 Standard Industrial Classification Manual, U.S. Office of Mana
Appalachian Regional Commission 126 Global Competitiveness of Selected Industries and Clusters in The Appalachian Region

Table A-14. Machinery Industry Output Intensity Indices
Two-Digit Industry State Industry / State GSP U.S. Industry / U.S. GSP Output Intensity(1986 - 2000) (1986 - 2000) %State / %U.S.
Alabama Georgia
1.31% 1.64% 0.800.76% 1.64% 0.471.94% 1.64% 1.180.59% 1.64% 0.36
i 1.40% 1.64% 0.850.64
1.721.01
4% 1.541.03
85
01
Output Intensity Analysis for the Industral Machinery Group
Kentucky Maryland MississippNew York 1.06% 1.64%North Carolina 2.17% 1.64% 1.32Ohio 2.82% 1.64%Pennsylvania 1.66% 1.64%South Carolina 2.53% 1.6
ennessee 1.68% 1.64%TVirginia 0.62% 1.64% 0.3West Virginia 0.57% 1.64% 0.3Appalachia 0.01% 1.64% 0.
achinery exports from Appalachian states decreased from $22.1 billion in 1997 to $22.0 billion in 2001 (see Table A-15). The observed decline in national and regional export sales has been attributed to the recession in many foreign markets and a weak global demand. For example, U.S. cutting tool exports to Japan declined by 62 percent from 1997 to 1999. Despite the decline in exports, Appalachian states maintained their share of national industrial machinery exports.
tates
Source: Bureau of Economic Analysis of the U.S. Department of Commerce. Export Growth Trends M
Table A-15. Industrial Machinery Exports from Appalachian S
1997 1998 1999 2000 2001Appalachia States Exports 22,126,177 20,566,075 20,063,677 22,013,743 21,278,642United States Exports 82,874,444 79,444,590 76,388,334 89,842,641 81,512,646App Exports. / U.S. Exports 26.70% 25.89% 26.27% 24.50% 26.10%
Industrial Machinery Exports (000,dollars)
mic Statistics (Export.Gov).
As the global economy recovers and import demand improves, industrial machinery export sales are expected to rebound. Especially since prior to the recession in the late 1990s, foreign demand grew much faster than domestic demand. China's admittance into the WTO could create an opportunity for increased U.S. industrial machinery exports over the medium- and long-term, while exports to Canada and Mexico should wax stronger as the economic integration of the three NAFTA markets continues. Appalachian states are particularly strong in the following industry sub-sectors: food processing machinery, packaging machinery, textile machinery, metal working machinery, wood working, machine tools and the general components industry. However, Appalachian firms would need to incorporate new production techniques and develop higher valued products in order to penetrate new markets and expand sales to existing markets.
Source: International Trade and Econo
Appalachian Regional Commission 127 Global Competitiveness of Selected Industries and Clusters in The Appalachian Region

Traditional markets for U.S. exports are Japan, Canada, Europe, and Mexico. The Department of ommerce projects that Argentina, Brazil, India, and Turkey offer the greatest potentials for future export
growth.
rowth and Export Prospects for Industrial Machinery
he industrial machinery sector in Appalachia appears to have good potential for further export
-digit SIC code 24. It includes
stablishments engaged in manufacturing mainly wood or wood related finished products.69 Establishments producing furniture and fixtures are not included in this group. The Appalachian region is one of the leading production areas of lumber and hardwood products in the U.S. On average, the lumber and wood industry in Appalachian states account for 39 percent of total national production. Table A-16 presents national and regional data for the lumber and wood products industry. Industry average annual growth rates are particularly strong in the states of Georgia, Kentucky, Ohio and West Virginia. Table A-16. Lumber and Wood Manufacturing Industry Data
C
G Tdevelopment.
Lumber and Wood Products ndustry Overview I
The lumber and wood products industry group is defined by the twoestablishments engaged in cutting timber and pulpwood; merchant sawmills, lath mills, shingle mills, veneer mills and plywood mills engaged in producing lumber and wood related products; and e
1995 1996 1997 1998 1999 2000Appalachia States Prod. 15,810 15,601 15,498 15,914 16,812 17,024United States Prod. 41,588 39,922 39,532 40,096 42,969 44,130Appalachia GSP 2,477,567 2,559,208 2,665,176 2,802,466 2,913,662 3,036,268App Prod. / U.S. Prod. 38% 39% 39% 40% 39% 39%
Manufacture of Wood Products, GSP Data (Millions of dollars)
Source: Bureau of Economic Analysis of the Department of Commerce. Output Intensity Analysis Table A-17 presents the lumber and wood products output intensity indices for Appalachian states and the U.S. When compared to the impact of the industry on the national economy, the output intensity index for the region (1.56) indicates that the wood and lumber products industry is more important to the economies of Appalachian states.
69 Standard Industrial Classification Manual, U.S. Office of Management and Budget, 1987.
Appalachian Regional Commission 128 Global Competitiveness of Selected Industries and Clusters in The Appalachian Region

Table A-17. Lumber and Wood Products Output Intensity Indices
Two-Digit Industry State Industry / State GSP U.S. Industry / U.S. GSP Location Quotient(1986 - 2000) (1986 - 2000) %State / %U.S.
Alabama 1.86% 0.60% 3.08Georgia 1.07% 0.60% 1.77Kentucky 0.59% 0.60% 0.98Maryland 0.14% 0.60% 0.24Mississippi 2.88% 0.60% 4.77New York 0.12% 0.60% 0.20North Carolina 1.04% 0.60% 1.72Ohio 0.46% 0.60% 0.77Pennsylvania 0.55% 0.60% 0.92South Carolina 0.98% 0.60% 1.63Tennessee 0.75% 0.60% 1.24Virginia 0.72% 0.60% 1.19West Virginia 1.10% 0.60% 1.82Appalachia 0.94% 0.60% 1.56
Output Intensity Analysis for the Lumber and Wood Products Industry Group
Source: Bureau of Economic Analysis of the U.S. Department of Commerce. Export Growth Trends
able A-18 below shows the trend in lumber and wood product exports for Appalachian states and the .S. For all Appalachian states, lumber and wood product exports declined from $1.7 billion in 1997 to
$1.4 billion in 2001—a 21 percent decline. The southern Appalachian states of Georgia, Mississippi, and greatest decline in lumber and wood products exports. Canada and
estern Europe have traditionally been the leading market for U.S. wood products. New markets are xico and the Far East.
nt.
TU
South Carolina experienced theWbeen exploited in Me Growth and Export Prospects for Lumber and Wood Products The lumber and wood products industry appears to offer good potentials for future export developme
Appalachian Regional Commission 129 Global Competitiveness of Selected Industries and Clusters in The Appalachian Region
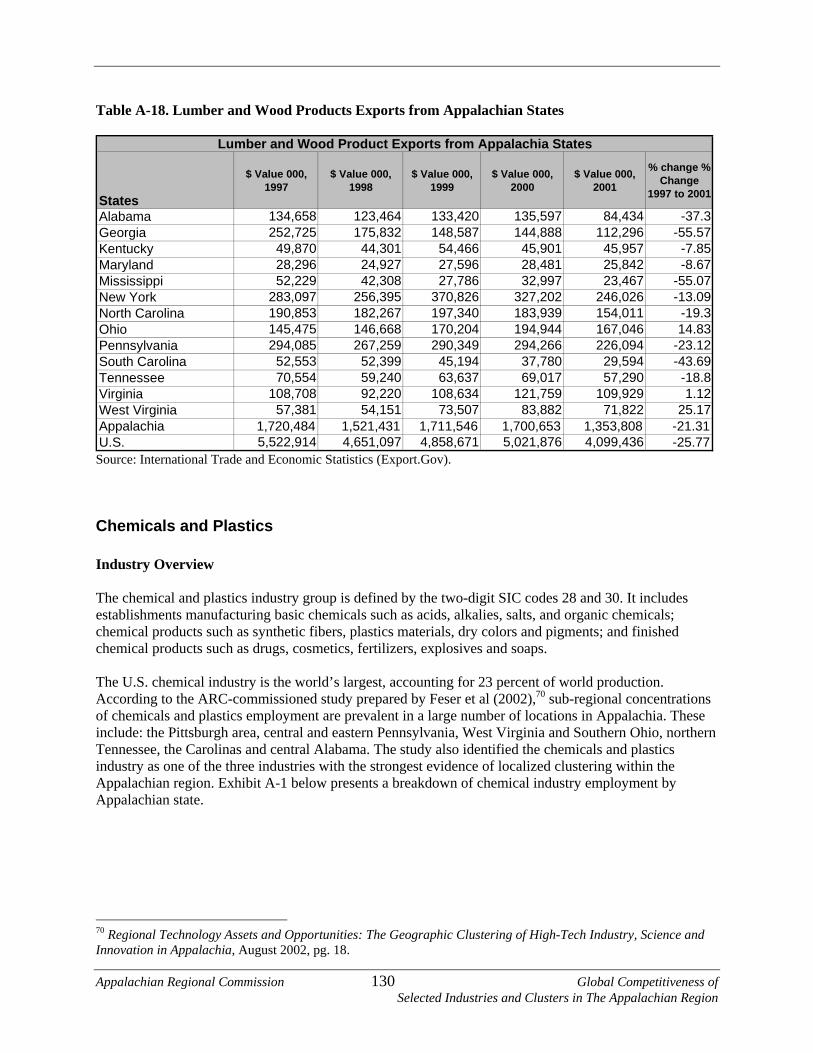
Table A-18. Lumber and Wood Products Exports from Appalachian States
States
$ Value 000, 1997
$ Value 000, 1998
$ Value 000, 1999
$ Value 000, 2000
$ Value 000, 2001
% change % Change
1997 to 200
Alabama 134,658 123,464 133,420 135,597 84,434 -37.3Georgia 252,725 175,832 148,587 144,888 112,296 -55.57Kentucky 49,870 44,301 54,466 45,901 45,957 -7.85Maryland 28,296 24,927 27,596 28,481 25,842 -8Mississi
1
.67ppi 52,229 42,308 27,786 32,997 23,467 -55.07k 283,097 256,395 370,826 327,202 246,026 -13.09
190,853 182,267 197,340 183,939 154,011 -19.3hio 145,475 146,668 170,204 194,944 167,046 14.83
-23.1269
18.8
.171,711,546 1,700,653 1,353,808 -21.31
. 5,522,914 4,651,097 4,858,671 5,021,876 4,099,436 -25.77
chia StatesLumber and Wood Product Exports from Appala
New YorNorth Carolina OPennsylvania 294,085 267,259 290,349 294,266 226,094South Carolina 52,553 52,399 45,194 37,780 29,594 -43.Tennessee 70,554 59,240 63,637 69,017 57,290 -Virginia 108,708 92,220 108,634 121,759 109,929 1.12West Virginia 57,381 54,151 73,507 83,882 71,822 25Appalachia 1,720,484 1,521,431U.S
Chemicals and Plastics Industry Overview The chemical and plastics industry group is defined by the two-digit SIC codes 28 and 30. It includes establishments manufacturing basic chemicals such as acids, alkalies, salts, and organic chemicals; chemical products such as synthetic fibers, plastics materials, dry colors and pigments; and finished chemical products such as drugs, cosmetics, fertilizers, explosives and soaps. The U.S. chemical industry is the world’s largest, accounting for 23 percent of world production. According to the ARC-commissioned study prepared by Feser et al (2002),70 sub-regional concentrations of chemicals and plastics employment are prevalent in a large number of locations in Appalachia. These include: the Pittsburgh area, central and eastern Pennsylvania, West Virginia and Southern Ohio, northern Tennessee, the Carolinas and central Alabama. The study also identified the chemicals and plastics industry as one of the three industries with the strongest evidence of localized clustering within the Appalachian region. Exhibit A-1 below presents a breakdown of chemical industry employment by Appalachian state.
Source: International Trade and Economic Statistics (Export.Gov).
70 Regional Technology Assets and Opportunities: The Geographic Clustering of High-Tech Industry, Science and Innovation in Appalachia, August 2002, pg. 18.
Appalachian Regional Commission 130 Global Competitiveness of Selected Industries and Clusters in The Appalachian Region

Exhibit A-1: Distribution of Total Appalachian Chemical Industry Employment (1995 to 2001)
Alabama 3%
Georgia 5% Kentucky
4%
North Carolina 15%
Ohio 14%
Pennsylvania 21%
South Carolina 6%
Tennessee 6%
Virginia 6%
West Virginia 4% Maryland
3%Mississippi
2%
New York 11%
Source: Bureau of Economic Analysis of the U.S. Department of Commerce. Na
ational chemical industry employment increased from 1.052 million in 1995 to 1.054 million in 2000—hand, chemical industry employment in Appalachian
24 in 1995 to 409,181 in 2000—a decrease of three percent. In general, the
d manufacture sub-
The output intensity index for all Appalachian states (1.46) implies that the contribution of the chemical industry sector to the local economy exceeds the contribution of the industry to the national economy. As such, the chemicals industry is relatively more important to states in the Appalachian region.
marginal increase of 0.26 percent. On the other tates declined from 423,7s
chemicals industry is not labor intensive and does not generate many new jobs over time. Although some plants employ over a thousand people, most large plants employ between 200 and 500 people. Medium sized plants employ about 200 people, while smaller and specialty chemical plants employ about 50 people. Output Intensity Analysis Most manufacturers in Appalachia are concentrated in the plastics industry anassembly plastic products for large equipment manufacturers. Table A-19 below presents the relative contribution of the chemical and plastics industry to Appalachian state economies. Specifically, the chemicals industry contributes more to the economies of Kentucky, North Carolina, South Carolina, Tennessee and West Virginia. Some of these states were earlier identified as states with evidence of significant chemical and plastics clustering activities.
Appalachian Regional Commission 131 Global Competitiveness of Selected Industries and Clusters in The Appalachian Region

Table A-19. Chemicals and Plastics Output Intensity Indices for Appalachian States
Two-Digit Industry State Industry / State GSP U.S. Industry / U.S. GSP Location Quotient(1986 - 2000) (1986 - 2000) %State / %U.S.
0.96
1.94% 0.611.94% 0.851.94% 0.59
1.94% 1.65uth Carolina 4.96% 1.94% 2.55
Tennessee 2.97% 1.94% 1.531.94% 0.92
st Virginia 7.44% 1.94% 3.832.84% 1.94% 1.46
Output Intensity Analysis for the Chemical and Related Products Industry Group
Alabama 1.87% 1.94%Georgia 1.35% 1.94% 0.70Kentucky 2.44% 1.94% 1.26
aryland 1.18%MMississippi 1.66%New York 1.15%North Carolina 4.19% 1.94% 2.16Ohio 2.72% 1.94% 1.40Pennsylvania 3.19%So
Virginia 1.79%WeAppalachia
omic Analysis of the U.S. Department of Commerce.
icals industry is the largest exporting industrial sector in the U.S. The global chemicals market
RC-the
gion since most firms are able to stay competitive within a 300 mile radius.71
Table A-20 below presents trends in industry exports by state. Exports from Pennsylvania and Tennessee declined during the 1997 to 2001 period. Though Erie, Pennsylvania is regarded as one of the nation’s leading centers of plastics production, most small and medium sized manufacturers there tend to focus on the manufacture of sub-assembly plastic products for large equipment manufacturers as opposed to final products that are more suited for export markets.
Source: Bureau of Econ Export Growth Trends
he chemTis fiercely competitive and trade contracts are usually negotiated on a long-term basis. Unlike other industries where foreign markets hold the key to their future, the chemical and plastics industry in Appalachia is made up of small and medium sized firms that are focused on creating niches within the domestic U.S. market. The industry in Appalachia is thus not a vibrant exporting sector. In fact, an Aommissioned study found that there is a general lack of interest in exporting among many firms in c
re
71 Exports, Competitiveness, and Synergy in Appalachian Industry Clusters, February 1997, pg. 15. Prepared by Regional Technology Strategies, Inc. Chapel Hill, North Carolina
Appalachian Regional Commission 132 Global Competitiveness of Selected Industries and Clusters in The Appalachian Region

Table A-20. Chemicals and Plastics Exports from Appalachian States
States
$ Value 000, 1997
$ Value 000, 1998
$ Value 000, 1999
$ Value 000, 2000
$ Value 000, 2001
% change % Change 1997 to
2001
Alabama 83,655 93,720 80,496 80,017 75,609 -9.62Georgia 213,245 226,767 198,028 275,341 236,170 10.75Kentucky 149,680 185,626 226,106 271,500 232,619 55.41Maryland 91,441 99,923 112,073 106,453 110,808 21.18
1
342,228 391,634 729,759 1,134,452 1,052,955 207.68ennessee 357,366 390,780 355,278 356,239 322,226 -9.83
255,106 246,487 260,139 332,237 317,563 24.48est Virginia 8,663 10,615 10,621 11,663 18,727 116.17
Mississippi 42,611 50,945 65,711 75,132 50,650 18.87New York 783,316 651,892 642,682 937,202 798,310 1.9North Carolina 320,960 340,938 434,164 459,477 493,996 53.91Ohio 1,260,993 1,412,739 1,493,246 1,973,282 1,647,128 30.62Pennsylvania 593,984 677,591 694,879 526,815 466,459 -21.47South Carolina TVirginia WAppalachia 4,503,248 4,779,657 5,303,182 6,539,810 5,823,220 29.31U.S. 14,035,946 14,522,221 15,196,968 17,714,657 16,508,439 17.62
Rubber and Plastics Product Exports from Appalachia States
ium ucts that can be sold directly overseas”
r future xport promotion. But the potential is not very strong.
Automobiles, Auto-parts and Related Products
Industry Overview The motor vehicles and motor vehicle industry group is defined by the three-digit SIC code 371. It includes establishments engaged in manufacturing or assembling complete passenger automobiles, trucks, commercial cars, buses, motor vehicle parts and accessories, truck and bus bodies and passenger car bodies. The motor vehicle industry is one of the strongest technology-related sectors in Appalachia. It is classified as a traditional high tech industry with moderate technology-intensity. According to the ARC-sponsored study, the motor vehicle industry’s strongest clusters are in counties located in Ohio, Kentucky and Tennessee. Tale A-21 presents national and regional motor vehicle and auto parts production data.
Source: International Trade and Economic Statistics (Export.Gov). According to ARC, the only way “the only way to increase the export potential of small and medized plants may be to offer assistance in developing unique prods
—especially since finished products are more likely to be exported.72
Growth and Export Prospects for Plastics and Chemicals
he chemical and plastics industry in Appalachia has some potential that can be developed foTe
72 See Exports, Competitiveness, and Synergy in Appalachian Industry Clusters, February 1997, pg. vi.
Appalachian Regional Commission 133 Global Competitiveness of Selected Industries and Clusters in The Appalachian Region

Table A-21. Motor Vehicle and Auto Parts Manufacturing Industry Data
1995 1996 1997 1998 1999 2000Appalachia States Prod. 37,846 35,317 38,465 44,989 44,349 45,523United States Prod. 103,170 92,240 97,068 111,628 114,744 116,879Appalachia GSP 2,477,567 2,559,208 2,665,176 2,802,466 2,913,662 3,036,268App Prod. / U.S. Prod.
od. / App GSP.
Manufacture of Motor Vehicles and Related Products, GSP Data (Millions of dollars)
37% 38% 40% 40% 39% 39%1.53% 1.38% 1.44% 1.61% 1.52% 1.50%App Pr
on in 1995 to $45.5 billion in 2000—an increase of 20 percent. During the 1995 and related products
resents data on the contribution of the motor vehicle industry to respective state economies states of Ohio and Tennessee. These were earlier ities. In fact, Ohio is at the center of the motor
merica—with more than 80 percent of North American light vehicle
alachian states combined is greater than one
Source: Bureau of Economic Analysis of the U.S. Department of Commerce. From 1995 to 2000, the value of motor industry production in the U.S. increased from $103.2 billion to $116.9 billion—an increase of 13 percent. For Appalachian states, the value of motor industry production
creased from $37.8 billiinto 2000 period, Appalachian states increased their share of total motor vehicleroduction in the U.S. p
Output Intensity Analysis Table A-22 pin Appalachia. Kentucky tops the list, followed by the dentified as states with prevalent industry cluster activi
vehicle industry in North Aproduction emanating from within 500 meters of its borders. More importantly, the output intensity index for each of these states (Kentucky, Ohio and Tennessee) indicates that the contribution of the motor vehicle industry to their respective economies exceeds the ational average. Also, the output intensity index for all Appn
—implying that the contribution of the industry to the region exceeds the national average. Table A-22. Motor Vehicle Industry Output Intensity Indices for Appalachian States
Two-Digit Industry State Industry / State GSP U.S. Industry Output Intensity Analysis for the Motor Vehicle and Related Products Industry Group
/ U.S. GSP Location Quotient(1986 - 2000) (1986 - 2000) %State / %U.S.
Alabama 1.04% 1.25% 0.84Georgia 1.04% 1.25% 0.83Kentucky 5.47% 1.25% 4.39Maryland 0.29% 1.25% 0.24Mississippi 0.56% 1.25% 0.45New York 0.48% 1.25% 0.39North Carolina 0.89% 1.25% 0.72Ohio 4.27% 1.25% 3.43Pennsylvania 0.47% 1.25% 0.38South Carolina 0.98% 1.25% 0.79Tennessee 2.48% 1.25% 1.99Virginia 0.80% 1.25% 0.64West Virginia 0.12% 1.25% 0.10Appalachia 1.46% 1.25% 1.17 Source: Bureau of Economic Analysis of the U.S. Department of Commerce.
Appalachian Regional Commission 134 Global Competitiveness of Selected Industries and Clusters in The Appalachian Region

Export Growth Trends Export data from the Department of Commerce indicates that motor vehicle exports have been on a downward trend. The United States’ international trade in road motor vehicles has produced a large and growing deficit, one that has more than doubled in the past ten years. According to experts at the International Trade Commission, the current overall imbalance in motor vehicle trade could be reduced as economic conditions change, but there is little reason to believe that the United States will see a surplus in its motor vehicle trade in the near term. The top five markets for U.S. motor vehicle exports: Canada, Mexico, Germany, Japan, and Belgium accounted for 85 percent of all outbound shipments in 1999. While motor vehicle manufacturers in Appalachia continue to expand their share of domestic production, weak export markets could limit their export growth potential. Growth and Export Prospects for Motor Vehicles and Related Products
ve strong potential that could be xploited for export promotion.
of such items are: wooden, upholstered, and metal furniture commonly
mmissioned study identified major concentrations of the household furniture industry in rn Tennessee, northeast
holstered furniture production hile the others take on a more diverse range of household furniture. The clusters are quite distinct and
among producers in different clusters.73 Exhibit A-2 depicts a breakdown of y manufacture by Appalachian state.
According to industry experts, the auto parts industry does appear to hae
Furniture, Fixtures and Related Products Industry Overview The furniture and fixtures industry group is defined by the two-digit SIC code 25. It includes establishments engaged in manufacturing office and store fixtures as well as household, office and estaurant furniture. Examplesr
used in dwellings, offices, public buildings and restaurants. An ARC-coAppalachia. Major clusters are located in western North Carolina, easte
ississippi and northern Alabama. The Mississippi cluster focuses on upMwthere is very little interaction
e furniture and fixtures industrth
73 Exports, Competitiveness, and Synergy in Appalachian Industry Clusters, February 1997. Prepared for the Appalachian Regional Commission by Regional Technology Strategies, Inc. Chapel Hill, North Carolina.
Appalachian Regional Commission 135 Global Competitiveness of Selected Industries and Clusters in The Appalachian Region

Exhibit A-2: Average Share of Appalachian Furniture and Fixtures Manufacture by State
Georgia 6% Kentucky
2%
New York 7%
North Carolina 30%
Ohio 10%
South Carolina 2%
Tennessee 10%
Virginia 8%
Pennsylvania 9%
Mississippi 10%
West Virginia 0% Alabama
5%Maryland
1%
Source: Bureau of Economic Analysis of the U.S. Department of Commerce.
able A-23 below presents production data for the furniture and fixtures industry. The value of U.S. rniture and fixtures manufacturers increased from $20.7 billion in 1995 to $24.4 billion in 2000—an 18
percent increase, while the value of Appalachian states manufacturers of furniture and fixtures increased from $8.9 billion in 1995 to $10 billion in 2000—a 12 percent increase. These figures indicate that during the period spanning from 1995 to 2000, the growth of furniture and fixtures manufacturers in Appalachian states did not exceed the national average. In fact, manufacturers in Appalachian states lost some of their share of national production. Table A-23. Furniture and Fixtures Manufacturing Industry Data
Tfu
1995 1996 1997 1998 1999 2000Appalachia States Prod. 8,956 8,783 9,149 9,531 9,952 10,008United States Prod. 20,746 20,713 22,143 22,923 23,888 24,428Appalachia GSP 2,477,567 2,559,208 2,665,176 2,802,466 2,913,662 3,036,268App Prod. / U.S. Prod. 43% 42% 41% 42% 42% 41%App Prod. / App GSP. 0.36% 0.34% 0.34% 0.34% 0.34% 0.33%
Manufacture of Furiture and Fixtures, GSP Data (Millions of dollars)
Source: Bureau of Economic Analysis of the U.S. Department of Commerce. Output Intensity Analysis Table A-24 provides the output intensity index for each state in Appalachia and all states combined. While the furniture and fixtures industry in Appalachian states account for 40 percent of total U.S. furniture production, the industry’s impact on the local economy is very small. In all Appalachian states, the industry share of state GSP was less than one-half percent. When compared to the national average, the contribution of the industry to each state in Appalachia did not exceed the national average. This implies that the industry’s impact on the Appalachian region is significantly below the national average.
Appalachian Regional Commission 136 Global Competitiveness of Selected Industries and Clusters in The Appalachian Region

Table A-24. Furniture and Fixtures Output Intensity Indices for Appalachian States
Two-Digit Industry State Industry / State GSP U.S. Industry / U.S. GSP Location Quotient(1986 - 2000) (1986 - 2000) %State / %U.S.
Alabama 0.48% 0.27%Georgia 0.22% 0.27% 0.81Kentucky 0.20% 0.27% 0.74Maryland
Output Intensity Analysis for the Furniture and Fixtures MFG Industry Group
1.76
0.08% 0.27% 0.3008
4
ee 0.63% 0.27% 2.32rginia 0.34% 0.27% 1.27
0.27ppalachia 1.26
Mississippi 1.62% 0.27% 6.0New York 0.10% 0.27% 0.3North Carolina 1.24% 0.27% 4.58Ohio 0.28% 0.27% 1.0Pennsylvania 0.23% 0.27% 0.86South Carolina 0.20% 0.27% 0.72TennessViWest Virginia 0.07% 0.27%
0.34% 0.27%A Source: Bureau of Economic Analysis of the U.S. Department of Commerce.
Appalachian Regional Commission 137 Global Competitiveness of Selected Industries and Clusters in The Appalachian Region

Export Growth Trends Table A-25 presents trends in furniture industry exports for Appalachian states and the U.S. Furniture exports from Appalachian states declined from $748.4 million in 1997 to $730 million in 2001 while U.S. exports increased during the same period. Over the course of the period, Appalachian states lost some share of national exports. West Virginia, Tennessee and Georgia were the greatest losers, with each experiencing double-digit losses in the value of furniture exports. Alabama, Kentucky and Ohio were the
ve not seriously exploited export markets. They have focused more on the
a, Kuwait and
ble A-25. Furniture, Fixtures and Related Products Exports from Appalachian States
greatest gainers. Many firms in Appalachia haU.S. market. The industry in Appalachia however has several export advantages. According to ARC, theses include: proximity to raw materials and other components, a burgeoning reputation overseas for quality work in furniture design and production, and a large number of firms with flexible production capabilities. The top five markets for furniture exports are Canada, Germany, Saudi ArabiJapan. Ta
States
$ Value 000, 1997
$ Value 000, 1998
$ Value 000, 1999
$ Value 000, 2000
$ Value 000, 2001
% change % Change 1997
to 2001Alabama 24,876 21,280 26,843 36,633 33,222 33.55Georgia 52,903 44,199 38,931 46,453 37,312 -29.47Kentucky 20,575 28,824 37,463 74,298 28,293 37.51Maryland 11,811 19,562 24,645 9,867 11,253 -4.72Mississippi 59,415 59,512 66,575 64,368 61,655 3.77New York 100,237 94,175 88,913 113,458 107,783 7.53North Carolina 174,705 164,886 166,689 158,807 160,698 -8.02Ohio 98,677 96,897 93,132 110,911 111,859 13.36Pennsylvania 79,012 66,831 62,236 90,666 84,600 7.07South Carolina 15,357 19,557 14,105 17,797 15,247 -0.72Tennessee 57,105 53,779 47,461 52,697 40,595 -28.91Virginia 50,957 43,451 48,790 52,485 36,689 -28West Virginia 2,800 6,287 3,629 1,764 779 -72.18Appalachia 748,430 719,240 719,412 830,204 729,985 -2.46U.S. 2,496,639 2,612,709 2,562,583 3,024,477 2,588,022 3.66
Furniture, Fixtures and Related Product Exports from Appalachia States
Source: International Trade and Economic Statistics (Export.Gov). Growth and Export Prospects for Furniture, Fixtures and Related Products The furniture industry has some unrealized growth potential that can be exploited for export development.
Textiles and Related Products Industry Overview The textiles and related products industry group is defined by the two-digit SIC code 22. It includes establishments engaged in the preparation of fiber and subsequent manufacturing of yarn, thread, braids, twine and cordage; manufacturing broadwoven fabrics, narrow woven fabrics, knit fabrics, and carpets
Appalachian Regional Commission 138 Global Competitiveness of Selected Industries and Clusters in The Appalachian Region

from yarn; dyeing and finishing fiber, yarn and fabrics; coating, waterproofing or treating fiber; the anufacture of knit apparel and other finished articles from yarn; and the manufacture of felt goods, lace
s in
ever declined in both the national and regional industry, with the share of Appalachian tates declining faster. Table A-26 presents production data for the Appalachian and national textile mills
mgoods, nonwoven fabrics, and miscellaneous textile. The textile mills industry is one of Appalachia’s traditional and most mature industries. Textile millAppalachian states account for 83 percent of national textile mills production. The value of textile mills production has howsindustry. Table A-26. Textile Mills Manufacturing Industry Data
1995 1996 1997 1998 1999 2000Appalachia States Prod. 21,424 21,006 20,638 20,062 19,362 19,755
Textile Mills and Related Products, GSP Data (Millions of dollars)
United States Prod. 25,968 25,335 24,953 24,130 23,598 24,126Appalachia GSP 2,477,567 2,559,208 2,665,176 2,802,466 2,913,662 3,036,268App Prod. / U.S. Prod. 83% 83% 83% 83% 82% 82%App Prod. / App GSP. 0.86% 0.82% 0.77% 0.72% 0.66% 0.65%
ic Analysis of the U.S. Department of Commerce.
.—implying that the contribution of the industry within Appalachian states is above the national for Appalachian states.
Textile Mills Output Intensity Indices for Appalachian States
Source: Bureau of Econom Output Intensity Analysis The output intensity index for all Appalachian states (1.07) exceeds the output intensity index for the ntire U.Se
average. Table A-27 provides textile mills output intensity index Table A-27.
Two-Digit Industry State Industry / State GSP U.S. Industry / U.S. GSP Location Quotient(1986 - 2000) (1986 - 2000) %State / %U.S.
Alabama 1.60% 0.33% 4.80Georgia 2.31% 0.33% 6.92Kentucky 0.36% 0.33% 1.07Maryland 0.05% 0.33% 0.14Mississippi 0.45% 0.33% 1.34New York 0.12% 0.33% 0.37North Carolina 3.57% 0.33% 10.69Ohio 0.06% 0.33% 0.19Pennsylvania 0.28% 0.33% 0.83South Carolina 3.84% 0.33% 11.51Tennessee 0.52% 0.33% 1.56Virginia 0.69% 0.33% 2.08West Virginia 0.10% 0.33% 0.29Appalachia 1.07% 0.33% 3.21
Output Intensity Analysis for the Textile Mill Products Industry Group
Source: Bureau of Economic Analysis of the U.S. Department of Commerce.
Appalachian Regional Commission 139 Global Competitiveness of Selected Industries and Clusters in The Appalachian Region

Export Growth Trends On average, Appalach
.S exports of textileian states account for 53 percent of U.S. textile mills’ exports. From 1997 to 2001,
mill products increased from $5.6 billion to $7.4 billion—an increase of 32 percent.
tition from cheap foreign imports with lower labor and with the phasing out
e more susceptible to foreign competition
igh value-added textile products that are less labor intensive. The future of the industry in Appalachia ufacturers to exploit higher value-added textile goods and offer niche
UIn the same period, Appalachian state exports increased from $3.2 billion in 1997 to $3.9 billion in 2001—an increase of 24 percent. Table A-28 presents trends in textile industry exports for Appalachian states and the U.S. Though the regional industry grew less than the national industry during 1997 to 2001 period, most Appalachian states recorded very strong growth figures during the period. The states of Alabama, Kentucky, Ohio and Pennsylvania experienced at least a 90 percent increase in textile mill product exports. The region has a whole appears to have benefited immensely from sales to foreign markets. The only Appalachian states to experience a decline in exports during the period are the states of New York and Virginia.
he textile mills industry however faces stiff compeTcosts. As less developed countries with lower labor costs expand their activitiesf import quota restrictions under WTO rules, the textile mills industry will becomo
espite this competition, U.S. textile mill industries have a competitive advantage in the production of D
hdepends on the ability of manroducts. p
Table A-28. Textile Mills’ Exports from Appalachian States
$ Value 000, 1997
$ Value 000, 1998
$ Value 000, 1999
$ Value 000, 2000
$ Value 000, 2001
%Change 1997 to
Textile Mill Product Exports from Appalachia States
States
2001.16
6
183 1,051,604 911,881 1.9
hio 130,863 103,821 112,660 283,564 252,450 92.91Pennsylvania 143,688 117,318 133,438 174,845 287,191 99.87South Carolina 331,725 313,899 312,971 420,333 495,792 49.46Tennessee 178,925 193,078 173,016 212,459 230,840 29.01Virginia 101,906 99,349 110,043 93,335 70,802 -30.52West Virginia 6,648 5,459 7,256 7,934 9,954 49.73Appalachia 3,065,690 2,985,937 2,898,697 3,674,459 3,799,011 23.92U.S. 5,587,281 5,672,308 6,055,009 7,284,162 7,365,202 31.82
Alabama 99,550 115,100 126,377 209,572 235,095 136Georgia 231,857 230,325 240,876 322,394 328,370 41.63Kentucky 53,154 67,546 72,474 206,141 304,285 472.46Maryland 98,077 107,557 110,972 110,612 117,359 19.6Mississippi 78,433 72,365 60,493 83,118 85,385 8.86New York 715,974 612,155 510,538 498,548 469,607 -34.4North Carolina 894,890 947,965 927,5O
Source: International Trade and Economic Statistics (Export.Gov). Growth and Export Prospects for Textile Mills and Related Products The industry offers some potential for continued export growth through continuous product innovation.
Appalachian Regional Commission 140 Global Competitiveness of Selected Industries and Clusters in The Appalachian Region

Apparel and Related Products Industry Overview The apparel and related products industry group is defined by the two-digit SIC code 23. It includes establishments producing clothing by cutting and sewing purchased woven or knit textile fabrics, leather, rubberized fabrics, plastics and furs. During the six-year period from 1995 to 2000, both the regional and national apparel and related products industry experienced a significant decline in production. In the U.S., the value of apparel and related products production declined from $28.0 billion in 1995 to $22.5 billion in 2000—a decrease of 20 percent. In Appalachian states, the value of apparel and related products production declined from $14.3 billion in 1995 to $9.9 billion in 2000—a decrease of 31percent. The decline has been attributed mainly to increased competition from foreign producers. Table A-29 presents production data for the Appalachian and national apparel and related products industry. Table A-29. Apparel and Related Products Manufacturing Industry Data
1995 1996 1997 1998 1999 2000Appalachia States Prod. 14,309 13,248 12,838 11,855United States Prod. 28,019 26,958 26,461 25,233
10,178 9,88222,573 22,451
Appalachia GSP 2,477,567 2,559,208 2,665,176 2,802,466 2,913,662 3,036,26849% 47% 45% 44%
0.42% 0.35% 0.33%
s)Apparel and Related Products, GSP Data (Millions of dollar
App Prod. / U.S. Prod. 51% 49%App Prod. / App GSP. 0.58% 0.52% 0.48% ource: Bureau of Economic Analysis of the U.S. Department of Commerce.
The importance of the apparel industry varies for respective Appalachian states. Alabama and Mississippi are the only states with an output intensity index greater than one—implying that the contribution of the apparel and textile industry to their local economies exceeds the national average. North Carolina, South Carolina and Tennessee also have output intensity indices that are almost equal to the national average. As a whole, the contribution of the industry to the GSP of Appalachian states exceeded the national average. Table A-30 provides apparel and related products output intensity index for Appalachian states. Export Growth Trends Apparel exports from most Appalachian states declined significantly during the 1997 to 2001 period. Most states experienced double-digit negative growth in exports. The industry’s woes can be attributed to intense competition from foreign producers with access to relatively cheaper labor. The major gainers were Alabama, Ohio, Virginia, Pennsylvania and North Carolina. Alabama and Ohio recorded a 100 percent increase in the value of their apparel exports. Table A-31 presents trends in apparel and related products industry exports for Appalachian states and the U.S.
S Output Intensity Analysis
Appalachian Regional Commission 141 Global Competitiveness of Selected Industries and Clusters in The Appalachian Region

Table A-30. Apparel and Related Products Output Intensity Indices for Appalachian States
Two-Digit Industry State Industry / State GSP U.S. Industry / U.S. GSP Location Quotient(1986 - 2000) (1986 - 2000) %State / %U.S.
3.111.73
3.561.72
th Carolina 0.90% 0.37% 2.400.41
26
0.66% 0.37% 1.77
Output Intensity Analysis for the Apparel and Related Products Industry Group
Alabama 1.16% 0.37%Georgia 0.64% 0.37%Kentucky 0.79% 0.37% 2.11Maryland 0.14% 0.37% 0.39Mississippi 1.33% 0.37%New York 0.64% 0.37%NorOhio 0.15% 0.37%Pennsylvania 0.47% 0.37% 1.26South Carolina 0.94% 0.37% 2.5Tennessee 0.99% 0.37% 2.6Virginia 0.27% 0.37% 0.73West Virginia 0.14% 0.37% 0.37Appalachia
Analysis of the U.S. Department of Commerce. Source: Bureau of Economic Table A-31. Apparel and Related Products Exports from Appalachian States
States
$ Value 000, 1997
$ Value 000, 1998
$ Value 000, 1999
$ Value 000, 2000
$ Value 000, 2001
% Change 1997 to 2001
Alabama 160,202 210,179 262,568 409,791 311,456 94.41Georgia 412,819 492,524 303,786 285,063 193,628 -53.1Kentucky 389,328 662,240 587,972 588,943 319,175 -18.02Maryland 20,468 17,114 11,050 7,424 7,021 -65.7Mississippi 106,243 107,923 103,702 149,292 85,731 -19.31New York 628,397 614,556 589,372 595,716 533,201 -15.15North Carolina 1,466,590 1,355,406 1,518,108 1,727,157 1,680,939 14.62Ohio 48,128 58,660 66,841 87,485 93,943 95.19Pennsylvania 147,791 140,717 144,157 191,329 191,603 29.64South Carolina 186,513 310,820 299,976 229,262 103,079 -44.73Tennessee 194,842 231,595 170,231 199,196 159,967 -17.9Virginia 115,746 128,044 87,625 61,594 163,297 41.08West Virginia 4,330 1,803 1,301 917 653 -84.92
Apparel and Related Products Exports from Appalachia States
Appalachia 3,881,397 4,331,581 4,146,689 4,533,169 3,843,693 -0.978,551,110 8,707,823 8,193,870 8,557,864 6,956,292 -18.65U.S.
Source: International Trade and Economic Statistics (Export.Gov).
rowth and Export Prospects for Apparel and Related Products G The industry does not offer much potential for continued export through export promotion.
Appalachian Regional Commission 142 Global Competitiveness of Selected Industries and Clusters in The Appalachian Region

Environmental Technologies Industry Overview The environmental technologies industry includes establishments engaged in the manufacturing of industrial air pollution control equipment, water and waste water systems, solid waste recycling, and
It is a relatively new industry whose activities are quite diverse any SIC classifications. As pointed out in the ARC-commissioned study, it is quite
ifficult to estimate market size and employment information using the SIC classification.
was s
and services
k had the highest number of bs and were the highest-ranking export states for environmental technologies. Table A-32 presents
e U.S.
Table A-32. Environmental Technology Employment and Exports from Appalachian States
hazardous and toxic waste technologies. and encompass md However, the Environmental Technologies Industries (ETI) office within the U.S. Department of Commerce provides some information on estimated industry trends. According to ITA, in 1999, therecontinued growth in the production and sales of U.S. environmental goods and services. Total revenuefor the industry increased by five percent to $196.5 billion; the number of jobs in the industry increasedby 44,815 to 1,389,638, while the U.S. industry exported almost 11 percent of the total goodsthat it produced in 1999. Export Growth Trends Based on the data obtained from ITA for 1999, Pennsylvania and New Yorjoemployment and exports from Appalachian states and th
States Jobs Companies Exports National Export RankAlabama 21,047 1,734 264 23Kentucky 17,500 1,712 176 30Mississippi 9,992 1,090 65 42New York 91,262 6,518 1,136 5North Carolina 33,790 2,611 346 17
hio 60,745 5,022 957 8
Environmental Technologies Industry (1999)
OPennsylvania 72,667 6,125 1,538 2South Carolina 20,007 1,616 146 32Tennessee 25,261 2,021 205 27Virginia 30,172 2,602 504 14West Virginia 11,255 1,215 58 44Total U.S. 1,389,638 115,030 21,310 Source: International Trade Administration. As concern with curbing environmental pollution grows, environmental technologies, goods, and services will constitute an important and growing sector within the global economy. According to ITA, it is projected that the global market will grow to $545 billion by the year 2004. Within Appalachia, an ARC-commissioned study identified a major environmental technologies cluster in east Tennessee (Oak Ridge, Knoxville and Chattanooga). Establishments in this cluster have access to a highly skilled labor force and excellent support services from federal research labs and agencies and state universities. This feature increases their capacity to access and exploit export opportunities. Currently, establishments located within this cluster are not major exporters because they view government as their primary contractor. As global markets for environmental technologies expand, industry clusters within
Appalachian Regional Commission 143 Global Competitiveness of Selected Industries and Clusters in The Appalachian Region

Appalachia have an excellent opportunity to position themselves at the forefront. Germany, Mexico, orea, Brazil, China and India are expected to be prime future export markets.74
Growth and Export Prospects for Environmental Technologies The environmental technologies industry will be a good candidate for export promotion in Appalachia.
roduction in the Appalachian Region was 428.9 million short tons in 2001 and this represents 38 percent of total U.S. coal production. Within Appalachia, the Central region (composed of counties in eastern Kentucky, Virginia, and southern West Virginia) is the leading producer of coal. On average, the Central region
n contains some of the ost coal-dependent counties in Appalachia. The Northern region (made up of counties in
rn We Virginia) accounts for 33 percent of total Appalachian oal production while the Southern region (composed of counties in Tennessee and Alabama) accounts
K
Coal Mining The Appalachian region is one of the three major coal-producing regions in the U.S. Coal p
accounts for 61 percent of total Appalachian coal production. The Central regio75m
Pennsylvania, Ohio, Maryland, and northe stcfor an annual average of six percent of total Appalachian coal production. Table A-33 presents the distribution of coal production amongst the major regions in Appalachian. Table A-33. Appalachian Region - Coal Production Year
Northern Central Southern Total App Total U.S. % of Total U.S.1996 32% 61% 6% 451,869 1,063,856 42%1997 33% 62% 6% 467,778 1,089,932 431998 34% 60%
Percentages and Quantity (1,000 Short Tons)
%6% 460,399 1,117,535 41%
425,573 1,100,431 39%419,419 1,073,612 39%
2001 34% 61% 5% 428,900 1,121,300 38%
Northern Appalachia: Counties in Pennsylvania, Ohio, Maryland, and northern West VirginiaCentral Appalachia: Counties in Eastern Kentucky, Virginia, and Southern West VirginiaSouthern Appalachia: Counties in Tennessee and Alabama.
Source: Energy Information Administration - Coal Industry Annual 2000 Data Tables
1999 33% 61% 5%2000 33% 62% 5%
Appalachian mines produce primarily bituminous coal (soft coal) from both surface and underground mines. Approximately 65 percent of the region’s coal comes from underground mines while the remaining 35 percent comes from surface mines. The Northern Appalachian region produces significant amounts of high sulfur bituminous coal and some lignite coal. The Central Appalachian region is rich in medium sulfur bituminous coal and significant quantities of low sulphur bituminous coal. The Southern
oduces significant quantities of low sulphur bituminous coal. ables A-34 and A-35 present production data on the types of coal produced in Appalachia.
region has the least coal deposits but it prT
74 Exports, Competitiveness, and Synergy in Appalachian Industry Clusters, February 1997. Prepared for the
ppalachian Regional Commission by Regional Technology Strategies, Inc. Chapel Hill, North Carolina. Berger et (2001). A Study on the Current Economic Impacts of the Appalachian Coal Industry and its Future in
the Region. A Report commissioned by the Appalachian Regional Commission, March 2001.
A75
Appalachian Regional Commission 144 Global Competitiveness of Selected Industries and Clusters in The Appalachian Region

Table A-34. Appalachian Region - Coal Production by Rank, 2000 Sub-Region Quantity (1,000 Short Tons)
Bituminous Subbituminous Lignite AnthraciteNorthern 134,462 0 0 4572Central 258,391 0 0 0Southern 21,993 0 0 0Total 414,846 0 0 4,572
0 Short Tons)
Source: Energy Information Administration - Coal Industry Annual 2000 Data Tables. Table A-35. Coal Production and Number of Mines by Region and Mine Type, 2000
(1,00
Number of Mines Produand Region ction Number of
Mines Production Number of Mines Production
rthern Region 29% 76% 71% 24% 451 13903535% 42% 767 258391
uthern Region 32% 79% 68% 21% 62 21993419
3,612
al-Producing State TotalUnderground SurfaceCo
NoCentral Region 65% 58%SoAppalachian Total 51% 65% 49% 35% 1,280 419,
S. Total 707 373,659 746 699,953 1,453 1,07U. rce: Energy Information Administration, Coal Industry Annual 2000 Data Tables.
xports
. This
t Virginia experienced the greatest decline in coal exports (16.8 and 13.8 a
Sou
rends in Appalachian Coal ET Coal exports from the major Appalachian states declined by 37 percent from 1996 to 2000. During this period, all the major coal exporting states within Appalachia experienced a decline in coal exportswas due to a number of factors including the availability of cheaper priced coal from competitors such as South Africa and Australia, higher production costs due to industry compliance with new environmental laws and regulations, and the expansion of new steel-making technologies requiring less high-grade coking coal. Kentucky and Wespercent respectively). Virginia also experienced an 8.5 percent decline while coal exports from Alabamand Pennsylvania declined by 0.3 and 4.1 percent respectively. Table A-36 presents the distribution of Appalachian coal by major exporting states. Table A-36. Major Appalachian Coal Exporting States
Average Annual Percent Change
199
Alabama 4,864 5,813 4,801 3,307 4,807ky 9,143 7,220 6,931 4,636 4,382
1999-2000Destination
6-2000
45.3 -0.3-5.5 -16.8
.1
.5
1999 2000Percent Change Coal-Exporting State and 1996 1997 1998
KentucPennsylvania 9,246 8,698 7,908 6,966 7,823 12.3 -4Virginia 13,432 12,841 12,810 8,770 9,406 7.3 -8West Virginia 42,044 38,459 37,531 22,848 23,212 1.6 -13.8Total 78,729 73,031 69,981 46,527 49,630 6.7 -37.0 Source: International Trade Administration.
Appalachian Regional Commission 145 Global Competitiveness of Selected Industries and Clusters in The Appalachian Region

While Europe has remained the major market for Appalachian coal, coal exports to Europe declined greatly during the mid to late 1990s (See Exhibit A-3 below). In 1997, steam coal shipments to Europe ecreased by six million tons due to increased competition from lower-cost producers and the substitution
of natural gas for coal in the European utility sector. However, coal exports to Canada increased by four erica declined.
e
ents to Europe decreased
an
and Argentin
d
million tons while exports to Africa, Asia and South Am From 1997 to 1998, coal shipments to Europe continued to fall as the Asian financial crisis stimulated thavailability of cheap imports from Australia. During this period, bituminous coal exports to Canada continued to increase while exports to coal markets in Africa, Asia and South America continued to fall.
1999, U.S. coal exports to Europe fell to a record low level. U.S. Coal shipmInas lower-cost Australian and South African production continued to displace U.S. coal. South African andAustralian production also displaced U.S. coal in other foreign markets such as the Japanese, Brazilian, and Korean markets. From 1999 to 2000, coal exports increased as worldwide steel production began to rebound. There wasincrease in bituminous coal shipments to Spain, Germany, Turkey, Egypt, Bulgaria, Romania, Mexico
a. Exhibit A-3-Trends in Foreign Markets for Appalachian Coal
0
5,000
45,000
50,000
10,000
15,000
20,000
Qty
(1,0
0
25,000
30,000
35,000
40,000
1996 1997 1998 1999 2000
Year
Sho
rt T
ons)
North AmericaSouth AmericaEuropeAsiaAfrica
Source: International Trade Administration. Growth and Export Prospects for Coal Mining The coal mining industry appears to be a good candidate for future export promotion in Appalachia.
Appalachian Regional Commission 146 Global Competitiveness of Selected Industries and Clusters in The Appalachian Region

Electronic Components
p high quality, sophisticated electronic components d related accessories. Under the electronic components major industry group, the focus for the ppalachian region will be on the microelectronics industry. The products covered under the icroelectronics industry include the following: semiconductor manufacturing equipment, printed circuit
oards, electronic tubes, semiconductors, capacitors, resistors, coils, transformers, inductors, connectors, d printed circuit assemblies.
he total value of U.S. shipments of microelectronics products increased by 21 percent from 1997 to 000. The number of people employed nationally in the microelectronics industry also increased from 87,313 in 1997 to 620,927 in 2000—an increase of six percent. The upward swing in national industry ipments and employment was also reflected in the Appalachian region. The value of microelectronic
roducts shipments from Appalachian states increased by 12 percent from 1997 to 2000. Microelectronics dustry employment in Appalachian states also increased from 122,513 people in 1997 to 133,438
eople in 2000—an increase of nine percent.
n the international trade front, the performance of Appalachian states exceeded that of the U.S. While .S. exports of electronic equipment increased by 8.75 percent from 1997 to 2001, exports from
Appalachian states increased by 23 percent from 1997 to 2001. The contribution of Appalachian states to .S. electronics exports increased from 27 percent in 1997 to 30 percent in 2001.
New York, Ohio and Pennsylvania are the largest exporters of electronic equipments from Appalachia. , the electronic components industry is concentrated in nine counties that comprise the
uthern tier of New York and some counties in Pennsylvania. Combined, they account for 48 percent of electronics exports from Appalachian states and 13 percent of U.S. electronics exports. The industry
uster in the counties are backed by a strong research and development base which include a number of deral and state funded research and development facilities. These include Cornell University, Alfred niversity, and the State University of New York at Binghamton.
edical Devices and Surgical Instruments The medical instruments and supplies industry is defined by the three-digit SIC code 384. It consists of
tablishments primarily engaged in manufacturing medical, surgical, ophthalmic, and veterinary struments and apparatus. According to the ARC-commissioned study, the medical devices industry is ncentrated in seven counties around the Pittsburgh area.
he Medical devices and surgical instruments sector is one of the nation’s strongest and fastest growing ctors. Available data from the ITA shows that the value of U.S. shipments of medical devices increased om $51.7 billion in 1997 to $57.3 billion in 1999—an increase of 11 percent. U.S. exports of medical
devices and other related products increased from $10.3 billion in 1995 to $15.4 billion in 2percent increase. On average, exports accounted for 21 perU.S. controls 59 percent of the world market. The ARC region is however not particularly strong in the manufacturing of medical devices and related instruments. The output intensity index for Appalachian states (0.58) indicates that the contribution of the industry to the economy of Appalachian states is significantly below the national average. According to an ARC-commissioned study, the region has below-average concentration of firms and employees
The U.S. is highly com etitive in the manufacture ofanAmban T25shpinp OU
U
Specificallyso
clfeU
M
esinco Tsefr
000—a 50 cent of total domestic production while the
Appalachian Regional Commission 147 Global Competitiveness of Selected Industries and Clusters in The Appalachian Region

cocl
mpared to the U.S. 76 In fact, the industry did not meet the requirements generally associated with a uster because of its low firm concentration and lack of interdependence amongst firms.
In Appalachia, the industry is dominated by small an medium sized firms that manufacture surgical supplies and instruments targeted towards specific domestic customers. Such products are quite specialized and unsuitable for export. The few large companies that are exporting actively in the area tend to focus on the production of high quality, technologically intensive products with special export market niches. As such, most firms in the region that want to export are already doing so. Even if ARC were to concentrate on promoting exports within the region, the cluster is currently too small with little collaboration amongst existing firms. Most promising markets for medical devices and related instruments are in Latin America, Japan, and the rest of Asia. Pittsburgh is home to two large research universities and an excellent medical facility. These resources play a crucial role in the development of medical devices and related products within the Pittsburg cluster. The industry does have some potential for growth and development within Appalachia, however this potential is however hinged on the ability to boost and diversify the supply base of the cluster.
d
76 Exports, Competitiveness, and Synergy in Appalachian Industry Clusters, February 1997. Prepared for the Appalachian Regional Commission by Regional Technology Strategies, Inc. Chapel Hill, North Carolina.
Appalachian Regional Commission 148 Global Competitiveness of Selected Industries and Clusters in The Appalachian Region

APPENDIX B: TRADE FLOW MAPS
Prepared by Economic Development Research Group
Appalachian Regional Commission 149 Global Competitiveness of Selected Industries and Clusters in The Appalachian Region

Product: Auto Parts Origin: Alabama Flow: Exports (1998)
Florida
New YorMichigan k
Appalachian Regional Commission 150 Global Competitiveness of Selected Industries and Clusters in The Appalachian Region

Product: Upholstered Furniture
Origin: Alabama
Flow: Exports (1998)
Florida
New York Michigan
Appalachian Regional Commission 151 Global Competitiveness of Selected Industries and Clusters in The Appalachian Region

Product: Auto Parts
Origin: Georgia
Flow: Exports (1998)
Florida
New YorkMichigan
Appalachian Regional Commission 152 Global Competitiveness of Selected Industries and Clusters in The Appalachian Region
Fl
Product: Electronic Components
Origin: Georgia
ow: Exports (1998)
Florida
New YorkMichigan
Appalachian Regional Commission 153 Global Competitiveness of Selected Industries and Clusters in The Appalachian Region
Product: Food Processing
Origin: Georgia
Flow: Exports (1998)
Florida
New YorkMichigan
Maryland
South Carolina
Texas
Appalachian Regional Commission 154 Global Competitiveness of Selected Industries and Clusters in The Appalachian Region

Product: Packaging Machinery
Origin: Georgia
Flows: Exports (1998)
Florida
New York
South Carolina
Texas
Michig
Appalachian Regional Commission 155 Global Competitiveness of Selected Industries and Clusters in The Appalachian Region
Product: Auto Parts
Origin: Maryland
Flow: Exports (1998)
Florida
New York Michigan
Appalachian Regional Commission 156 Global Competitiveness of Selected Industries and Clusters in The Appalachian Region

Product: Electronic Components
Origin: Mississippi
Flow: Exports (1998)
Florida
New York Michigan
Appalachian Regional Commission 157 Global Competitiveness of Selected Industries and Clusters in The Appalachian Region

Product: Wood Furniture
Origin: New York
Flow: Exports (1998)
Florida
Michigan
Appalachian Regional Commission 158 Global Competitiveness of Selected Industries and Clusters in The Appalachian Region

Product: Upholstered Furniture
Origin: North Carolina
Flow: Exports (1998)
Michigan
Florida
New York
Appalachian Regional Commission 159 Global Competitiveness of Selected Industries and Clusters in The Appalachian Region

Product: Wood Furniture
Origin: North Carolina
Flow: Export (1998)
Michigan
Florida
New York
Appalachian Regional Commission 160 Global Competitiveness of Selected Industries and Clusters in The Appalachian Region

Product: Auto Parts
Origin: Ohio
Flow: Exports (1998)
Florida
New York
Michigan
Appalachian Regional Commission 161 Global Competitiveness of Selected Industries and Clusters in The Appalachian Region

Product: Food Processing Machinery
Origin: Ohio
Flow: Exports (1998)
Florida
New York
Michigan
North Carolina
Maryland
Texas
Appalachian Regional Commission 162 Global Competitiveness of Selected Industries and Clusters in The Appalachian Region
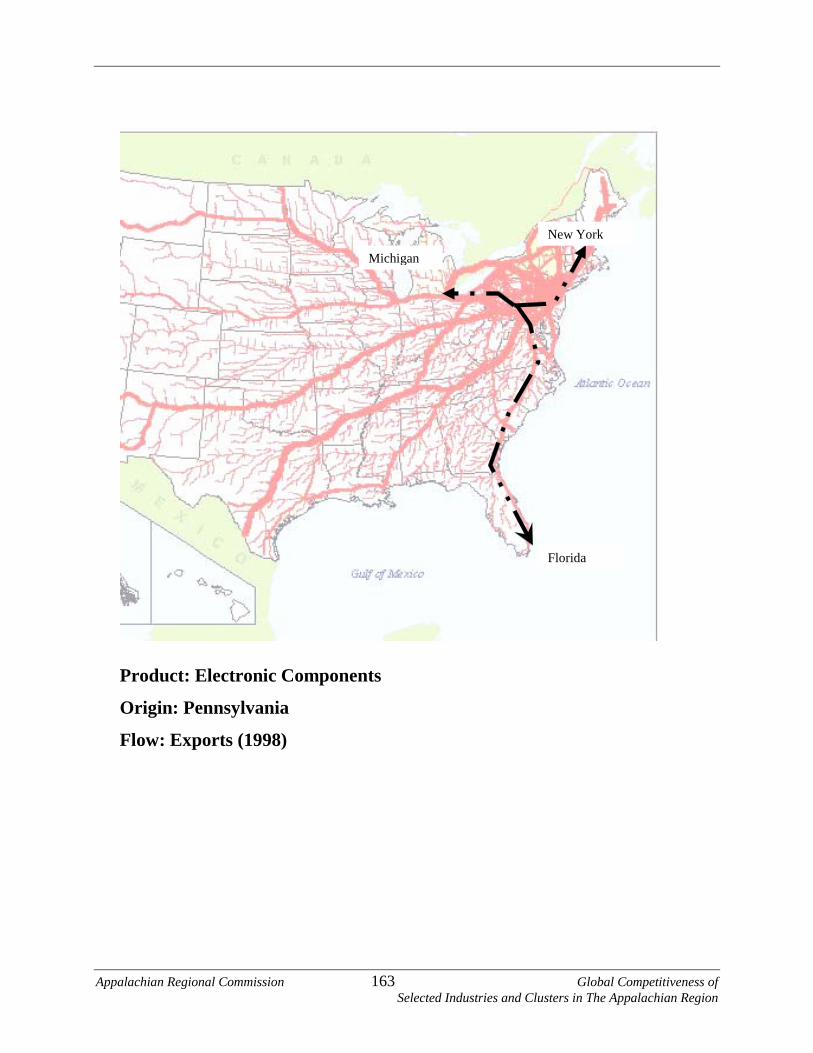
Product: Electronic Components
Origin: Pennsylvania
Flow: Exports (1998)
New York
Florida
Michigan
Appalachian Regional Commission 163 Global Competitiveness of Selected Industries and Clusters in The Appalachian Region

Product: Food Processing
Origin: Pennsylvania
Flow: Exports (1998)
New York
Florida
South Carolina
Maryland
Michigan
Texas
Appalachian Regional Commission 164 Global Competitiveness of Selected Industries and Clusters in The Appalachian Region

Product: Upholstered Furniture
Origin: Pennsylvania
Flow: Exports (1998)
New York
Florida
Michigan
Appalachian Regional Commission 165 Global Competitiveness of Selected Industries and Clusters in The Appalachian Region

Product: Food Processing Machinery
Origin: South Carolina
Flow: Exports (1998)
Florida
New York
Texas
South Carolina
Michigan
Maryland
Appalachian Regional Commission 166 Global Competitiveness of Selected Industries and Clusters in The Appalachian Region

Product: Packaging Machinery;
Origin: South Carolina
Flow: Exports (1998)
Florida
New York
Texas
South Carolina
Appalachian Regional Commission 167 Global Competitiveness of Selected Industries and Clusters in The Appalachian Region

Product: Auto Parts
Origin: Tennessee
Flows: Exports (1998)
Florida
New York Michigan
Appalachian Regional Commission 168 Global Competitiveness of Selected Industries and Clusters in The Appalachian Region

Product: Upholstered Furniture;
Origin: Tennessee
Flow: Export (1998)
Florida
New York Michigan
Appalachian Regional Commission 169 Global Competitiveness of Selected Industries and Clusters in The Appalachian Region

Product: Auto Parts
Origin: West Virginia
Flow: Exports (1998)
Florida
Michigan
New York
Appalachian Regional Commission 170 Global Competitiveness of Selected Industries and Clusters in The Appalachian Region

Product: Electronic Component
Origin: West Virginia
Flow Export (1998)
Florida
Michigan
New York
Appalachian Regional Commission 171 Global Competitiveness of Selected Industries and Clusters in The Appalachian Region

Food Processing Machinery
State of Origin from ARC Regional Area to Port of Destination
FLORIDA
TEXAS
TEXAS
Appalachian Regional Commission 172 Global Competitiveness of Selected Industries and Clusters in The Appalachian Region

FLORIDA
Packaging MachineryState of Origin from ARC Regional Area to Port of Destination
TEXAS
Appalachian Regional Commission 173 Global Competitiveness of Selected Industries and Clusters in The Appalachian Region

Appalachian Regional Commission 174 Global Competitiveness of Selected Industries and Clusters in The Appalachian Region
FLORIDA
State of Origin from ARC Regional Area to Port of Destination
Wood Furniture

Appalachian Regional Commission 175 Global Competitiveness of Selected Industries and Clusters in The Appalachian Region
FLORIDA
Auto Parts
State of Origin from ARC Regional Area to Port of Destination

Appalachian Regional Commission 176 Global Competitiveness of Selected Industries and Clusters in The Appalachian Region
Upholstered Furniture State of Origin from ARC Regional Area to Port of Destination
FLORIDA