analysis of impact attenuator of the student formula
TRANSCRIPT

Kaunas University of Technology
Faculty of Mechanical Engineering and Design
Analysis of impact Attenuator of the student formula
Master’s Final Degree Project
Praveen Malik
Project author
Assoc.Prof.Dr.Paulius Griskevicius
Supervisor
Kaunas,2019

Kaunas University of Technology
Faculty of Mechanical Engineering and Design
Analysis of impact Attenuator of the student formula
Master’s Final Degree Project
Vehicle Engineering 6211EX021
Praveen Malik
Project author
Assoc.Prof.Dr.Paulius Griskevicius
Supervisor
Assoc.Prof.Dr.Valdas Eidukynas
Reviewer
Kaunas,2019

Kaunas University of Technology
DEPARTMENT OF TRANSPORT ENGINEERING
Praveen Malik
Analysis of Impact Attenuator of the Student Formula
Declaration of Academic Integrity
I confirm that the final project of mine, Praveen Malik, on the topic “ Analysis of impact Attenuator
of the student formula” is written completely by myself; all the provided data and research results are
correct and have been obtained honestly. None of the parts of this thesis have been plagiarised from
any printed, Internet-based or otherwise recorded sources. All direct and indirect quotations from
external resources are indicated in the list of references. No monetary funds (unless required by Law)
have been paid to anyone for any contribution to this project.
I fully and completely understand that any discovery of any manifestations/case/facts of dishonesty
inevitably results in me incurring a penalty according to the procedure(s) effective at Kaunas
University of Technology.
(name and surname filled in by hand) (signature)
Kaunas University of Technology
Faculty of Mechanical Engineering and Design
Study Programme – Vehicle Engineering 6211EX021
Task Assignment for Final Degree Project of Master Studies
Student: Praveen Malik
1. Title of the Final Project:
Analysis of Impact Attenuator of the Student Formula
Studentiškos formulės smūgio slopintuvo tyrimai
2. Aim of the Final Project:
To Design and analyse Impact Attenuator For Student Formula.
3. Tasks of the Final Project:
To perform compression test on Honeycomb and Foam Structure and to Measure Energy
absorbed by the Honeycomb and Foam structure using LS-DYNA pre-post.
To perform high Impact penetration Test on Sandwich of Honeycomb with glass-fibre.
To Compare FEM results with Experimental results.
To perform Explicit Analysis of the Rollcage.
To perform full-scalled Impact attenuator analysis in ANSYS.
4. Structure of the Text Part:
5. Consultants of the Final Project:
Author of the Final Project Praveen Malik
(Name, Surname, Signature, date)
Supervisor of the Final Project Paulius Griskevicius
(Name, Surname, Signature, date)
Head of Study Programme Janina Jablonskytė
(Name, Surname, Signature, date)

5
Praveen Malik. Analysis of impact Attenuator of the student formula
Master's Final Degree Project/Supervisor- Assoc.Prof.Dr. Paulius Griskevicius
Faculty of Mechanical Engineering and Design, Kaunas University of Technology.
Study field and area: Transport Engineering (E12), Engineering Science
Keywords: impact attenuator, energy absorption, stress, cellular solids.
Kaunas,2019,60
Summary
The full scaled model of the impact attenuator would be expansive, so a scaled model of the impact
attenuator was used to perform the experiments. The honeycomb and foam materials were tested
using a UTM machine in out of plane behaviour i.e. in compression. In the compression test of foam
and honeycomb materials of same dimensions it was found that honeycomb absorbed more energy
than foam. In the next step the honeycomb sandwich with glass fibre was tested on the high impact
penetration machine and energy absorbed by it was observed. The roll cage of a student formula car
was also test under front impact loading to understand the extend till which energy absorption should
be done to safe guard the occupants without effectively increasing the weight of the vehicle by using
more thickness of tubes for roll cage, using more stronger material or by adding more bracing
members to the roll cage. The results obtained from experimental data were used as an input to model
the material in the FEM package of the ANSYS. Using ANSYS the full scaled model of the impact
attenuator was also analysed.

6
Praveen Malik .Studentiškos formulės smūgio slopintuvo tyrimai
Magistro baigiamojo laipsnio projektas / vadovas – doc. Paulius Griskevičius
Studijų kryptis ir sritis (studijų krypties grupė): Transporto inžinerija (E12), inžinerijos mokslai
Reikšminiai žodžiai: smugio energijos slopintuvas, energijos sugerimas, itempiai, koretos strukturos.
Kaunas, 2019, 60 p.
Santrauka
Tyrimo tikslas - sukurti smūgio slopintuvą studento formulės automobiliui, kuris gali sugerti
susidūrimo energiją, transporto priemonei patekus į avariją. Skirtingų tipų medžiagos, buvo
vertinamos energijos sugėrimui pagerinti. Nagrinėjamu atveju tinkamiausios medžiagos gautos putos
ir reguliarios šešiakampės korio formos struktūra. Taip pat buvo atsižvelgta į įvairias sustiprinto korio
rūšis. Pilną smūgio slopintuvo modelį tirti būtu brangu, todėl eksperimentams atlikti buvo panaudotas
smūgio slopintuvo sumažinto mastelio modelis. Korinė struktūra ir putplastis buvo išbandytos
universalia tempimo bandymų mašina atliekant gniuždymo bandymus. Gniuždant tokių pačių
matmenų putplasčio ir korinės struktūros bandinius nustatyta, kad korinės struktūros bandiniai
absorbuoja daugiau energijos nei putplasčio. Eksperimentiniai rezultatai, buvo panaudoti skaitinių
modelių ANSYS programoje medžiagos modelių charakterizavimui. Kitame etape smūginėmis
apkrovomis išbandyti sluoksniuoti bandiniai su stiklo pluotšto laminatu ir korėta šerdimi tiriant
sugertos energijos kiekius. Studentų formulės automobilio rėmas buvo išbandytas skaitinio
modeliavimo metodais veikiant priekinio smūgio apkrovomis, siekiant suprasti energijos sugėrimo
mąstą bei nepadidinant transporto priemonės svorio pagerinti saugumą, tam panaudojant didesnį
vamzdelių storį, stipresnę medžiagą arba keičiant tvirtinamųjų elementų vietą. Naudojant ANSYS
taip pat buvo išnagrinėtas pilnas smūgio slopintuvo modelis.

7
Table of Content
List of Figures .................................................................................................................................... 8
List of Tables .................................................................................................................................... 10
Introduction ..................................................................................................................................... 11
1. Review of Literature .................................................................................................................. 12
1.1. What is a cellular solid? ........................................................................................................... 12
1.2. Properties of cellular solids ...................................................................................................... 13
1.3. Honeycomb Structure ............................................................................................................... 14
1.3.1. In-Plane behavior- ................................................................................................................. 15
1.3.2. Out-of plane behavior ............................................................................................................ 15
1.4. Typical reinforced honeycomb structure .................................................................................. 16
1.5. Manufacturing of Cellular Solids ............................................................................................. 16
1.6. Passenger Cabin Safety ............................................................................................................ 18
1.6.1. Vehicle collision with the wall .............................................................................................. 18
1.6.2. Partner Protection .................................................................................................................. 18
1.7. Work done by some researcher‘s on experimental testing of impact attenuator ...................... 19
1.8. Work done by other researcher‘s on FEM testing of impact attenuator ................................... 21
2. The Design Consideration ......................................................................................................... 25
2.1. Design Selection ....................................................................................................................... 25
2.1.1. Airbag Design ........................................................................................................................ 26
2.1.2. Crimped Metal Lattice Design .............................................................................................. 26
2.1.3. High Impact Foam Design..................................................................................................... 26
2.1.4. Honeycomb Design ............................................................................................................... 26
2.2. Advantages of Using Honeycomb Composites ........................................................................ 26
2.3. Calculations .............................................................................................................................. 27
2.4. Choosing the Right Simulation Type ....................................................................................... 28
3. Testing Procedure ...................................................................................................................... 30
3.1. Compression Testing For Foam. .............................................................................................. 30
3.2. Compression Testing For Honeycomb. .................................................................................... 33
3.3. High Impact Testing ................................................................................................................. 38
4. Explicit Analysis of the Roll cage ............................................................................................. 45
5. Design and Analysis of the Impact attenuator ........................................................................ 49
5.1. Finite Element Analysis of Scaled Model Honeycomb Sandwich ........................................... 49
5.2. Finite Element Analysis of Full Scaled Model ......................................................................... 53
6. Application of the Impact Attenuator ....................................................................................... 56
Conclusion ........................................................................................................................................ 58
List of references .............................................................................................................................. 59

8
List of Figures
Fig.1 1. Types of cellular solids ........................................................................................................ 12
Fig.1 .2.The comparison of properties of cellular solids with convenstional solids: (a) density; (b)
thermal conductivity (c) Young's modulus; (d) compressive strength. ............................................. 13
Fig.1 3. Different shapes in which honeycomb unit cells can be found. ........................................... 14
Fig.1.4. Hexagonal Honeycomb unit cell geometry parameters. ...................................................... 15
Fig.1. 5. Honeycomb structure with kinds of inside cells. ................................................................ 16
Fig.1. 6. Expansion and Corrugation Process of Honeycomb Manufacturing .................................. 17
Fig.1. 7. Honeycomb type impact attenuator undeformed and derformed by the experiment.. ........ 19
Fig.1. 8. Elliptical type of Impact Attenuator. ................................................................................... 20
Fig.1. 9. Midway Crushing of Impact Attenuator on UTM. ............................................................. 21
Fig.1. 10. Force and Displacement vs time Curve of CFRPM type of Impact Attenuator. .............. 22
Fig.1. 11. Position of Two types of impact attenuator at a impact at 14m/s of Crash Scenario........ 23
Fig.1. 12. Deceleration vs Time Graph. ............................................................................................ 24
Fig.2 1. Structural Analysis Classification. ....................................................................................... 28
Fig.3. 1. Universal Machine used for Compression test. ................................................................... 30
Fig.3. 2. Clamped foam Workpiece on the machine. ........................................................................ 31
Fig.3. 3. Displacement Vs Time graph for Foam structure. .............................................................. 32
Fig.3. 4. Stress and Strain curve for Foam Structure ......................................................................... 32
Fig.3. 5. Imported Displacement VS Force Curve in LS-DYNA...................................................... 33
Fig.3. 6. Energy vs Time for foam. ................................................................................................... 33
Fig.3. 7. Honeycomb Structure clamped for compression test. ......................................................... 35
Fig.3. 8. Honeycomb Structure during test getting failed as predicted by buckling of Tubes. ......... 36
Fig.3. 9. Displacement Vs Time graph for Form structure................................................................ 36
Fig.3. 10. Stress and Strain curve for Form Structure ....................................................................... 37
Fig.3. 11. Imported Displacement Vs Force Data of Honeycomb Structure in LS-DYNA pre-post 37
Fig.3. 12. Energy vs Time for honeycomb. ....................................................................................... 38
Fig.3. 13. High Impact penetration machine. .................................................................................... 39
Fig.3. 14. Fabrication of Honeycomb with glass fibre. ..................................................................... 40
Fig.3. 15. Test work honeycomb workpiece before Test. ................................................................. 41
Fig.3. 16. The Deformed Workpiece after Test ................................................................................. 42
Fig.3. 17. Energy Vs Displacement graph for Sandwich honeycomb in high penetation test. ......... 42
Fig.3. 18. Energy Vs Time Graph for Sandwich honeycomb in high penetation test. ...................... 43
Fig.3 .19. Force Vs Displacement Graph for Sandwich honeycomb in high penetation test. ........... 43
Fig.3. 20. Force Vs Time Graph for Sandwich honeycomb in high penetation test. ........................ 44
Fig.4. 1. Isometric View of roll cage designed in SOLIDWORKS .................................................. 45
Fig.4. 2. Meshed roll cage with a rigid wall in ANSYS .................................................................... 46
Fig.4. 3. Velocity applied to roll cage in the z direction. .................................................................. 46
Fig.4. 4. Rigid wall provided with fixed geometry. .......................................................................... 47
Fig.4. 5. Equivalent Elastic Strains in the roll cage. .......................................................................... 47
Fig.4. 6. Equivalent stress in the roll cage. ........................................................................................ 48

9
Fig.5. 1.Modelled Honeycomb structure with penetrator in ANSYS. .............................................. 49
Fig.5. 2. Meshed Honeycomb structure with penetrator. .................................................................. 49
Fig.5. 3. Velocity applied to penetrator in z direction. ...................................................................... 50
Fig.5. 4. Fixture applied at rear plate of Honeycomb Sandwich ....................................................... 50
Fig.5. 5. Deformation in the Modelled Honeycomb structure........................................................... 51
Fig.5. 6. Von mises stresses in the modelled honeycomb structure. ................................................. 51
Fig.5. 7. Energy Summary of the Honeycomb model in ANSYS. .................................................... 52
Fig.5. 8. Assembled 3 Layer honeycomb Structure with a wall in SOLIDWORKS. ....................... 53
Fig.5. 9. Imported Honeycomb structure with wall and plate on which roll cage mass is applied. .. 53
Fig.5. 10. Meshed Honeycomb Model with wall in ANSYS. ........................................................... 54
Fig.5. 11. (a)Fixed condition applied to the rear face of wall (b) velocity on the rear plate of
honeycomb. ....................................................................................................................................... 54
Fig.5. 12. Total deformation in the honeycomb structure. ................................................................ 55
Fig.5. 13. Energy summary of the Full-scaled model of Impact attenuator. ..................................... 55
Fig.6. 1. Isometric view of the Impact attenuator with roll cage. ...................................................... 56
Fig.6. 2. Frontview of the Impact attenuator with roll cage. ............................................................. 56
Fig.6. 3. Side view of the Impact attenuator with roll cage. .............................................................. 57

10
List of Tables
Table.1 2. Impact on Honeycomb Filled Aluminium Tubes. ............................................................ 22
Table.3. 1. End value of Force and Deformation w.r.t Time for Foam. ............................................ 31
Table.3 2. Chemical Composition. .................................................................................................... 34
Table.3 3. Physical Properties. .......................................................................................................... 34
Table.3 4. Mechanical Properties. ..................................................................................................... 34
Table.3 5. End value of Force and Deformation w.r.t Time for Honeycomb. .................................. 35
Table.4. 1. Mechanical Properties of material provide to roll cage................................................... 45

11
Introduction
The safety of the occupants in a vehicle can be compared to the objects which are packed inside a
box for shipping from one place to another place at a distance. In this way the safety of the occupants
depends on how much we spend on packaging i.e. on the safety of the occupants. The quality of
protective packaging depends on the ability of it to convert kinetic energy into some other form of
energy which is usually done from heat to plasticity, viscosity, viscos-elasticity or friction. This
should be done keeping in mind that peek forces (and thus the deacceleration or acceleration) on the
body should always be below the threshold as if its more than threshold it may cause injury to
occupants of the vehicle. Vehicle safety is one of automotive technology's most important fields of
assessment. Automotive engineering is creating new methods to provide the occupants with passive
and active safety systems and methods. Passive safety involves more extensive mitigation of the
effects of accidents. Passive Safety includes mitigation of accident consequences to greater
extend. Passive safety measures can be done by a lot of different type of measures which include-
• Inner-Safety-
Inner safety can be done by making use of a seatbelt, belt force limiter, Seat belt travel
limiter, airbag, side-bag, neck support etc.
• Outer-Safety-
Outer safety is mainly used to keep the integrity of the vehicle during the collision which
can be done by using body geometry, rigidity and deformation zone.
The driver’s safety is most important when thinking in the safety of the vehicle. Secondary safety
could be to safe guard the main structure of the vehicle during the crash scenario. To ensure
safety of the driver and vehicle main structure there is possibility to use energy absorbing
structure which can absorb bulk of energy which is generated during high speed collision of the
vehicle. The use of any absorbing structure will take up kinetic energy and would decrease the
rate at which the vehicle deaccelerates during a high-speed crash scenario. These energy
absorbing structures have been used in the automobile world and are commonly known as impact
attenuator.
The impact attenuator in simple definition can be defined as a device which can deaccelerate a
vehicle in numerous steps to a complete stop or till the safety limits in which there would be no
significant harm to the driver. By increasing the time in which the vehicle deaccelerates, the
frame and driver can withstand the crash scenario without any significant harm to them. The
bulk of impact energy generated during the crash is transferred into the deformation of the
structure of the impact attenuator.
The impact attenuator can not only be integrated into vehicle structure but also on barriers on
the roads to reduce the losses which can occur during a crash event.
12
1. Review of Literature
1.1. What is a cellular solid?
The most appropriate approach to solve any engineering problem is to first analysis the basic physics
and governing parameters of it. The first aim of my studies is to look for materials that have high
energy absorption capacity which can help to absorb high impact energies which are generated during
the collision of a vehicle. Such materials are found in the nature which are called as cellular solids. A
lot of work has been already been done on cellular solids. To use cellular solids in our application
first we went into learning what are cellular solids and what advantages they hold over conventional
solid materials.A cellular solid can be defined as a network of solid struts or plates which form the
edges and faces of cells.Some of the most typical three types of structures for cellular solids are shown
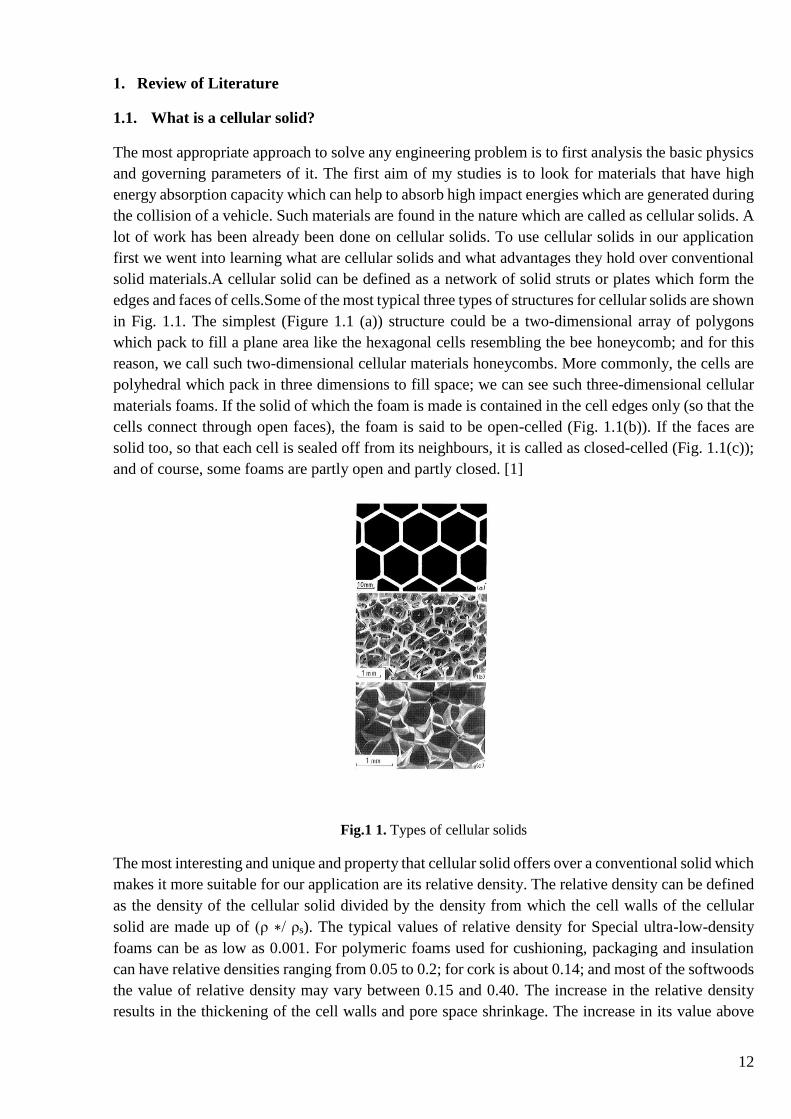
in Fig. 1.1. The simplest (Figure 1.1 (a)) structure could be a two-dimensional array of polygons
which pack to fill a plane area like the hexagonal cells resembling the bee honeycomb; and for this
reason, we call such two-dimensional cellular materials honeycombs. More commonly, the cells are
polyhedral which pack in three dimensions to fill space; we can see such three-dimensional cellular
materials foams. If the solid of which the foam is made is contained in the cell edges only (so that the
cells connect through open faces), the foam is said to be open-celled (Fig. 1.1(b)). If the faces are
solid too, so that each cell is sealed off from its neighbours, it is called as closed-celled (Fig. 1.1(c));
and of course, some foams are partly open and partly closed. [1]
Fig.1 1. Types of cellular solids
The most interesting and unique and property that cellular solid offers over a conventional solid which
makes it more suitable for our application are its relative density. The relative density can be defined
as the density of the cellular solid divided by the density from which the cell walls of the cellular
solid are made up of (ρ ∗/ ρs). The typical values of relative density for Special ultra-low-density
foams can be as low as 0.001. For polymeric foams used for cushioning, packaging and insulation
can have relative densities ranging from 0.05 to 0.2; for cork is about 0.14; and most of the softwoods
the value of relative density may vary between 0.15 and 0.40. The increase in the relative density
results in the thickening of the cell walls and pore space shrinkage. The increase in its value above

13
0.3 results in a transition zone where the cellular solid is better thought of as a solid containing isolated
pores (Fig’s 1.1).
1.2. Properties of cellular solids
The Foaming materials dramatically help us to extend the limits of properties that are available to the
engineer. The physical, mechanical and thermal properties of cellular solids are measured in a similar
way as of a fully dense solid. Figure 1.2 shows the range of four of these properties: the density, the
thermal conductivity, Young's modulus, and the compressive strength. The bar with dotted shading
shows the range of the property that is covered by the conventional solids. The solid bar shows the
extension of these properties provided by cellular solids. The increase in the extend of properties
created by cellular solids make them suitable for numerous application which the fully dense solid
from which their cell walls made up of would not be able to fulfill. The decrease in the densities
allows designers and engineers to make the design lighter, stiffer components such as sandwich panels
with composite panels and large portable structures, and of flotation of all sorts. The low thermal
conductivity helps to make designs cheaper, reliable thermal insulation that can be bettered only by
expensive vacuum-based methods. The low stiffness property of foams puts them in an ideal place
for a wide range of cushioning applications; elastomeric foams, for instance, are the standard
materials for seating. The low strengths and large compressive strains make cellular solids fascinating
for energy-absorbing applications; there is an immense market for cellular solids for the protection
of everything from computers to canisters of hazardous wastes. [2]
Fig.1 .2.The comparison of properties of cellular solids with convenstional solids: (a) density; (b) thermal
conductivity (c) Young's modulus; (d) compressive strength.
The factors which can play a vital role over the properties of the cellular solids other than mechanical
properties like density, the thermal conductivity, Young's modulus, and the compressive strength are
the factors arising from their unit cell structure. Specially in the case of honeycomb type cellular
solids the shape and size of the unit cell can highly influence their outcome properties. Widely
speaking the cellular solids can be divided into two categories namely honeycomb and foams. The

14
honeycombs can further be divided into different types based upon the shape of its unit cell.The
hexagonal honeycomb structure is the most popular commercial product and has been widely used in
kinds of industry fields, such as in aerospace, vehicles, a high speed railway train and so on.
1.3. Honeycomb Structure
As we discussed earlier the honeycomb properties are dependent on its unit cell shape. This makes it
important to understand the shape of honeycomb unit cell and understand which shape can be best
suitable for our application. The honeycomb structure is quite complicated in construction. As
discussed above the honeycomb consist of the Prismatic cells which can be characterized using cell
shapes. The unit cells of honeycomb most commonly can be triangulated, square, hexagonal
rectangular and some other shapes resulting from variation in these basic shapes. Also, different
shapes can be obtained by the way in which these basic shapes are stacked in. [3]
Fig.1 3. Different shapes in which honeycomb unit cells can be found.
Among all these shapes of honeycomb available the most commonly used type of honeycomb for
commercial use is the hexagonal honeycomb type. It’s been widely used in different fields like
aerospace, navel and automotive industry. The hexagonal type of unit cell can be further of different
types. The figure shows some basic parameters of hexagonal type unit cells.

15
Fig.1.4. Hexagonal Honeycomb unit cell geometry parameters.
The width of the unit cell in hexagonal type is given by 2lcosθ and height of the unit cell is given by
the h+lsinθ. If H/l ratio is equal to 1 it is called as a regular hexagonal unit cell. The honeycomb
structure is anisotropy in nature i.e. it behaves differently in different directions. The two most
different set of properties that honeycomb poses is when it is subjected external loads in plane to its
structure or out of plane to its structure.
So, the honeycomb structure should be analysed in these two planes-
1.3.1. In-Plane behavior-
In this approach the forces act in the plane of honeycomb. When external loads act in plane
the stress on unit cells of honeycomb can be analyzed using bending of walls and with the
help of it the young’s modules, poison ratio can be calculated. The final formula obtained by
this mathematical approach is as below-
𝐸 ∗1
= ES (𝑡
𝑙)3 𝑐𝑜𝑠𝜃
(ℎ
𝑙+𝑠𝑖𝑛𝜃)𝑠𝑖𝑛2𝜃
= 4
3 (
𝑡
𝑙)3 ES
The formula obtained by the in-plane behavior of honeycomb concluded to that the properties
of honeycomb structure in In-plane behavior only depends on 3 factors namely solid property,
relative density and cell geometry.
The failure of honeycomb in In-plane is mainly governed by the Facture toughness, brittle
crushing, plastic collapse and elastic buckling.
1.3.2. Out-of plane behavior
The out of plane behaviour can be defined as when external forces are acted in a plane which is
other than x1 or x2 i.e. in x3 direction or when can say when external forces at in direction of
paper to figure1.4. The honeycomb can take up extremely high loads if it is subjected in out of

16
plane. This phenomenon makes honeycomb best suitable for energy absorption devices. They
honeycomb have been used as sandwich panels to absorb energy. The failure of unit cells of
honeycomb in out of plane occurs due expanding or contraction rather than bending as in the case
of in plane behaviour. In out of plane scenario there could be two cases father when loads act to
compress or in tension to the honeycomb structure. For our application the honeycomb sandwich
will only act in the compressive manner. The failure in compression occurs mostly by elastic
bucking of the unit cell of honeycomb structure which is followed by the plastic buckling. If the
material from which the honeycomb is made up of is brittle the failure in this case could even
happen by brittle crushing of the tubes.[4][5]
1.4. Typical reinforced honeycomb structure
As we discussed earlier that hexagonal unit cell type of honeycombs are more acceptable in the
commercial market of cellular solids and this led to even more type of different types of unit cell
which done by reinforcing other shapes into hexagonal unit.Fig.14. shows five most common
hexagonal reinforced honeycomb structures. All these five types of structures are created based on
the regular hexagonal cells. Basically, it can be categorized into three types. The first is simply
reinforced with inside ribs. They are named as general hexagonal and triangular type, just respectively
as Fig.1.5 (a) and Fig.1.5 (b). The second is embedded with another hexagon inside the unit cell, they
are named as hexagonal and double hexagonal type,and are shown in Fig.1.5(c) and Fig.1.5(d). The
third type is reinforced with circle inside, and they are denoted as inside circular and full inside
circular inside, just as Fig.1.5 (e) and Fig.1.5 (f). For general hexagonal honeycomb, it can be
characterized with the wall thickness of cell as t, the length of cell is denoted by h0. Whereas, for
other four reinforced types of unit cell structure the length of inside hexagon or the radius of inside
circle are both half of the lenth h0, that means that h1 will be half of the h0 amd R will be half of
h0.[6][7][8]
Fig.1. 5. Honeycomb structure with kinds of inside cells.
After going through the different type of Cell Structure Available the general hexagonal
honeycomb Structure was chosen to be made as it is easy to manufacture, and it also full-fills the
requirement of our required mechanical properties in our application.
1.5. Manufacturing of Cellular Solids
The 2 major categories of cellular solids are honeycomb and foam structure. Both are naturally
found in the nature but to use these structures in the engineering application they need to be

17
manufactured by some sort of manufacturing techniques. The manufacturing technique is chosen
based upon material to be processed for cellular solids and which cellular solid type to be created.
The honeycomb is mostly manufactured using extrusion, rapid prototyping, casting or biocarbon
template.
• Extrusion process – In the extrusion process the metallic sheet from which the honeycomb cells
are to be made are cut down into specified dimensions based upon the unit size of honeycomb
which is required to be manufactured and strips of adhesive are printed on the metal sheets. The
adhesive is applied in a way on the sheet that adhesive prints on adjacent sheets are shifted by
half of the distance between adjacent prints on the same sheet. Once the structure has solidified
and curing of the adhesive. In the next step the HOBE block is sliced into required thickness of
the core and then HOBE slice is expanded to form honeycombs structure. Using extrusion process
most commonly ceramic honeycombs are manufactured by extrusion of a ceramic slurry through
a die.
• Corrugation Process-
In corrugating process for manufacturing of honeycomb the rolled sheet of metal is passed
through special type of rollers which imprint the unit cell of the metal sheet. The shape and size
of the unit cell of honeycomb can be varied by the different shape parameters of corrugating
rollers. Then these corrugated sheets are combined to form the corrugated block. [9]
Fig.1. 6. Expansion and Corrugation Process of Honeycomb Manufacturing
• 3D printing -The honeycombs can be even manufactured using scan photo-sensitive polymer
with laser.

18
• Casting -The honeycombs can be manufactured using casting process by passing the liquid
material from which the honeycombs cell is to be made into a mould. This type of manufacturing
process is commonly used for manufacturing honeycomb structure with silicone rubber material.
1.6. Passenger Cabin Safety
There exist a lot of ways by which the crash scenario to safe guard the passenger can be be done but
the most two cases which need to be fulfilled for most of the automotive test bench are –
1.6.1. Vehicle collision with the wall
In this scenario the vehicle collides with the wall with an impact force and its kinetic energy
is converted into deformation energy i.e. potential energy. The final expression by
mathematical equations is as under-
at=V2 /st = (cb * St)/(m)
Here
V=Speed of the vehicle at which it collides with the wall
at=Deacceleration of the vehicle
St= required deformation zone, end value
Cb= structural rigidity of bodywork
m= Mass of the vehicle.
The factors which can significantly increase the safety of the vehicle while collision are structural
rigidity of the car and available area for deformation. The structural rigidity of the body work can be
increased by choosing more stiffer materials while making more area available for deformation while
collision the deformation zone can be increased.
1.6.2. Partner Protection
The partner protection can be defined as when two vehicles of different masses, acceleration
collides with one another. In partner protection there are 3 factors which has very significant
influence for making vehicle to fulfill partner protection-
– Mass aggressivity-
al=(mh/ml)*ah
therefore a1>ah. The small vehicle always collides with higher accelerations which
puts the smaller vehicle into a disadvantage when the lighter vehicle collides with a
heavier vehicle. This disadvantage can’t be removed through design as smaller vehicle
with smaller mass has smaller area available for deformation than a heavier vehicle.
– Geometrical Aggressivity-
When two vehicles with different masses and different shape collides with one another
the greater deformations are found in the smaller vehicle with lesser mass as compared
to vehicle of heavier mass

19
– Aggressivity of rigidity-
The energy absorption for smaller vehicle is less.[10]
1.7. Work done by some researcher‘s on experimental testing of impact attenuator
To determine the energy absorbing capacity of honeycomb or foam most commonly they are tested
using the dynamic test. The drop test is mostly used for impact analysis on cellular solids like
honeycomb and foams. The drop test is generally conducted by dropping a weight of known mass
from a known height onto the model while measuring its deformation. [11]This method provides an
easy and efficient way to measure the deformation occurred in the test piece due to the impact on it
by the dropped weight. So, for this context I found a research paper by Abrahamson Chad et al. [12]
and Two samples were evaluated for impact attenuator design using a fall weight test method in
accordance with the SAE 2010 formula rules. The size of the first specimen used to carry out the
experiment was (254 x 203.2 x 127 mm) while the size of the other specimen used by them consist
of (254x 254x 101.6 mm). Plascore PCGA-XR1-5.2-1/4-P-3003 aluminum honeycomb was the
material used for both samples. The experiment was conducted with an effect of 300 kg mass as a
drop weight.The impacting mass was dropped from a height of 2529.84 mm having a impact velocity
of more than 7.0104 m/s. The peak deceleration and average deceleration obtained for the first
specimen was equal to the value of 46.88 G’s and 17.86 G’s, While 36.2 G and 14 G were of the
same second sample. The tested type impact attenuator by them by drop test is shown in Fig. 1.7. And
in the upper part of the figure the honeycomb material used by them is shown and in the lower part
of figure the deformed structure as a consequence of experiment is shown.-
Fig.1. 7. Honeycomb type impact attenuator undeformed and derformed by the experiment..
A team of researchers Kumar Devender et al. [13] designed and tested an elliptical shaped type of
impact attenuator which was made out of aluminium material.The grade of aluminium used by the
for making elliptical shape impact attenuator was Aluminium 6063 T6 material. They carried out
experimental test on this elliptical shape impact attenuator. The simulation was done in finite element
analysis software package of LS-DYNA. The test done by them for testing out the impact attenuator
was by using the impact testing procedure. The impact test was conducted considering the fact that
two modes have a direct body to body collision. The simulation result obtained in their case was an
average deceleration of 18.8G and on the other hand the average deceleration recorded from

20
experimental drop testing was of the value of 13.15G. The average deceleration in both the case is
under the rules provided by SAE for testing of impact attenuator which should be below 20G. The
type of impact attenuator designed by them is shown under in fig 1.8.
Fig.1. 8. Elliptical type of Impact Attenuator.
A team of researchers Singhal Arpit and Subramanium S. Vignesh [14] designed and tested a shell-
based impact attenuator which was in a shape of frustum of a pyramid. They designed a two-stage
impact attenuator in SOLIDWORKS and used bottles to accommodate inside the shell which will
absorb energy. They performed 3 cases of drop tests with empty shell, with beer bottles inside the
shell and with cola bottles inside the shell. They drop test conducted by them was from a drop
height of 5000 mm with 150 kg of dropped mass. The deacceleration was lowest in the case in
which cola cans were used. And they made a conclusion that sheet metal used by them for shells
was making problems in the overall deformation of the structure which was removed by providing
holes in the side faces of the shell.
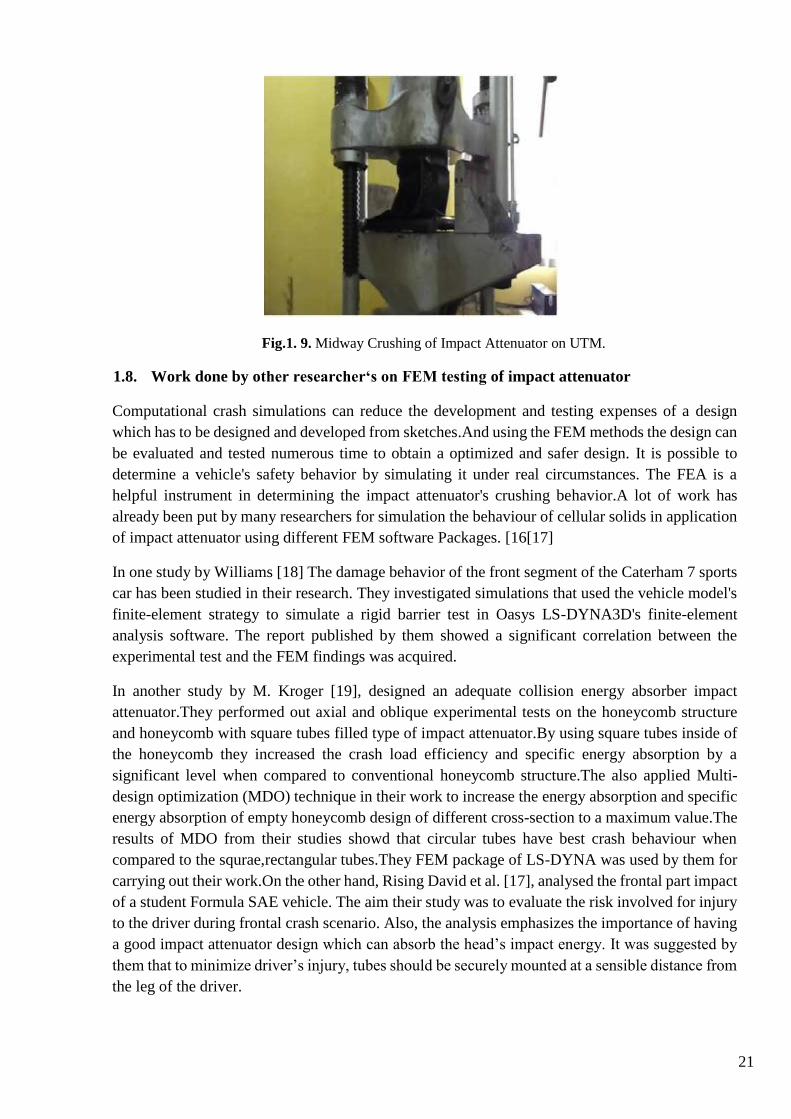
Sengupta Akash et al. [15] fabricated a truncated trapezoidal shaped impact attenuator. The design
and modelling of the impact attenuator done using CAD modelling software CATIA V5R20.They
fabricated the impact attenuator using a grade of aluminium. The thickness for the aluminium sheet
was 2 mm while for the anti-intrusion plate consisting of solid steel was 1.5 mm. They conducted
experimental compression test on their fabricated structure using UTM machine.The impact
attenuator made by them deformed by considerable factor. The crushing of impact attenuator sheets
in their case is shown below in Fig. 1.9.
21
Fig.1. 9. Midway Crushing of Impact Attenuator on UTM.
1.8. Work done by other researcher‘s on FEM testing of impact attenuator
Computational crash simulations can reduce the development and testing expenses of a design
which has to be designed and developed from sketches.And using the FEM methods the design can
be evaluated and tested numerous time to obtain a optimized and safer design. It is possible to
determine a vehicle's safety behavior by simulating it under real circumstances. The FEA is a
helpful instrument in determining the impact attenuator's crushing behavior.A lot of work has
already been put by many researchers for simulation the behaviour of cellular solids in application
of impact attenuator using different FEM software Packages. [16[17]
In one study by Williams [18] The damage behavior of the front segment of the Caterham 7 sports
car has been studied in their research. They investigated simulations that used the vehicle model's
finite-element strategy to simulate a rigid barrier test in Oasys LS-DYNA3D's finite-element
analysis software. The report published by them showed a significant correlation between the
experimental test and the FEM findings was acquired.
In another study by M. Kroger [19], designed an adequate collision energy absorber impact
attenuator.They performed out axial and oblique experimental tests on the honeycomb structure
and honeycomb with square tubes filled type of impact attenuator.By using square tubes inside of
the honeycomb they increased the crash load efficiency and specific energy absorption by a
significant level when compared to conventional honeycomb structure.The also applied Multi-
design optimization (MDO) technique in their work to increase the energy absorption and specific
energy absorption of empty honeycomb design of different cross-section to a maximum value.The
results of MDO from their studies showd that circular tubes have best crash behaviour when
compared to the squrae,rectangular tubes.They FEM package of LS-DYNA was used by them for
carrying out their work.On the other hand, Rising David et al. [17], analysed the frontal part impact
of a student Formula SAE vehicle. The aim their study was to evaluate the risk involved for injury
to the driver during frontal crash scenario. Also, the analysis emphasizes the importance of having
a good impact attenuator design which can absorb the head’s impact energy. It was suggested by
them that to minimize driver’s injury, tubes should be securely mounted at a sensible distance from
the leg of the driver.

22
Table.1 1. Impact on Honeycomb Filled Aluminium Tubes.
Experiment
Number
Impact
Velocity[mm/s]
Impact angle
[°]
First Peak load
[N]
Mean Crush
Load [N]
Force(case 1) 7490 0 80200 41000
Force(case 2) 8690 0 79300 40000
Force(case 3) 9750 0 78100 39000
Force(case 4) 7750 5 47300 31000
Force(case 5) 5100 10 48600 31000
In one more study Enomoto Hiroshi [20], tested the different types impact attenuator for student
formula rollcage. 3 types different types of design includes a structure using steel pipes (SSF), a
monocoque structure with aluminium tubes and a monocoque structure with Carbon Fibber
Reinforced Plastic (CFRPM) by performing finite element analysis on 3 types of impact attenuator
design respectively. The comparison made by their results concluded that among the three different
types impact attenuators the CFRPM type impact attenuator design absorbed the highest energy and
in all the three types of impact attenuator the crush length had optimistic results. The force and
displacement curve from their study for CFRPM type impact attenuator is shown under the Fig. 1.10.
Fig.1. 10. Force and Displacement vs time Curve of CFRPM type of Impact Attenuator.
In a study by Heimbs S., involved investigation of crash behaviour of the nose cone of a F1 racing
car. They modelled FEM model for dynamic simulations using LSDYNA with emphasis placed on
the composite material modelling. They compared crushing mechanism, energy absorbed as well as
deceleration levels of FEM model with the experimental test data.

23
In a study by Belingardi Giovanni and Obradovic Jovan [21], analyzed the comparison of impact
attenuator, as a stand alone structure and the complete assembly of the impact attenuator with car
body. They created the complete CAD model of the impact attenuator with integrated vehicle model
using 3-D modelling capabilities of CATIA design software which was modelled keeping in mind
the design rules provided by SAE 2008 rulebook. They transferred 3-D model from CATIA to FEM
Package of ALTAIR HYPERWORKS which uses a explicit RADIOSS code. The discussion made
by them about their results revealed that both structure Impact attenuator alone and impact attenuator
integrated with vehicle model showed crushing behaviour almost similar in the first half of the
simulation. Even the energy absorbing capacity was quite similar in the initial stage of the simulation.
But in the final stage of the simulation the model with complete assembled impact attenuator with the
vehicle model deformed more than impact attenuator stand alone. A year later, Belingardi G. et al.
[15] designed an impact attenuator for student formula car using composite material of carbon fibre.
As carbon fibre is brittle material and they analysed the crash behaviour of carbon fibre-based impact
attenuator using a simplified analytical method. The FEM simulation were carried out using LS-
DYNA package and they predicted the crash pattern, stiffness of the carbon fibre-based impact
attenuator. They impact attenuator designed by them is shown by figure 1.11.
Fig.1. 11. Position of Two types of impact attenuator at a impact at 14m/s of Crash Scenario.
In another study by Velea N. Marian et al [22], the main of their study was to analys different cellular
cores which can be used in sandwich application with which they can reduce use of base material and
cost of overall design.They investigated a multi-layered cellular structured impact attenuator using
the finite element method package of ExpaAsym.And in their work they concluded that best core
would be one with lowest relative density possible.When the ratio of h/l is eqaul to 2 the internal
angle made would be of 60 degree and this would result in a hexagonal type shape of unit
cell.So,clearly from their studies it can be concluded that hexagonal type unit cell are best for
sandwich application. In the recent work by Jain Mayank and Kalia Ved Aman , designed a cuboidal
shaped impact attenuator for the passenger vehicle. The design and modelling of the impact attenuator
was done in 3-D modelling software package of SOLIDWORKS and the simulation is carried out in
finite element method package of ANSYS.Two different types of material was used by them for
simulation that they can chose from the one which is best in their application. The Galvanised Iron
sheet (GI sheet) and Aluminium 2024 sheet with thickness of 1 mm were used for impact attenuator
analysis. The discussion made by them about the results showed that peak deacceleration, magnitude
of the maximum peak acceleration and impacting velocity all were under the accepted rules of impact

24
attenuator design i.e. their values were under 20G rule used for designing impact attenuator.The
Fig.1.12 shows the displacement vs time plot of impact attenuator analysed by them.
Fig.1. 12. Deceleration vs Time Graph.

25
2. The Design Consideration
Before designing and manufacturing any engineering product it is always a better choice to put
forward all the engineering constrains so we can design a product which fulfil all requirement. So, to
design impact attenuator, I have considered the following engineering parameters:
– Low weight- As weight reduction is a very important factor for automobile sector. The
increase in weight would affect overall performance of vehicle in its fuel efficiency and even
would affect its performance in high end racing application. So, it should be a primary
requirement of the impact attenuator that it’s not too bulky which in turn would not increase
the overall weight of the vehicle.
– Small and compact size-As available space in automobile world is always a hot topic and its
best utilization plays a significant role in dimensioning the overall vehicle. So, the approach
is used that the size of the impact attenuator can be decreased without compromising with its
energy absorption property.
– Fire resistant- For racing and even in general automobile application its sometime necessary
to have parts of the vehicle which are fire resistant which helps in to safeguard the occupants
in the worst case in which the vehicle catches fire. So, its focused to design an impact
attenuator which is made from a material which is not too volatile, or which would not give
rise to fire in the case of crash.
– Efficient Cost of Fabrication-The cost of a product is a derived need of automobile which
comes straight from market by the customers. A product which is economically accepted by
the market have more chances that it can come to real production cars rather than just to be in
conceptual design.
– Energy absorption capability-The most important and crucial property to design and
manufacture an impact attenuator is that it should have high energy absorption capabilities so
that it can absorb the high energy which is generated during a crash scenario and with this the
occupants, main structure of the vehicle can be safe guarded.
– Partner Protection-While designing an impact attenuator it’s not just required that we create
a structure which has high energy absorption capacity and stiffness. But it should also fulfil
at least some extends of partner protection i.e. it should not be a threat to other vehicles in the
case when it could crash with other vehicle of less weight and less stiffness or with lesser
deformation zone.
– Lower Deacceleration while collision- The impact attenuator should help in lowering
deacceleration at which it is produced while the case of Collison or crash. As it has been found
that if a vehicle a vehicle deaccelerates at higher rate it could produce much higher harmful
and hazardous causes to occupants and to the structure of the vehicle.
2.1. Design Selection
So, based upon all the above engineering design parameters the final design of impact attenuator
is to be evaluated. Weight is an important component as more weight contributes to lesser high
speeds and which mean more weight of impact attenuator can slower the vehicle. Cost was
evaluated because as with any engineering project, budget constraints cannot be over looked.
Reliability should also be taken into consideration as if something goes wrong in real life
situation of crash it could cause serious losses to occupants’ most important design consideration
for our case would be the energy absorbing capacity of our design using which the occupants of

26
the vehicle can be safeguarded to greater levels of protection while even in the extreme cases of
vehicle collisions.
2.1.1. Airbag Design
The airbag technology has been used in commercial vehicles since 1973.The airbags fulfil the
expectation of low weight, reliability and safety but the cost factor involved in it makes it
expensive because a high initial cost gets involved due to sensors other primary equipment’s
needed for its operation. Also, the cost involved in the replacement of the parts after any crash
event is also high.
2.1.2. Crimped Metal Lattice Design
Other alternative for design application could be a crimped metal lattice which is just a many
series of metal plates which can absorb high impact energies while in the case of the collision.
The crimped metal lattice fulfils our most of the design requirements as it is low cost, reliable
and even it can absorb good amount energy while collision. The only drawback it comes with is
that it can deform even with a small collision case and then it needs to be replaced. Also,
compared to honeycomb design it would acquire more space and would be heavier than same
size honeycomb sandwich with almost which can absorb same amount of energy.[18]
2.1.3. High Impact Foam Design
Form also falls under the category cellular solids as it was discussed above. The use of form can help
in best utilization of the space that can be used for absorbing energy in the case of the collision as it
is very easy to shape it into any size and shape. Also, the form type impact attenuator would be least
expensive. The weight of the impact attenuator made from the form would be significantly low and
its reliable too. The form type impact attenuator fulfils all design parameters and that’s why it would
be analysed for our application.
2.1.4. Honeycomb Design
The energy absorbing capacity for honeycomb are much higher than foams. Also, the availability of
the honeycomb cores with different parameters of unit cell could help to manufacture impact
attenuator which is best fit for our application which not over engineered nor under engineered.
And luckily one of the venders of honeycomb cores from India provided us the honeycomb cores of
different shapes and sizes for our research work. And all these reasons made honeycomb type impact
attenuator best suitable type for our application.
2.2. Advantages of Using Honeycomb Composites
– Reduced Cost of fabrication
The cellular solids can easily be designed and fitted into any engineering application and
manufacturing required to produce honeycomb or foam structure to be applicable for our application
is also less. Secondly the honeycomb and foam structure are widely available in the market with
different mechanical properties and design parameters. So, using cellular solids for making vehicle

27
safer in the crash scenario would be less expensive Because of direct and indirect cost cuts, many
companies prefer these lightweight products. Composites from Honeycomb are cheaper for
purchasing, handling, packaging and transport. Also being rubber or metal products makes it simpler
to dispose of them while providing cost savings for recycling. This is because they can be renewed
and recycled 100 percent.
– Strength-to-Weight Ratio
The weight of any component in automobile is significant as it directly affects the vehicle
performance and its fuel consumption. For racing applications, the weight reduction is one of the
most governing parameters and its tried to get components which have good strength-to-weight ratio.
If we use a device for safety which has significant weight addition to the vehicle it would directly
affect the vehicle performance. The honeycomb has a good strength-to-weight ratio and it provides
exceptionally good energy absorbing capacity when it is subjected to compressive loading.
– Fire and Fungus Resistant
The form has a good fungus resistant and some type of coting can be done to make foam fire resistant
till some extends. The honeycomb made from metal sheets have really well fire resistance and in the
situation when they are used as sandwich panels, they provide a really good fungus resistant too. And
both these properties are required for better performance of the impact attenuator as structure don’t
get damaged over time by fungus neither it acts as flammable material which may catch fire if vehicle
catches fire by any reason.
– Optimum Thermal Insulation
The cellular solids are normally good thermal insulators. The foams are much better in thermal
insulation property over honeycombs but when honeycombs are used as sandwich panels with other
composite materials like glass fibre, carbon fibre etc they also provide significant thermal insulation
properties too. The honeycombs have higher surface area when compared to the solid material from
which they are made up of and because of this reason the honeycombs have higher heat transfer rates
which stops heat accumulation in the cell walls to avoid heat deflection temperatures.
2.3. Calculations
Initial Conditions:
𝑉𝑖𝑚𝑝𝑎𝑐𝑡 = 10 𝑚/𝑠
𝑉𝐹𝑖𝑛𝑎𝑙 = 0𝑚/𝑠
𝐺 = 9.8𝑚/𝑠 2
𝑀 = 310 𝑘𝑔
𝐴𝑐 = 20 ∗ 𝐺 = 196𝑚/𝑠 2
Kinetic Energy: 𝐾𝑒 = 1/2 ∗ 𝑀 ∗ 𝑉𝑖𝑚𝑝𝑎𝑐𝑡 2 = (310*102)/2= 15,500 J
By applying Conservation of Energy,

28
Kinetic Energy is equal to potential energy
𝐾𝑒 = 𝑃𝑒
Calculating the Desired Drop Height:
𝑷𝒆 = 𝒎 ∗ 𝒈 ∗ 𝑯𝒅
𝐻𝑑 = 𝑃𝑒 𝑀 ∗ 𝐺 = (15500)/ (310*9.81) = 5.096 𝑚
Time of Impact:
t = Vimpact /Ac t = 0.0509s
2.4. Choosing the Right Simulation Type
Before We began to simulate any Physical Problem into FEM world it’s important to understand the
physics behind the FEM Methods Formulation and then choosing the right type of Simulation for a
given type of Problem. So, to understand FEM in more details I took deep understand from a book
Called “Introduction to Explicit Analysis using RADIOSS”. [23]
Fig.2 1. Structural Analysis Classification.
So according to our calculations we have an impact time of 40.8 milli seconds which clearly falls
under the category of explicit analysis.
Now once the type analysis type is fixed to Explicit analysis the second part is to design the
honeycomb in the design software with right mathematical model. So, most of the people are always
confused between choosing solid modelling or surface modelling.
Shell elements have 3 or 4 node 2D planar elements with constant thickness, and have either a

29
triangular or quadrilateral shape, that can be oriented in the space. They are typically used to model
structures such as pressure vessels, automobile bodies, ship hulls, aircraft fuselages…etc. Shell
elements support all translational degrees of freedom as well as all rotational degrees of freedom, that
is shell elements have 6 degrees of freedom.
The 3D solid elements are either a tetrahedral (4 faces) or hexahedral (6 faces) element. Brick or
tetrahedral elements may have different number of nodes and support only translational DOF. They
are normally used to model solid objects where shell elements are not appropriate to model them.
The Explicit Dynamics system is designed to enable you to simulate nonlinear structural mechanics
applications involving one or more of the following types:
• Cases of Impact from low [1m/s] to very high velocity [5000m/s]
• Cases of Stress wave propagation
• Cases of High frequency dynamic response
• Cases of Large deformations and geometric nonlinearities
• Cases of Complex contact conditions
• Cases of Complex material behaviour including material damage and failure
• Cases of Nonlinear structural response including buckling and snap through
• Cases of Failure of bonds/welds/fasteners
• Cases of Shock wave propagation through solids and liquids
• Cases of Rigid and flexible bodies

30
3. Testing Procedure
3.1. Compression Testing For Foam.
The easiest way to test the honeycomb or foam structure would be to test it by the simple compression
test. The compression test was chosen because we were interested in out of plane behaviour of the
honeycomb or form structure by which our structure can absorb a large quantity of energy which is
generated during the crash scenario of a vehicle collision. The energy absorbing characteristics for
cellular solids are high when they are put in the out of plane behaviour i.e. when they are compressed.
Fig.3. 1. Universal Machine used for Compression test.
So, using universal testing machine the compression test was carried out for foam and honeycomb
materials. The machine used for compression test has a range from 10-50 mm/min and it was
equipped with HBM measuring system which consist of BAQ SPIDER-8. For measurements the
machine was also equipped with force and displacement sensors. The full-size scaled model of the
impact attenuator would be really expansion approach for the testing procedure. So, a scaled model
of foam and honeycomb was used for testing.
Firstly, the test on the foam structure was carried out and test workpiece of 55*60*40.6 mm dimension
were taken. The test was carried out on 5 identical test pieces in order to obtain the best calibrated
results from the machine removing any sort of miscalculation that can generate due to any random
factor. The speed of machine was inputed at a rate of 10mm/min in our case.
31
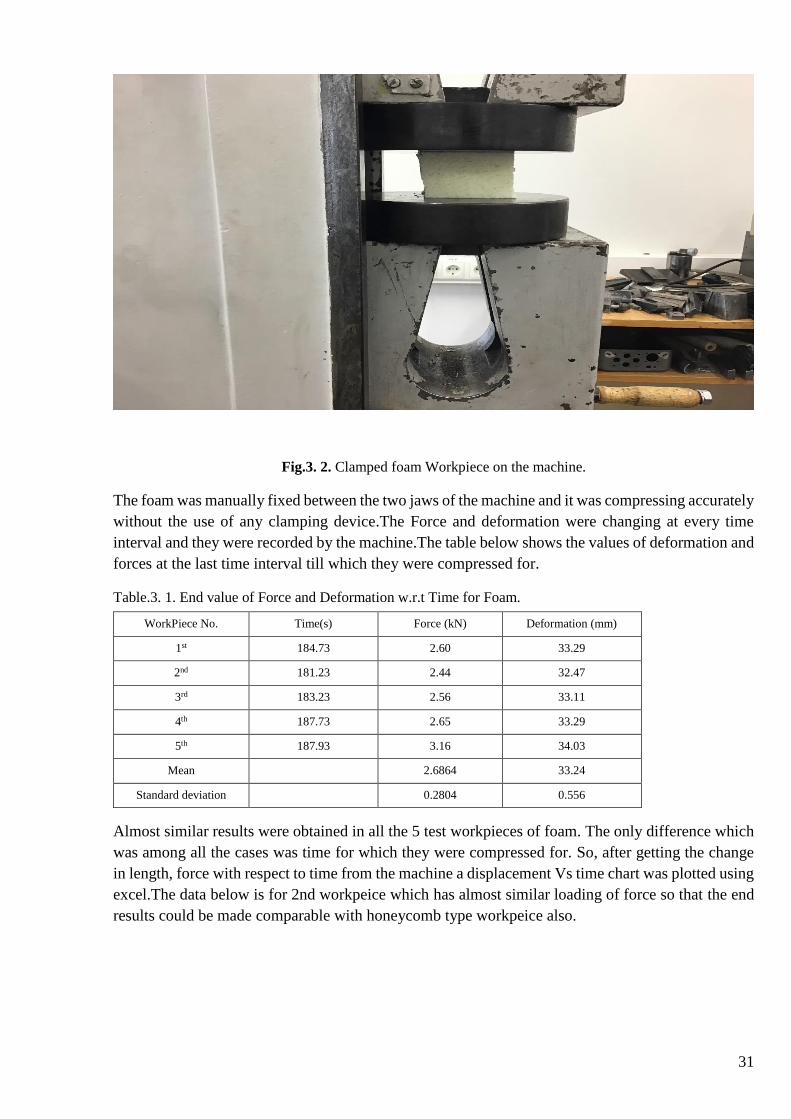
Fig.3. 2. Clamped foam Workpiece on the machine.
The foam was manually fixed between the two jaws of the machine and it was compressing accurately
without the use of any clamping device.The Force and deformation were changing at every time
interval and they were recorded by the machine.The table below shows the values of deformation and
forces at the last time interval till which they were compressed for.
Table.3. 1. End value of Force and Deformation w.r.t Time for Foam.
WorkPiece No. Time(s) Force (kN) Deformation (mm)
1st 184.73 2.60 33.29
2nd 181.23 2.44 32.47
3rd 183.23 2.56 33.11
4th 187.73 2.65 33.29
5th 187.93 3.16 34.03
Mean 2.6864 33.24
Standard deviation 0.2804 0.556
Almost similar results were obtained in all the 5 test workpieces of foam. The only difference which
was among all the cases was time for which they were compressed for. So, after getting the change
in length, force with respect to time from the machine a displacement Vs time chart was plotted using
excel.The data below is for 2nd workpeice which has almost similar loading of force so that the end
results could be made comparable with honeycomb type workpeice also.

32
Fig.3. 3. Displacement Vs Time graph for Foam structure.
The dimensions of all the workpieces were similar and by simply multiplying length by width we can
calculate area. The area of form workpiece was 3300 mm2 and the depth was 44.6 mm. So, using the
simple relation that stress is force over area, the stress was calculated at every time interval using
MICROSOFT EXCEL capabilities. Also, we know that strain is given by change in length to the
original length. The test workpiece only deformed in the out-of Plane i.e. along its depth so using this
very simple formula the strain was calculated at every time interval. Using Excel capabilities, the
stress Vs strain graph was plotted, and it is given below in figure 3.4.
Fig.3. 4. Stress and Strain curve for Foam Structure
The idea of our research work is that how much energy would be absorbed by the impact attenuator
and to get the energy we should integrate the area under the stress and strain curve. To integrate the
area under the stress and strain curve by analytical approach would be really a time-consuming
-5
0
5
10
15
20
25
30
35
0 50 100 150 200
Dis
pla
cem
en
t (m
m)
Time (s)
Displacement Vs Time
-0.1
0
0.1
0.2
0.3
0.4
0.5
0.6
0.7
0.8
0.9
-0.1 0 0.1 0.2 0.3 0.4 0.5 0.6 0.7 0.8
Stre
ss (
MP
a)
Strain
Stress Vs Strain

33
process. The LS-DYNA have capabilities to integrate such huge data of stress and strain. The LS-
DYNA pre-post is available for free on the internet. The displacement and force value were taken
from our report in the units m,N respectively. Now this data is converted into table form and saved
into .csv format. Displacement Vs Force curve data were imported to the LS-DYNA pre-post using
.csv extension. The area under the curve would give us the energy absorbed by the test specimen. The
Figure below show the imported Displacement Vs Force time curve using .csv extension in the LS-
DYNA pre-post.
Fig.3. 5. Imported Displacement VS Force Curve in LS-DYNA.
Now a using LS-DYNA capabilities this imported Displacement VS Force curve was integrated and
the Y axis value will provide us with energy absorbed by our foam structure.
W= ∫ 𝛔(ε)𝑑εε
0
Fig.3. 6. Energy vs Time for foam.
From energy vs time diagram, we can clearly understand when foam test piece was compressed till
34 mm displacement out of its 40.6 mm depth in out- plane behaviour the energy absorbed by it was
48 Joules.
3.2. Compression Testing For Honeycomb.
After this in the same fashion the honeycomb structure was mounted onto the machine. The
honeycomb test piece consists of the dimensions 55*60*40.3 mm. Similarly, 4 workpieces of
identical dimensions were taken just to keep eye on the précised data obtained by the machine.

34
The honeycomb tubes are made from aluminium 3003 alloy and the properties of the aluminium
material of the tubes are as below-
Table.3 2. Chemical Composition.
Element Content (%)
Aluminum, Al 98.6
Manganese, Mn 1.2
Copper, Cu 0.12
Table.3 3. Physical Properties.
Properties Metric Imperial
Density 2.73 g/cm3 0.0939 lb/in3
Melting point 644°C 1190°F
Table.3 4. Mechanical Properties.
Properties Metric Imperial
Tensile strength 130 MPa 18855 psi
Yield strength 125 MPa 18130 psi
Shear strength 83 MPa 12039 psi
Fatigue strength 55 MPa 7977 psi
Elastic modulus 70-80 GPa 10153-11603 ksi
Poisson's ratio 0.33 0.33
Elongation 10% 10%

35
The workpiece was manually clamped between the two jaws of the machine and there was no need
to use any clamping device. A limiter of depth was used in this case which helped us to compress all
the workpiece till same depth.
Table.3 5. End value of Force and Deformation w.r.t Time for Honeycomb.
WorkPiece No. Time(s) Force (kN) Deformation (mm)
1st 160.48 2.868 28.01
2nd 138.23 2.64 25.31
3rd 134.23 2.634 23.08
4th 131.23 2.55 22.83
Mean 2.67 24.81
Standard deviation 0.1363 2.408
Fig.3. 7. Honeycomb Structure clamped for compression test.

36
When honeycomb structure was compressed on the machine the tubes of honeycomb started buckling
followed by the folding of the tubes. The displacement and applied forces with varying time were
recorded from machine. The Displacement Vs Time is shown below for honeycomb.
Using the similar approach which was used in form testing the stress and strain were calculated using
the obtained data from the machine.The displacement Vs time graph lead to a conclusion that
honeycomb workpiece was deformed till 24 mm out of its 40.3 mm depth in a time interval of 135
seconds.
-5
0
5
10
15
20
25
0 20 40 60 80 100 120 140
Dis
pla
cem
ent(
mm
)
Time(s)
Displacement Vs Time
Fig.3. 8. Honeycomb Structure during test getting failed as predicted by buckling of Tubes.
Fig.3. 9. Displacement Vs Time graph for Form structure.

37
Similarly, as from the foam case to get the energy absorbed by the honeycomb structure the
displacement Vs force data was imported to LS-DYNA pre-post using the .csv format. The imported
Displacement Vs force data is shown in figure below 3.11.
In the similar fashion the imported Displacement Vs Force graph was integrated using the LS-DYNA
pre-post capabilities and figure below shows the integrated Displacement Vs Force and y axis value
dictates to the value of the energy.
-0.2
0
0.2
0.4
0.6
0.8
1
1.2
1.4
1.6
1.8
-0.1 0 0.1 0.2 0.3 0.4 0.5 0.6
Sres
s(M
Pa)
Strain
Stress Vs Strain
Fig.3. 10. Stress and Strain curve for Form Structure
Fig.3. 11. Imported Displacement Vs Force Data of Honeycomb Structure in LS-DYNA pre-post

38
For comparison of honeycomb and foam work peices out of different test the onces which were with
similar loading of forces were taken so that the results could be made comparable. It can be clearly
noted that when honeycomb structure was compressed till 24 mm out of its 40.3 mm depth in out of
plane behaviour it absorbed a energy of 61.3 Joules. The energy absorbed by the honeycomb of almost
same dimensions as of the foam was higher by a value of 13.3 Joules. Also,the honeycomb has lesser
time duration in which it takes up loads and absorb energy.This makes honeycomb more suitable for
our application as a more compact design would be able to absorb much more energy when compared
to foam.
3.3. High Impact Testing
The case in real would not be a simple compression when honeycomb compresses smootly and
absorbs energy rather it would be a case of high impact.So to test the properties of honeycomb in high
impact scenario a high speed penetration machine was used.The machine used for High impact testing
of honeycomb structure was Coesfeld – High Speed Drop Tower. The High-Speed Drop Tower frame
is made from a sturdy aluminium. The main components of the machine are as below-
Fig.3. 12. Energy vs Time for honeycomb.

39
Drop Tower
The drop tower has a total height of about 3440 mm. It is equipped with a POM-Zylinder over which
the drop frame with impactor is guided low friction. At the upper end of the drop tower, an electric
motor is arranged, which moves the skid via an inner belt within the drop tower. The position of the
carriage in the shaft is determined using an absolute encoder. As an acceleration unit, a pressure pot
is mounted below the electric motor, into which the skid with dart can engage. The pressure pot is
pressurized by the connected pressure vessel and thereby generates the acceleration for the dart. The
drop tower is tightly closed with an acrylic hood. The operator's side is locked with a locked acrylic
glass front door. The door state is monitored for reasons of operator safety. No case can be triggered
with a door open. Each skid movement is immediately interrupted when a door is opened.
Force Amplifier and Temperature Sensors
The machine has a force amplifier which is installed between the lower sample jaw and an adapter.
The force amplifier is connected to a measuring system using a cable with screw cap.
The machine also has 2 temperature sensors for sample and for chamber temperature respectively.
Clamping device
The workpieces can be clamped inside the machine but for low heights without additional compressed
air, it is possible to disable the clamping device manually.
Fig.3. 13. High Impact penetration machine.

40
Accessories
Different types of impactor tips (Ø 10 mm, Ø 15 m, Ø 20 mm) are included as accessories.
So,to use the honeycomb for energy absorbing application it should be used in a sandwich
configuration as when honeycomb is sandwiched between two plates the posibility of tearing of the
honeycomb units cells with each other would be really less.In sandwhich configuration of the
honeycomb structure still the failure would be mostly by buckling of the tubes of unit cells.The
honeycomb has significantly higher energy absorbing capacity when the failure of tubes happen only
by buckling of tubes.So for this reason it was decided to go with the honeycomb sandwich.There was
availability of the glass fibre in our university and two fiber sheet of glass fiber were fabricated. The
glass fiber sheets were bonded using epoxy resin and using epoxy resin the prepared glass fibre sheet
was bonded the honeycomb.The figure below shows the glass fibric and epoxy resin being applied to
honeycomb and glass fiber.
The impact testing machine consist of a penetrator which comes from a height by the input velocity
provided by us. The speed is controlled using hydraulic pressure which helps to accelerate the
penetrator by the speed provided by us. The penetrator consists of 5.3 kg weight and diameter of the
penetrator 20 mm. The speed of the penetrator was set to 11.238 m/s. In this case the dimension of
the workpiece was 60*50*40.6 mm and a very thin layer of glass fibre of 2 mm was used so that the
bigger part of the structure can be impacted by the penetrator as size of the penetrator was limited to
Fig.3. 14. Fabrication of Honeycomb with glass fibre.

41
20 mm only. If honeycomb is used without sandwich of glass fibre, they may deform only a small
area around its area, and it may also lead to just braking up of bonds of cell wall with neighbouring
cell wall. That’s also one of the reasons why honeycomb when used for energy absorption application
are always used as sandwich panels so that they can absorb much higher energies. The figure below
shows the mounted honeycomb workpiece on the drop tower machine for high penetration test.
The impactor of 20 mm diameter impacted on the honeycomb structure almost at the centre and the
structure looks to be deformed in a v shape as the area of the impactor was limited. The deformation
occurred mostly in the region which was closer to the impactor. When looked closely the deformation
in this case also occurred by buckling of tubes.
Fig.3. 15. Test work honeycomb workpiece before Test.

42
The energy vs displacement, energy vs time, Force vs time and force vs displacement graphs were
obtained as the results of the output from the high impact penetration machine. The energy absorbed
by the honeycomb structure was 340 joules. The energy Vs Displacement gap concludes that 340
joules energy was absorbed by displacement of 53 mm of the structure.
Fig.3. 16. The Deformed Workpiece after Test
Fig.3. 17. Energy Vs Displacement graph for Sandwich honeycomb in high penetation test.

43
The Energy Vs Time graph concludes that 340 joules of energy was absorbed by the structure in 8.9
milli-seconds. And Energy Vs Time graph is given below.
It can be clearly commented from our Force vs displacement graph that our structure of honeycomb
takes a force of maximum 16.2 kN by getting displaced by 53 mm.
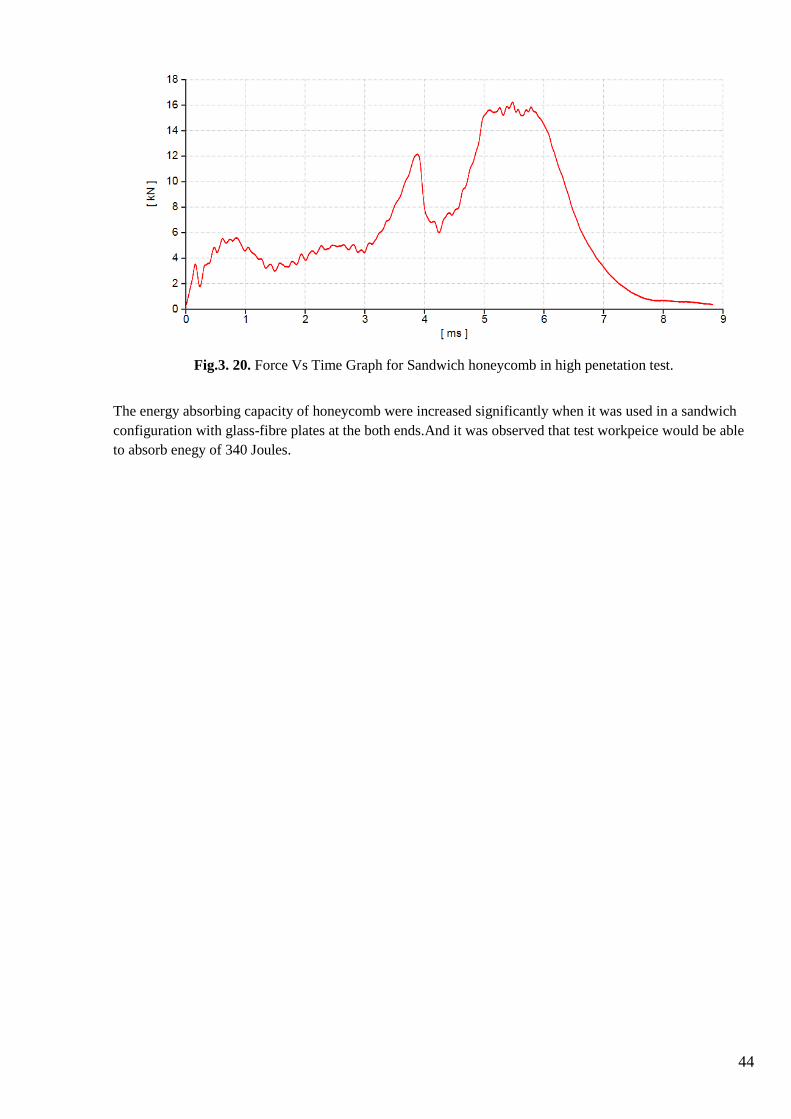
It can be said from force vs time graph that our honeycomb structure takes up a load of 16.2 kN in
8.9 milli seconds.
Fig.3. 18. Energy Vs Time Graph for Sandwich honeycomb in high penetation test.
Fig.3 .19. Force Vs Displacement Graph for Sandwich honeycomb in high penetation test.
44
The energy absorbing capacity of honeycomb were increased significantly when it was used in a sandwich
configuration with glass-fibre plates at the both ends.And it was observed that test workpeice would be able
to absorb enegy of 340 Joules.
Fig.3. 20. Force Vs Time Graph for Sandwich honeycomb in high penetation test.
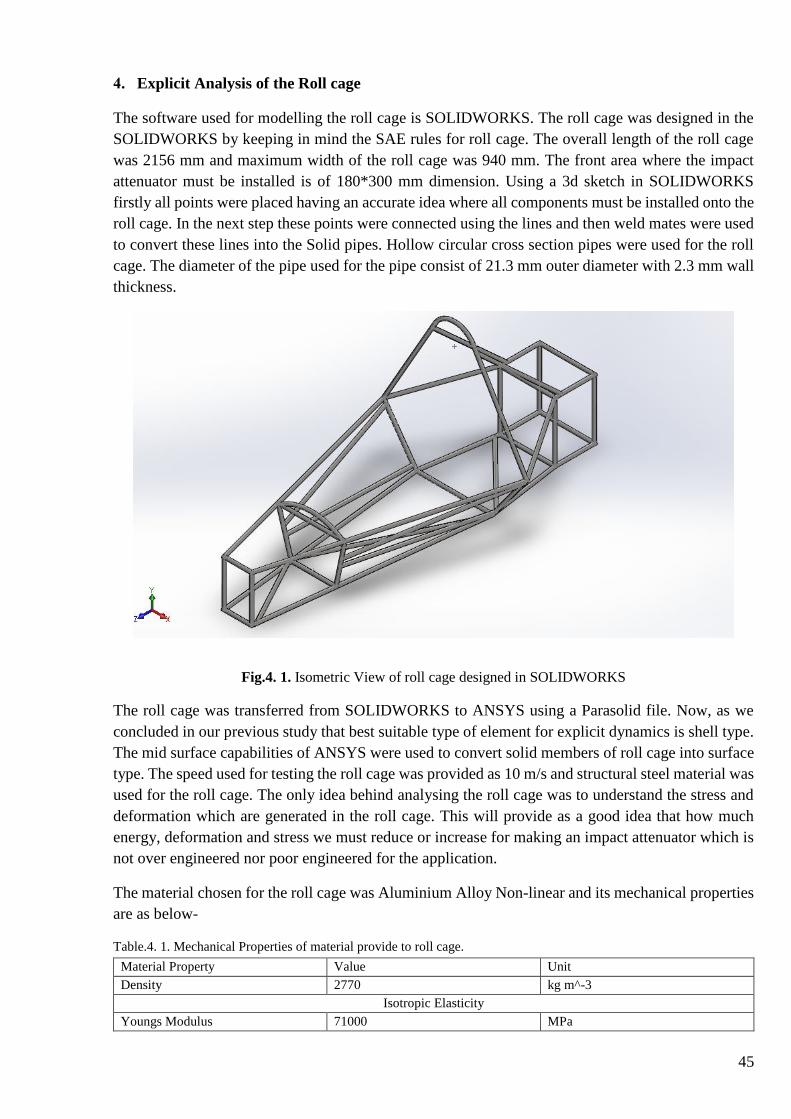
45
4. Explicit Analysis of the Roll cage
The software used for modelling the roll cage is SOLIDWORKS. The roll cage was designed in the
SOLIDWORKS by keeping in mind the SAE rules for roll cage. The overall length of the roll cage
was 2156 mm and maximum width of the roll cage was 940 mm. The front area where the impact
attenuator must be installed is of 180*300 mm dimension. Using a 3d sketch in SOLIDWORKS
firstly all points were placed having an accurate idea where all components must be installed onto the
roll cage. In the next step these points were connected using the lines and then weld mates were used
to convert these lines into the Solid pipes. Hollow circular cross section pipes were used for the roll
cage. The diameter of the pipe used for the pipe consist of 21.3 mm outer diameter with 2.3 mm wall
thickness.
The roll cage was transferred from SOLIDWORKS to ANSYS using a Parasolid file. Now, as we
concluded in our previous study that best suitable type of element for explicit dynamics is shell type.
The mid surface capabilities of ANSYS were used to convert solid members of roll cage into surface
type. The speed used for testing the roll cage was provided as 10 m/s and structural steel material was
used for the roll cage. The only idea behind analysing the roll cage was to understand the stress and
deformation which are generated in the roll cage. This will provide as a good idea that how much
energy, deformation and stress we must reduce or increase for making an impact attenuator which is
not over engineered nor poor engineered for the application.
The material chosen for the roll cage was Aluminium Alloy Non-linear and its mechanical properties
are as below-
Table.4. 1. Mechanical Properties of material provide to roll cage.
Material Property Value Unit
Density 2770 kg m^-3
Isotropic Elasticity
Youngs Modulus 71000 MPa
Fig.4. 1. Isometric View of roll cage designed in SOLIDWORKS

46
Poisson’s Ratio 0.33
Bulk Modulus 69608 MPa
Shear Modulus 26692 MPa
Bilinear Isotropic Hardening
Yield Strength 280 MPa
Tangent Modulus 500 MPa
The meshing plays a very significant role in explicit dynamics and its refinement has effects of
contact, hour glass energy. So, the mesh was refined using body sizing capabilities of ANSYS. A
patch independent mesh was also used for meshing so that it would not update mesh every time when
we make changes to boundary conditions. The total nodes and elements in the meshing were 129250,
376463 respectively.
A bonded connection was defined between all the members of the roll cage and the velocity of 10
m/s was applied to the whole roll cage in the positive z direction of the coordinate system. The roll
cage consist of 47 members and body interaction was applied between the roll cage and the rigid wall.
The velocity was defined using the components which was using global coordinates.
Fig.4. 2. Meshed roll cage with a rigid wall in ANSYS
Fig.4. 3. Velocity applied to roll cage in the z direction.

47
The wall was fixed from its rear end by applying fixture to it. And face selection filter was used to
fix the wall. The Fixed boundary condition fix all the rotation and translation degree of freedom of
the wall.
Most of the higher stresses which occurred were in the frontal part of the roll cage and the maximum
of value of Von-Mises stress was 840.41 MPa. This maximum stress was in the lower bracing member
of roll cage in the front.
Fig.4. 4. Rigid wall provided with fixed geometry.
Fig.4. 5. Equivalent Elastic Strains in the roll cage.

48
The possible changes in the design of the roll cage to reduce the stresses would be to either chose
different material for roll cage ,increase cross-section of pipe used for roll cage , increase the wall
thickness of the pipes used for the roll cage or to add more bracings members to the roll cage .By
varying all these parameters the roll cage can be made more safer but as consequences the weight of
the roll cage will increase or by using an expensive material the cost of the roll cage will increase.
And even the by varying all these parameters there would not be significant reduction in the
deacceleration of the roll cage will the case of crash. A good practice will be to put the cellular
material like honeycomb which can absorb most of the energy that will be generated during the
collision scenario and it will also help in to reduce the deacceleration of the vehicle while in the
collision scenario.
Fig.4. 6. Equivalent stress in the roll cage.

49
5. Design and Analysis of the Impact attenuator
5.1. Finite Element Analysis of Scaled Model Honeycomb Sandwich
To model the honeycomb by exact dimension and then simulate it on FEM software is really a time-
consuming process. The more efficient way thought was to just model block of same dimension as in
the compression test and then apply properties to the material model which were obtained from
compression test. So, in this way the model was made in SOLIDWORKS of dimensions 90*60*40.3
mm with 2 plates on each side of 1 mm each. The Penetrator was modelled as a cylinder of 20 mm
diameter. Sandwich block and penetrator were assembled in SOLIDWORKS with face mating. The
file of modelled design was transferred from SOLIDWORKS to ANSYS using Parasolid format. In
the Engineering Data of the ANSYS the general material model was taken, and it was given the
Multilinear Isotropic Hardening. In multilinear isotropic Hardening the stress and strain curve
generated in our compression test was provided. The figure-5 shows the imported model in the
ANSYS.
Using the SpaceClaim the capabilities the shared mesh topology was used. The fine mesh was used
to get the more précised results. The mesh consists of 55365 nodes and 5021 elements.
Fig.5. 1.Modelled Honeycomb structure with penetrator in ANSYS.
Fig.5. 2. Meshed Honeycomb structure with penetrator.

50
The penetrator was provided with a mass of 5.5 Kg as it was in the high impact test. By varying the
density in the material model of the penetrator this mass for penetrator was achieved. The penetrator
was applied a velocity using component definition in global coordinate system. The applied velocity
on the penetrator in the negative Z direction was 11.5 m/s. And figure by 5.2 Shows the applied
velocity on the penetrator.
The fixture was applied at the rear plate of the sandwich honeycomb model and using face selection
tool the fixture was applied. The fixed boundary condition made all translation and rotational degree
of freedom to zero.
The structure deformed in the exactly same manner as it deformed in the high penetration testing
experiments.The maximum deformation that occurred in the structure was 40.059 mm and the
structure deformed exactly in the same manner as it deformed in the high penetration test
Fig.5. 3. Velocity applied to penetrator in z direction.
Fig.5. 4. Fixture applied at rear plate of Honeycomb Sandwich

51
The maximum of the Von-mises stresses occurred at the centre of the structure where the penetrator
made the strike . The value of the maximum Von-mises stresses was 0.84 MPa.
The most important parameter which we are interested in is the energy which the structure would be
able to absorb and from the energy conservation we can conclude that the structure would be able
absorb atleast 300 Joules of energy.This value is similar to the energy value which we got in the high
penetration test in real time. In the high penetration test experiment the structure absorbed an energy
of 340 Joules.The figure below shows the energy summary of the model in ANSYS.
Fig.5. 5. Deformation in the Modelled Honeycomb structure.
Fig.5. 6. Von mises stresses in the modelled honeycomb structure.

52
Fig.5. 7. Energy Summary of the Honeycomb model in ANSYS.

53
5.2. Finite Element Analysis of Full Scaled Model
A 3 layer honeycomb Impact attenuator was Designed in SOLIDWORKS. The first layer sandwich
consist of 180*300*50 mm dimensions. It is also supported by 1 mm thickness plates on both sides.
The 2nd layer consist of dimensions 120*160*50 mm and similar 1 mm plates on both sides and 3rd
layer consist of 80*80*50mm with 1 mm thickness plates on both sides. It was assembled with a
modeled wall of dimension 500*500*50 mm using SOLIDWORKS assembly capabilities.
Now this assembled model was imported to ANSYS using a Parasolid file and same material model
which we developed for our last scaled model was applied to the honeycomb composite. And a non-
linear Concrete material model was applied to wall. The concrete material model is available as
default material in engineering data of ANSYS. The effect of mass roll cage was applied by providing
the mass of 300 kg to the most rear plate of the honeycomb structure from where it will be mounted
on to the roll cage.
Fig.5. 8. Assembled 3 Layer honeycomb Structure with a wall in SOLIDWORKS.
Fig.5. 9. Imported Honeycomb structure with wall and plate on which roll cage mass is applied.

54
To get more accurate and précised results the fine mesh was generated. The more quality of mesh
would help us to reduce errors from contact energy and hour glass energy losses.
The rear end of the wall was fixed using the face selection tool. The rear plate of the honeycomb
was provided with a velocity of 11.5 m/s in z-direction. The velocity was provided using
component definition and the whole structure was compressed by a total deformation of 11.736
mm.
(a) (b)
Fig.5. 10. Meshed Honeycomb Model with wall in ANSYS.
Fig.5. 11. (a)Fixed condition applied to the rear face of wall (b) velocity on the rear plate of honeycomb.

55
Fig.5. 12. Total deformation in the honeycomb structure.
The most use full result we are interested in is energy absorbed by the honeycomb structure. From
the energy summary we can conclude that our structure would be able to take up energies up to 8000
Joules atleast. There were less energy losses due to hourglass and contact as the material model used
by us was highly non-linear and larger number contacts between 6 plates and 3 honeycomb structure.
Fig.5. 13. Energy summary of the Full-scaled model of Impact attenuator.

56
6. Application of the Impact Attenuator
The figures below show that how the impact attenuator would be mounted on the roll cage and how
would the overall aesthetics of the vehicle would look like. The impact attenuator can easy be
integrated into the surface of the vehicle which would not result into any shape that may lead to
inappropriate aerodynamic shape. As if a student formula vehicle has poor aerodynamics at the front
end of the vehicle it will lead to poor performance at the track.
The figure below shows the assembled CAD model of the roll cage with the designed Impact
attenuator in the front view.
Fig.6. 1. Isometric view of the Impact attenuator with roll cage.
Fig.6. 2. Frontview of the Impact attenuator with roll cage.

57
The figure below shows the assembled CAD model of the roll cage with the designed Impact
attenuator in the side view.
Fig.6. 3. Side view of the Impact attenuator with roll cage.
58
Conclusion
1. It can be concluded from compression testing of Foam that when a foam test piece of
dimension 50*60*40.6 was compressed till 20 mm it absorbed an energy of 48 Joules. Also,
when same size of the honeycomb specimen was compressed it absorbed an energy of 61.3
Joules. This comparison makes the honeycomb more suitable for our energy absorbing
application.
2. When a sandwich panel of honeycomb with glass fibre with dimensions of honeycomb as
90*60*40.3 mm and 1 mm glass fibre thickness was impacted with a velocity of 11.5 m/s in
the impact testing machine it absorbed an energy of 340 Joules.
3. The front Impact analysis of the roll cage concluded that there were high stresses in the front
part of the roll cage. These stresses can be reduced by varying more stronger material,
increasing the thickness of the me members of roll cage or by adding more bracing to the roll
cage. But all these approaches will increase an enough weight to the roll cage and instead of
it the impact attenuator can be installed on it to keep the roll cage safer in the crash scenario.
4. From FEM model of the Honeycomb almost similar results were obtained which matches with
the experimental results and little deviation occured due to higly non-linear material properties
of honeycomb and some assumptions which made during FEM setup of model.
5. The Full scaled model developed by us would be able to absorb energy up to 8000 Joules
atleast. And by this way we can significantly reduce the damage that could occur to roll cage
and occupant of the vehicle by a sufficient extend.

59
List of references
1. Gibson, L. J., and M. F. Ashby,Cellular Solids: Structure and Properties. 2nd ed. Cambridge
University Press, 1997. ISBN: 9780521495608.
2. Gibson, L. J., M. F. Ashby, and B. A. Harley. Cellular Materials in Nature and Medicine.
Cambridge University Press, 2010. ISBN: 9780521195447.
3. Lorna Gibson. Cellular Solids: Structure, Properties and Applications.MITopen
courseware(https://ocw.mit.edu/courses/materials-science-and-engineering/3-054-cellular-
solids-structure-properties-and-applications-spring-2015/).
4. Wierzbicki T, Abramowizc W,On the crashing mechanics of thinwalled structures. J Appl
Mech 1983;50:727–39.
5. Wang Z, Tian H, Lu Z, et al. Mechanics of Advanced Materials and Structures, online, 2015.
6. Wang Z, Tian H, Lu Z, et al. Composites Part B: Engineering, 2014, 56: 1-8.
7. Abramowizc W, Jones N. Dynamic axial crashing of square tubes. Int J Impact Eng
1984;2:263–81.
8. Zhonggang,WANG , Yiben ZHANG, Jiefu LIU: “Comparison between five typical
reinforced honeycomb structures”, 5th International Conference on Advanced Engineering
Materials and Technology (AEMT 2015).
9. Jochen Pflug, Ignaas Verpoest , Dirk Vandepitte. FOLDED HONEYCOMBS Fast and
continuous production of the core and a reliable core-skin bond. Leuven, Celestijnenlaan 300
B, 3001 Leuven, Belgium.
10. Lecture notes.Automotive Engineering 1.KIT germany.
11. Abramowizc W, Jones N. Dynamic axial crashing of square tubes. IntJ Impact Eng
1984;2:263–81.
12. Abrahamson Chad, Bruns Bill, Hammond Joseph & Lutter Josh (2010). “Formula SAE
Impact Attenuator Testing,” pp. 35-46.
13. Kumar Devender and Khanna Naman, “Drop Test Analysis of Impact Attenuator for Formula
SAE Car,” International Journal of Scientific and Research Publications, Vol. 02 (10), pp.
01-04, 2012.
14. Singhal Arpit and Subramanium S. Vignesh, “Cost Effective & Innovative Impact Attenuator
for Formula SAE Car with Drop Test Analysis,” International Journal of Scientific and
Research Publications, Vol. 03 (03), pp. 01-04, 2013.
15. Sengupta Akash, Sharma Apurba Sharma and Chakraborty Amritabha, “Manufacturing an
Impact Attenuator for Formula Prototype Cars,” IPASJ International Journal of Mechanical
Engineering, Vol. 02 (11), pp. 11-13, 2014.
16. M.T.J.Fonteyn, Dr. Ir. Witteman, “Formula Student Racing Team Eindhoven- Crash Safety”,
MT06.10, Eindhoven, 2006.
17. Ayush Anand. Explicit dynamic analysis of the roll cage using rigid element.Altair
Technology conference.
18. T. D. Williams, A. Pennington and D. C. Barton, “The frontal impact response of a space
frame chassis sports car,” Proceedings of the Institution of Mechanical Engineers, Journal of
Automobile,Engineering UK: University of Leeds, Vol. 214, pp. 865-873, 2000.
19. H. Zarei and M. Kroger, “Optimum honeycomb filled crash absorber design,” Germany:
University of Hannover, Materials & Design, pp. 193-204, 2006.

60
20. E. Hiroshi, M Yusuke, M Hiroshi, H. Eiji, K Satoshi, Y Koetsu and U Naoki, “Development
of CFRP Monocoque Front Impact Attenuator for FSAE with VaRTM,” SAE Technical Paper
Kanazawa, University, KADO Corporation, pp. 01-08, 2007.
21. Belingardi Giovanni and Obradovic Jovan, “Design of the Impact Attenuator for a Formula
Student Racing Car,” Journal of the Serbian Society for Computational Mechanics, Vol. 4
(01), pp. 52-65, 2010.
22. Velea N. Marian and Lache Simona, “NOVEL IMPACT ATTENUATOR” 5Th International
Conference Computational Mechanics and Virtual Engineering, COMEC 2013, Brasov,
Romania, pp. 47-51, 2013.
23. Altair university” Introduction to Explicit Analysis using RADIOSS” Revised Edition:
10/2017.