analysis of international epc projects using scor model
TRANSCRIPT

James Madison UniversityJMU Scholarly Commons
Masters Theses The Graduate School
Spring 2013
Analysis of international EPC projects using SCORmodel, MoneteCarlito simulation, and relationshipmanagementXiaopeng LiangJames Madison University
Follow this and additional works at: https://commons.lib.jmu.edu/master201019Part of the Operations and Supply Chain Management Commons
This Thesis is brought to you for free and open access by the The Graduate School at JMU Scholarly Commons. It has been accepted for inclusion inMasters Theses by an authorized administrator of JMU Scholarly Commons. For more information, please contact [email protected].
Recommended CitationLiang, Xiaopeng, "Analysis of international EPC projects using SCOR model, MoneteCarlito simulation, and relationshipmanagement" (2013). Masters Theses. 261.https://commons.lib.jmu.edu/master201019/261

Analysis of International EPC Projects Using SCOR Model,
MonteCarlito Simulation, and Relationship Management
Xiaopeng Liang
A thesis submitted to the Graduate Faculty of
JAMES MADISON UNIVERSITY
In
Partial Fulfillment of the Requirements
for the degree of
Master of Science
Integrated Science and Technology
May 2013

ii
Acknowledgments
This thesis would not have been possible without the love, support, and encouragement I
received from my wife and parents. Only now am I beginning to realize how much my wife and parents
sacrificed so that I could study in the Unites States.
I have benefited greatly from the mentoring of Dr. Abdelrahman Rabie and encouragement
received from Dr. Okechi Egekwu and Dr. Anthony Teate. I would not have been able to complete the
thesis without the frank advice and sincere guidance from these three professors. I want to especially
thank Dr. Abdelrahman Rabie, who advised, developed, and reviewed the thesis step by step. I am truly
indebted to him for fostering the aspiring spirit in me and, of course, for his assistance and advice
during the period as his student.
I am very grateful to my previous colleagues in China who provided me with important
information and data, which has been very helpful to me in accomplishing the thesis.

iii
Table of Contents
Acknowledgments ........................................................................................................................................... ii
List of Tables .................................................................................................................................................. v
List of Figures ............................................................................................................................................... vi
Abstract ........................................................................................................................................................viii
I. Chapter One Introduction .................................................................................................................. 1
II. Chapter Two Literature Review :EPC Projects ................................................................................. 8
2.1 Procurement Process in International EPC projects .................................................................... 8
2.2 The SCOR Models .................................................................................................................... 11
2.3 Framework of Supply Chain Model .......................................................................................... 13
2.4 Products..................................................................................................................................... 14
2.5 Inventory Cost ........................................................................................................................... 15
2.6 Supply Chain Simulation .......................................................................................................... 16
2.7 Relationship Management ......................................................................................................... 18
III. Chapter Three Case Study: Cement Factory ................................................................................... 21
3.1 General Description .................................................................................................................. 21
3.2 SCOR Model Analysis .............................................................................................................. 26
3.2.1 Steel bar ................................................................................................................... 27
3.2.1.1 SCOR model configuration. ......................................................................... 28
3.2.1.2 Inventory types and costs ............................................................................. 32
3.2.1.2.1 Inventory 1 .................................................................................... 32
3.2.1.2.2 Inventory 2 .................................................................................... 33
3.2.1.2.3 Inventory 3 .................................................................................... 33
3.2.1.2.4 Inventory 4 .................................................................................... 35
3.2.2 Precast steel structure .............................................................................................. 36
3.2.2.1 SCOR model configuration. ......................................................................... 38
3.2.2.2 Inventory types and costs ............................................................................. 41
3.2.2.2.1 Inventory 1 .................................................................................... 41
3.2.2.2.2 Inventory 4 .................................................................................... 42
3.2.3 Vertical mill ............................................................................................................. 43
3.2.3.1 SCOR model configuration. ......................................................................... 45
3.2.3.2 Inventory types and costs ............................................................................. 47
3.2.3.2.1 Inventory 3 .................................................................................... 47
3.2.3.2.2 Inventory 4 .................................................................................... 48
3.2.4 Contribution of the SCOR models ........................................................................... 48
3.3 MonteCarlito Simulation Analysis ............................................................................................ 50
3.3.1 Introduction ............................................................................................................. 50
3.3.2 Simulation model ..................................................................................................... 51
3.3.3 Purpose of the simulation ........................................................................................ 54
3.3.4 Variables and parameters of the inputs .................................................................... 54
3.3.5 Transitional outputs and the inventory cost decision rules ...................................... 58
3.3.6 Simulation data and results ...................................................................................... 59
3.3.7 Discussion of results ................................................................................................ 61
3.3.8 Sensitivity analysis ................................................................................................. 63
3.3.8.1 T1duration ................................................................................................... 64
3.3.8.2 T2duration ................................................................................................... 64
3.3.8.3 T3duration ................................................................................................... 65
3.3.8.4 Common characteristics ............................................................................... 68
3.3.8.5 Specific characteristics ................................................................................ 69
3.4 Relationship Management Analysis .......................................................................................... 70
3.4.1 Introduction ............................................................................................................. 70
3.4.2 Relationship management framework ..................................................................... 72
3.4.2.1 Trust ............................................................................................................. 73
iv
3.4.2.2 Collaboration ............................................................................................... 74
3.4.2.3 Communication ........................................................................................... 74
3.4.2.4 Problem solving ........................................................................................... 75
3.4.3 Interview method ..................................................................................................... 76
3.4.3.1 Interview questions ...................................................................................... 76
3.4.3.2 Interviewee .................................................................................................. 76
3.4.3.3 Interview results .......................................................................................... 77
3.4.4 Suggestions to improve the relationships with suppliers ......................................... 79
3.4.4.1 Trust ............................................................................................................. 79
3.4.4.2 Collaboration ............................................................................................... 79
3.4.4.3 Communication ........................................................................................... 80
3.4.4.3 Problem solving ........................................................................................... 80
IV. Chapter Four Conclusion ................................................................................................................ 82
V. References ....................................................................................................................................... 85

v
List of Tables
Table 1. Company codes and main work for each stakeholder ..................................................................... 22
Table 2. Description of work schedule and companies that did each sub-work ............................................ 24
Table 3. Description of work for SCOR model level 1 for steel bar ............................................................. 29
Table 4. Factors influencing the inventory cost of steel bar in the location of Inventory 2 .......................... 34
Table 5. Factors influencing the inventory cost of steel bar in the location of Inventory 3 .......................... 35
Table 6. Factors influencing the inventory cost of precast steel structure in the location of Inventory 1 ..... 42
Table 7. Inventory cost at different locations: planned cost at the beginning (P1),
planned cost during operation (P2), and actual cost (C) ................................................................. 51
Table 8. Starting delivery date and delivery time (in days) for the 11 batches of precast steel structure. ..... 53
Table 9. Actual civil construction finishing time of the RMGEGT workshop in 15 cement projects ........... 57
Table 10. Description list of the variables and parameters ............................................................................ 58
Table 11. The scenario and its draft description of the T1duration, T2duration, and T3duration ................. 64

vi
List of Figures
Figure 1. Framework to set up construction supply chain model .................................................................. 14
Figure 2. Cement plant workshops, arrows indicate material flow. .............................................................. 23
Figure 3. List and Gantt chart of sub-works in RMGEGT ............................................................................ 23
Figure 4. Stakeholders in the cement plant model RMGEGT ....................................................................... 26
Figure 5. Procurement process of steel bar .................................................................................................... 28
Figure 6. SCOR model level 1 for steel bar .................................................................................................. 29
Figure 7. SCOR model level 2 for steel bar .................................................................................................. 30
Figure 8. SCOR model level 3 for steel bar .................................................................................................. 31
Figure 9. Procurement process of precast steel structure............................................................................... 38
Figure 10. SCOR model level 1 for precast steel structure ........................................................................... 39
Figure 11. SCOR model level 2 for precast steel structure ........................................................................... 39
Figure 12. SCOR model level 3 for precast steel structure ........................................................................... 40
Figure 13. Procurement process of vertical mill ............................................................................................ 44
Figure 14. SCOR model level 1 for vertical mill........................................................................................... 45
Figure 15. SCOR model level 2 for vertical mill........................................................................................... 45
Figure 16. SCOR model level 3 for vertical mill........................................................................................... 46
Figure 17. The logical diagram of precast steel structure supply chain used for simulation ......................... 52
Figure 18. Framework of the simulation model used to describe the input, transitional outputs,
and output, as well as their relationships ...................................................................................... 55
Figure 19. Data and results of simulation ...................................................................................................... 60

vii
Figure 20. Simulation results of four performance measures of average waiting time in the
f actory silo, average waiting time in the site silo, average total inventory cost
(avg TIC) and probability of the inventory cost higher than 4,800 USD (Prob>4800) ................ 61
Figure 21. The result of the mean of the total inventory cost from the 27 plans ........................................... 66
Figure 22. Effect of delivery time on total inventory cost (for T1duration between -20 and 58) .................. 67
Figure 23. Effect of delivery time on total inventory cost (for T1duration between -20 and 0) .................... 67
Figure 24. Effect of delivery time on total inventory cost (for T1duration between 10 and 30) ................... 67
Figure 25. Effect of construction time on total inventory cost (for T1duration between 10 and 30) ............ 69
Figure 26. The framework of relationship management research. Trust, Collaboration,
Communication, and Problem solving under the supplier’s management are
used to study for improving relationship with supplier based on the case ................................... 73
Figure 27. Interview questions and results of relationship management research on Trust,
Collaboration, Communication, and Problem solving .................................................................. 78

viii
Abstract
The EPC contracting mode (Engineering, Procurement and Construction) has been broadly
applied in construction projects, particularly, at the international level. However, the procurement
process has been scarcely in literature. The purpose of this thesis is to research the procurement
processes of different types of products—ETO (Engineer to order), MTO (Make to order), and MTS
(make to stock)—in supply chain for a real international EPC cement project in Ethiopia. The
procurement processes of steel bar (MTS), precast steel structure (MTO), and vertical mill (ETO) for
the “Raw Meal Grinding and Exhaust Gas Treat,” one of the cement plant workshops, have been
analyzed as a case study. Three levels’ of SCOR models (Supply Chain Operation References) for the
three products are established; the inventory costs were selected as the performance measure for the
supply chain. The SCOR models helped in finding the locations where the inventory costs were
incurred, and helped in identifying the factors that may influence the inventory cost. In addition, based
on the SCOR models, a basic simulation model has been set up, MonteCarlito simulation, and was
applied to the precast steel structure based on the inventory cost. A sensitivity analysis was conducted
to evaluate the impacts of the pre-delivery waiting time, the delivery time, and the construction time on
the total inventory cost. The results revealed that the construction time has the highest impact.
Moreover, high inventory cost resulted from poor management relationship with the import agent
company. Four key elements were identified which leading to such a relationship: trust, collaboration
communication, and problem solving. A questionnaire about these four key elements was developed
and responses analyzed (38 responses). Ten suggestions were made to improve the relationship
management with suppliers.

Chapter One
Introduction
The EPC (Engineer, Procurement and Construction) contract mode is broadly applied to
international construction projects. Under the traditional contract model, the owner takes the design and
procurement works and selects a contractor to execute the construction work; whereas the main
contractor under the EPC contracting mode, particularly at the international level, will be responsible
for engineering, procurement and construction activities. Due to such a large amount of work, the main
contractor has to interconnect sub-contractors, financial commitment, time-based procedures and
enough resources as well (Yeo & Ning, 2002).
Procurement is considered as the most critical work in international EPC projects because of its
high cost, complex delivery and multiple products (Azambuja & Formoso, 2003). In all of the
international EPC projects that the author experienced, the procurement cost for main production plants
with matched mechanical and electrical equipment takes up almost 50% of the total cost. Besides, the
procurement process commonly contains global transportation with at least an export port and import
port. The complicated custom clearance documents and unsure shipment time make it difficult to
ensure the time of entering site. The poor road conditions sometimes also result in the damage of
products during the land transportation. Meanwhile, there are so many kinds of products to buy in an
international EPC project, especially in the industry projects that contain many production plants and
matched electrical and mechanical equipment. Previous literatures classify the products into different
categories. Elfving (2003) and Arbulu, Koerckel, and Espana (2005) described the characteristics of
four general types of construction products: ETO (engineer to order), MTO (make to order), and MTS
(make to stock). Cheng, Law, Bjornsson, Jones, and Sriram, (2010) represented the products from three
2
different types: stocked standard products, configurable products and custom products. Due to such
kinds of products, multiple suppliers are involved in the complicated global procurement processes.
In order to overcome the challenges of organizing and managing the procurement process
discussed above, some main contractors prefer to apply conventional procurement strategies to let
materials and equipment enter into a project site earlier and stock them to avoid suspension and delay,
but it increases the cost of reallocation, inventory, nature loss and depreciation. So looking for an
effective method, which not only drives the required products to enter project sites on time, but also
decreases the inventory cost during the procurement process, is very valuable to project management.
For this reason, this thesis focuses on optimizing the inventory cost through applying construction
supply chain management theory, which has been comprehensively researched and strongly proved to
be an effective method in the past few years.
In general, research on the construction supply chain is relatively new. It only dates from the
1990s when it became a specific area (London & Kenley, 2001). Construction supply chain
management (CSCM) is an emerging area of practice. It is inspired by but differs substantially from
manufacturing supply chain management (MSCM). MSCM focuses on modeling volume production,
whereas CSCM is more concerned with the coordination and operation of the discrete products
delivered to specific construction projects (Vaidyanathan & O’Brien, 2003). The plan, organization,
sourcing and delivery of products are becoming increasingly complex across the global construction
industry. In order to organize the complicated procurement process and drive the construction supply
chain to be effective, setting up a construction supply chain model is very necessary. The model
describes the whole procurement process of one kind of specific product and concentrates on
decreasing inventory cost based on a real international EPC cement plant construction project in Africa.

3
One framework of setting up a construction supply chain model was presented in Construction
Supply Chain Management Handbook (O’Brien, Formoso, Vrijhoef & London, 2009). The framework
includes five steps and emphasizes the first step to establish the purpose of the model. There are a
number of comprehensive purposes that have been modeled in previous literature, including reducing
lead time, evaluating buffering decision and so on. Among all the purposes discussed before, cost
problems always played a critical role, so researchers have paid them more attention. The International
Group for Lean Construction (IGLC) has invited international researchers to develop models for supply
chain cost, which include purchasing cost, production cost, inventory cost and transportation cost.
Azambuja and O’Brien (2007) divided cost into inventory costs, process costs, transportation costs,
ordering costs, and cost of resources when they aimed to assess construction supply chain cost by
setting up a model.
This thesis focuses on inventory cost because it has been verified as the critical element to the
project cost control by previous research, such as inventory management using the just-in-time theory
(Baladhandayutham & Venkatesh, 2012), material delivery management using transparency of material
availability and short response times in the supply chain (Ala-Risku & Mikko, 2006) and procurement
process analysis using an optimized construction supply chain model (Pan, Lee, & Chen, 2011). But
most of the literature that concentrated on the inventory cost analysis in construction project only
discussed the inventory management to construction material, such as steel bar belonging to MTS, but
did not pay more attention to other kinds of products, such as products of MTO or ETO. In practice, the
cost for procuring products of MTO and ETO for construction is more than construction materials,
especially in some industry projects (CNBM, 2007). Therefore, except for discussing construction
materials, this thesis also researches the procurement process and inventory cost of ETO and MTO

4
products.
Unlike other previous literature concentrating on only native construction projects, such as
inventory cost analysis in Indonesia (Abduh, Soemardi, & Wirahadikusumah, 2012), this thesis pays
attention to the construction supply chain from the international perspective and focuses on the whole
inventory cost during the integrated global transportation. In order to fulfill the purpose of setting up an
international construction supply chain to optimize inventory cost for procurement processes, some
factors involved in the supply chain should be identified first. These factors are described generally as
follows:
Products—Previous literature always chooses one of the three products as the main topic in
discussing its procurement process. Construction Supply Chain Management Handbook also explained
how to confirm a type of product in the second step of establishing a construction supply chain model
(O’Brien et al., 2009). In order to display the overall procurement process in international EPC projects,
this thesis focuses on three kinds of products including MTS, MTO and ETO products, which were
discussed by Cheng et al. (2010) for analyzing their inventory costs.
Locations—In international EPC projects, inventory cost is not only the stock fee in the project
site; it also involves the predicted and unpredicted cost happening in suppliers’ storehouses,
warehouses in the export port and warehouses in the import port. Except for these four locations that
result in direct inventory cost, the main contractor headquarters is another location where the
procurement plan and delivery document are established. The work done in the main contractor
headquarters will influence the delivery time and lead to indirect inventory cost. So this thesis
identifies five locations where inventory cost happens: suppliers’ storehouses, export port warehouses,
import port warehouses, project site storehouses and the main contractor headquarters.

5
Stakeholders—Based on different products, the specific stakeholders may be different. For
example, the supplier for MTS should be a production factory, while the supplier for ETO should be a
manufacturer with design capability. This thesis generally identifies five stakeholders responding to
five locations: the product suppliers, the export and shipment agent at the export port, the import and
transportation agent at the import port, the main contractor at the project site and the main contractor in
charge of procurement in the headquarters. The specific stakeholders will be explained when discussing
the specific product’s procurement process.
Operations—It is identified as the actions done by each stakeholder in each location in the
procurement process of one product. They are the main elements influencing inventory cost in the
international construction supply chain. The specific operations will be classified into four general
categories referenced by the Supply Chain Operations Reference (SCOR) model developed by the
Supply Chain Council (SCC) for standardization, measurement and improvement: plan, source, make
and delivery (Supply Chain Council, 2008). The more critical and detail operations are described in
Level 3 of the SCOR model, which identify the correlations among each operation and draws out the
factors influencing inventory cost.
The construction supply chain model for the products procurement processes is created associated
with the SCOR model and based on a real international EPC cement project experienced by the author
in Ethiopia, Africa. Some key factors increasing the inventory cost are learned through practice. In this
case, three kinds of products in the raw material grinding workshop are chosen as the analyzing objects.
They are steel bar as MTS, precast steel structure as MTO and vertical mill as ETO. The steel bar and
the precast steel structure were produced in China, while the vertical mill was produced by a Germany
company. They were all delivered to the project site through shipment as the planned schedule.

6
The specific data exposed described by the cast study draws out three main problems that caused
overspending of inventory cost: transaction constraints, unsuitable adjusting of delivery plan and poor
relationship between main contractor and suppliers. Based on the established SCOR models of
construction supply chain, the first problem can be resolved through analyzing the flexible transaction
methods and the information flows. Through drawing out the SCOR models, the events of influencing
the inventory cost are very clear to be found. According to the events’ specifics, the constraints of
transacting the events can be discovered. This thesis analyzes the constraints and issues some advices
about how to make transaction more flexible, such as multiple choices to the suppliers and not
submitting the cargo documents too early. The SCOR models also provide the information flows,
which make the communication and information more visible. It benefits to decrease or remove the
transaction constraints.
Under the background of the real case and the established SCOR models, a precast steel structure
supply chain simulation model is established in Excel for analyzing the delivery plan problem. The
supply chain simulation model includes two locations where inventory cost happens, five variables
about the supply chain process, four parameters used to calculate the results and two critical decision
rules about the inventory time. A simulation model framework and a supply chain diagram containing
the above information are described. The simulation runs 400 times in the MonteCarlito tool and
obtains four performance measures results about average inventory time and cost. Through calculating
and analyzing the confidence intervals of the results, this thesis discusses the validation of the
simulation and the significance to the real project.
The relationship management problems are discussed based on a questionnaire and interview
process. The questionnaire covers eight key elements for improving the relationship management:

7
supplier’s selection, objectives, trust, collaboration, communication, problem solving, risk allocation
and supplier’s improvement. After 38 interviewees completed the questionnaire, a face-to-face
interview was conducted. After compiling the data and concluding the interview, 23 suggestions had
been issued to main contractor for building, controlling and managing the relationship with suppliers
according to the interview results from 38 interviewees.
This thesis first set up the SCOR models based on general information of the real case, and then
describes the three problems exposed by the specific raw-mill-workshop information through the case
study. After that, the three problems are analyzed by the established SCOR models, the MonteCarlito
simulation and the relationship management interview in sequence.

Chapter Two
Literature Review: EPC Projects
2.1 Procurement process in international EPC projects
International EPC projects are managed by a main contractor, who is in charge of the Engineering,
the Procurement, and the Construction aspects of the projects. The procurement processes constitute a
major and critical part of the project; they include planning, sourcing, purchasing, contracting, and on
site management (Yeo & Ning, 2002). Processes include international logistic, which contains in-land
and off-shore transportation, and custom clearance which are done by suppliers and delivery agents,
who are employed by the main contractor.
The procurement phase in international EPC projects consists of an overall process that starts with
the main contractor planning procurement and ends with the delivery agents delivering products to the
construction site. It overlaps with the design phase and greatly defines the final configuration of a
construction supply chain (O’Brien et al., 2009). In this phase, most of the suppliers of each kind of
product are selected. Price, quality, reputation, schedule performance and previous experiences are
often evaluated as the criteria to select those companies. Once signing the contracts or agreements, a
number of conditions and constraints will be specially recognized and identified on the construction
supply chain (O’Brien, 1998). The locations of suppliers are already known, the delivery plans are
established, and the resources of suppliers are declared (although these factors conditions may be
changed during the operation). At this moment, a competent project manager should have the ability to
predict the potential change and understand how to figure out the possible problems which might occur
on the construction supply chain. He should plan and protect their projects from the negative impacts
that variability and uncertainty may cause (O'Brien & Fischer, 2000).

9
Some of problems affecting construction supply chain during the procurement period are related
to suppliers, such as the delay of fabrication, low productivity or late delivery; some causes come from
import or export agents, who have low power to transact the custom clearance and transportation
arrangement; some causes are due to the main contractor, who ignores the interactions among different
products’ delivery plan and so on.
From the perspective of resources, there are main elements that may influence the entire
procurement supply chain: inventory, transportation, facilities and information (Chopra & Meindl,
2001). Research shows that the last three elements including transportation, facilities and information
have a very close relationship with inventory. Transportation changes the inventory between each two
locations in the supply chain; facilities are placed for producing and storing inventory; and information
is collected and distributed for inventory operation and inspection (Tserng, Yi, & Li, 2006). So
decreasing inventory cost is the very important objective for determining the value of these three
elements (Chopra & Meindl, 2001).
In order to manage the inventory cost in the entire procurement supply chain, the most apparent
and effective method is to describe the procurement process through setting up a supply chain model
and try to find the inventory locations and possible factors influencing inventory cost by analyzing each
step in the process (O’Brien et al., 2009). It has been found that an effective material procurement
management system can increase the construction productive by 6-8% and decrease the required space
for inventory; however, the construction industry only invested 0.15% of the total material costs for
improving materials supply chain management (Marsh, 1985). With the successful application and
development of supply chain management in the manufacturing field, the construction supply chain
management has been gradually adopted in the construction industry. At the same time, government
10
and construction companies became more and more interested in this field because more potential
profits and benefits are found during the practical study (Formoso & Revelo, 1999). The Brazilian
government encouraged small building firms to use quality management methods to improve
construction material supply chain management (Formoso & Revelo, 1999); the Taiwan government
led the key construction companies for the Taiwan High-speed Railway project to build a supply chain
system to exchange information among the stakeholders (Tserng et al., 2006); and the Indonesian
government encouraged the researchers to focus on construction supply chain analysis during the
procurement phase including relationship analysis between contractor and suppliers, performance
indicators for construction supply chain performance and how to reduce the integrated costs in the
entire supply chain (Abduh et al., 2012). These governments only concentrated on local project, but
ignored to applying construction supply chain management to international construction projects.
Under the background of developing research on construction supply chain, modeling the
construction supply chain in the procurement process especially for the material supply chain, drove
researchers’ interests: Pan et al. (2011) provided a systematic approach for exploring the behavior of
the construction supply chain process and developed a performance evaluation method to improve the
supply chain management of construction projects. Cheng et al. (2010) presented a network
construction supply chain model based on different kinds of products, and set up a framework to
monitor the performance of construction supply chain. These two aforementioned papers established
the construction supply chain model in the same way that described the management processes firstly
and applied the same SCOR model framework. But these two studies focused only on the common
construction projects. They did not talk about the supply chain management in the EPC project, which
is the most common type of contract in international construction projects.

11
2.2 The SCOR Models
The Supply Chain Operations Reference model (SCOR Model), proposed by the Supply Chain
Council, is the first standard reference model of the supply chain process, and its diagnostic tools cover
all industries (Supply Chain Council, 2008). The SCOR model can be developed to build partnerships
on the supply chain and upgrade supply chain activity in construction industries (Schultz, 2003), so it is
very suitable to be applied in the construction supply chain to present the activities operation. The
SCOR modeling framework is based on five basic management processes in supply chains—Plan (P),
Source (S), Make (M), Deliver (D), and Return (R)—to meet planned and actual demand (Cheng et al.,
2010).
Plan (P) is the most important step in these five components (Lockamy & McCormack, 2004),
and it includes the critical processes for balancing resources. The established plans should best meet the
supply chains’ requirements on sourcing, production, delivery, and return (Cheng et al., 2010). In the
procurement process of international EPC projects, each participator in the supply chain sets up the
plans for tendering, producing, and transporting. The plans are frequently established before each
stakeholder executes work and are sometimes adjusted during specific operation. The contents of plans
include time, cost and quality control to each milestone, resources arrangement for production,
emergency proposal for unpredicted issues, and risk management for accidents. To effectively manage
the supply chain, the main contractor prefers to ask partners to submit their plans at the first step.
Source (S) includes processes that manage the procurement, delivery, receipt, and transfer of raw
material items, subassemblies, products and services (Cheng et al., 2010). In the procurement process
of international EPC projects, sources cover the processes of coordinating and balancing resources by
each partner according to respective plan, commercial operations using bills and receipts and other

12
preparation works for essential works in the next step. During the source phase, the communication and
cooperation among participators are very important, because for example some bills for payment or
custom clearance will be delivered from one to another.
Make (M) includes processes that transform products to a finished state (Cheng et al., 2010). In
the procurement process of international EPC projects, make means that factories produce goods, such
as construction materials or production plants, which are the object in the procurement contract. The
most important thing in this phase is quality. For this reason, control and inspection are always
executed during the make process by suppliers and the main contractor.
Deliver (D) includes processes that provide finished goods and services, including order
management, transportation management, and distribution management (Cheng et al., 2010). In the
procurement process of international EPC projects, the deliver phase means mainly the logistical step
including shipment, in-land transportation, custom clearance and the related commercial payment
operation. Due to crossing different countries and complicated import and export documents, delivery
is always viewed as the critical part to control project schedule and payment.
Return (R) includes post-delivery customer support and processes that are associated with
returning or receiving returned products (Cheng et al., 2010). In the procurement process of
international EPC projects, because of high delivery cost and complex custom clearance process,
redundant goods are always sold in the projects’ local market, such as redundant steel bar or electric
cable. Moreover, the broken goods provided by suppliers will be abandoned without returning. At the
same time, the main contractor will request suppliers to provide same goods in the fastest way and for
free. So the return in the procurement process seldom happens in international EPC projects.
13
2.3 Framework of Supply Chain Model
Demand and supply of these five components are planned and controlled in different levels. There
are four levels in SCOR models to define the operation steps, measure the performance identify the
correlations and verify the information (Huan, Sheoran, & Wang, 2004). They are top level,
configuration level, process level and implementation level. In Level 1 (top level), the modeling
provides a broad definition of the scope and content for the SCOR model and describes the five
fundamental processes; Level 2 (configuration level) modeling divides the five basic management
processes into process categories, which allow companies to describe the configuration of their supply
chains. The stakeholders in the supply chain should choose the section type based on the upper level.
For example, under the plan section, the main contractor must select plan supply chain, plan source and
plan delivery. Level 3 modeling provides companies with the information for detailed planning and
setting goals. Every process type in Level 2 is divided into detailed process units including inner
process and external process. Level 4 modeling focuses on the detail implementation that is not defined
in SCOR because SCOR only defines common standard supply chain reference structure. In Level 4
modeling, users need to design the implementation details of each Level 3 process to meet their own
needs. Through the four levels of development, the SCOR models can be extended to capture and
represent complex interactions among supply chain partners. Except for the four levels, a performance
metric designed for evaluating the construction supply chain always includes reliability, responsiveness,
flexibility, cost and assets (Pan et al., 2011).
A more generalized framework to set up construction supply chain model has been discussed in
the book Construction Supply Chain Management Handbook (O’Brien et al, 2009). The framework for
developing the construction supply chain model consists of five basic steps which support the modeling

14
process. They are (a) define SC model purpose; (b) establish SC performance measures; (c) determine
product type; (d) define SC configuration; and (e) characterize SC elements. This framework will
provide the necessary support to develop a comprehensive SC model that includes the model goal and
metrics, as well as adequate boundaries, elements, and attributes (O’Brien et al., 2009). Figure 1 shows
the framework to set up the construction supply chain model in five steps.
1- Define SC model purpose
2- Establish SC performancemeasures
3- Determine product type
4- Define SC configuration
5-Characterize SC elements(companies, processes and
flows)
Figure 1. Framework to set up construction supply chain model. Adapted from Construction Supply
Chain Management Handbook by William J. O’Brien, Carlos T. Formoso, Ruben Vrijhoef and Kerry A.
London, 2009, p.2-17
Construction supply chain model can serve various purposes, which vary from decreasing
integrated delivery cost to those that estimate how project management methods affect supply chain
through performance. The purpose of this thesis is to decrease the cost in the procurement phase. In
order to achieve this purpose, this thesis selects inventory cost as the performance measure and will
check the inventory cost from four different locations.
2.4 Products
Generally, there are three kinds of products: ETO (engineer to order), MTO (make to order), and
MTS (make to stock). ETO products are specially made for the customer following detailed
15
specifications (e.g., power distribution equipment, preassembled rebar components), commonly
characterized by long lead times and complex engineering processes for product specifications. MTO
products are usually products manufactured once customer orders have been placed (e.g., cast-in-place
concrete, prefabricated panels). Usually, MTO manufacturers don’t hold stock and lead times can be
either long or short, depending on the manufacturing complexity. MTS products are commodities (e.g.
consumables such as bricks and steel bar) characterized by short lead times. MTS manufacturers
usually hold stock; however, managing the physical distribution of such products may be complex.
Most previous literature prefers to choose a kind of product when establishing the determining the
product type in the third step of construction supply chain model framework. Pan et al. (2011) chose
the MTO product (precast concrete) to research the supply and demand behaviors by using a SCOR
model under a case study of the bridge superstructure construction process; steel bar is always chosen
as the MTS product for analyzing the construction supply chain (Abduh et al., 2012; Ala-Risku &
Mikko, 2005; Baladhandayutham & Venkatesh, 2012; Tserng et al., 2006). Very little research focuses
on multiple products and their interactions on construction supply chain. Cheng et al. (2010) described
three different kinds of products—stocked standard products, configurable products and custom
products—and established their SCOR models. But in the case study of this paper, the stocked product
and configurable product are the raw materials for the custom product. This thesis identifies three types
of products working for three different and connecting critical works: civil construction, steel structure
erection and main plant erection.
2.5 Inventory Cost
As discussed above, inventory management is very critical to influence the construction supply
chain during the procurement period. Controlling the inventory cost is also the first important purpose
16
of inventory management. Polat, Arditi and Mungen (2007) presented that the time and size of
shipment could influence the inventory cost and simulated the supply chain of ordering products for
comparing two decision making strategies, just-in-case and just-in-time. Tserng et al. (2006) interpreted
that the transaction constraints would result in inventory cost overspending. Arbulu, Ballard, and
Harper (2003) explained that the marketplace would influence the inventory cost due to its distance to
the site. Besides, they thought a dynamic inventory management system would be helpful to inventory
control because the system would provide upgraded supply and demand information. Kern and
Formoso (2006) divided the project operation plan into three levels: long term plan, medium-term and
short term plan. They thought different level plans would influence the inventory management
differently. The long term plan would reduce the inventory cost, the medium term will change the
inventory space and the short term plan will keep the inventory information transparent.
2.6. Supply Chain Simulation
Hatmoko and Scott (2010) measured the impact of various supply chain management practices,
such as flow of materials, on project performance through investigating tow medium-size building
projects and developing simulation models. These models were developed using Pertmaster Risk
ExpertTM
software and performed simulation. The simulation results showed that delays in material
flow caused the biggest impact on the project. Pan, Lin, and Pan (2010) set up a supply chain model
based on a based on SCOR model and a case study of a bridge construction project. The model was
simulated by using Java in the Expression function of Simprocess. The simulation results showed that
the proposed hybrid modeling methodology helps construction supply chain participants identify their
roles and communicate easily, helps project managers identify bottlenecks in a supply chain, and
significantly improves supply chain performance. Vidalakis, Tookey, and Sommerville (2011)

17
presented a logistical analysis of construction supply chains by assessing the impact of varying demand
on the performance of building materials and developing a conceptual logistics model. The conceptual
model was constructed by the means of an activity cycle diagram (ACD) and implemented simulation
using Simul8 (Visual8 Corporation), a commercial off-the-shelf discrete-event simulation package. The
simulation results showed that demand variability, as one of the major issues, can hinder the
application of logistics management in construction and dealt with the resultant increased complexity
by implementing a stochastic simulation modeling approach.
Ebrahimy, AbouRizk,, Siri, and Mohamed (2011) developed a simulation model for the upstream
supply chain of a real-time tunneling construction project and aimed to capture complex variables
impacting the productivity. The simulation model was developed by the Simphony Supply Chain
Simulator (SSCS) and the variables were studied by sensitivity analysis. The results suggested several
approaches to addressing supply chain including effective quality control, increasing storage space, and
anticipating leading-time.
AbouRizk and Halpin (1992) studied the statistic distribution application to construction duration.
The results showed that beta distribution is suitable for representing the construction activity durations
and could be used in the simulation. McCabe (2003) discussed the schedule risk in the construction
management using the MonteCarlito simulation and verified that the beta distribution can be
approximated with a triangular distribution, which requires three parameters for its definition: the
lower limit, the most likely value and the higher limit. The triangular distribution is widely used in
project management as an input into the critical path method (CPM) to model events which take place
within an interval defined by a minimum and maximum value. Polat, et al. (2007) explained why
just-in-case strategy has less inventory cost than just-in-time strategy through setting up a simulation

18
model. In the model, the triangular distribution was used to represent the activity duration in the
construction projects.
2.7 Relationship Management
In practice, international EPC projects often suffer from schedule delays and inventory cost
overspending. Just as discussed above, more research pays attention to the causes of the poor
performance, but few studies focus on the influence of the supply chain management on the
relationship between the main contractor and suppliers (supplying products or supplying service).
Meng (2012) explained the huge effects to project operation by supply chain relationship from 10
indicators: mutual objectives, gain and pain sharing, trust, no-blame culture, joint working,
communication, problem solving, risk allocation, performance measurement, and continuous
improvement. Zhao, Flynn, and Roth (2007) showed the need to research how Chinese international
project contractors manage the relationship with suppliers. Under their research, the relationship
management could be studied in multiple topics including supplier selection, evaluation, and
management; supply chain collaboration and relationship management; and impact of culture on supply
chain management.
Trust can be identified as the foundation of relationship management and influence so many key
factors of SCM, such as communication, long-term orientation, commitment, and satisfaction (Khalhan,
McDermott & Swan, 2007). Subsequently, these factors can be used to improve relationships and
evaluate relationships’ quality in business relationships. For example, communication and long-term
orientation have been applied to assess relationship’s quality. The influence from trust to relationship
management takes effectiveness in the construction field as well (Jiang, Henneberg, & Naudé, 2012),
especially among supply chain members, because trust relationship is based on long-term collaboration

19
and cooperation between supply chain partners (Akintoye & Main, 2007), and trust, as the key element
impacting relationship quality in construction industry, is an important tool in supplier relationship
management (Jiang et al., 2012).
Collaboration is not only a partner attitude, but also the detail joint working behaviors based on
trust. All the parties will make their efforts to work together for a project’s successful operation. From
the perspective of collaboration attitude, trust and no-blame culture assure collaboration climate arise
and to be kept during project operation. Goodwill trust will result in initiative works which are out of
scope of contract done by some parties. Blame always comes out when some problems and difficulties
happen. At this time, the parties often do not look for a solution firstly, instead would like to blame the
other parties in order to minimize or escape their responsibilities. They often neglect their poor
performance, but focus on other parties’ faults (Baiden, Price, & Dainty, 2006). This kind of blame
culture is very dangerous to project operation. No-blame culture is not a way refusing to pursue the
responsibilities for a fault, but concentrate on finding a suitable and effective solution firstly with a
cooperative attitude.
Communication is another key factor contributing to relationship management. Under traditional
contracts, each party is used to being secretive with their information. The lacking of sharing
information is thought as one of the main reason for the failure partnering relationship (Ng, Rose, &
Mak, 2002), so open communication is to exchange information, and two-way effective
communication can enhance trust, maximize understanding, reduce dispute and remove conflict, which
is also the essences of adopting EPC contract model (Chen, 2007).
Problem solving mechanism is very useful for parties to face sudden and unpredictable issues, but
it is more important to each party to set up a problem foreseen mechanism and a learning mechanism

20
for avoiding the same problem from happening again. Some experienced engineers and project
manager from each party in a project should constitute a team in the beginning of project operation.
The team may focus on following the project operation and try to find some possible problems that
may happen. Once some problems happen beyond prediction, the team is also responsible to
summarize and study the reasons leading to problems. Some problem structure analysis methods has
been researched by some authors for problems’ prediction and study, such as Cross Organizational
Learning Approach (COLA) (Franco, Cushman, & Rosenhead, 2004), which is to identify and review
critical incidents and project successes, in order to generate a limited set of key actions to feedback
both to project partners and to future joint projects. Problem solving capacity is a very critical factor to
show one party’s strength, and it is also a very useful criterion to select suppliers (Humphreys, Shiu, &
Chan, 2001).
Chapter Three
Case Study: Cement Factory
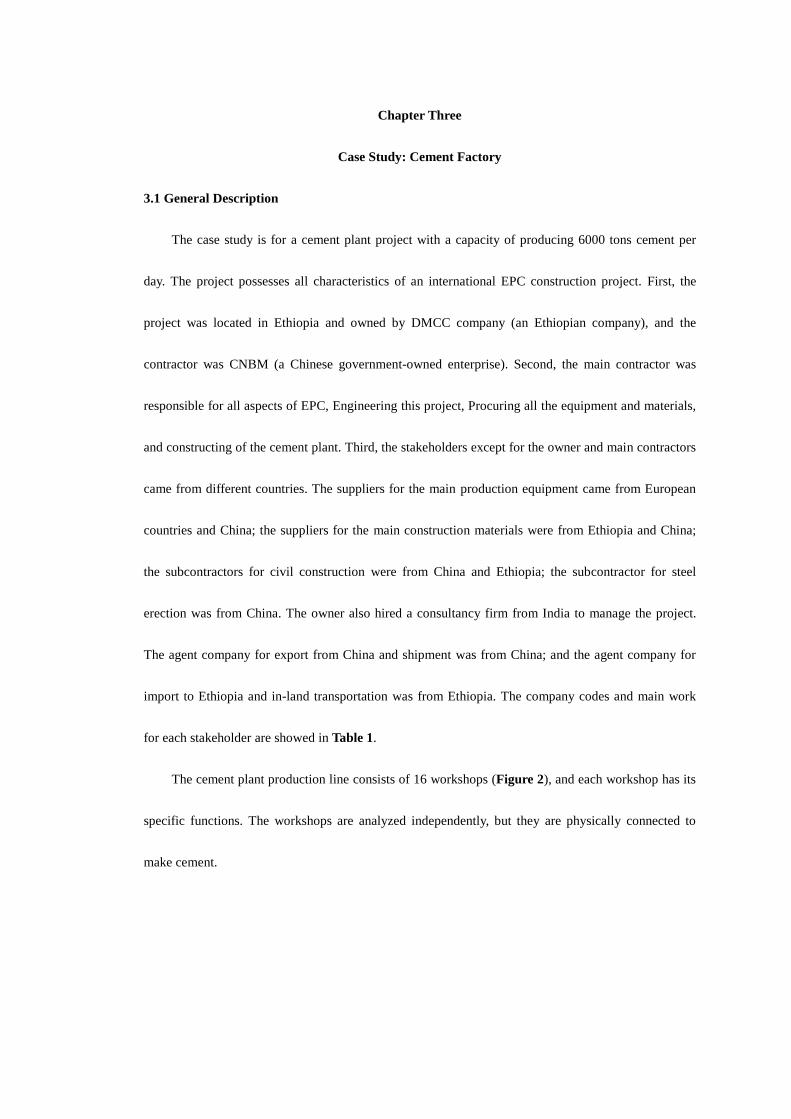
3.1 General Description
The case study is for a cement plant project with a capacity of producing 6000 tons cement per
day. The project possesses all characteristics of an international EPC construction project. First, the
project was located in Ethiopia and owned by DMCC company (an Ethiopian company), and the
contractor was CNBM (a Chinese government-owned enterprise). Second, the main contractor was
responsible for all aspects of EPC, Engineering this project, Procuring all the equipment and materials,
and constructing of the cement plant. Third, the stakeholders except for the owner and main contractors
came from different countries. The suppliers for the main production equipment came from European
countries and China; the suppliers for the main construction materials were from Ethiopia and China;
the subcontractors for civil construction were from China and Ethiopia; the subcontractor for steel
erection was from China. The owner also hired a consultancy firm from India to manage the project.
The agent company for export from China and shipment was from China; and the agent company for
import to Ethiopia and in-land transportation was from Ethiopia. The company codes and main work
for each stakeholder are showed in Table 1.
The cement plant production line consists of 16 workshops (Figure 2), and each workshop has its
specific functions. The workshops are analyzed independently, but they are physically connected to
make cement.

22
Table 1
Company Codes and Main Work for each Stakeholder
Stakeholders Country Work description Company Code
Owner Ethiopia Sourcing funding for project, paying for
main contractor, and providing site, electric
and water for construction.
DMCC
Main contractor China Managing, planning, inspecting the work of
Engineering, procurement and Construction
CNBM
Consultancy India Managing the project HOLT
Suppliers of important main
equipment, such as vertical
mill
Germany Engineering, producing, delivering and
guiding erection
LEOG*
Suppliers of other
mechanical and electrical
equipment
China Engineering and producing CNCE
Supplier of steel structure China Manufacturing precast steel structure,
making and erecting the steel structure on
the site
PFSH*
Supplier of steel bar China Providing and delivering CSBC*
Supplier of cement China Providing and delivering CCMC
Supplier of brick Ethiopia Providing brick EBFC
Supplier of gravel Ethiopia Providing gravel EGFC
Subcontractor of main civil
construction
China Constructing civil works and erecting
equipment
15CC
Subcontractor of pile
foundation
Ethiopia Doing the civil work of pile foundation DPFC
Export agent China Custom clearance and shipping
arrangement
EASH*
Import agent Ethiopia Custom clearance and in-land transporting
arrangement
IADJ*
Note: the suppliers with * are selected for the study.

23
Cement Plant Production Line
Limestone pre-blending storage
Corrective material and corrective crushing and storage
Corrective pre-blending and belt conveying
Raw meal material proportioning and convey
Raw meal grinding and exhaust gas
treatment
Raw meal homogenizing silo
Coal powder preparation
Raw meal convey and kiln back end
Middle part of kiln Kiln head and clinker cooling
Clinker storage and convey
Cement material proportioning
Cement grinding Cement storage Cement bulk Cement packing
Start
Finish
Figure 2. Cement plant workshops, arrows indicate material flow (CNBM.2007)
The Raw Meal Grinding and Exhaust Gas Treat workshop (RMGEGT) is selected for the study
(highlighted in Figure 2), because it includes all the above mentioned EPC characteristics. The
workshop includes seven sub-works. Three are critical in the Construction period: main civil
construction, steel structure making and erection, and machinery and electrical equipment erection. The
Gantt chart (Figure 3) shows that the three sub-works are on the critical path and should be completed
sequentially. In other words, the sub-work of steel structure making and erection cannot start until
completion of the sub-work of main civil construction; and sub-work of machinery and electrical
equipment erection cannot start until completion of the sub-work of steel structure making and erection.
Table 2 clearly shows the stakeholders which performed the seven sub-works.
Figure 3. List and Gantt chart of sub-works in RMGEGT (CNBM, 2007)
24
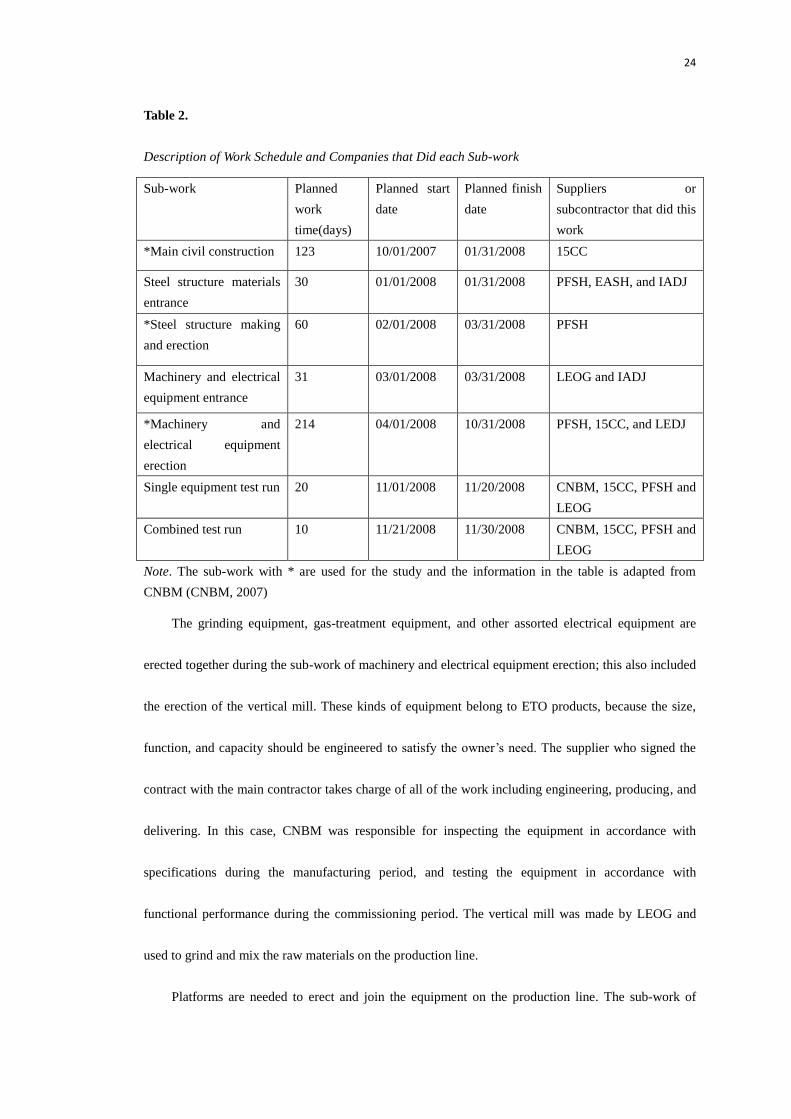
Table 2.
Description of Work Schedule and Companies that Did each Sub-work
Sub-work Planned
work
time(days)
Planned start
date
Planned finish
date
Suppliers or
subcontractor that did this
work
*Main civil construction 123 10/01/2007 01/31/2008 15CC
Steel structure materials
entrance
30 01/01/2008 01/31/2008 PFSH, EASH, and IADJ
*Steel structure making
and erection
60 02/01/2008 03/31/2008 PFSH
Machinery and electrical
equipment entrance
31 03/01/2008 03/31/2008 LEOG and IADJ
*Machinery and
electrical equipment
erection
214 04/01/2008 10/31/2008 PFSH, 15CC, and LEDJ
Single equipment test run 20 11/01/2008 11/20/2008 CNBM, 15CC, PFSH and
LEOG
Combined test run 10 11/21/2008 11/30/2008 CNBM, 15CC, PFSH and
LEOG
Note. The sub-work with * are used for the study and the information in the table is adapted from
CNBM (CNBM, 2007)
The grinding equipment, gas-treatment equipment, and other assorted electrical equipment are
erected together during the sub-work of machinery and electrical equipment erection; this also included
the erection of the vertical mill. These kinds of equipment belong to ETO products, because the size,
function, and capacity should be engineered to satisfy the owner’s need. The supplier who signed the
contract with the main contractor takes charge of all of the work including engineering, producing, and
delivering. In this case, CNBM was responsible for inspecting the equipment in accordance with
specifications during the manufacturing period, and testing the equipment in accordance with
functional performance during the commissioning period. The vertical mill was made by LEOG and
used to grind and mix the raw materials on the production line.
Platforms are needed to erect and join the equipment on the production line. The sub-work of

25
“steel structure making and erection” is to build the platforms. The precast steel structure manufactured
in the Chinese factory belongs to the product of MTO, because the manufacture is performed after
signing a contract with the main contractor. In this case, the precast steel structures were fabricated by
PFSH in accordance with CNBM specifications. Afterwards, the precast steel structures were
fabricated to various steel structures on the construction site. The size and shape of the steel structure
should match the equipment’s size and weight, as well as fit into foundation. PFSH was responsible for
producing and delivering the steel structure to the EASH in Shanghai and in providing skilled workers
on construction site for erection.
It should be mentioned that a cement plant project needs a great quantity of civil construction
work, which is not only for storage silos and the center control building, but also for some supporting
structures and foundations of the equipment and steel structure. The sub-work of main civil
construction in RMGEGT workshop is to build the concrete supporting structure and foundation. The
main construction materials are brick, cement, sand, gravel and steel bar. These materials provided by
Chinese or the project’s local suppliers in this project were always produced in advance and stocked in
the suppliers’ warehouse. Therefore, these materials belong to MTS products. These materials usually
have high demand and are always procured with a certain amount of lead time in order to guarantee the
delivery on time during construction. When the suppliers sign an agreement with the main contractor
and receive the order to deliver the materials, they transfer the stock materials and transport them to the
construction location. The steel bar supplies was selected for the study. Due to the lack of qualified
steel bar suppliers in Ethiopia and the free tax on imported products of this project, the supplier (CSBC)
was selected from China.
The REGEGT model presented can be depicted by Figure 4. Three kinds of products: steel bar

26
(MTS), precast steel structure (MTO), and vertical mill (ETO), which are provided by three suppliers
and used for three critical –sub-work during construction period. The general description is also
showed in Figure 4.
DMCC Company ( Owner )
CNBM(Main Contractor)
Procurement Processes
Supplier 2: PFSH
Supplier 1: CSBS
Supplier 3:LEOG
Steel bar (MTS product)
used for“main civil
construction”
Precast Steel Structure(MTO
product) used for“steel
structure making and erection”
Vertical Mill (ETO product)
used for“machinery and electrical equipment
erection”
Figure 4. Stakeholders in the cement plant model RMGEGT
3.2 SCOR Model Analysis
The main purpose for the construction of a supply chain model is to help in analyzing the
performance of the supply chain management during the procurement period, as well as in studying the
inter-relationship among stakeholders. The configuration of the supply chain is based on the three
levels SCOR model. The SCOR model level 1 identifies the general work done by each stakeholder,
and then the SCOR model level 2 divides the general work into process types, finally the SCOR model

27
level 3 divides every process type into detailed process units. The SCOR model divides every process
type in level 2 into detail process units in level 3 and explains each of them by steps, and then describes
the supply chain into a process network. Each detail step in SCOR model level 3 will be identified and
used to check the reasons for the future possible problems happened in the supply chain. Not only will
processes be identified step by step, but also the correlations between each two steps and between each
two locations are presented.
The performance of the supply chain is measured by using the total inventory cost for the three
types of products. Based on the supply chain models of steel bar, precast steel structure, and vertical
mill, the locations where inventory cost may occur and the factors that may influence the cost will be
identified.
3.2.1 Steel bar. Due to its available amount and huge consumption, some project managers think
that the steel bar has low inventory cost. It may be suitable in a simple building construction project,
however, this cannot be agreed on in a complicated international EPC project because of the number of
stakeholders involved the complex delivery process.
In the beginning of the procurement of the case, CNBM had a procurement plan to decide the type
and quantity of steel bars according to the preliminary design of the civil construction. After that,
CNBM asked potential suppliers to submit offers responding to the requirements. Then CNBM
headquarters compared and evaluated each offer from suppliers. Based on that, the final approved
supplier—CSBC—was picked out and placed the order directly. On receiving the order, CSBS would
deliver the stocked or produced steel bars to the Shanghai port where they turned over the qualified
steel bar to the EASH employed by CNBM. After receiving the steel bar, EASH was responsible for the
export custom clearance and shipment arrangement. When this batch of steel bar arrived at the Djibouti

28
port, IADJ working for the main contractor took charge of the import custom clearance and inland
transportation to the construction site. When the steel bar entered the site, CNBM working there
received, stocked, and handed over them to the civil subcontractor—15CC—for civil construction. The
procurement process of steel bar can be seen in detail in Figure 5.
Main contractor plans to procure steel bar according to the requirements of quantity and quality
Main contractor confirms the possible suppliers based on qualified specification
Main contractor asks these suppliers for offers
Main contractor evaluates the offers from different suppliers
Decision to buy steel bar from one supplier
Main contractor places the order to the supplier
The supplier set up the delivery plan and delivered the stocked steel bar to the Shanghai port as schedule
Export agent company received the steel bar, transacts export custom clearance and ship them to the Djibouti port using related documents provided by the main contractor
The import agent transacts import custom clearance when the steel bar arrives at the Djibouti port, and delivers the steel bar to the construction site in Ethiopia using related documents provided by the main contractor
Main contractor working on the construction site receives, stocks steel bar and hands them to the civil work subcontractor for construction
Selecting supplier process
Delivery process
Figure 5. Procurement process of steel bar
3.2.1.1 SCOR model configuration. The SCOR model level 1 is showed in Figure 6, and it can
be seen that all the stakeholders involved in the procurement of steel bar: CSBC, CNBM in
headquarters, CNBM on construction site, EASH, and IADJ. At the same time, the model defines the
main work of plan, source and delivery done by each stakeholder (Table 3).

29
Chinese steel bar supplier
Main contractor in Chinese headquarter
Export and shipment agent in the Shanghai
port
Import and transportation agent
Main contractor on construction site
Delivery
Plan
Source
Plan Source
Delivery Delivery
Plan
Source
Source
Source
Plan
Figure 6. SCOR model level 1 for steel bar
Table 3.
Description of Work for SCOR Model Level 1 for Steel Bar
Stakeholder Plan Source Delivery
CSBC Plan transferring and
delivery of steel bar
Sign contractor with
CNBMIE and receive
the order of delivery
Deliver steel bar to
Shanghai port
EASH Plan custom clearance
and shipment
Receive and verify
steel bar
Delivery steel bar to
Djibouti port
CNBM in Chinese
headquarter
Plan the whole supply
chain and procuring
procedures of steel bar
Prepare delivery
schedule
IADJ Plan custom clearance
and in-land transportation
Receive and verify
steel bar
Delivery steel bar to
construction site
CNBM on
construction site
Receive and verify
steel bar
The SCOR model level 2 (Figure 7) identifies the steel bar procurement process types done by
each stakeholder, which is more detail than Level 1. For example, Level 1 model only identifies that
CNBM in Chinese headquarter should do the work of plan, but does not illustrate what kinds of plan
work that CNBM should do. However, Level 2 describes that CNBM should do the work of P1 (plan
supply chain) and P2 (plan source). P1 is to make a plan for arranging the whole supply chain
procedures, and the P2 is to make a plan for doing source work. Besides, in Level 2 model, the source
work of steel bar is specifically identified as S1 (Source steel bar), which includes the work of setting
up delivery schedule, receiving steel bar, verifying steel bar, and transferring steel bar. These processes

30
will be identified in Level 3 model. Meanwhile, the delivery work of steel bar is also specifically
identified as D1 (deliver steel bar). More detail working process for delivering steel bar will be
identified in Level 3. Moreover, Level 2 model represents the delivery flow and information flow
between each two specific work, which interprets the direction and route of the steel bar flow, and
correlation between any two stakeholders through communication. The steel bar was delivered from
CSBC to EASH, and then from EASH to IADJ, and finally from IMDJ to CNBM working on site. The
information flow includes outer communication and inner communication. For example, when CNBM
in Chinese headquarters set up supply chain plan (P1), CNBM communicated with CSBC for the work
of S1. At the same time, CNBM communicated with EASH and IADJ for the work of plan delivery
(P4). Except for these outer communications, CNBM also communicated with the CNBM inner
department that was responsible for establishing the plan of sourcing steel bar (P2).
Chinese steel bar supplier Export and shipment agent
in the Shanghai portMain contractor in Chinese
headquarterImport and Transportation agent in the Djibouti port
Main contractor on construction site
P1
P2
S1
D1
P4
D1S1 S1 D1
P4
S1
S1
P4
Figure 7. SCOR model level 2 for steel bar. “ ”: the steel bar flow; “ ”: the information flow
Although the main contractor did not deliver the steel bar, it was very important for the main
contractor to prepare all related documents for the steel bar cargo and provide them to the export agent
and import agent , which is the S1 work done by CNBM in Chinese headquarters. The agents could not
do anything about custom clearance and transportation without the cargo documents, which always
include bill of lading, duty free certification, shipping list, cargo invoice and so on. Providing cargo
documents on time is a very important factor influencing the inventory cost, so the communication

31
about the cargo documents and delivery condition between the main contractor and agents is the main
information flow in this supply chain. In order to find the specific locations where inventory cost
happened and the possible operations that may result in inventory cost overspending, SCOR model
level 3 has been worked out and presented in Figure 8.
Chinese steel bar supplier
D1.2Receive, Enter & Validate
Order
P4.4Establish
Delivery Plan
D1.3Determine
Delivery Date
D1.4Consolidate
Order
D1.6Route
Shipments
D1.7Select Carrier
D1.8Receive
Product from Make/Source
D1.11Load
Product
D1.12Ship Product
S1.1Schedule Product
Deliveries
S1.4Transfer Products
Export and shipment agent in the Shanghai Port
D1.13Receive & Verify by Custom
D1.2Receive, Enter & Validate
Order
D1.3Determine
Delivery Date
D1.4Consolidate
Order
D1.6Route
Shipments
D1.7Select Carrier
D1.8Receive
Product from Make/Source
D1.11Load
Product
D1.12Ship Product
P4.4Establish
Delivery Plan
S1.1Schedule Product
Deliveries
S1.4Transfer Products
S1.2Receive
Products
S1.3Verify
Products
Main Contractor in Chinese headquarter
P2.4Establish
Sourcing Plans
P1.4Establish & Com
SC plans
S1.1Schedule Product Delivery
Import and transportationagent in the Djibouti port
D1.2Receive, Enter & Validate
Order
D1.3Determine
Delivery Date
D1.4Consolidate
Order
D1.6Route
Shipments
D1.7Select Carrier
D1.8Receive
Product from Make/Source
D1.11Load
Product
D1.12Ship Product
D1.13Receive & Verify by Custom
P4.4Establish
Delivery Plan
S1.4Transfer Products
S1.2Receive
Products
S1.3Verify
Products
Main contractoron construction site
S1.2Receive
Products
S1.3Verify Products
S1.4 Transfer products
Inventory 4
Inventory 3
Inventory 2
Inventory 1
Figure 8. SCOR model level 3 for steel bar

32
P1 in Level 2 model is refined to a more detail unit of establishing and confirm supply chain plan
(P1.4), which is the start of the procurement process of steel bar. P2 is also refined to a unit of
establishing sourcing plan (P2.4). In the case, CNBM in Chinese headquarters worked for the schedule
of the steel bar delivery (S1.1). At the same time, CSBC, EASH, and IADJ began to establish their
delivery plans (P4.4). The determine delivery date (D1.3) established by each stakeholder should have
associated with the main contractor’s delivery schedule (S1.1). D1 in Level 2 model is divided into
several detail process units, which are from receiving validated order (D1.2) to receiving the
verification that the products have arrived at the following partner (D1.13). S1 in Leave 2 model is
divided into four detailed process units, which are schedule product deliveries (S1.1), receive products
(S1.2), verify products (S1.3), and transfer products (S1.4). The locations where inventory cost of steel
bar may happen are during the period of source work.
3.2.1.2 Inventory types and cost. There are four locations where the inventory cost undertaken by
CNBM may happen in the SCOR model level 3 for steel bar: the CSBC factory, the Shanghai port, the
Djibouti port, and the construction site.
3.2.1.2.1 Inventory 1. The first location where the inventory cost may happen is in the CSBC
factory. Generally, the inventory cost occurs because the supplier does not transfer the steel bar (S1.4)
for delivery according to the steel bar delivery schedule (S1.1). In other words, the steel bar is stocked
in the supplier’s factory before being transferred to delivery because of the late order from the main
contractor. Commonly, the inventory cost in the supplier’s factory will not be seen as the cost that
should be undertaken by the main contractor, because the supplier stocks the steel bar in its own silo
and waits for someone to come to buy. However, the inventory cost will be paid by the main contractor
when the delivery order arriving date comes later than the date given in the contract.

33
3.2.1.2.2 Inventory 2. The inventory cost will happen in the Shanghai port if the storing time of
steel bar exceeds the specified free time. In other words, the time that the export agent transfers the
steel bars (S1.4) for shipping is more than the specified free time of the port. The reasons leading to
inventory cost in the export port mainly come from two perspectives: one is the main contractor and the
other is the export agent company. Once the steel bar left the CSBC factory, CNBM needs to hand all
the related steel bar documents over to EASH for custom clearance and shipment. If these documents
were submitted late to EASH, the steel bar has to be stored in the Shanghai port until all the documents
are delivered to EASH. Once obtaining the document, the EASH can do the transactions of custom
clearance and shipment arrangement
From the SCOR model level 3, we also can see some steps operated by the export agent may
increase inventory cost. The first one is the late verification (S1.3) of the steel bar because of poor
communication with the steel bar supplier. The second one is the late transferring (S1.4) of steel bar
from the port silo onto the ship because of the bad delivery plan or the late custom clearance
transaction. The third one is missing the planned shipment carrier because of the late custom clearance
transaction or steel bar being late entering port. The steel bar entering port late may be due to the main
contractor’s late order, the supplier’s late delivery plan, or the transportation problems on the way. All
the reasons discussed above are classified into the following Table 4.
3.2.1.2.3 Inventory 3. The inventory cost will happen in the Djibouti port if the storing time of
steel bar when exceeding the specified free time. In other words, the time that IADJ transfers the steel
bars (S1.4) for in-land transportation is more than the specified free time of the port. IADJ also needs
the same steel bar documents for import custom clearance as the export agent company, including bill
of lading, tax free certification, original certification, invoice and check list. The custom department

34
would keep the steel bar on the port until all the required documents are received. If the steel bar is kept
to beyond the specified free time, the port administration office will charge a very high inventory fee.
Besides, the communication between CNBM and IADJ is also very important. CNBM should keep in
touch with IADJ about the shipment schedule and give notice to IADJ at the first time when the ship
with the steel bar arrives at the port (P2.4 Level 3 model).
Table 4
Factors Influencing the Inventory Cost of Steel Bar in the Location of Inventory 2
Inventory cost
issues
Reasons caused by each stakeholder
CNBM EASH CSBC Others
Steel bar was
stored in the
Shanghai port
when exceeding
the specified free
storing time or
waiting for the
shipment
Late handover of
documents
Late verification of
poor
communication
Poor
communication
Shipment carriers
change schedule
Late orders of
delivery from the
supplier
Bad delivery plan Bad delivery
plan
Transportation
problems on the
way
Late transaction of
custom clearance
Late transaction in
order to miss the
planned shipment
The inventory cost may happen because of the late transaction by IADJ for custom clearance and
inland transportation. If IADJ is not able to complete the custom clearance work or does not have a
good relationship with the custom department, the steel bar is very easy to be kept beyond the specified
free time. So choosing a competent import agent is very crucial for saving time and inventory cost in
the port.
Cultural difference is also a very critical factor that may influence the transaction efficiency.
Ethiopian companies have different business habits from Chinese companies. They prefer to get 100%
advance payment before working for custom clearance and do not like to execute contracts strictly.

35
Their unprofessional business behaviors made it very hard to ask for compensation for the inventory
cost caused by them. All possible reasons that may lead to the increasing of inventory cost in the
Djibouti port are showed in Table 5.
Table 5
Factors Influencing the Inventory Cost of Steel Bar in the Location of Inventory 3
Inventory cost
issues
Reasons caused by each possible stakeholder
CNBM IADJ Others
The steel bar was
stored in the
Djibouti port
when exceeding
the specified free
storing time or
waiting for the
transportation to
construction site
Late handover of
documents
Late verification of poor
communication
Cultural difference
Bad communication
with agent
Bad delivery plan
Choosing nonqualified
agent
Late transaction of custom
clearance
Late transaction of
planning transportation
3.2.1.2.4 Inventory 4. The overspending inventory cost may happen if the steel bar was stocked on
site when exceeding the estimated inventory time. To avoid the material shortage for the construction
requirement, the steel bar was commonly planned to be delivered to the site with a certain amount of
leading time and stocked on the open yard. In this case, the planned finish date of the steel bar entering
the site was 09/20/07 and the start date of the main civil construction of the raw material grinding
workshop was 10/01/07. It means that the minimal inventory time for the steer bar as planned was 10
days. If the steel bar was not used after the planned inventory time, the inventory cost would be
overspent and the procurement cost would increase.
There are multiple reasons for the delay in using the steel bar. Firstly, other main construction
materials, such as cement, entered the site late. Secondly, the previous work on the critical path had not
been completed on time. For example, the completion date of the foundation excavation was delayed
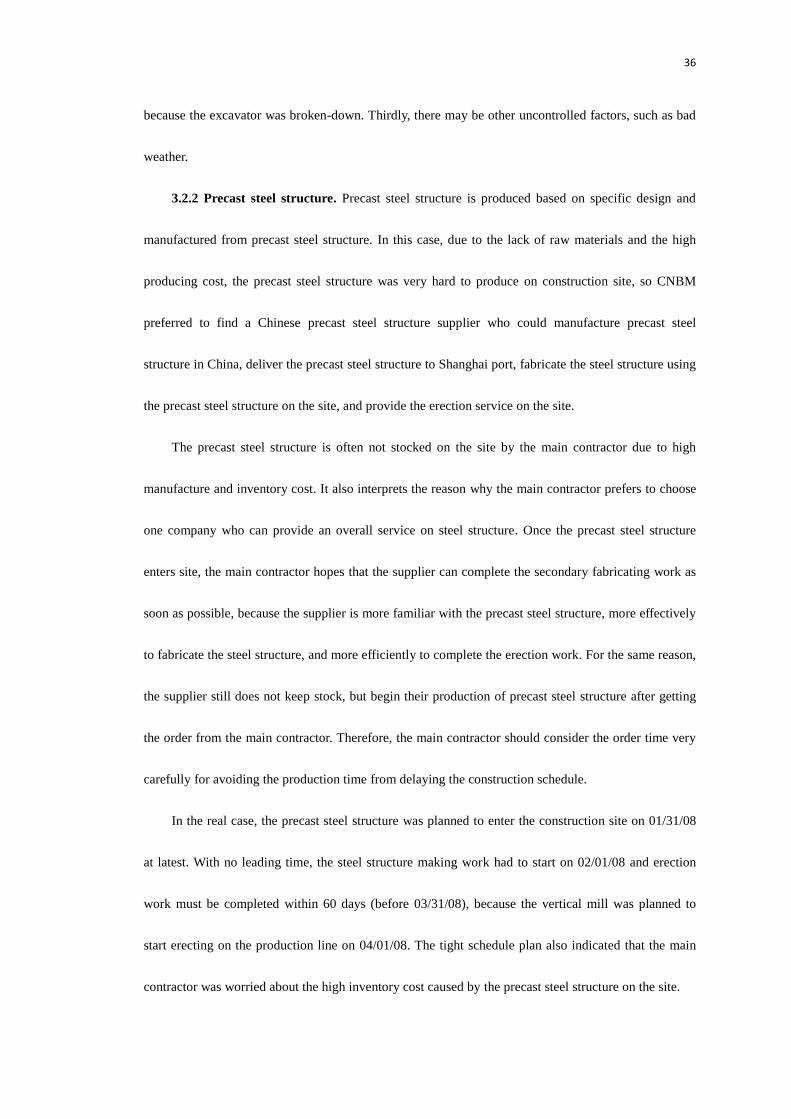
36
because the excavator was broken-down. Thirdly, there may be other uncontrolled factors, such as bad
weather.
3.2.2 Precast steel structure. Precast steel structure is produced based on specific design and
manufactured from precast steel structure. In this case, due to the lack of raw materials and the high
producing cost, the precast steel structure was very hard to produce on construction site, so CNBM
preferred to find a Chinese precast steel structure supplier who could manufacture precast steel
structure in China, deliver the precast steel structure to Shanghai port, fabricate the steel structure using
the precast steel structure on the site, and provide the erection service on the site.
The precast steel structure is often not stocked on the site by the main contractor due to high
manufacture and inventory cost. It also interprets the reason why the main contractor prefers to choose
one company who can provide an overall service on steel structure. Once the precast steel structure
enters site, the main contractor hopes that the supplier can complete the secondary fabricating work as
soon as possible, because the supplier is more familiar with the precast steel structure, more effectively
to fabricate the steel structure, and more efficiently to complete the erection work. For the same reason,
the supplier still does not keep stock, but begin their production of precast steel structure after getting
the order from the main contractor. Therefore, the main contractor should consider the order time very
carefully for avoiding the production time from delaying the construction schedule.
In the real case, the precast steel structure was planned to enter the construction site on 01/31/08
at latest. With no leading time, the steel structure making work had to start on 02/01/08 and erection
work must be completed within 60 days (before 03/31/08), because the vertical mill was planned to
start erecting on the production line on 04/01/08. The tight schedule plan also indicated that the main
contractor was worried about the high inventory cost caused by the precast steel structure on the site.

37
In the beginning of the procurement of this case, CNBM should submit preliminary parameters of
steel structures to the consultancy company (HOLT) in order to get the approval. Only when receiving
the approving notice from the consultancy, CNBM can set up the procurement plan and ask potential
suppliers for submittals. CNBM has to adjust the standard design parameters till passing the
examination from the consultancy. After the evaluation process for the submittals, the final and
qualified steel structure supplier is identified.
In international EPC projects, the main contractor always invites one eligible supplier to bid for
the steel structure supplying, making and erecting work. The main contractor prefers to choose a
competent supplier with quality strength and high reputation as a long time cooperator, because the
steel structure work requires the supplier to have an integrated capability of designing, manufacturing
and erecting. Meanwhile, the requirements of quality and skill are very high. In this case, the steel
structure erection of RMGEGT workshop needed special working aloft abilities for the erection
workers. Moreover, inviting an eligible supplier can decrease the evaluating process and reduces the
tender cost. So finding a qualified steel structure supplier in shortest time and with lowest cost is the
most important thing to the main contractor. A procurement process of precast steel structure is showed
in the follow Figure 9.

38
Main contractor submits preliminary design parameters of steel structure to consultancy
Export agent company receives the precast products, transacts the export custom clearance and ships them to the Djibouti port using related documents provided by
the main contractor
The imported agent transacts the import custom clearance when the precast products arrives at the Djibouti port, and delivers them to construction site in
Ethiopia using related documents provided by the main contractor
Main contractor working on construction site receives and stocks the precast products and hands them to the skilled workers for the steel structure making and
erection
Approved by consultancy
If yes, main contractor sets up procurement plan
If no, main contractor has to revise the design parameters till approved by
consultancy
Main contractor sends the final design parameters to one of long time cooperators for asking submittal with quotation
Main contractor receives the submittal and negotiates the offer with the cooperator
Approve the offer by both parties
If yes, the steel structure manufacturer sets up production plan, establishes delivery plan and organizes skilled workers
If no, main contractor will contract another long time cooperator or a reputed supplier
The manufacturer produces the precast steel structure under the inspection by the main contractor
The manufacturer delivers the precast products and relative erection tools to the Shanghai port, as well as arranges skilled workers to the construction site under the
assistance by the main contractor
Selecting supplier process
Precast steel
structure make and
delivery process
Figure 9. Procurement process of precast steel structure
3.2.2.1 SCOR model configuration. The SCOR model level 1 and 2 for precast steel structure are
established in Figure 10 and Figure 11 based on 5 stakeholders: PFSH in China, CNBM in Chinese
headquarter, CNBM on construction site, EASH and JADJ. Level 1 and 2 models for precast steel
structure are almost the same to the Level 1 and 2 models for steel bar. CNBM was still not involved
into the delivery of precast steel structure, but only overall took charge of the whole process including
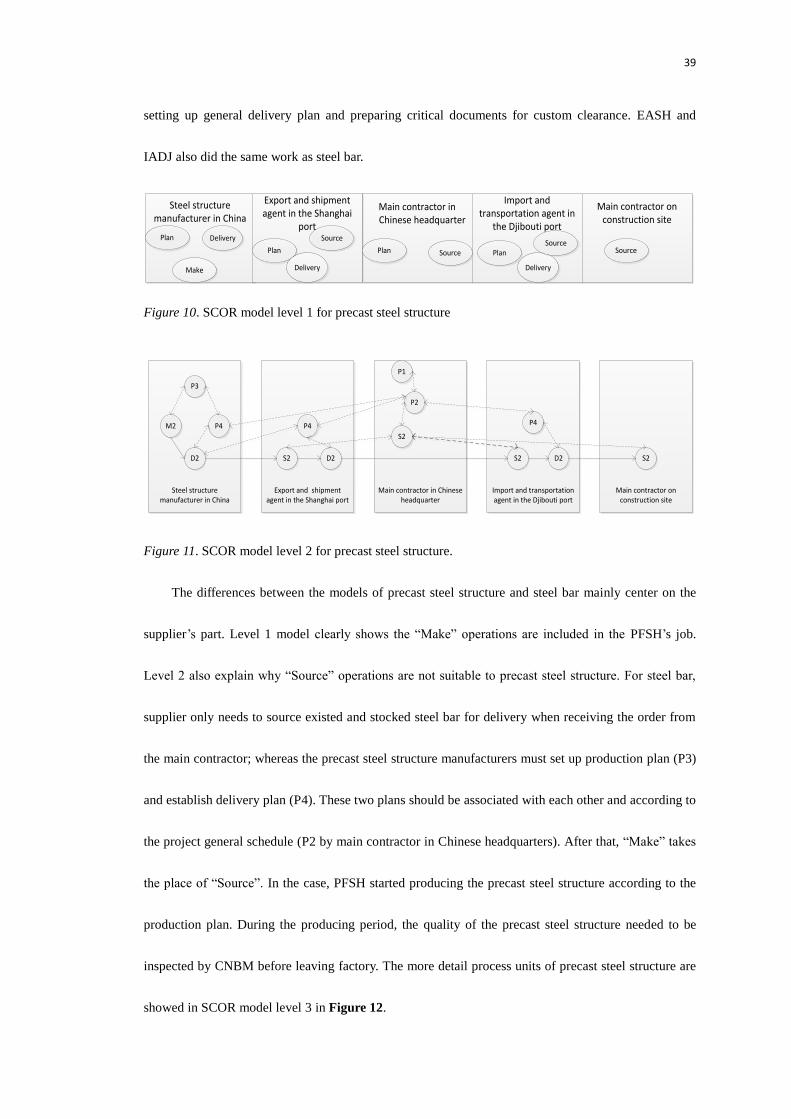
39
setting up general delivery plan and preparing critical documents for custom clearance. EASH and
IADJ also did the same work as steel bar.
Steel structure manufacturer in China
Main contractor in Chinese headquarter
Export and shipment agent in the Shanghai
port
Import and transportation agent in
the Djibouti port
Main contractor on construction site
Delivery
Plan
Source
Plan Source
Delivery Delivery
PlanSource
Source
Plan
Make
Figure 10. SCOR model level 1 for precast steel structure
Steel structure manufacturer in China
Export and shipment agent in the Shanghai port
Main contractor in Chinese headquarter
Import and transportation agent in the Djibouti port
Main contractor on construction site
P1
P2
S2
D2
P4
D2S2 S2 D2
P4
S2
M2 P4
P3
Figure 11. SCOR model level 2 for precast steel structure.
The differences between the models of precast steel structure and steel bar mainly center on the
supplier’s part. Level 1 model clearly shows the “Make” operations are included in the PFSH’s job.
Level 2 also explain why “Source” operations are not suitable to precast steel structure. For steel bar,
supplier only needs to source existed and stocked steel bar for delivery when receiving the order from
the main contractor; whereas the precast steel structure manufacturers must set up production plan (P3)
and establish delivery plan (P4). These two plans should be associated with each other and according to
the project general schedule (P2 by main contractor in Chinese headquarters). After that, “Make” takes
the place of “Source”. In the case, PFSH started producing the precast steel structure according to the
production plan. During the producing period, the quality of the precast steel structure needed to be
inspected by CNBM before leaving factory. The more detail process units of precast steel structure are
showed in SCOR model level 3 in Figure 12.

40
Steel structure manufacturer in China
D2.2Receive, Enter & Validate
Order
P4.4Establish
Delivery Plan
D2.3Determine
Delivery Date
D2.4Consolidate
Order
D2.6Route
Shipments
D2.7Select Carrier
D2.8Receive Product
from Make/Source
D2.11Load
Product
D2.12Ship Product
P3.4Establish
Production Plan
Export and shipment agent in the Shanghai port
D2.13Receive & Verify by Custom
D2.2Receive, Enter & Validate
Order
D2.3Determine
Delivery Date
D2.4Consolidate
Order
D2.6Route
Shipments
D2.7Select Carrier
D2.8Receive Product
from Make/Source
D2.11Load
Product
D2.12Ship Product
P4.4Establish
Delivery Plan
S2.1Schedule Product
Deliveries
S2.4Transfer Products
S2.2Receive
Products
S2.3Verify
Products
Main Contractor in Chinese headquarter
P2.4Establish
Sourcing Plans
P1.4Establish & Com
SC plans
S2.1Schedule Product Delivery
Import and transportation agent in the Djibouti port
D2.2Receive, Enter & Validate
Order
D2.3Determine
Delivery Date
D2.4Consolidate
Order
D2.6Route
Shipments
D2.7Select Carrier
D2.8Receive Product
from Make/Source
D2.11Load
Product
D2.12Ship Product
D2.13Receive & Verify by Custom
P4.4Establish
Delivery Plan
S2.4Transfer Products
S2.2Receive
Products
S2.3Verify
Products
Main contractoron construction site
S2.2Receive
Products
S2.3Verify Products
S2.4 Transfer products
Inventory 4
Inventory 3
Inventory 2
M2.1Schedule
Production
M2.2Issue Product
M2.3Produce&
Test
M2.6Release
Product to Delivery
Inventory 1
Figure 12. SCOR model level 3 for precast steel structure
Comparing to the Level 3 model of steel bar, the Level 3 model of precast steel structure refines
the P3 to the detail process unit of establishing production plan (P3.4), and divides the M2 into four
detail process units: schedule production(M2.1), issue product (M2,2), produce and test (M2.3), and
release product to delivery (M2.6). The model indicates that the production plan should be based on

41
and followed by delivery plan (P4.4). Besides, the product producing and delivery arranging can be
operated parallel. In addition, the inventory cost in the manufacturer’s factory may happen after making
work and before delivery work (between M2.6 and D2.8).
3.2.2.2 Inventory types and costs bv. There are also four locations where the inventory cost
undertaken by the main contractor may happen in the SCOR model level 3 for precast steel structure.
The inventory cost happening in locations of Inventory 2 and 3 are the same as the steel bar because
EASH and IADJ did the same work on custom clearance and arranging transportation. However, there
are some different points in Inventory 1 and 4.
3.2.2.2.1 Inventory 1. The inventory cost will happen in PFSH’s factory if the PFSH does not
release the completed precast steel structure to delivery (M2.6) according to the established delivery
plan, but keeps the precast steel structure in the silo. Generally, the reasons for keeping the produced
precast steel structure are mainly caused by two stakeholders: one is the main contractor and the other
is the manufacturer itself. As Level 3 model presented, both a bad plan for delivery (P4.4) and a bad
plan for making (P3.4) established by the manufacturer may cause unnecessary inventory cost. The bad
quality of the precast products can also block transferring (M2.6) to delivery.
The main contractor sometimes orders the supplier to stop transferring the produced precast steel
structure to delivery and asks the manufacturer temporarily to stock the products in the silo due to some
special conditions. For example, other critical work before the work of “steel structure making and
erection” has not been completed during the leading time, when the precast steel structure is planned to
enter the site. In this case, the inventory cost of precast steel structure was higher on the site than in
PFSH’s factory, so CNBM should has preferred to keep the precast products in China and adjust the
general delivery plan. For the same reason, CNBM should has kept the precast steel structure in the

42
PFSH’s factory when there was not available ship for delivery reported by EASH. The possible reasons
causing the inventory cost of precast steel structure in manufacturer’s silo are showed in Table 6.
Table 6
Factors Influencing the Inventory Cost of Precast Steel Structure in the Location of Inventory 1
3.2.2.2.2 Inventory 4. The inventory cost will happen on site if the precast steel structure is
stocked on the site without transferring them for the work of steel structure making and erection.
Commonly, the first reason is the skilled workers or working tools enter the site later than the precast
steel structure. Organizing enough qualified workers to enter the site on time is always the critical
factor influencing the inventory cost. The reasons leading to workers entering the site late include the
visa or flight ticket problems that should be handled by the main contractor, and the organization
problems that should be figured out by manufacturers.
Besides, the steel structure cannot be made and erected on the production line because the
previous critical work has not been completed. In this case, the previous critical work was the main
civil construction, so the delay of the completion of civil work directly resulted in the inventory cost of
the precast steel structure.
It is to be observed that the manufacturer can make up the inventory cost loss of Inventory 1 on the
construction site. If the manufacturer’s skilled workers work more effectively and complete the
“making and erection work” before the latest finishing date, they will save the estimated inventory cost
Inventory cost issues Reasons caused by each possible stakeholder
CNBM PFSH
Precast steel structure
was stocked in the
manufacturer’s silo
Order to stop transferring to delivery
due to high inventory cost in other
locations, such as on site or in the
Shanghai port
Bad “make” plan
Bad “delivery” plan
Bad quality

43
and remedy the increased inventory cost happening in the location of Inventory 1. That is another
advantage of subcontracting the whole erection work to one manufacturer.
3.2.3 Vertical mill. Vertical mill is one of the most important main production equipment on a
cement production line. In this case, the vertical mill was the core equipment of the raw material
grinding workshop. It was used to grind the raw materials of clinkers, such as limestone. For this
reason, all of other work (civil construction work and steel structure erection work), and other
equipment (electrical equipment and mechanical equipment) serviced for vertical mill. Due to the
importance of vertical mill, the vertical mill engineering must obey the requirements from DMCC and
be approved by HOLT. At the same time, the possible suppliers must be approved by DMCC and HOLT,
but not be decided by CNBM only. So the owner and consultancy have a hand in the procurement of
main plants. The qualified and approved supplier of vertical mill should be competent to engineer,
produce and deliver.
Due to the complicated technics and critical functions in the cement production line, commonly
the vertical mill suppliers need to provide some engineering advice to the main contractor based on
their professional technic background. Meanwhile, the suppliers may provide some matched
mechanical and electrical parts for erecting the vertical mill into the production line. More than that,
the supplier always dispatches professional erecting engineers for guiding and directing the erection of
vertical mill on project sites. So the supplier of vertical mill is also involved into the procurement
process and the erection work on site.
Another specific condition in the vertical mill procurement is its logistic process. The international
reputed suppliers of vertical mill are always come from Europe, so they always are responsible for the
shipment from their countries to the project located country. In this case, the vertical mill supplier

44
coming from German (LEOG) was responsible to deliver the completed vertical mill from German
directly to the Djibouti port. The IADJ received the plant at the port, noticed to CNBM and delivered it
to the site. After that, CNBM working on the site took charge of the unloading and inventory of vertical
mill. The procurement process of vertical mill is showed in Figure 13.
Main contractor submits the preliminary engineering of vertical mill to the consultancy based on the capacity requirement from the owner
Import agent receives the vertical mill, transacts the custom clearance and delivers them to the construction site using related documents provided by the main contractor
Main contractor working on site unloads and stores the mill under the direction of professional engineers, at the same time prepares the erection work.
Approved by consultancy
If yes, main contractor sets up list of suppliers based on the final engineering and submits it to the owner and consultancy
If no, main contractor has to revise the engineering till approved
Main contractor sends the final engineering documents to reputed suppliers in the list for asking submittals on technical part
Main contractor receives the technical submittals and evaluates each one of them
Approved by the main contractor
If yes, main contractor asks suppliers for submittals on the commercial part including the quotation
The supplier produces the vertical mill based on its engineering and production plan
The supplier delivers the vertical mill and matched parts to the Djibouti port, as well as arranges professional engineers to work on construction site for guiding unload, inventory and erection work
Approved by the owner and consultancy If no, main contractor has to revise the list of suppliers
till approved
If yes, main contractor sets up procurement plan based on the final engineering and list of suppliers
If no, main contractor gives notice to the suppliers who do not pass the evaluation.
Main contractor receives the commercial submittal and negotiates the offer with suppliers
Main contractor signs the procurement contract with the qualified supplier after negotiation and comparatives
Selecting supplier process
Vertical mill
produce and
delivery process
Figure 13. Procurement process of vertical mill

45
3.2.3.1 SCOR model configuration. Figure 13 indicates that EASH working for CNBM was not
involved into the delivery process of vertical mill. It means that there are 4 stakeholders in the supply
chain network: LEOG in Germany factory, CNBM in Chinese headquarters, IADJ in the Djibouti port
and CNBM on construction site. The SCOR model Level 1 and 2 are showed in Figure 14 and 15.
Except for the lack of location of the Shanghai port, the elements in Level 1 and 2 are almost the
same to the one belonging to precast steel structure. But the detail process units divided from M3, D3
and S3 will be different because the vertical mill is a kind of ETO product. The SCOR model level 3
with different process units and detail steps is showed in Figure 16.
Supplier in Germany factory
Main contractor in Chinese headquarter
Import and transportation agent in
the Djibouti port
Main contractor on construction site
Delivery
Plan Source
Delivery
PlanSource
Source
Plan Make
Figure 14. SCOR model level 1 for vertical mill
Supplier in Germany factory
Main contractor in Chinese Headquarter
Import and transportation agent in the Djibouti port
Main contractor on construction site
P1
P2
S3
D3 S3 D3
P4
S3
M3
P4
P3
Figure 15. SCOR model level 2 for vertical mill.
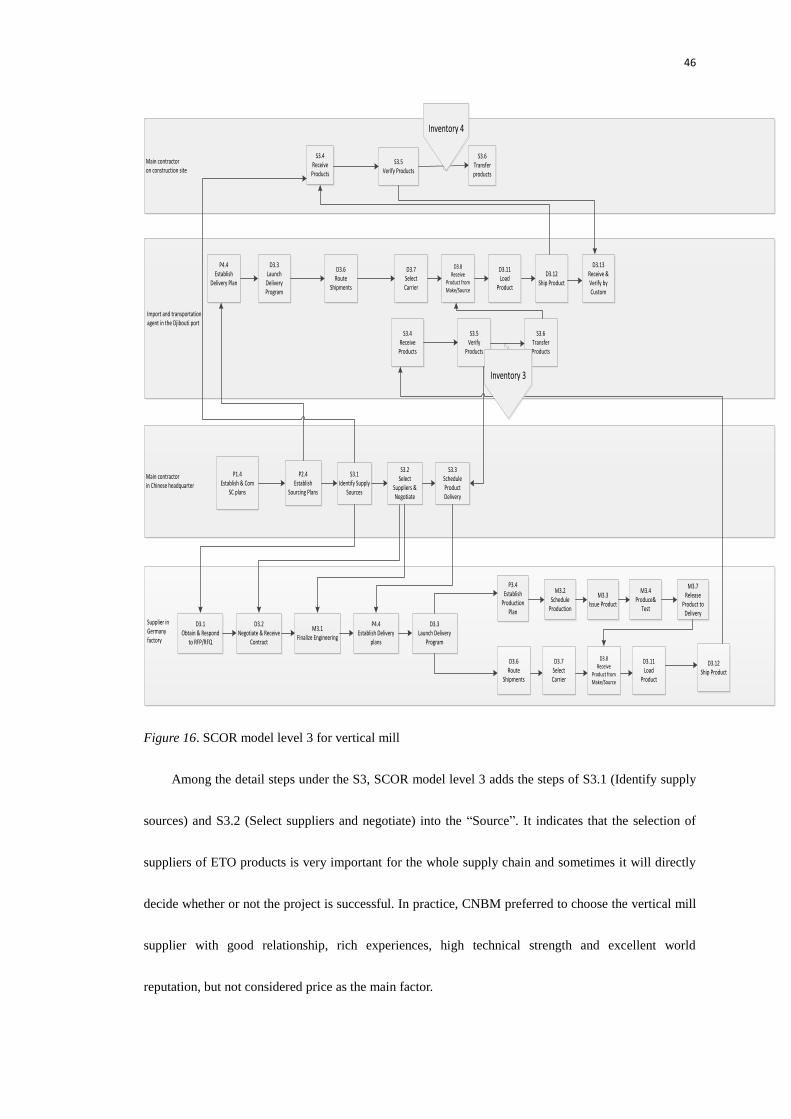
46
Supplier in Germany factory
D3.6Route
Shipments
D3.7Select Carrier
D3.8Receive
Product from Make/Source
D3.11Load
Product
D3.12Ship Product
P3.4Establish
Production Plan
Main contractor in Chinese headquarter
P2.4Establish
Sourcing Plans
P1.4Establish & Com
SC plans
S3.1Identify Supply
Sources
Import and transportation agent in the Djibouti port
D3.3Launch Delivery Program
D3.6Route
Shipments
D3.7Select Carrier
D3.8Receive
Product from Make/Source
D3.11Load
Product
D3.12Ship Product
D3.13Receive & Verify by Custom
P4.4Establish
Delivery Plan
S3.6Transfer Products
S3.4Receive
Products
S3.5Verify
Products
Main contractoron construction site
S3.4Receive
Products
S3.5Verify Products
S3.6 Transfer products
Inventory 4
Inventory 3
M3.2Schedule
Production
M3.3Issue Product
M3.4Produce&
Test
M3.7Release
Product to Delivery
S3.2Select
Suppliers & Negotiate
D3.1Obtain & Respond
to RFP/RFQ
D3.2Negotiate & Receive
Contract
M3.1Finalize Engineering
P4.4Establish Delivery
plans
D3.3Launch Delivery
Program
S3.3Schedule Product Delivery
Figure 16. SCOR model level 3 for vertical mill
Among the detail steps under the S3, SCOR model level 3 adds the steps of S3.1 (Identify supply
sources) and S3.2 (Select suppliers and negotiate) into the “Source”. It indicates that the selection of
suppliers of ETO products is very important for the whole supply chain and sometimes it will directly
decide whether or not the project is successful. In practice, CNBM preferred to choose the vertical mill
supplier with good relationship, rich experiences, high technical strength and excellent world
reputation, but not considered price as the main factor.

47
The owner always likes to approve the main contractor to buy the ETO products from
international famous company in order to guarantee the project quality. It is worthy to mention that the
relationship with ETO products, such as vertical mill, supplier is very important to the main contractor
because the supplier make the product based on its own engineer, own parts, own standard and own
schedule. The main contractor must prepare or adjust the project general schedule basing on the
completed schedule of ETO products; at the same time it is very hard for the main contractor to control
the supplier’s production, especially when the supplier comes from other countries.
In the case, not only adding the new steps under the S3 for CNBM, the new steps D3.1 and D3.2
for LEOG were also added into the “Delivery” process. It also emphasized the importance of the
process of confirming the supplier. In the “Make” process, M3.1 (Finalize engineering) is added before
the step of planning the delivery plan. It accounts for the engineering for the vertical mill was the
precondition of setting up plans of production and delivery. Without qualified and approved
engineering, LEOG could do nothing.
3.2.3.2 Inventory types and cost. The supply chain model of vertical mill indicates that there may
be two locations where inventory cost will happen, one is in the Djibouti port (Inventory 3) and the
other is on the site (Inventory 4). The inventory costs happening in the locations of Inventory 1 and 2
are not applied to vertical mill, because the vertical mill is delivered to the Djibouti port by LEOG
directly.
3.2.3.2.1 Inventory 3. The inventory cost may happen because of the same reasons as the steel bar
and precast steel structure. A special issue worth noticing is that some ETO products are very big with a
large amount of weight. The floating cranes in some African countries’ ports are small and do not have
enough capability to lift up and down the huge ETO products. In this case, the vertical mill needed to
48
be lifted by three floating cranes and transported by special vehicles to the site. It needed more time to
wait for multiple floating cranes and special vehicles to be available. Therefore, the huge ETO products
sometimes cause more inventory cost in the import port.
3.2.3.2.2 Inventory 4. Figure 3 shows that the vertical mill and some specialized machines were
planned to enter the site before 03/31/08. Without overmuch considering the leading time for inventory,
the erection work for the vertical mill started on 04/01/08. Meanwhile, before starting the erection work
of vertical mill, the civil construction work and steel structure making and erection work had to be
completed. If not, the inventory cost of the vertical mill might happen when waiting for the completion
of these two types of work.
3.2.4 Contribution of the SCOR models. The SCOR model has described the procurement
processes from 3 levels in systematic networks separately for steel bar, precast steel structure and
vertical mill. The three levels’ models help the main contractor to identify each step in the supply
chains of the procurement processes in an international EPC project and the correlations among all the
steps.
Besides, the SCOR models can help the main contractor to check the procurement status
associated with the project schedule. For example, the project schedule in Microsoft Project can tell
what time the product enter the Shanghai Port; while the SOCR model level 3 can show the “Source”
steps on the port including receiving, verifying and transferring, which is more detail and concrete to
describe the process and let the main contractor know what the real condition and position the product
is at that point.
Moreover, the SCOR models help the main contractor to find the possible locations occurring
inventory cost and factor influencing inventory cost in the whole supply chain. In this case, inventory

49
cost of steel bar and precast steel structure may happen in four locations in the supply chain; while the
vertical mill inventory cost only may happen in two locations. At the same time, the factors influencing
the inventory cost can be found in the steps near the locations.
In addition, the SCOR models can help the main contractor to accelerate the transaction. Through
analyzing the factors influencing the inventory cost at different locations, it is observed that the more
flexible the transaction constraints, the faster the transaction operation, and the lower the inventory cost
happening in the supply chain. Some good examples happened in the case study. As we know, in order
to decrease the inventory cost of the vertical mill, the PFSH had to work harder to complete the
erection of the steel structure. A constraint to complete the work in a shorter time is the lack of more
skilled workers. PFSH dispatched more workers to work on the site to make the constraint flexible, and
then the inventory cost decreased in the end. The maximum lifting capability in the Djibouti port is
another constraint to the step of “verifying the vertical mill” entering port. IADJ communicated with
the port office in advance and arranged the special vehicle to wait near the ship. The port office
arranged three floating cranes together to lift the vertical mill and load directly on the vehicle, and then
the vehicle delivered the vertical mill to the site without storing the vertical mill in the port. The special
arrangement made the constraint flexible and saved the inventory cost and secondary loading fee.
CNBM should also understand that the cargo documents are the constraints to transact the custom
clearance for the steel bar in the “Source” of Level 3 model. Choosing only one import agent is easy to
make the constraint more serious.
At last, the SCOR models can help the main contractor to improve communication through
controlling and managing the information flow with other stakeholders. In the case, effective
communication with PFSH helped the CNBM adjust the delivery plan at any suitable time. Bad

50
communication broke the relationship with the previous import agent and result in transaction
constraints. Communication exists in the operation of nearly every step in supply chain models. The
information flows make the direction of communication clear and guarantee the information visible.
3.3 MonteCarlito Simulation Analysis
3.3.1 Introduction. As mentioned before, the performance measure selected for the supply chain
analysis is inventory cost. Table 7 shows the inventory costs occurring at the four locations for the three
products. The inventory cost had been estimated and planned twice. The first time was at the beginning
of the project (P1), and the other time was during the project operation (P2). The actual costs are listed
under the C column.
The inventory costs under P1 and P2 for the steel bar in the location of Inventory 3 were both zero;
however, the actual inventory cost (C) for the steel bar in Inventory 3 was 48,000 USD. The inventory
cost was due to irrelevant causes; it was due to the bad relationship between the original import agent
and CNBM. The import agent did not transact the custom clearance work of the steel bars and kept
them in the Djibouti port for nearly 2 months, which resulted in a serious delay for the steel bar to enter
the site, and led to unpredicted delay in starting the work of main civil construction. The total actual
inventory cost of the vertical mill (3,760 USD) did not exceed the planned inventory cost (3,800 USD
under P1 and 3,900 USD under P2), and was almost the same as the planned cost. This good
performance was because CNBM hired a new import agent (IADJ), who worked very well and
decreased the inventory cost compared to plan. Besides, PFSH did very well in the work of making and
erecting steel structure on the site, which caught up on the schedule and avoided the vertical mill
waiting for a long time on the site.

51
Table 7
Inventory Cost at Different Locations: Planned Cost at the Beginning (P1), Planned Cost During
Operation (P2), and Actual Cost (C).
Based on the above analysis, the steel bar and vertical mill will not be considered in the
simulation. The simulation only focuses on the inventory cost that the main contractor should manage
and undertake. In the case, to catch up on the project schedule and prevent the same delay from
happening again, CNBM ordered PFSH to start delivering this batch of precast steel structure on
11/18/07, which was 17 days earlier than the planned date (12/05/07). However, the early delivery plan
did not really catch up on the schedule, and resulted in an actual inventory cost of 7,840 USD for the
precast steel structure in the location of Inventory 4, which exceeded the planned cost (4,800 USD
under P1 and 2,880 USD under P2). Therefore, the simulation only chooses the precast steel structure
to analyze its supply chain.
3.3.2 Simulation model. Based on this real case, a simplified supply chain model of the precast
steel structure is established to describe the procurement process from the manufacturing factory to the
construction site. This supply chain diagram used for simulation is showed in Figure 17.
Item Inventory cost of each products in different locations (USD)
Inventory 1 Inventory 2 Inventory 3 Inventory 4
P1 P2 C P1 P2 C P1 P2 C P1 P2 C
Steel bar 0 0 0 0 0 0 0 0 48000 3000 1500 0
Precast
steel
structure
0 0 0 0 0 0 400 0 0 4800 2880 7840
Vertical
mill
800 800 160 3000 3100 3600
Total 0 0 0 0 0 0 1200 800 48160 10800 7480 11440

52
Factory silo Site silo
T1start T1end
T1duration
T2start T2endT2duration
T3end
Figure 17. The logical diagram of precast steel structure supply chain used for simulation
The supply chain simplifies the original precast steel structure supply chain model of the
procurement process in Figure 12. In this simulation model, there are only two inventory locations: the
factory silo (Inventory 1) and the site silo (Inventory 4). It neglects the Shanghai port and Djibouti port,
where inventory cost rarely occurred during the project’s operation. The delivery records of 11 batches
of precast steel structure are showed in Table 8, which reports the transportation and transaction
duration after each batch of precast steel structure left the factory.
The data in the first column will affect the inventory cost occurring in Inventory 1. If the starting
delivery date is earlier than planned, there will be no inventory cost happening in the factory silo.
Conversely, if the starting delivery date is later than planned due to CNBM, the inventory cost will
happen. The actual starting delivery date will be a variable in the inputs of the simulation.
The data in the third and fifth columns will separately affect the inventory cost occurring in
Inventory 2 and Inventory 3. Because the standard stocking free time in the Shanghai port and the
Djibouti port is 7 days and 15 days, only the eighth batch of precast steel structure had a one-day
inventory time in the Shanghai port. At the same time, the whole 11 batches of precast steel structure
only had five days of total inventory time in the Djibouti port, and in many cases, port administrators
do not charge for exceeding the standard stocking free time by one or two days if the agent has a good

53
relationship with the port administrators. Based on the above two reasons, this supply chain model
neglects the inventory time in these two ports and pays more attention to the inventory time happening
in the factory and on the site.
Table 8
Starting Delivery Date and Delivery Time (in days) for the 11 Batches of Precast Steel Structure
Batch of
precast
steel
structure
Column 1
Column 2 Column 3
Column 4 Column 5 Column 6 Column 7
Starting
delivery
date
compared
to plan
To
Shanghai
port
In Shanghai
port
Shipping In Djibouti
port
To
construction
site
Total
delivery
time
1 17 days
early
2 6 30 14 3 55
2 20 days
late
1 4 30 11 3 49
3 21 days
late
3 7 35 15 3 63
4 18 days
late
2 6 37 15 3 63
5 24 days
late
2 6 37 15 3 63
6 15 days
late
4 7 40 16 5 72
7 20 days
late
3 7 38 15 4 67
8 19 days
late
4 8 46 17 6 81
9 23 days
late
3 7 44 16 4 74
10 22 days
late
2 6 35 14 3 60
11 18 days
late
4 7 45 16 4 76
Note. The information in the table is from the actual delivery schedule of the Ethiopian cement project
(CNBM 2007). Column 1, 3, 5, and 7 will affect the inventory cost at Inventory 1, 2, 3, and 4, but not
the real inventory time.
The data in the seventh column is the sum of the data from the second column to the sixth column,

54
and represents the total delivery time from the PFSH factory to the site. It will affect the inventory cost
occurring in Inventory 4. When the main civil construction work has not been completed in accordance
with the schedule, the short delivery time will result in inventory cost occurring on the site, because the
precast steel structure has to wait for the completion of civil main construction. The delivery time will
be a variable in the inputs of the simulation.
3.3.3 Purpose of the simulation. Assume performance of supply chain based on the inventory
cost. The MonteCallito simulation tool will be used and applied to the precast steel structure.
3.3.4 Variables and parameters of the inputs. The framework of the precast steel structure
supply chain simulation model is showed in Figure 18, which consists of input, transitional output, and
output. The transitional outputs are generated by the simulation model based on the inputs and used to
calculate the outputs of the model together with the inputs. There are eight inputs in the framework,
including four variables and four parameters.
The “Planned time to leave factory (T1start)” is a parameter. According to the date from the real
case, the date was 12/05/2007. The simulation identifies this date as the parameter value “0.”
The “Waiting duration in factory (T1duration)” is a variable. It means the duration of waiting the
delivery order from the main contractor. The value is confirmed by comparing the “T1duration” to
the “T1start.” For example, if the main contractor orders the precast steel structure to leave
factory on 12/06/2007, the value of “T1duration” is equal to “1;” on the contrary, if the main
contractor changes the leaving date on 12/04/2007, the value of “T1duration” is equal to “-1.” The
range of “T1duration” is from “-20” to “58.” The minimal value is “-20,” because the precast steel
structure finishing production date was 11/15/2007, which is 20 days earlier than the “T1start.” In
other words, “-20” represents the first day when the precast steel structure is available to start

55
delivery. The maximum value is “58,” because if the order delivery date is later than 02/01/2008,
the whole project will stop to wait for this batch of precast steel structure, so the whole project
schedule will be definitely delayed again. In other words, “58” represents the last day when this
batch of steel structure must leave the factory. The “T1duration” follows a uniform distribution,
which is used for the situation when we cannot confirm the probability of picking out a value in a
range. The possibility selecting a value from “-20” to “58” as the date of leaving factory is
unknown, so “T1duration” can be identified as the uniform distribution with the range of -20–58.
The “Delivery starting time (T2start)” is a variable and it has the same value to “T1end.” As
discussed above, the precast steel structure supplier started delivering the products once receiving
the order from the main contractor.
Input
1. Planned time to leave factory
(T1start—12/05/2007)2. Waiting duration in factory (T1duration)3. Delivery starting time (T2start)4. Delivery during time (T2duration)
5. Civil work start time (T3start—11/21/2007)6. Civil work during time (T3duration)7. Unit inventory cost at factory (P1)8. Unit inventory cost on site (P2)
Simulation model
Transitional output
1. Inventory time in factory (waiting time for order)2. Actual time to leave factory (T1end)3. Delivery end time (T2end)4. Civil work end time (T3end)5. Inventory time on site (waiting for T3end)
Output
1. Inventory cost in the factory (IC1)2. Inventory cost on site (IC2)
3. Total inventory cost(TIC)
Figure 18. Framework of the simulation model used to describe the input, transitional outputs, and
output, as well as their relationships
The “Delivery during time (T2duration)” is the duration from the precast steel structure leaving

56
factory to entering the site. The supply chain model simplifies the delivery from five specific
processes to one general process. Table 8 describes that there are five delivery durations,
including duration of delivering to the Shanghai port, duration of delivering onto a ship, duration
of delivering to the Djibouti port, duration of delivering onto a vehicle, and duration of delivering
to the site. All of these five durations can be considered as the activity duration in the construction
project, so the total inventory time consisted by these five durations also belongs to activity
duration. As mentioned in the literature review about the application of triangular distribution, it is
decided to use triangular distribution for the data to analyze the T2duration. Based on the data in
the last column of Table 8, we can see the mode is “63,” the upper limit is “81,” and the lower
limit is “49.” So these three values are used to identify the triangular distribution of the
“T2duration (49, 63, 81).”
The “Civil work start time (T3start)” is a parameter. It is the second day after the steel bar entering
site. In the case, the date of steel bar entering site was 11/20/2007, so date of “T3start” should be
on 11/21/2007. Comparing to the “0” value of the “T1start”, the value of “T3start” should be
“-15.”
The “Civil work during time (T3duration)” is a variable. It belongs to a kind of construction
activity duration, so it also can be represented by triangular distribution for the same reasons as
“T2duration”. Based on an interview with 20 experienced engineers about how long the civil
construction work of the raw material grinding workshop took to complete in their projects, “90,”
“103,” and “123” are identified as the lower limit, mode, and upper limit. The interview results
about the project name and the finishing time of the civil construction work of raw material
grinding workshop are showed in Table 9.

57
The last two inputs—inventory unit costs at factory and on site—are viewed as two parameters.
Their values are 80 USD/day and 160 USD/day in the real case.
The variables and parameters are presented in Table 10 with their descriptions, values, and units.
Table 9
Actual Civil Construction Finishing Time of the RMGEGT Workshop in 15 Cement Projects
No. Project name Finishing time of civil construction
work of the raw material grinding
workshop (days)
1 Derba Midroc Cement Project 103
2 Pakistan Lucky Project (line 1) 123
3 Pakistan Lucky Project (line 2) 98
4 Najran Cement Project (Phase I ) 110
5 Najran Cement Project (Phase II ) 99
6 North Region Cement Project 90
7 Berber Cement Project 113
8 Atbara Cement Project 103
9 Al Mafraq Cement Plant 96
10 Ali Abdullah Alesayi Cement Project 107
11 Al-Douh Cement Plant 103
12 Northern Jordan Cement Plant 96
13 Pakistan Attock Project (line 1) 118
14 Pakistan Attock Project (line 2) 103
15 Fezan Wadi Alshati Mahrug Cement Project 120
Note. The information in the table is from an interview to 20 experienced engineers

58
Table 10
Description list of the Variables and Parameters
Symbol Attribute Unit Description Values or
distribution
T1start Parameter day Planned time to leave the factory 0 for 12/05/2007
T1duration Variable day Duration of waiting for the delivery order in the
factory
-25–58 (Uniform
Distribution)
T2start Variable day Start delivery date Equal to T1end
T2duration Variable day Delivery during time 49,63,81
(Triangular
Distribution)
T3start Parameter day Start date of the civil construction work -15 for 11/21/2007
T3duration Variable day Civil construction finishing time 90,107,123
(Triangular
Distribution)
P1 Parameter $/day Unit inventory cost in the factory 80
P2 Parameter $/day Unit inventory cost on the site 160
3.3.5 Transitional outputs and the inventory cost decision rules. There are two locations where
inventory time is designed to happen in the simulation model, as showed in Figure 17. The first
inventory time happening in the factory silo depends on the “Duration of waiting for the delivery order
in the factory (T1duration),” which means the time period that the precast steel structure supplier waits
for the delivery order coming from the main contractor. If the duration is a value from “-20” to “-1,” it
means the delivery order happens before the “Planned time to leave the factory,” and the inventory time
in the factory will not happen and is equal to “0,” because stocking the products before the planned
leaving date is the responsibility of the supplier. On the contrary, if the duration value is a positive
value from “1” to “58,” it means the order happens later than the plan. In this situation, the inventory

59
time will happen and it is equal to the positive value, because the main contractor intends to delay the
leaving date. The simulation identifies the “Waiting time for order” in Excel to present the inventory
time in the factory.
The second inventory time happening on the site depends on the time when the precast steel
structure enters the site and when the civil work is completed. The entering site time is identified as the
“Delivery end time” in the simulation model and represented as the “T2end” in Excel; while the civil
work finishing time is identified as the “Civil work end time” and represented as the T3end in Excel. If
the T2end value is larger than the “T3end” value, the inventory time on site will not happen and is
equal to “0.” When the precast steel structure enters the site, the civil work has been completed and the
steel structure work can be directly used on the working site for the critical follow-up work of “steel
structure making and erecting.” On the other hand, if the “T2end” value is smaller than the “T3end”
value, the inventory time on site will happen and is equal to the value of (“T3end” - “T2end”). When
the precast steel structure enters the site, the civil work is under construction. The precast steel
structures have to be stocked in the silo until the completion of civil work, because the civil work is on
the critical path and before the steel structure making and erecting work as showed in Figure 3. The
simulation identifies the “Waiting time for T3end” in Excel to present the inventory time in the silo on
site.
3.3.6 Simulation data and results. According to the above discussion on the inputs, decision
rules, and logical relationship on the supply chain, the simulation model is established in Excel and
operated by the MonteCarlito simulation tool. Figure 19 is the Excel spreadsheet for the simulation.

60
Figure 19. Data and results of simulation.
At first, the simulation model randomly extracts 600 samples (from 1 to 600 in Column A). The
results of the last 100 samples (501–600) are chose as the stable values to calculate the important
output in the column of summary statistic. And then, four critical performance measures related to
inventory cost are selected to put in the MonteCarlito simulation tool. They are “average waiting time
in the factory (23),” “average waiting time on the site (13.25),” “average total inventory cost (3972.8),”
and “the probability of total inventory cost more than 4800 USD (24%).” Overall, the simulation runs
the four results 400 times by the MonteCarlito tools and the simulation results are obtained in Figure
20. After running the MonteCarlito simulation for 400 times, the mean (X) and standard deviation (SD)
of the four performance measures are obtained, which are highlighted in Figure 20. By the results of
the X and SD, the confidence interval (CI) can be calculated as showed in Figure 20. The calculating
methods and the discussion based on the CIs will be described.
Inventory cost Simulation Model Summary StatisticsNumber n 100
T1 order duration (Uniform Distribution) Planned start leaving date12/05/2007 0 Number Waiting in the factory 81 MonteCarlito day day $ %
Smallest Value-20 Probability of Waiting in factory 0.81 avg waiting time in the factoryavg waiting time on siteavg TIC Prob >4800
Largest Value58 T3 Start date 11/21/2007 -15 Average Waiting Time in factory 23 1 -400 23.00 13.25 3972.80 24.00%
Number Waiting > 10 days 62 Mean 21.20 14.24 4016.66 23.33%
T2 duration (Triangular Distribution) Unit cost in the factory 80 Standard error 0.10 0.08 8.06 0.20%
Lower 49 Number Waiting on site 56 2 Median 21.00 14.21 4023.20 23.00%
likely 63 Unit cost on the site 160 Probability of Waiting on site 0.56 3 Standard deviation1.95 1.58 161.21 4.03%
Upper 81 Average Waiting Time on site 13.25 4 Variance 3.80 2.49 25988.11 0.16%
Planned inventory cost 4800 Max Waiting Time on site 63 5 Skewness 0.17 0.11 0.17 12.58%
T3 duration (Triangular Distribution) 6 Kurtosis 2.95 3.17 3.11 319.04%
Lower 90 Average IC1 1685.44
likely 103 Average IC2 2120 -CI 17.2952692 11.08946232 3694.2474 14.824389504989700%
Upper 123 Average TIC 3972.8 +CI 25.09 17.40 4339.08 31.825610495010300%
Number TIC>4800 24
Simulation Probability of over burget 0.24
T1Start T1Duration T1End Waiting time for order T2Start T2DurationT2End Waiting for T3 End T3Start T3Duration T3End IC1 IC2 TIC
1 0 -7 -7 0 -7 49 42 46 -15 103 88 0 7360 7360
2 0 16 16 16 16 66 82 6 -15 103 88 1280 960 2240
3 0 27 27 27 27 69 96 6 -15 117 102 2160 960 3120
4 0 52 52 52 52 59 111 0 -15 97 82 4160 0 4160
5 0 -4 -4 0 -4 58 54 27 -15 96 81 0 4320 4320
6 0 41 41 41 41 56 97 0 -15 102 87 3280 0 3280
7 0 49 49 49 49 66 115 0 -15 97 82 3920 0 3920
8 0 40 40 40 40 68 108 0 -15 92 77 3200 0 3200
9 0 31 31 31 31 68 99 0 -15 111 96 2480 0 2480

61
Figure 20. Simulation results of four performance measures of average waiting time in the factory silo,
average waiting time in the site silo, average total inventory cost (avg TIC) and probability of the
inventory cost higher than 4,800 USD (Prob>4800).
3.3.7 Discussion of results. The CI can indicate that the true mean of the performance measure is
a value between the intervals with 95% confidence. For the first three performance measures about
time and cost, the CI can be calculated through the simulation results of mean (X) and standard
deviation (SD) by Formula 1. For the fourth performance measure about the probability of inventory
cost higher than 4,800 USD, the CI can be calculated through the simulation results of mean (P) by
Formula 2
CI(time or cost)= X±t(0.05,99) σX = X±2SD (1)
CI(prob)=P±z(0.975) σP = P±2√P(1 − P)/99 (2)
For the performance measure of “average waiting time in the factory”, Figure 20 shows that the X
is equal to 21.20 and the SD is equal to 1.95, so the CI is between 17 and 25. It means that we have 95%
confidence that the true mean of the “average waiting time in the factory” is between 17 days and 25
days. Using the same method, Figure 20 includes the calculated CIs for each performance measure. The
CI of “waiting time on the site” is between 11 and 17; and it indicates that we have 95% confidence
that the true mean of waiting time on the site is between 11 days to 17 days. The CI of “average of
“TIC” is between 3694 and 4339; it can be explained that we have 95% confidence that the true mean
of the TIC is between 3694 USD and 4339 USD.
MonteCarlito day day $ %
avg waiting time in the factoryavg waiting time on site avg TIC Prob >4800
1 -400 23.00 13.25 3972.80 24.00%
Mean 21.20 14.24 4016.66 23.33%
Standard error 0.10 0.08 8.06 0.20%
2 Median 21.00 14.21 4023.20 23.00%
3 Standard deviation 1.95 1.58 161.21 4.03%
4 Variance 3.80 2.49 25988.11 0.16%
5 Skewness 0.17 0.11 0.17 12.58%
6 Kurtosis 2.95 3.17 3.11 319.04%
-CI 17.29526924 11.08946232 3694.24744 14.824389504989700%
+CI 25.09 17.40 4339.08 31.825610495010300%

62
Based on Formula 2, the CI of “the probability that total inventory cost more than 4800” is
between 14.82% and 31.83%. It indicates that we have 95% confidence that the true mean of the
probability exceeding the planned total inventory cost is between 14.82% and 31.83%.
The validation refers to testing the computer program to ensure the simulation is correct.
Specifically, it is also a check to see whether the simulation adequately represents the real system
(Chase, Jacobs, Aquilano, & Ren, 2006). The CI of the “inventory time in the factory” indicates that the
main contractor made an incorrect decision to order the first batch of precast steel structure earlier than
plan as showed in Table 8. Moreover, the first column of Table 8 also shows the actual inventory time
in the factory happened to the follow-up 10 batches of precast steel structure in the real case. The range
of the actual inventory time of these 10 batches of precast steel structure is from 15 days to 24 days,
and the inventory time 15 days only occurred once. In other words, the range of the actual inventory
time of the precast steel structure in the factory is very close to the CI result (17–25) calculated by the
MonteCarlito simulation tool.
The confidence interval of average waiting time in the factory (17–25) can indicate that the main
contractor has enough time to adjust the delivery plan when the previous critical work is delayed. It
also tells the main contractor that hurrying the suppliers to complete producing materials earlier than
the planned schedule is not advisable. When the main contractor plans to delay the leaving date, it
should give more time to the suppliers to complete the production. Extending the production time
between the confidence interval will not influence the project schedule, and it can increase the
production quality and enhance the relationship with the suppliers. Meanwhile, the confidence interval
suggests that the main contractor should negotiate with the supplier to extend the time that the
inventory is free in the factory before signing the contract. In this case, if the free time had been

63
extended to 26 days (12/31/2007), the inventory cost in the factory would have decreased significantly.
Generally speaking, it is very hard to make just-in-time delivery in international EPC projects, so
stocking products on the construction site is very common. The confidence interval of waiting on the
site (11–17) is an accepted range for project management. Especially when some materials are not
available enough in the market, stocking a certain amount of such materials is very necessary in
practice. When establishing the construction schedule, two or three weeks’ inventory safety backup
should be considered, and it is very common to see in the real project.
The confidence interval of the average waiting time on the site (11–17) indicates that decreasing
the civil work duration time is a very useful and direct method to reduce inventory cost on the site. If
we want to complete the civil work in a shorter time, the main contractor should increase the working
productivity of the civil work sub-contractor
The confidence interval of the average total inventory cost (3,839–4,175) indicates that there is 95%
confidence that the true mean of the total inventory cost will not exceed the planned total inventory
cost (4,800). Not only that, we also have 95% confidence that the true mean of total inventory cost will
be less than the plan. The results tell us that the main contractor can prepare a low-cost plan with less
predicted inventory cost. It is very helpful to decrease the bidding price when negotiating with the
owner to win a project. It is also benefit to increase the profit due to the low-cost plan.
3.3.8 Sensitivity analysis. The simulation model for the supply chain of precast steel structure
undergoes sensitivity analysis to determine how the three variables—T1duration, T2duration and
T3duration—affect the total inventory cost in the two locations. To conduct the sensitivity analysis with
respect to these three variables, three different scenarios are considered to each variable. The three
scenarios of T1duration are “likely duration,” “bad duration,” and “good duration.” The three scenarios

64
separately for T2duration and T3duration are “good duration,” “middle duration,” and “bad duration.”
These different scenarios for each variable are showed in Table 11.
Table 11
The Scenario and its Draft Description of the T1duration, T2duration, and T3duration
Variable Scenario code Scenario name Distribution Values
T1duration
T11 Likely duration Uniform -20–58
T12 Bad duration Uniform -20–0
T13 Good duration Uniform 10–30
T2duration
T21 Good duration Triangular 49, 55, 60
T22 Middle duration Triangular 61, 63, 70
T23 Bad duration Triangular 71, 76, 81
T3duration T31 Good duration Triangular 90, 96, 101
T32 Middle duration Triangular 102, 103, 110
T33 Bad duration Triangular 111, 118, 123
3.3.8.1 T1duration. The first factor to be investigated was the duration waiting the delivery order
from the main contractor. T1duration is based on uniform distribution with the range -20–58. It means
that the duration can be any value in this range. In other words, it is the most likely range. So the
“likely duration” for T1duration is -20–58. The “bad duration” is identified as the initial transportation
dates that may cause the total inventory cost to exceed the plan. According to the case study, when the
precast steel structure left the factory 17 days earlier than plan, the total inventory cost exceed the plan.
So “bad duration” is identified to be the range -20–0. The “good duration” is identified as the initial
transportation dates that may not cause the total inventory cost over budget. Table 8 shows the range of
inventory time in the factory from the second batch of precast steel structure to the last batch is from 15
to 24, and the total inventory cost that happened in the two locations did not exceed the plan in the
practice. Considering more possible dates that may satisfy the situation of “good duration,” this range
is identified to be 10–30.
3.3.8.2 T2duration. The second factor to be investigated was the “delivery during time,” which

65
obeys the triangular distribution with the mode of 63, upper limit of 81, and the lower limit of 49.
Three different scenarios about duration are established to contact the sensitivity analysis. The first
scenario is the “good duration,” which means that the precast steel structure is delivered from factory to
site within a shorter time. It also obeys triangular distribution and needs three values to identify the
distribution. Based on the real project data in Table 8, the shortest time delivering from factory to site
is 49 days and the mode is 63 days. So the lower limit and upper limit for “good duration” are
identified to be 49 and 60. The mode of “good duration” is identified as the value of 55 because the
T2duration is 55 days for the first batch of precast steel structure. The other two scenarios are the
“middle duration,” and the “bad duration,” which mean that the precast steel structure is delivered from
factory to site within a normal time and a long time. The identification of the three values for the
“middle duration” and the “bad duration” triangular distribution applies the same method to the “good
duration” and also refers to the real project data in Table 8. So the “middle duration” obeys the
triangular distribution with the mode of 63, the upper limit of 70 and the lower limit of 61; the “bad
duration” obeys the triangular distribution with the mode of 76, the lower limit of 71 and the upper
limit of 81.
3.3.8.3 T3duration. There are also three different scenarios for the T3duration: “good duration,”
“bad duration,” and “middle duration.” All of these three durations obey the triangular distribution and
are identified through applying the real project data in Table 9. The “good duration” means a short time
to finish the civil work of the raw material grinding workshop, the “middle duration” means a normal
time to finish the civil work, and the “bad duration” means a long time to finish the civil work. Based
on the data in Table 9 from 15 different cement projects, the lower limit, mode, and upper limit of each
triangular distribution are identified. The method used to identify the three values is the same as the
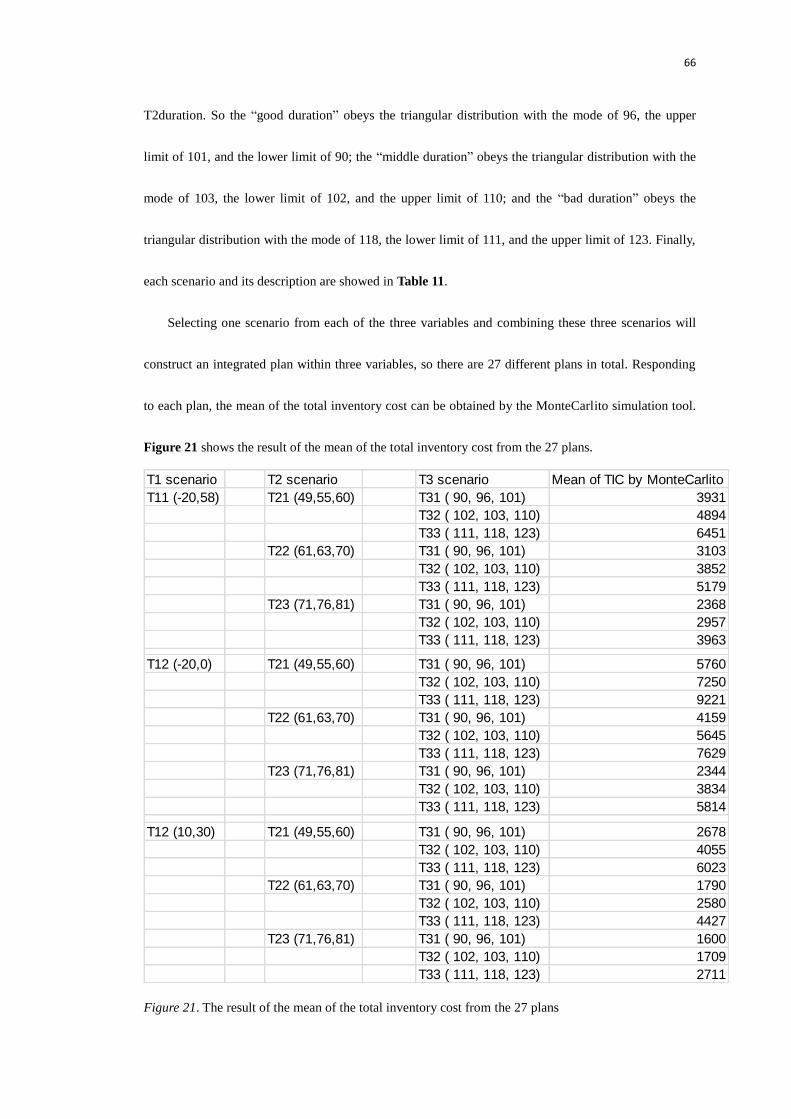
66
T2duration. So the “good duration” obeys the triangular distribution with the mode of 96, the upper
limit of 101, and the lower limit of 90; the “middle duration” obeys the triangular distribution with the
mode of 103, the lower limit of 102, and the upper limit of 110; and the “bad duration” obeys the
triangular distribution with the mode of 118, the lower limit of 111, and the upper limit of 123. Finally,
each scenario and its description are showed in Table 11.
Selecting one scenario from each of the three variables and combining these three scenarios will
construct an integrated plan within three variables, so there are 27 different plans in total. Responding
to each plan, the mean of the total inventory cost can be obtained by the MonteCarlito simulation tool.
Figure 21 shows the result of the mean of the total inventory cost from the 27 plans.
Figure 21. The result of the mean of the total inventory cost from the 27 plans
T1 scenario T2 scenario T3 scenario Mean of TIC by MonteCarlito
T11 (-20,58) T21 (49,55,60) T31 ( 90, 96, 101) 3931
T32 ( 102, 103, 110) 4894
T33 ( 111, 118, 123) 6451
T22 (61,63,70) T31 ( 90, 96, 101) 3103
T32 ( 102, 103, 110) 3852
T33 ( 111, 118, 123) 5179
T23 (71,76,81) T31 ( 90, 96, 101) 2368
T32 ( 102, 103, 110) 2957
T33 ( 111, 118, 123) 3963
T12 (-20,0) T21 (49,55,60) T31 ( 90, 96, 101) 5760
T32 ( 102, 103, 110) 7250
T33 ( 111, 118, 123) 9221
T22 (61,63,70) T31 ( 90, 96, 101) 4159
T32 ( 102, 103, 110) 5645
T33 ( 111, 118, 123) 7629
T23 (71,76,81) T31 ( 90, 96, 101) 2344
T32 ( 102, 103, 110) 3834
T33 ( 111, 118, 123) 5814
T12 (10,30) T21 (49,55,60) T31 ( 90, 96, 101) 2678
T32 ( 102, 103, 110) 4055
T33 ( 111, 118, 123) 6023
T22 (61,63,70) T31 ( 90, 96, 101) 1790
T32 ( 102, 103, 110) 2580
T33 ( 111, 118, 123) 4427
T23 (71,76,81) T31 ( 90, 96, 101) 1600
T32 ( 102, 103, 110) 1709
T33 ( 111, 118, 123) 2711

67
Based on the results in Figure 21, three pictures used for sensitivity analysis can be drawn out.
The three pictures show the influences from the T2duration and T3duration on the total inventory cost
when keeping the T1duration as a specific situation. For example, Figure 22 shows that the total
inventory cost mean value is affected by different scenarios of T2duration and T3duration when
keeping the T1duration as the situation of “likely duration.” Figures 23 and 24 show the same things
but are based on the different T1duration scenarios: “bad duration” and “good duration.”
Figure 22. Effect of delivery time on total inventory cost (for T1duration between -20 and 58)
Figure 23. Effect of delivery time on total inventory cost (for T1duration between -20 and 0)
Figure 24. Effect of delivery time on total inventory cost (for T1duration between 10 and 30)

68
3.3.8.4 Common characteristics. In Figure 22, the three triangle values with green color represent
that as the “delivery during time” changes from “good duration” to “bad duration,” the total inventory
cost will decrease. The decreasing trend applies to all of the three situations of the “civil work during
time” (T3duration). Not only that, the trend also applies to the Figure 23 and 24 when the T1duration is
in the situation of “bad duration” and “good duration”. So when the previous critical work is delayed,
changing the T2duration from “good duration” to “bad duration” can decrease the total inventory cost.
In other words, if the civil work is delayed in starting, increasing the precast steel structure “delivery
during time” can decrease the total inventory cost. It is very helpful to the main contractor to have an
idea that less delivery time sometimes may cause more inventory cost. On the other hand, if the
“delivery during time” increases to a value that is more than a given threshold, the precast steel
structure would be seriously delayed in getting to the site, and the inventory time is only equal to the
time stocking in the factory. In this situation, there is no supply chain issue.
In contrast to the T2duration, as the T3duration changes from “good duration” to “bad duration,”
the inventory cost will increase. All of the three figures show that the red line is under the green line,
but above the blue line. It other words, the civil work during time with a “good duration” always causes
a lower inventory cost than the “middle duration;” and the “middle duration” always has a lower
inventory cost than the “bad duration.”
The T2duration and T3duration not only have different influences on the trend of the total
inventory cost, but also their degrees of influence are different. As the T2duration increases to a “bad
duration,” the inventory cost will decrease, but the rate of decrease becomes progressively smaller;
however, as the T3duration increase to a “bad duration,” the inventory cost will increase, and the rate
of increase becomes progressively bigger because the distance between any two lines becomes
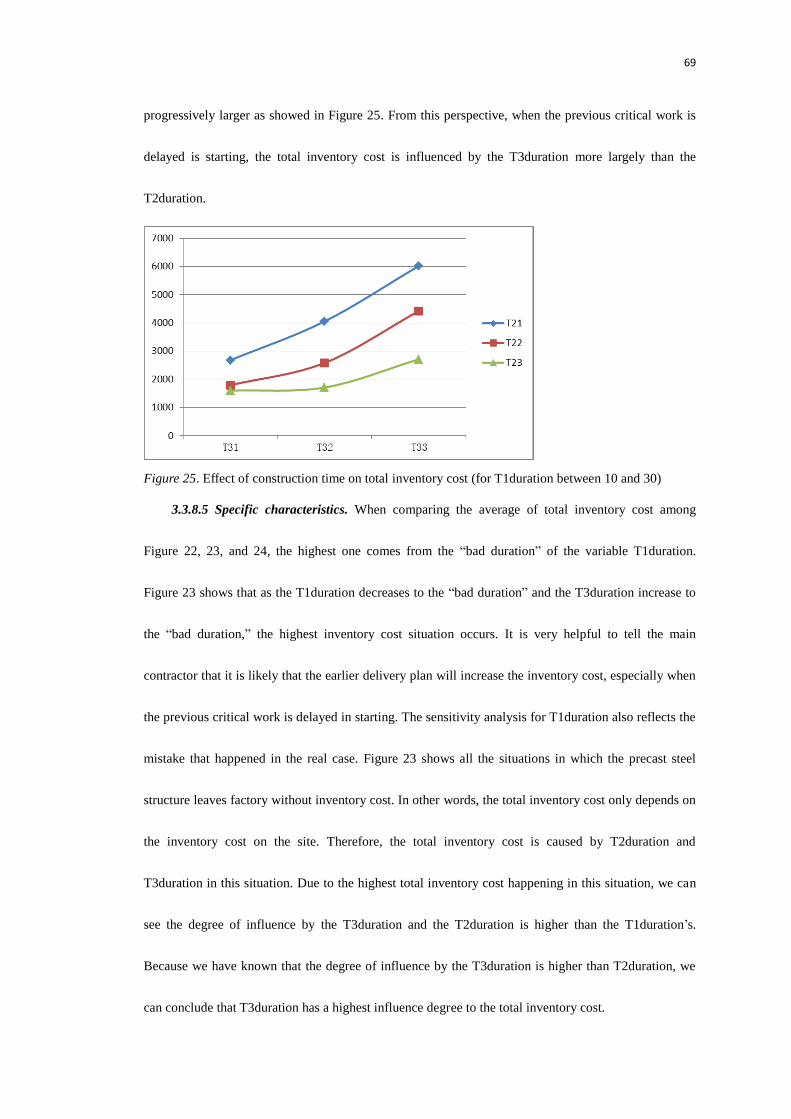
69
progressively larger as showed in Figure 25. From this perspective, when the previous critical work is
delayed is starting, the total inventory cost is influenced by the T3duration more largely than the
T2duration.
Figure 25. Effect of construction time on total inventory cost (for T1duration between 10 and 30)
3.3.8.5 Specific characteristics. When comparing the average of total inventory cost among
Figure 22, 23, and 24, the highest one comes from the “bad duration” of the variable T1duration.
Figure 23 shows that as the T1duration decreases to the “bad duration” and the T3duration increase to
the “bad duration,” the highest inventory cost situation occurs. It is very helpful to tell the main
contractor that it is likely that the earlier delivery plan will increase the inventory cost, especially when
the previous critical work is delayed in starting. The sensitivity analysis for T1duration also reflects the
mistake that happened in the real case. Figure 23 shows all the situations in which the precast steel
structure leaves factory without inventory cost. In other words, the total inventory cost only depends on
the inventory cost on the site. Therefore, the total inventory cost is caused by T2duration and
T3duration in this situation. Due to the highest total inventory cost happening in this situation, we can
see the degree of influence by the T3duration and the T2duration is higher than the T1duration’s.
Because we have known that the degree of influence by the T3duration is higher than T2duration, we
can conclude that T3duration has a highest influence degree to the total inventory cost.

70
Figure 24 shows that as the T1duration increases to the “good duration” and the T3duration
decreases to the “good duration,” the lowest inventory cost situation happens. It is very helpful to the
main contractor to make a decision about how to adjust the delivery plan and construction schedule.
Figure 24 also very clearly shows that as the T2duration increases to the “bad duration,” the inventory
cost may decrease to be a constant value. This constant value is zero, and it is only an expected value
under the ideal state.
3.4 Relationship Management Analysis
3.4.1 Introduction. Returning to procurement process in the case, we can see the delayed arriving
at site of steel bar is the blasting fuse for the whole overspend inventory cost. The inventory cost of the
steel bar resulted from the bad relationship with the original import agent, which is generally described
in the section of 3.3.1. The detail content about the high inventory cost and the bad relationship is
introduced in the following paragraphs.
As planned, the procurement for the steel bar started in the middle of May 2007. CNBM gave the
order that CSBC must deliver the cargo to the Shanghai port on 07/10/2007. The steel bars were
delivered to the port on that day, and on the same day EASH received the cargo and started to transact
custom clearance and arrange the shipment. The steel bars were lifted onto the ship within six days and
delivered out of the port on 07/17/2007. The ship reached the Djibouti port on 08/18/2007, but the
original import agent did not receive and verify the steel bars until the ship had to leave the port on
08/30/2007. After unloading the steel bars in the Djibouti port, the original import agent did not
transact the custom clearance for these steel bars, although the agent had been given all of the related
documents before the ship entered the port. The steel bars stayed on the port until 11/15/2007 and
entered the site on 11/20/2007. The agent delayed the transaction and transportation nearly 75 days,

71
which resulted in a large amount of unplanned inventory cost in the Djibouti port.
The main reason for the import agent to refuse to do its job was the bad relationship with the main
contractor. Except for custom clearance and transportation, the original import agent company also
contracted part of the work of “leveling and grading temporary road and construction site” and
arranged a large number of workers and machines to work on the site. When the work was handed over
to CNBM on the site, the original import agent company and CNBM had a big disagreement about how
much the agent company had completed. CNBM refused to approve the quantities done by the agent
company and refused to pay for it, because the working quantities reported by the agent company were
actually false. On the other hand, CNBM agreed to pay for the other company that did the leveling and
grading work as well. The original import agent company was very unsatisfied with CNBM’s decision
and thought CNBM had broken their cooperating relationship. CNBM required the agent to transact the
custom clearance for the steel bar cargo firstly and then talked about the payment for leveling work;
however, both parties lost trust in each other at that point. CNBM tried to restart collaboration with the
agent, but the agent refused to communicate with CNBM and declined to solve the problems of custom
clearance. Therefore the inventory cost in the Djibouti port increased to a number that exceeded
estimates.
The delayed arriving of the steel bar did not only influence the civil construction work; all of the
subsequent critical work had to be delayed. For this reason, CNBM had to adjust the construction
schedule to catch up on the schedule in order to complete the construction work as early as possible.
However, CNBM ignored the potential increasing inventory cost in the near future and blindly ordered
the other products to be delivered to the site as soon as possible.
From the detailed description of the case, we can see improving the relationships between the

72
main contractor and suppliers (products suppliers or service suppliers) has a positive impact on the
performance of the supply chain. A bad relationship can make huge trouble for a project, while a good
relationship can repair the trouble. This becomes vital for international EPC main contractor companies,
which have to deal with varied work including social, economical, and cultural work.
To improve the relationship management, this thesis firstly sets up a general framework including
supplier selection, supplier management and supplier improvement (Figure 26). Six key elements
under the supplier management are selected and put together with supplier selection and supplier
improvement to form a questionnaire about how to influence and improve the relationship management
with suppliers. The questionnaire based on these eight key elements had been established and 38
interviewees had been interviewed. Next, based on the real case about the overspent inventory cost of
steel bar, four related elements—trust, collaboration communication, and problem solving—are
selected to the study. According to the feedback and data collected from the interview, a series of
suggestions are issued in according with the four elements, which are to help the main contractor to
build, control and manage the relationship with suppliers.
3.4.2 Relationship management framework. The key to establishing effective relationships is
whether each party can overcome its strong concept of project focus and incorporate what has proven
to be essential for adding value in relationships (Hartmann & Caerteling, 2010). Based on that, the
framework is established. In the supplier selection, hard and soft evaluation factors are seen as the
criterions to choose suppliers. The hard factors contain price, quality, completing time and delivery
speed. On the other hand, the soft factors include cooperation history, reputation, ownership and culture
and so on. Supplier improvement include four approaches: learning mechanism, measurement, joint
efforts, and supplier participation. This thesis mainly focuses on the analysis of supplier management.

73
Through studying the case about the overspent inventory cost of steel bar, we can see the bad
relationship between CNBM and the agent company was mainly due to the poor performance of trust,
collaboration, communication, and problem solving.
Relationship Management
Supplier selection
Supplier management
Supplier improvement
Hard evaluation
factors
Soft evaluation
factors
Mutual objectives
Trust*
Collaboration*
Communication*
Problem solving*
Risk allocation
Learning mechanism
Measurement
Joint efforts
Supplier participation
Figure 26. The framework of relationship management research. Trust, Collaboration, Communication,
and Problem solving under the supplier’s management are used to study for improving relationship
with supplier based on the case.
3.4.2.1 Trust. Based on trust in international EPC projects, the main contractor often signs a
long-term strategic cooperation agreement with some critical suppliers, such as main plants suppliers,
in order to guarantee procurement performance. The agreement establishes some procurement

74
conditions and details including price, delivery time, quality guarantee, and service for future
cooperation (Khalfan et al., 2007). There are two promises to set up this kind of agreement. One is that
cooperation has continual development with long-term and frequent business interactions. The other is
that cooperation should be based on double win and risk sharing. From the perspective of the main
contractor, the trust-based agreement is beneficial because it decreases the cost in the beginning of
projects in the way of saving the money for tender and reducing the rate of down payment to suppliers.
The suppliers also gain the future sales opportunities in the competing market through the agreement.
At the same time, the two parties should work together to control and manage risk in the procurement
process through reasonable estimation, effective communication, and timely information sharing. But
in practice, strategic agreement is a kind of high level agreement without many detail conditions and
concrete regulations, so the agreement should be operated based on a more trust attitude when some
special issues happen.
3.4.2.2 Collaboration. A collaboration relationship is based on a collaboration attitude between
each other. The main contractor should believe that the suppliers can achieve mutual objectives before
starting work. Once some difficulties or reverses happen, the main contractor should work with
suppliers to figure out the problems without placing blame. Suppliers also should use the joint attitude
and effort to overcome difficulties and improve performance. There are two important factors to
develop collaboration attitude: the trust attitude before working and the no-blame attitude after
working.
3.4.2.3 Communication. The approach often used by the main contractor in communication in
EPC projects is the coordination of internal communication and external communication (Baiden et al.,
2006). An internet communicating platform is often set up in the main contractor’s headquarters for

75
external information exchange with each supplier. Meanwhile a company’s internal information flow
platform and an information database are also often set up for procurement management. There are two
functions to suppliers’ relationship management through internal communication. The first one focuses
on transforming clear information to other project coordinators in order to achieve seamless
communication with suppliers; the other one addresses taking files for each important communication.
For example, the technical coordinator delivers the inspecting information to the logistic coordinator in
the internal communication system and takes the files into the database. Subsequently, the logistic
coordinator will contact the suppliers for transportation issues in the external communication system.
Therefore, the external and internal communications work together in procurement management for
relationships’ development.
3.4.2.4 Problem solving. Based on trust and no-blame cooperative attitude, the main contractor
should join suppliers together to solve problems happening during project operation. There are various
problems that may occur in the procurement process, such as disqualification of production, delaying
for beginning delivery, lacking of parts when productions enter the site and so on. Each problem is
caused by two parties at least, so a joint team should be formed by experienced engineers and decision
makers for figuring out problems. The joint team should have the right to make direct and final
decisions to problem solving approaches. So the problems can be solved in one place and at one time,
which saves time through decreasing the solving process.
The joint team constituted by the main contractor and one supplier should set up a learning
mechanism for summarizing the experiences of how to solve problems. At the same time, both parties
should identify the effectiveness resulting from the solving approaches. The effective approaches are
very useful in the case that the same problems happen again. In addition, the joint team will hold

76
regular meetings for anticipating possible problems which may happen in the future. For example, the
main contractor may mention some important milestone issues to suppliers in order to let them
complete them in due time. Suppliers may contact the main contractor for payment at the right time for
the sake of influencing production.
3.4.3 Interview method. Relationship management problems are ever-changing and ever-evolving
for international EPC main contractor companies. It should be addressed through ever-learning
methods including surveying and interviewing methods. This thesis suggests the following questions
should be developed on the trust, collaboration, communication, and problem solving.
3.4.3.1 Interview questions. There are four kinds of questions about supply chain management in
relationship between main contractor and suppliers in the interview: interviewee information, project
information, project completion information and relationship management. After confirming the
relationship management questions discussed above, the author tried to identify the interview target and
field, so the questionnaire added some other basic questions about interviewees and projects into the
interview. In addition to that, the author designed the questions about project completion information
and relationship management projects to be answered under three different types of projects that might
be experienced by the interviewees: Project 1(highly successful), Project 2(moderately successful) and
Project 3(not successful). In this way, each interviewee can answer the questions based on different
experienced projects, and the function of each relationship management indicator applied in
comparable projects can be seen clearly.
3.4.3.2 Interviewee. There are 38 interviewees coming from 13 companies involved in the
interview. All of them are working in Chinese Government Owned Enterprises with different working
fields. Each interviewee was asked to answer the basic personal information and project information

77
before entering into the essential interview. And then, they were invited to answer the questions about
project completion information and relationship management based on three kinds of projects. But due
to some interviewees lacking enough experiences, not all the interviewees could answer the whole
questions under all three categories, and they preferred to answer the questions under one or two
categories. Through statistical analysis on the interview results, there are 30 interview results
responding to Project 1(Highly successful), 24 results for Project 2(Moderately successful) and 11
results for Project 3(Not successful).
3.4.3.3 Interview results. The interview results are shown in Figure 27. The questions under each
of four key elements are answered based on 3 kinds of projects. As summarizing above, there are 30
interviewees taking part in the interview about highly successful projects, 24 interviewees for
moderately successful projects and 11 for not successful projects. In addition, there are 12 questions
covering the four key elements. The possible answers to each question are 1 for strongly disagree, 2 for
disagree, 3 for neutral, 4 for agree and 5 for strongly agree.
The statistic results show the number how many interviewees choose their preferred answers to
each question under each kind of project. For example, for the question 13 under Project 1, there are 30
interviewees providing their answers and the interviewees’ number choosing from 1 to 5 are 0, 16, 4, 8
and 2, while question 14 under the same type of Project 1 has a different result: 0, 2, 12, 13, and 3. In
this way, the results of each question for each indicator of relationship management can be compared
under the same type of project, and then some conclusions can be achieved to illustrate which factors
are critical to improve the indicators of relationship management.

78
Figure 27. Interview questions and results of relationship management research on Trust, Collaboration,
Communication, and Problem solving
The results in Figure 27 show the number of how many interviewees chose their preferred
answers to each question under each kind of project. For example, Question 14 under Project 1
contains 30 interviewees providing their answers on a scale of 1 to 5. The number of interviewees who
chose 1 is 0; and the number of interviewees who chose 2 is 2. In the same way, we can find that the
number of interviewees who chose 3, 4, and 5 are 12, 13 and 3. However, Question 15 under the
Project 1 has a different result: 0, 2, 6, 21, and 1. In this way, the results of each question for each
indicator of relationship management can be compared under the same type of project, and then some
1(a) 2(b) 3(c) 4(d) 5(e) 1(a) 2(b) 3(c) 4(d) 5(e) 1(a) 2(b) 3(c) 4(d) 5(e)
13. Do you prefer informal relationship based trust to contractural trust in
managing your supply chain?0 16 4 8 2 0 12 4 8 0 0 6 3 2 0
14. Did you assess the received information from your suppliers as reliable? 0 2 12 13 3 0 1 13 9 1 0 0 6 5 0
15. Did a high degree of trust exist in the supply chain? 0 2 6 21 1 0 0 11 13 0 0 2 3 6 0
16. Did a cooperational/collaborational working relationship exist between you
and your suppliers?1 1 0 23 5 0 2 2 15 5 0 1 2 6 2
17. Did parties not blame each other when problems occurred? 1 13 9 7 0 0 15 6 3 0 0 8 2 1 0
18. Was communication between you and your suppliers open and effective? 0 0 1 22 7 0 0 2 19 3 0 1 0 7 3
19. Did you share learning and innovation with your suppliers? 0 7 4 18 1 0 7 4 12 1 0 1 1 8 1
20. Did you and your suppliers have the cost data transparency or open book
costing?8 7 7 8 0 7 6 5 6 0 2 2 3 4 0
21. Were there any informal communications, such as dinners, private parties,
etc. between you and your suppliers, besides the formal communications?1 7 8 11 3 0 6 7 10 1 0 4 2 5 0
22. Did you and your suppliers have an early warning mechanism to bring issues
to the surface when a problem was first anticipated or encountered?1 5 5 18 1 0 3 7 14 0 2 1 4 4 0
23. Was the problem solving mechanism between you and your suppliers
effective?0 1 8 20 1 0 1 10 13 0 2 0 3 6 0
24. Did you and your suppliers have a learning mechanism to avoid the problem
recurrence?0 6 7 15 2 1 3 8 11 1 1 0 3 7 0
Project 1(Highly Successful) : 30 Project 2 (Moderately Successful) : 24
Trust
Collaboration
Communication
Problem Solving
Supplier ManagementProject 3 (NOT Successful): 11

79
conclusions can be made to illustrate which factors are critical to improve the indicators of relationship
management.
At the same time, the interview results of the same question under different types of projects can
also be compared by proportion because the number of interviewees involved into the interview of each
type of project is different. For example, Question 14 under Project 1 has a proportion of 40% of
interviewees that chose answer 3. However, Question 14 under Project 2 asks the same question but has
a proportion of more than 50%, which is bigger than the one in Project 1. From this comparable result,
we can see main contractor apply two different ways on assessing the information from suppliers,
which may result in different results on project success. Using this kind of comparative method, some
conclusions can be made to illustrate which factors are most important to improve project performance.
3.4.4 Suggestions to improve the relationships with suppliers
3.4.4.1 Trust
The main contractor should apply supply chain management based on trust with suppliers in IEPC
projects. At the same time, the main contractor should set up a certain of approaches with trust,
such as signing long-tern cooperation agreement, working together for decision making and so on,
to improve trust relationship.
The main contractor had better establish clear contract clauses to regulate relevant responsibility,
as well as enhancing communication for urgent and accurate information.
3.4.4.2 Collaboration
The main contractor should establish cooperative working relationship regulation to explain some
detail rules about how to work together for improving project performance, such as concrete
working process about how to work together when problem come across.

80
The main contractor and suppliers should focus on problems, but not blindly and contumely blame
to others without considering how to figure out the problems. The quarrel and argument for
problem solving can be accepted to some extent.
3.4.4.3 Communication
The main contractor should set up an effective communication system used for sharing information
with suppliers continually and urgently.
The main contractor should set up inner regulations about information sharing degree. Responding
to those useful experiences and innovations for improving performance, main contractor should
actively share them with suppliers.
The main contractor and suppliers must apply informal communication in a proper way, and use
this type of communication to enhance trust relationship.
3.4.4.3 Problem solving
The main contractor should set up a discussing policy to anticipate possible problems in regular
meeting during project operation. All possible problems should be discussed in the meeting.
Meanwhile, the approaches dealing with problems should be issued after meeting. Senior manager
should balance all factors, such as cost, schedule, feasibility and risk level, to make the decision
decide about how to deal with problems..
When some anticipated problems happen, the main contractor may handle them as planed
approaches. On the other hand, if some problems happen by chance, the main contractor should
make quick response and issue applied methods with fewest decision processes. The problem
solving process and principles can be added into the contract clauses or company working
regulations as a continue mechanism.

81
After figuring out problems, the main contractor should summary the gains from experiences and
loss from interests regularly. Meanwhile, the summarized results should be learned and stored in a
project database which is established in the beginning of project.

Chapter Four
Conclusion
This thesis establishes the three levels’ SCOR models for MTS, MTO and ETO products. Through
comparing with each two models, we can see the SCOR model level 3 of MTS and MTO are almost the
same. The only difference is the MTO products have a process of “making”, but the MTS products
have a process of “sourcing”. The SCOR model level 3 of ETO products has fewer delivery processes
than MTO and MTS, because the ETO products, such as vertical mill, are delivered to the owner’s
country from the ETO factory directly. In addition, ETO products have more “making” processes than
MTO products, because it contains an important process of engineering.
Based on the above, we can further understand that the SCOR model level 3 of these three kinds
of products are almost the same at the locations of construction site, import port, and export port, so we
can describe the SCOR model of one kind of product, such as MTO product, as the representative
model for those three locations.
On the other hand, we also need focus on the differences in the SCOR model level 3 of the three
types of products at the location of suppliers’ factory. In the MTS products suppliers’ factory, we
should pay more attention to the process of “sourcing;” in the MTO products suppliers’ factory, we
should show interests in the process of “making;” and in the ETO products suppliers’ factory, we
should focus more on the process of “engineering.”
The locations where the inventory cost may happen, the time when the inventory cost may occur,
and the factors that may influence the inventory cost can be seen through the SCOR model level 3. At
the locations of construction site, import port, and export port, the inventory costs of the three kinds of
products almost happen at the same process, which is between the work of “verifying products” and the

83
work of “transferring products”.
At the location of suppliers’ factory, the inventory costs of the MTO and MTS products almost
happen at the same process, which is between the work of “releasing products for transportation” and
the work of “receiving products for transportation”. Therefore, we also can choose one type of product,
such as MTO product, to analyze its inventory cost, and time and location of occurrence.
In addition, the SCOR model level 3 also indicates that the inventory cost is likely to occur during
the process between two different locations. For this reason, we should pay close attention to the
delivery processes involving different locations. Moreover, SCOR model level 3 also describes the
processes before the process of occurring inventory cost. These processes always play an important
role to impact the subsequent inventory cost.
The MonteCallito simulation tool is applied to the supply chain performance of precast steel
structure based on the inventory cost. The simulation results of the confidence interval of the mean of
inventory time occurring in the suppliers’ factory and on the construction site are almost the same as
the real case, which indicates that the simulation method can be applied to the supply chain
performance, especially in the situation that the previous critical work is delayed to start.
The sensitivity analysis of the simulation results shows that the time for waiting delivery order
and the time for delivering products have a negative correlation with the total inventory cost, which
indicates that balancing the starting delivery date and the delivery time is important to control
inventory cost. Besides, the sensitivity analysis shows that the time for construction has a positive
correlation with the total inventory cost, and has a highest degree of influence to the inventory cost. As
expected, enhancing the efficiency of construction work can decrease the construction time, and
consequently inventory cost.

84
We can conclude that a bad relationship with suppliers may result in negative impact on supply
chain. This work identifies four key elements in managing relationship—trust, collaboration
communication, and problem solving—that led to unplanned inventory cost of steel bar, and applies an
interview method based on a questionnaire about the four key elements. The results from 38
interviewees are refined to 10 suggestions (listed below) for the main contractor to manage, control,
and improve the relationship management with suppliers. The 10 suggestions have been applied into
the practice of relationship management in the international EPC projects by main contractors.
Trust
Apply supply chain management and long term cooperation approach based on trust with suppliers
Establish clear contract clauses to regulate relevant responsibility
Collaboration
Focus on problems, but not blindly and contumely blame to others
Accept quarrel and argument for problem solving to some extent
Communication
Set up an effective communication system for sharing information with suppliers
Set up inner administrating regulations about information sharing degree
Set up a normal policy to manage information sharing in a proper way
Problem Solving
Set up a discussing policy about anticipating possible problems
Make quick response to problems with fewest decision processes
Summary the gains and loss from experiences and share them with suppliers.

References
Abduh, M., Soemardi, B. W., & Wirahadikusumah, R. D. (2012). Indonesian construction supply
chains cost structure and factors: A case study of two projects. Journal of Civil Engineering and
Management, 18(2), 209-216. doi: 10.3846/13923730.2012.671259
AbouRizk, S. M., & Halpin, D. W. (1992). Statistical properties of construction duration data. Journal
of Construction Engineering and Management, 118(3), 525-544. Retrieved from
http://search.proquest.com/docview/25881006?accountid=11667
Akintoye, A., & Main, J. (2007). Collaborative relationships in construction: The UK contractors'
perception. Engineering, Construction and Architectural Management, 14(6), 597-597. doi:
10.1108/09699980710829049
Ala-Risku, T., & Mikko Kärkkäinen. (2006). Material delivery problems in construction projects: A
possible solution. International Journal of Production Economics, 104(1), 19-19. Retrieved from
http://search.proquest.com/docview/199025203?accountid=11667
Arbulu, R., Ballard, G., & Harper, N. (2003). Kanban in construction. InProceedings of the 11th
Annual Conference of the International Group for Lean Construction, Blacksburgh, VA, USA.
American Production and Inventory Control Society.
Arbulu, R., Koerckel, A., & Espana, F. (2005). Linking production-level workflow with materials
supply. Proceedings of the 13th Annual Conference of the International Group for Lean
Construction, IGLC 13, Sydney, Australia, 199–206.
Azambuja, M., & Formoso, C. T. (2003). Guidelines for the improvement of design, procurement and
installation of elevators using supply chain management concepts. Proceedings of the 11th Annual
Conference of the International Group for Lean Construction, IGLC 11, Blacksburg, VA, 306–18.
86
Azambuja, M., & O’Brien, W. J. (2007). A qualitative evaluation of construction supply chain visual
process modeling tools. Proceedings of the Construction Research Congress, Grand Bahamas, 9.
Baiden, B.K., Price, A.D.F., & Dainty, A.R.J. (2006). The extent of team integration within
construction projects. International Journal of Project Management 24 (1), 13–23.
Baladhandayutham, T., & Venkatesh, Shanthi (2012). An Analysis on Application of Lean Supply
Chain Concept for Construction Projects. Synergy (0973-8819); 10 (1), 25-36
Chase, R. B., Jacobs, F. R., Aquilano, N. J., & Ren, J. (2006). Operations management for competitive
advantage. McGraw-Hill Higher Education Press.
Cheng, J. C. P., Law, K. H., Bjornsson, H., Jones, A., & Sriram, R. D. (2010). Modeling and monitoring
of construction supply chains. Advanced Engineering Informatics, 24(4), 435-455.
doi: 10.1016/j.aei.2010.06.009
Chen, T. (2007). Critical success factors for construction partnering in taiwan. International Journal of
Project Management, 25(5), 475. Retrieved from
http://search.proquest.com/docview/211091239?accountid=11667
Chopra, S,. & Meindl, P. (2001). Supply chain management-Strategy, planning, and operation, Prentice
Hall, Upper Saddle River, N.j.
CNBM (2007). Ethiopia DMC project schedule. Retrieved from
CNBM International Engineering Company Document
Ebrahimy, Y., AbouRizk, S. M., Siri, F., & Mohamed, Y. (2011). Simulation modeling and sensitivity
analysis of a tunneling construction project's supply chain. Engineering, Construction and
Architectural Management, 18(5), 462-480. doi: 10.1108/09699981011074600
Elfving, J. A. (2003). Exploration of opportunities to reduce lead times for engineered-to-order
87
products. PhD dissertation, University of California, Berkeley, CA.
Formoso, C.T., & Revelo, V.H.(1999). Improving the materials supply system in small-sized building
firms. Autom. Constr., 8, 663-670
Franco, L. A., Cushman, M., & Rosenhead, J. (2004). Project review and learning in the construction
industry: Embedding a problem structuring method within a partnership context. European
Journal of Operational Research, 152(3), 586-601. Retrieved from
http://search.proquest.com/docview/204128117?accountid=11667
Hartmann, A., & Caerteling, J. (2010). Subcontractor procurement in construction: The interplay of
price and trust. Supply Chain Management, 15(5), 354-362. doi:10.1108/13598541011068288
Hatmoko, J. U. D., & Scott, S. (2010). Simulating the impact of supply chain management practice on
the performance of medium-sized building projects. Construction Management and
Economics, 28(1), 35-49. doi: 10.1080/01446190903365632
Huan, S. H., Sheoran, S. U. K., & Wang, G. (2004). A review and analysis of supply chain operations
reference (SCOR) model. Supply Chain Management, 9(1), 23-29. Retrieved from
http://search.proquest.com/docview/216863181?accountid=11667
Humphreys, P. K., Shiu, W. K., & Chan, F. T. S. (2001). Collaborative buyer - supplier relationships in
HongKong manufacturing firms. International Journal of Supply Chain Management, 6(3/4),
152–162..
Jiang, Z., Henneberg, S. C., & Naudé, P. (2012). Supplier relationship management in the construction
industry: The effects of trust and dependence. The Journal of Business & Industrial
Marketing, 27(1), 3-15. doi: 10.1108/08858621211188920
Kern, A. P., & Formoso, C. T. (2006). A model for integrating cost management and production

88
planning and control in construction. Journal of Financial Management of Property and
Construction, 11(2), 75-90. Retrieved from
http://search.proquest.com/docview/1012067192?accountid=11667
Lockamy, A., & McCormack, K. (2004). Linking SCOR planning practices to supply chain
performance: An exploratory study. International Journal of Operations & Production
Management, 24(11), 1192-1218. Retrieved from
http://search.proquest.com/docview/232329371?accountid=11667
London, K. A., & Kenley, R. (2001). An industrial organization economic supply chain approach for
the construction industry: A review. Construction Management and Economics, 19(8), 777-788.
Retrieved from http://search.proquest.com/docview/26828418?accountid=11667
Marsh, J. W. (1985). Materials management: Practical application in the construction industry. Cost
Engineering, 27(8), 18-18. Retrieved from
http://search.proquest.com/docview/220404142?accountid=11667
McCabe, B. (2003). Construction engineering and project management III:Monte carlo simulation for
schedule risks. Retrieved from http://search.proquest.com/docview/31106059?accountid=11667
Khalfan, M. M.A., McDermott, P., & Swan, W. (2007). Building trust in construction projects.
Supply Chain Management, 12(6), 385-391. doi: 10.1108/1359854071082630
Meng, X. (2012). The effect of relationship management on project performance in construction.
International Journal of Project Management, 30(2), 188-198.
doi:10.1016/j.ijproman.2011.04.002
Ng, S. T., Rose, T. M., & Mak, M. (2002). Problematic issues associated with project partnering – the
contractor perspective.International Journal of Project Management, 20(6), 437-449. Retrieved
89
from http://search.proquest.com/docview/211120359?accountid=11667
O'Brien, W. J., Formoso, C.T., Vrijhoef, R., & London, K.A. (2009). Construction supply chain
management handbook. Boca Raton, FL: CRC Press. Retrieved from
http://www.tandfonline.com/doi/abs/10.1080/01446190903222361
O'Brien, W. J. (1998). Capacity costing approaches for construction supply-chain management.
Stanford University). ProQuest Dissertations and Theses, , 190-190 p. Retrieved from
http://search.proquest.com/docview/304453502?accountid=11667. (304453502).
O'Brien, ,W.J., & Fischer, M. A. (2000). Importance of capacity constraints to construction cost and
schedule. Journal of Construction Engineering and Management, 126(5), 366-373. Retrieved
from http://search.proquest.com/docview/27593106?accountid=11667
Pan, N., Lee, M., & Chen, S. (2011). Construction material supply chain process analysis and
optimization. Journal of Civil Engineering and Management, 17(3), 357-370. doi:
10.3846/13923730.2011.594221
Pan, N., Lin, Y., & Pan, N. (2010). Enhancing construction project supply chains and performance
evaluation methods: A case study of a bridge construction project. Canadian Journal of Civil
Engineering/Revue Canadienne De Genie Civil, 37(8), 1094-1106. doi: 10.1139/L10-047
Polat, G., Arditi, D., & Mungen, U. (2007). Simulation-based decision support system for economical
supply chain management of rebar. Journal of Construction Engineering and Management,
133(1), 29-39. doi: 10.1061/(ASCE)0733-9364(2007)133:1(29
Supply Chain Council (2008). Supply Chain Operation Reference (SCOR) Model (Version 9.0).
Retrieved from Supply Chain Council website: http://supply-chain.org/
Schultz, G. J. (2003). Keeping SCOR on your supply chain: Basic operations reference model updates
90
with the times. Information Strategy, 19(4), 12-20. Retrieved from
http://search.proquest.com/docview/214377581?accountid=11667
Tserng, P. H., Yi, S. Y. L., & Li, S. (2006). Developing a resource supply chain planning system for
construction projects. Journal of Construction Engineering and Management, 132(4), 393-407.
doi: 10.1061/(ASCE)0733-9364(2006)132:4(393
Vaidyanathan, K., & O'Brien, W. (2003) Opportunities for IT to support the construction supply chain
Retrieved from http://search.proquest.com/docview/21886575?accountid=11667
Vidalakis, C., Tookey, J. E., & Sommerville, J. (2011). Logistics simulation modelling across
construction supply chains.Construction Innovation, 11(2), 212-228.
doi: 10.1108/14714171111124176
Yeo, K. T., & Ning, J H. (2002). Integrating supply chain and critical chain concepts in
engineer-procure-construct (EPC) projects. International Journal of Project Management, 20(4),
253-262. Retrieved from http://search.proquest.com/docview/211088930?accountid=11667
Zhao, X., Flynn, B. B., & Roth, A. V. (2007). Decision sciences research in china: Current status,
opportunities, and propositions for research in supply chain management, logistics, and quality
management*. Decision Sciences, 38(1), 39-80. Retrieved from
http://search.proquest.com/docview/198119448?accountid=11667