analysis of iss plasma interaction - nasa · analysis of iss plasma interaction ... array electron...
TRANSCRIPT

American Institute of Aeronautics and Astronautics
1
Analysis of ISS Plasma Interaction
Brandon Reddell*, John Alred*, Leonard Kramer*, and Ron Mikatarian† The Boeing Company, Houston, Texas, Zip 77059, USA
Joe Minow‡ NASA Marshall Space Flight Center, Huntsville, Alabama, 35806, USA
and
Steve Koontz§ NASA Johnson Space Flight Center, Houston, Texas, 77058, USA
To date, the International Space Station (ISS) has been one of the largest objects flown in lower earth orbit (LEO). The ISS utilizes high voltage solar arrays (160V) that are negatively grounded leading to pressurized elements that can float negatively with respect to the plasma. Because laboratory measurements indicate a dielectric breakdown potential difference of 80V, arcing could occur on the ISS structure. To overcome the possibility of arcing and clamp the potential of the structure, two Plasma Contactor Units (PCUs) were designed, built, and flown. Also a limited amount of measurements of the floating potential for the present ISS configuration were made by a Floating Potential Probe (FPP), indicating a minimum potential of –24 Volts at the measurement location. A predictive tool, the ISS Plasma Interaction Model (PIM) has been developed accounting for the solar array electron collection, solar array mast wire and effective conductive area on the structure. The model has been used for predictions of the present ISS configuration. The conductive area has been inferred based on available floating potential measurements. Analysis of FPP and PCU data indicated distribution of the conductive area along the Russian segment of the ISS structure. A significant input to PIM is the plasma environment. The International Reference Ionosphere (IRI 2001) was initially used to obtain plasma temperature and density values. However, IRI provides mean parameters, leading to difficulties in interpretation of on-orbit data, especially at eclipse exit where maximum charging can occur. This limits our predicative capability. Satellite and Incoherent Scatter Radar (ISR) data of plasma parameters have also been collected. Approximately 130,000 electron temperature (Te) and density (Ne) pairs for typical ISS eclipse exit conditions have been extracted from the reduced Langmuir probe data flown aboard the NASA DE-2 satellite. Additionally, another 18,000 Te and Ne pairs of ISR data from several radar locations around the globe were used to assure consistency of the satellite data. PIM predictions for ISS charging made with this data correlated very well with FPP data, indicating that the general physics of spacecraft charging with high voltage solar arrays have been captured. The predictions also provided the probabilities of occurrences for ISS charging. These probabilities give a numerical measure of the number of times when the ISS will approach or exceed the vehicle plasma hazard conditions for each configuration. In this paper we shall present the interaction mechanisms between the ISS and the surrounding plasma and give an overview of the PIM components. PIM predictions are compared with available data followed by a discussion of the variability of plasma parameters and the conductive area on the ISS. The ISS PIM will be further tested and verified as data from the Floating Potential Measurement Unit become available, and construction of the ISS continues.
* Scientist/Engineer, The Boeing Company, M/C HA1-20, 13100 Space Center Blvd., Houston, Texas 77059. † Principal Engineering Specialist, The Boeing Company, M/C HA1-20, 13100 Space Center Blvd., Houston, Texas 77059. ‡ Scientist, NASA Marshall Space Flight Center, Huntsville, Alabama 35806. § Environments Lead, NASA Johnson Space Center, Houston, Texas 77058.
https://ntrs.nasa.gov/search.jsp?R=20080026347 2018-11-15T03:21:05+00:00Z

American Institute of Aeronautics and Astronautics
2
I. Introduction he large dimensions, high voltage solar arrays, and surface properties of the ISS represent a complex system interacting with the LEO plasma. Discharge current measurements made by the Plasma Contactor Units and
floating potential measurements (electrical potential difference between ISS conducting structure and the ionospheric plasma) made by the Floating Potential Probe (FPP) have delineated charging and magnetic induction effects on the ISS. A model of ISS plasma interaction, based on fundamental electrostatics and electrodynamics, and containing only one adjustable parameter, has been developed. The model includes magnetic induction effects, interaction of the high voltage solar arrays with ionospheric plasma, and also accounts for charge collection by conductive structure exposed on the external surfaces of ISS. Based on these considerations, the Plasma Interaction Model (PIM) has been developed. The PIM is used in conjunction with specifications of the properties of the space flight environment factors that drive the charging processes: 1) the geomagnetic field, and 2) the ionospheric plasma, and the variability of the ionospheric plasma, based on a large body of point measurements made by satellite and incoherent scatter radar (ISR) instruments. PIM predictions for ISS charging correlate very well with FPP data, indicating that the general physics of spacecraft charging with high voltage solar arrays has been captured. The floating potential depends on the electrical system grounding scheme and is also influenced by the high voltage solar arrays. The ISS solar arrays have a working potential of +160V and the low potential side is grounded to the ISS structure. This configuration leads to a portion of the solar arrays collecting being at a positive potential with the remaining solar cells and most of the conducting structure being at a negative bias with respect to the ionospheric plasma. The positive portion of the solar arrays collects negative current and the conducting areas that are biased negatively collect positive current. Because of the difference in mobility between electrons and ions, electron current is much higher than the thermal/ram ion current. Typically on ISS, the ISS potential will have to shift negative to balance the amount of electron collection. The potential at which the net current produced from collection of electrons balances the net current produced from the collection of the ions is the floating potential.
The floating potential for any specific ISS build stage, flight attitude, and configuration is highly dependent on the local plasma environment (i.e., electron temperature and density). To examine the range of ISS floating potentials predicted by PIM, the International Reference Ionosphere model (IRI-2001) was initially used to obtain plasma temperatures and densities. IRI 2001 is essentially a climatological model, accurately (+ 30% at one sigma) predicting long term or seasonal averages of the ionospheric parameters, as smoothed out over large geographic areas. This leads to difficulties in interpretation of on-orbit data and the assessment of hazardous floating potentials, especially near eclipse exit where the temperature and density of the ionospheric environment change rapidly along the ISS orbital flight path. For any part of the ISS orbital flight path the natural short-term (1minute to 1 hour) variability of the ionosphere also leads to significant uncertainty in the real ionospheric conditions corresponding to an IRI 2001 estimate. Clearly, a model reporting a monthly average value of ionospheric parameters cannot be used to evaluate a hazardous condition with a time to effect on the order of seconds to minutes.
To improve PIM predictions of ISS charging, satellite data of plasma properties have been collected. Approximately 130,000 electron temperature (Te) and density (Ne) pairs for typical ISS eclipse exit conditions have been extracted from the reduced Langmuir probe data flown aboard the NASA DE-2 satellite. PIM predictions using these data provide the probability of occurrence for ISS charging. These probabilities give a numerical measure of the number of times ISS will approach or exceed the limits established for either ISS extravehicular activity (EVA) or ISS Vehicle hazard conditions for any ISS configuration and flight attitude and are used for hazard control planning and hazard control verification. This paper begins with an overview of the PIM components and discusses comparisons between PIM predictions and Floating Potential Probe data. Next, the PIM charging predictions are discussed from a probabilistic point of view with the aid of both satellite and incoherent satellite radar (ISR) data. Following this discussion, the impacts on the charging probabilities due to error bounds on the experimental plasma data are discussed.
II. Overview of PIM Development of the PIM is the result of a joint collaboration between The Boeing Company and SAIC, under subcontract to The Boeing Company1-3, 8. Figure 1 gives a schematic of the PIM. Input parameters for the PIM are the environmental parameters (Te, Ne and B), the vehicle’s location in geographic coordinates, the configuration of the PV arrays (shunt configuration and array position angles), conducting area, and the PCU current-voltage relationship. Collection of electrons and ions on the arrays, masts and structure are indicated as contributing to the total current to the vehicle. The induction voltage, arising from the motion of the vehicle through
T

American Institute of Aeronautics and Astronautics
3
the geomagnetic field, contributes to the vehicle potential for both quasi-steady and time-dependent cases. This potential, due to Faraday‘s Law, is (vxB•L).
The computer code is utilized to calculate both the floating potential of the ISS and PCU discharge current. Due to the negative solar array grounding scheme, the difference in ion/electron mobility, charging dynamics, and various sources and losses, ISS conducting structure will display a steady state floating potential that balances the electron and ion fluxes. This floating potential can be negative or positive and it varies in magnitude across the vehicle. It depends on the environmental parameters, flight attitude, and vehicle location. For the nominal flight attitude the floating potential is usually negative at all locations on the vehicle, with one side being more negative then the other.
A. Solar Arrays Modeled within PIM The PIM assumes that all solar array components are identical. Each solar array consists of 82 strings, each of which is a series-connected string of 400 cells. When illuminated, each cell outputs 0.4V. A small negative potential (~–0.2V) exists at the surfaces of the solar cell cover glasses due to the difference between ion and electron fluxes. This potential sets up a barrier around the coverglass for electron collection. Only electrons with sufficient energy can overcome this barrier and reach the gap that exists between the solar cells (along their edges). This potential prevents electron collection everywhere except within solar cell gaps. Both analytic and numerical-simulation solutions support this model of electron collection on the PV arrays. This methodology is discussed in more detail in reference 8.
III. PIM Comparisons with Floating Potential Probe Data The Floating Potential Probe (FPP) was built and flown on ISS by NASA Glenn Research Center teaming with Design-Net Engineering, Inc. The project from beginning to installation took about 4 months. It was installed
Figure 1 – Plasma Interaction Model (PIM)

American Institute of Aeronautics and Astronautics
4
in December 2000 on the Z1 truss segment. The probe was designed to measure the floating potential and also contained a Langmuir probe to measure the plasma density and temperature. Comparison of plasma data obtained by the FPP with data obtained from appropriate ISR sites show that the densities are in rough agreement but the FPP derived electron temperature is biased high. The ISS plasma team concluded that no effort should be expended to re-analyze the FPP data. FPP data taken during April 2001 was used in the PIM development.
A. Determination of Effective ISS Conducting Area The PIM model was executed for portions of the orbit and directly compared with the April 2001 on-orbit potential probe data. Because the total effective conducting area is unknown*, its value was determined empirically. An error minimization technique was performed and the result was that the minimum error of the PIM output occurs when using approximately 23 m2 of conducting area. Figure 2 displays the results of the error minimization technique. The relative error was defined as:
( )( )
210
2
2
error relativem
PIMFPPPIMFPP
−−
= ,
where FPP is the on-orbit floating potential and PIM designates predicted floating potential data. Figure 3 displays the results of the PIM output using 10 m2, 23 m2, and 35 m2 conducting area. From Figure 3, a conducting area between 23-27 m2 appears to have the minimum error. Based on these analyses, future charging predictions use a conductive area of 23 m2. This provides the most conservative value for conductive area, i.e. the lower the conductive area, the greater the charging. It should be noted that for this analysis, properly reduced FPP Langmuir probe data were not available. Error bounds on FPP measurements are discussed in Appendix B. The plasma input parameters were defined using the IRI-2001 model. Because this is a climatological model, inherent uncertainties exist in the predicted plasma temperature and density (see section B). As a result, uncertainty in the PIM predictions have an unquantified error associated with them and this leads to a small, unquantified error in the effective conductive area. This puts special emphasis on the need to have simultaneous on orbit measurements of plasma parameters, floating potential and PCU currents if possible. PIM error bounds based on plasma variability are discussed in section VI.
__________ * Studies are in process to identify and quantify the effective conducting area independent of PIM/FPP measurements. Results to date indicate that the 20-30 m2 estimated with FPP/PIM are consistent with the area of exposed known conductive materials on ISS.
0.0000
0.2000
0.4000
0.6000
0.8000
1.0000
0 5 10 15 20 25 30 35 40
Conductive Area (m2)
Rel
ativ
e Er
ror
Figure 2 – Relative Error Defining ISS Effective Conducting Area

American Institute of Aeronautics and Astronautics
5
0
10
20
30
40
50
60
12:30 13:00 13:30 14:00Time (GMT)
Volta
ge (-
V)
FPP DataPIM - 10m2PIM - 23m2PIM - 35m2
April 11, 2001Arrays Rotating & Shunting
Figure 3 – PIM Predicted Data vs. FPP Data
IV. Ionospheric Plasma Properties and Variability The plasma density and temperature vary over all ISS orbital conditions. Previous studies and existing PCU data indicate that maximum charging occurs shortly after eclipse exit3-5. For ISS, eclipse exit conditions are defined for solar zenith angles (SZA) between 100 and 110 degrees at ISS altitudes. The SZA is defined as the angle between the ISS zenith vector (vector connecting center of Earth to point directly overhead of ISS) and the sun. At these locations, the ISS is emerging from the nighttime where electron temperatures are low. When the solar arrays are illuminated by sunlight and become charged, electron collection is at a maximum. The maximum charging values occur when the density is high, which typically at lower latitudes.
A. Satellite Based Plasma Data An exhaustive search was performed to identify all available satellite data sets that contained plasma density (Ne) and temperature (Te) measurements of the F2 layer of the ionosphere for altitude and orbital inclinations covered by the ISS. The following satellites were identified as meeting this criteria: Atmospheric Explorer (AE) -C, -D, -E, Dynamics Explorer (DE) 2, and CHAMP. All data from AE-D and AE-E were excluded because the plasma team concurred that the temperature data were biased high and not physically characteristic of the F2 plasma layer. As for CHAMP, validated Langmuir probe data has not been released yet. Filtering the two remaining data sets, AE-C and DE-2, yielded approximately 2,400 (15 second sample rate – low time resolution) data points for AE-C data and approximately 4,200 (16sec sample rate – low time resolution) data points for DE-2. Additionally, there exists approximately 130,000 (0.5 second sample rate – high time resolution) data points for DE-2. These data were obtained from the National Space Science Data Center at NASA’s Goddard Spaceflight Center. The AE-C data were mostly taken during solar minimum and DE-2 data were taken near solar maximum. Studies showed that during solar minimum, the F2 layer plasma will generally have lower densities and lower temperatures than during solar maximum5. However, because the AE-C data set was statistically much smaller than DE-2 and that the AE-C showed similar charging probabilities to DE-2, DE-2 was (and is) the main data source for ISS plasma charging studies to date.
B. Utility of the IRI-2001 Model for ISS Charging Predictions Before plasma data was available, the only source for obtaining Ne and Te (which are required inputs into the PIM) was from the International Reference Ionosphere – 2001 model (IRI-2001) available from the National Space Science Data Center at NASA Goddard. IRI-2001 is a climatological model that generates plasma parameters
American Institute of Aeronautics and Astronautics
6
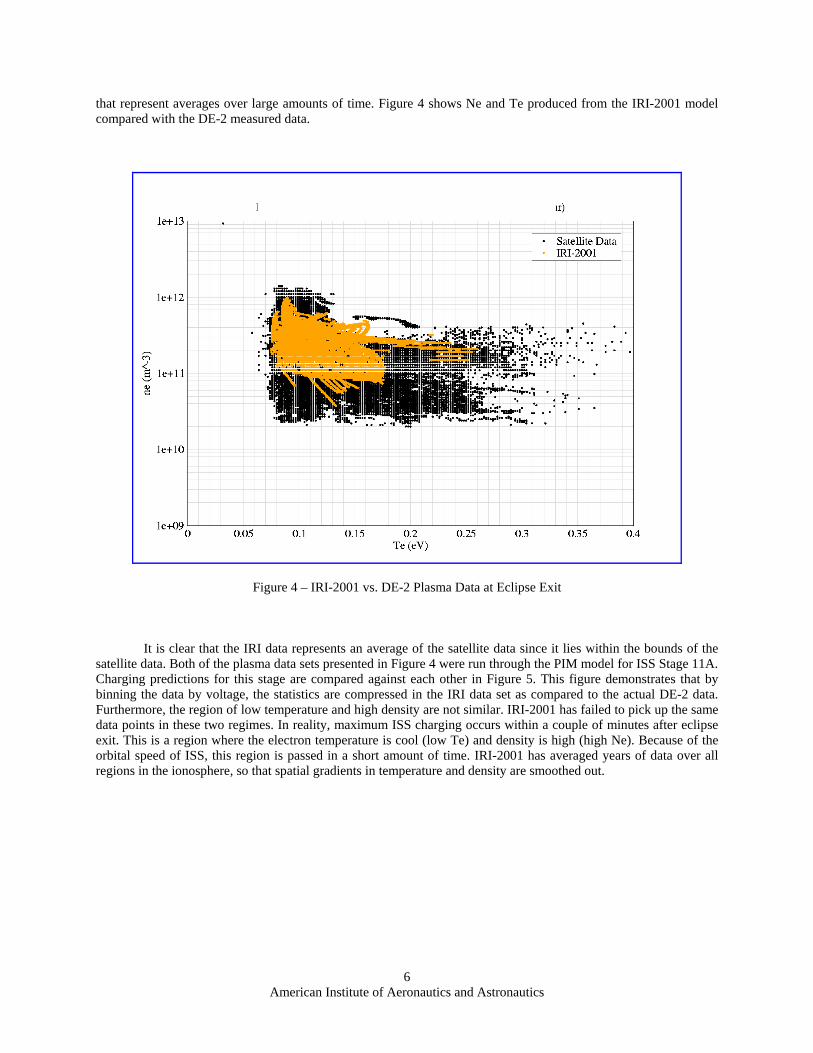
that represent averages over large amounts of time. Figure 4 shows Ne and Te produced from the IRI-2001 model compared with the DE-2 measured data.
Figure 4 – IRI-2001 vs. DE-2 Plasma Data at Eclipse Exit
It is clear that the IRI data represents an average of the satellite data since it lies within the bounds of the satellite data. Both of the plasma data sets presented in Figure 4 were run through the PIM model for ISS Stage 11A. Charging predictions for this stage are compared against each other in Figure 5. This figure demonstrates that by binning the data by voltage, the statistics are compressed in the IRI data set as compared to the actual DE-2 data. Furthermore, the region of low temperature and high density are not similar. IRI-2001 has failed to pick up the same data points in these two regimes. In reality, maximum ISS charging occurs within a couple of minutes after eclipse exit. This is a region where the electron temperature is cool (low Te) and density is high (high Ne). Because of the orbital speed of ISS, this region is passed in a short amount of time. IRI-2001 has averaged years of data over all regions in the ionosphere, so that spatial gradients in temperature and density are smoothed out.

American Institute of Aeronautics and Astronautics
7
C. Incoherent Scatter Radar (ISR) Based Plasma Data The Marshall Space Flight Center Space Environments and Effects group obtained ISR data from several radar sites that contained Ne and Te pairs of plasma data. Like the satellite data, the large data sets were reduced to that having an altitude range between 350 and 450 km, and latitude range of +/- 55 degrees. Data was obtained from Arecibo, Millstone Hill, St. Santin, and Kharkov, all northern hemisphere sites. Filtering the data for ISS eclipse exit conditions, as explained in section A, yielded approximately 18,000 data points, with greater than 95% coming from Arecibo and Millstone Hill. These data all have Ne and Te errors of 10% or less. Figure 6 shows a direct comparison between the ISR and satellite data for both solar min and solar max. It is noted that the ISR data generally fits within the bounds of the satellite data for both parts of the solar cycle. The ISR shows similar low temperature effects, but does not show quite as low densities as the satellite data. This is attributed to the fact that the large majority of the data comes from Arecibo, which is near the Appleton Anomaly region, which has larger densities. Additionally, there is an unknown limiting factor on the ISR ability to measure lower densities. ISR data produce similar maximum charging conditions as the satellite data because of having similar Ne/Te pairs. However, because the ionospheric coverage of the ISR data is limited to several degrees about the radar site (see Figure 7), the measured data is only a very small subset of the ionosphere data and does not produce reasonable statistics for the whole ionosphere.
Figure 5 – IRI-2001 vs. DE-2 Charging Predictions (ISS in XVV Attitude)

American Institute of Aeronautics and Astronautics
8
Figure 6 – ISR vs. Satellite Plasma Data
Figure 7 – Ionosphere Data Coverage: Satellite (green) vs. ISR (red)

American Institute of Aeronautics and Astronautics
9
D. Summary of Plasma Data Ionospheric density and temperature vary as a function altitude, latitude, and longitude. In reality these variations are somewhat symmetric in geomagnetic coordinates. The magnetosphere and ionosphere are coupled together. Electric fields map down into the ionosphere and help create plasma convection, joule heating, and plasma instabilities. Solar energy can enter into the ionosphere at high latitudes. Auroral particle precipitation can ionize the high latitude atmosphere and heat can be conducted down to ionosphere levels. These are some of the primary reasons why there are large spreads in temperatures at higher latitudes6. IRI-2001 is a good model to qualitatively ascertain the ionospheric plasma environment; however, it averages out both transient and spatial gradient effects, such as temperature rise at eclipse exit, which have been shown to produce maximum charging on the ISS. Including the satellite and ISR databases provide a snapshot of the ionosphere at the moment of measurement and will most likely include the extremes in variability of the ionosphere. Using extremes in the density/temperature pairs in PIM provides the best chance of identifying whether hazard condition from charging may exist at all. Exercising PIM with as much data possible (i.e. building statistics) can illuminate the risk level of a charging hazard. High time resolution satellite plasma data is available for ISS charging analysis. ISS eclipse exit conditions have been identified, for which there are ~130,000 Ne/Te pairs of satellite data. ISR data has been acquired and is consistent with the satellite data. Figure 6 shows that at any ISR location, the distribution of Te and Ne is approximately the same as that measured by DE-2 over the whole ionosphere. Figure 7 demonstrates the data coverage for ISR and DE-2. It is clear from this figure that DE-2 is spread over a majority of the ionosphere. A red circle estimates the ionospheric coverage area for each ISR location. Each site can only see a small portion of the ionosphere and is heavily influenced by the dynamics in that region, i.e. equatorial dynamics or high latitude convection. No matter how many data points can be obtained from the individual ISR locations, the statistics of coverage cannot be applied to the full ionosphere. For this reason, satellite based data provides the best coverage of the ionosphere and will be used for ISS charging analysis.
V. ISS Stage Charging Predictions DE-2 high time resolution plasma data was used in conducting the PIM calculations. Each point was considered a possible ISS eclipse exit condition, which is where the maximum charging occurs for each orbit. Figure 8 shows the ISS stage charging probability distribution on the pressurized elements. The charging value at the truss tips is approximately 3V more negative for stage 11a and up to 10V more negative at stage 15A. Figure 9 shows the integrated probability distribution. This chart, for example, can be used to determine the probability of having a voltage greater than 40V. For both charts, the 40V requirement is labeled. ISS Stage 12A (see Appendix A for ISS station configurations) represents a different case that requires additional comments. The configuration for 12A is presented in the attachment section. During 12A, the P4 solar array is added to the structure, where it is grounded to the ISS structure, but not powered on. Power during this stage is generated from the 2A and 4B arrays (parallel to y axis in figure), identical to stage 11A configuration. During this stage, the additional conducting area (from the mast structure) will be biased negatively as they are part of the ISS structure. This negative bias will generate additional positive ion current collection to balance the electron current produced from the two solar arrays. Because there is more conducting area present in this configuration than the 11A configuration, the floating potential will not have to adjust as negatively to balance the currents as it does for the 11A configuration.

American Institute of Aeronautics and Astronautics
10
Figure 8 – ISS Stage Charging Probability (ISS in XVV Flight Attitude)
Figure 9 – ISS Stage Integrated Probability (ISS in XVV Flight Attitude)

American Institute of Aeronautics and Astronautics
11
VI. Variations in Predicted Charging Levels Due to Plasma Measurement Error An analysis was performed to define the variation in predicted charging levels based on the error bounds of the reduced plasma data. Dr. Brace, the PI for the Langmuir probe instrument on DE-2, states that the errors for Ne and Te are about 10%7. The plasma parameters were varied according to these error bounds and charging values were computed. Additionally, 20% error bars were also included for engineering margin. Figures 11-13 show the ISS nominal charging predictions and the bounds for the 10% and 20% errors. In each case, the predicted values were generated for locations on the pressurized elements with the ISS in XVV flight attitude and with the PCU’s turned off. In general, with each stage build, more solar arrays and truss segments are added, thereby increasing the total electron current to the vehicle and increasing the vxB•L induction potential, which lead to larger floating potential predictions. On each plot, for each 10% error bin, the cases that provide maximum charging (Lowest Te and highest Ne) and the cases that provide the minimum charging (highest Te and Lowest Ne) are plotted. These curves represent the bounds of the PIM predictions for all values of Te and Ne that can vary up to +/- 10% and +/-20% of the nominal values. Table 1 summarizes the charging predictions produced by the error bounds in plasma density and temperature.
Figure 10 – ISS 12A Charging Predictions With Error Bounds

American Institute of Aeronautics and Astronautics
12
Figure 11 – ISS 12A.1 Charging Predictions With Error Bounds
Figure 12 – ISS 13A Charging Predictions With Error Bounds

American Institute of Aeronautics and Astronautics
13
Figure 13 - ISS 15A Charging Predictions With Error Bounds
Table 1: Error Bounds
ISS Stage Peak Voltage (-V) ΔV from +/- 10% Ne, Te (V) ΔV from +/- 20% Ne, Te (V) 12A 33 +/- 1.0 +/- 2.5
12A.1 49 +/- 2.0 +/- 3.5 13A 58 +/- 2.0 +/- 4.0 15A 78 +/- 2.0 +/- 4.0
VII. Conclusion An overview of PIM has been presented and the results of the charging predictions have been presented. Charging predictions have been made based on the current understanding of the physics of spacecraft charging with high voltage arrays in low earth orbit. The charging levels, due to the error bounds in the plasma data, can vary as much as +/- 4 Volts. It should be noted that the ISS configuration has not changed significantly during the development of PIM. The charging predictions for the current configuration (pre-12A) are given with high confidence levels. For future ISS stages, configuration parameters such as the number of solar arrays and length of the truss segment create additional charging levels. The launch, installation, and validation of the FPMU prior to 12A is of the utmost importance. With FPMU data, an assessment of the plasma environment will be made. The PIM model can then be validated against known in-situ FPMU data (floating potential and local plasma properties). If the FPMU does not aid in PIM model validation, future validation of PIM will be inferred from PCU discharge current monitoring.

American Institute of Aeronautics and Astronautics
14
Appendix
Figure A1 - ISS Stage 12A Configuration
Figure A2 - ISS Stage 12A.1 Configuration
truss
Pressurized Elements
P4 array (not powered)
truss
Pressurized Elements

American Institute of Aeronautics and Astronautics
15
Figure A3 - ISS Stage 13A Configuration
Figure A4 - ISS Stage 15A Configuration
truss
Pressurized Elements
truss
Pressurized Elements
American Institute of Aeronautics and Astronautics
16
References 1Mikatarian, R., H. Barsamian, J. Kern, S. Koontz, and J-F. Roussel, “Plasma Charging of the International Space Station,”
53rd International Astronautical Congress, The World Space Congress -2002, Houston, Texas, 2002. 2Barsamian, H., R. Mikatarian, J. Alred, J. Minow, and S. Koontz, “ISS Plasma Interaction: Measurements and Modeling,”
8th Spacecraft Charging Technology Conference, Huntsville, Alabama, 2003. 3Mikatarian, R., H. Barsamian, and J. Kern, “Boeing ISS Plasma Model,” ISS Plasma Technical Interchange Meeting,
Huntsville, Alabama, 2003. 4Koontz, S., and et al., “Materials Interactions with the Space Environment: International Space Station – May 2000 to May
2002,” The Sixth International Conference on Protection of Materials and Structures from the Space Environment, Toronto, Canada, May 2002.
5Mikatarian, R. H. Barsamian, J. Alred, J. Kern, J. Minow, and S. Koontz, “Electrical Charging of the International Space Station,” 41st Aerospace Sciences Meeting and Exhibit, Reno, Nevada, 2003.
6Reddell, B., “Review of Existing Satellite Data,” ISS Plasma Technical Interchange Meeting, Huntsville, Alabama, 2004. 7Brace, L.., “Langmuir probe measurements in the ionosphere,” Measurement Techniques in Space Plasmas: Particles,
edited by R. F. Plaff, J. E. Borovsky, and D. T. Young, Geophysical Union Monograph 102 AGU, 1998. 8SAIC, “Documentation of the ISS Solar Array Electron Current Collection Model and Mast Current Collection Model,”
2004.