analysis of the dynamics of the forest surfaces in … - volume8_issue_2 06_paper.pdf ·...
TRANSCRIPT

DOI 10.2478/pesd-2014-0026 PESD, VOL. 8, no. 2, 2014
ANALYSIS OF THE DYNAMICS OF THE FOREST SURFACES IN
THE COUNTY OF IAŞI BETWEEN 1990 AND 2012
Alina Daniela Cojinovschi1, Eugen Rusu1
Key words: forest surfaces, data quality check, Iaşi county, spatial and territorial
autocorrelation effect
Abstract. The main dynamics that shaped the evolution of the forest surfaces
between 1990 and 2012, in the county of Iaşi, are related to the legislative context
and to the territorial reforms that affected the district limits. Analyzing these
mechanisms in a geographical context shows that these trends are also related to the
spatial frame. This study emphasizes that moderate negative coefficients of spatial
and territorial autocorrelation can also describe these trends, suggesting that these
evolutions are rather chaotic at local scale. This aspect makes us suspect that the loss
of forest surfaces in each district is not only dependent on the economic, social and
legislative context of the transition period, it is also subject to geographical factors.
Analyzing these factors is the main intention of our study because they can provide
us a better understanding of the extremely complicated frame of forest dynamics in
the study area.
Introduction Forest has always played an important role in human life, providing him with
shelter, food (fruit, seeds and hunting resources), building material and tools. In
Romania, the massive exploiting of forest is marked by the Treaty of Adrianople
(1829) when the Romanian countries acquire their right to free navigation on the
Danube and the Black Sea and the freedom of trade. Obtaining these privileges and
population growth lead to increased farmland in the plains and plateaus areas by
massive deforestation of broad-leaves forests, more accessible to coniferous forests
in mountainous areas, their exploiting being more difficult and being conducting
mainly to the top in the valleys. They then appear first problems caused by massive
deforestation, a series of ordinances that aimed to protect forests (without much
success though), followed by the reorganization of education and the emergence of
1 ”Alexandru Ioan Cuza” University of Iași, Romania
Alina Daniela Cojinovschi, Eugen Rusu
76
forest science (forestry) and the establishment in Bucharest of the "Progress
Forest" (1886) and the publication of "Forest magazine". The first half of the
twentieth century is marked by a series of memorable political events (the two
world wars, the end of the monarchy, the beginning of the communist regime),
each taking its toll on the stability and sustainability of Romanian forests by
changing the forms of ownership and the emergence of land reforms that actually
had catastrophic effects, warning signs being held by a number of foresters such as
Marin Drăcea, Emil Pop, Gheorghe Ionescu-Şişeşti, N. R. Danilescu, and more.
In the contemporary period, the forest acquires multiple functions, are
increasingly often the main topic of scientific papers ( Acad. C. Giurescu, Acad. V.
Giurgiu, C. Chirită, etc.) but also the subject of numerous articles newspaper
reports and political campaigns. Worldwide are set a number of international
organizations and institutions aimed at the protection and sustainable development
of forests ("is the kind of development that meets present needs without
compromising future generations the chance to meet their own needs"-Commission
World Environment and Development, 1987). In the Rio Conference (1992)
appears ecological network Nature 2000, implemented in Romania between 2006-
2008, currently about 18% of the country is considered to be protected areas.
The main trends in the research today more often link the forests to climate
change. In a paper called Plan 3-0. Mobilizing to save civilization, L. Brown
claims that the main issues that should concern today are the demographic
pressure, the increase of CO2 gas, exhaustion of natural resources, global warming
and that ˮ we cross verges that we can’t see and death-lines we don’t recognize ˮ.
That is why it is necessary to take some global measures (Dieter H.F. Schoene and
Pierre Y. Bernier, 2012; N. La Porta et al., 2008) to stop the long term effect of
human society over the forest. Between 1990 and 2005 were recorded some of the
most droughty and hottest years in the human history, the lasts research claim that
until 2100 global temperature will rise in Europe with 3°C, even 4-5°C in the area
of Black See (Lindner M., et al., 2010) and obviously affect the vitality of the
forest, especially in the Southern part of Romania.
Another problem for the Romanian forest is the legislation (Giurescu, 1976;
Giurgiu, 2000, 2010) and a poor collaboration between state institutions. The
retrocession (a process that allows the return of forests nationalized under the
communist regime back to the community owners or private ones, or to their
descendants) that started at the end of ʼ90 become a real challenge for Romanian
state who lost almost 70% of the forest surfaces (Lawrence, A., 2009) and is now
facing a highly fragmented estate of private property (Nijnik., M., et al., 2009),
with an average holding of 0.9 ha.
In this context, a study related to the evolution of forest surfaces at local and
intermediate level is more than necessary, both for a better academic understanding

Analysis of the dynamics of forest surfaces in the county of Iaşi between 1990 and 2012
77
and for policy design support. This paper aims to identify the main trends that
shaped the forest surfaces evolution between 1990 and 2012, based on data
provided by reliable sources such as the NFA and TIFH, for the county of Iaşi.
Using tools derived from the classical spatial analysis and cartographic depection
of the dynamics, we identified the main chronological milestones in the evolution
of the forests surfaces, at district scale. Subject to multiple political and legislative
decisions (2 Forestry Codes published in the last 20 years) and territorial reforms
(private forest districts), the dynamics of forest surfaces are sometimes hard to
capture without a scrupulous data check methodology.
Fig. 1 Territorial distribution of forests in the County of Iaşi in 2010
Our main hypothesis states that the evolution's dynamics can be better
understood when placed in a double geographical context - spatial and territorial.
Our methodology is based on the construction of robust indicator of
autocorrelation, which can be plotted in order to extract the trends. The
cartographic analysis we propose serves as a secondary objective, explaining the
dynamics at local scale (district), in various contexts (only 8 forest districts, a large
amount of data, suspect values in the indicators or missing data).
Alina Daniela Cojinovschi, Eugen Rusu
78
1. Data and methods
1.1 Data Source
The main data we used in this paper is provided by the NFA (National Forest
Administration) and covers the situation of forests in the county of Iași for the
period 1990-2012, excepting the year of 1999 when the Forestry Authority of Iași
was dissolved. A secondary data source is TIFH (Territorial Inspectorate for
Forests and Hunting). The information collected from this source covers the period
between 2006 and 2012. A major shift in the legislation regarding the reporting
methodology explains why we needed a secondary data provider in our research,
some of the indicators being used in this paper becoming available only in the
TIFH statistics. The National Statistical Institute provides data only at NUTS3 and
NUTS2 level, a geographical scale not appropriate for our study. However, the
statistic information provided by this institution was useful in order to compare
stock data summarized from the first two data sources. Due to uncertainty in the
quality of data, the EEA Corine Land Cover layers were not included in our
analysis.
The data provided by NFA was not on electronic support and needed
adjustments for use in GIS and statistical analysis. The lack of metadata was
another problem encountered during our work. As a matter of fact, despite the good
intentions of the RNP, they still lack a territorial vision in the forestry
administration, their statistical database being more appropriate for economic audit
intentions. This problem of the metadata absence involved a severe quality data
check for outlier detection. A total amount of 2420 indicators and variables
populated the database we created for this research. They can be grouped on 5
major categories, declined by the property status - public vs. private. The indicator
named Public property is divided in forest in public property of state and forests in
public property of the local administrative units. The indicator labeled Private
property is composed by forests in private property of individuals and legal entities
and forests in private property of local administrative units. To these four
categories we added the total surfaces. Territorially, our information covers 8 forest
districts in the county of Iași. The geographical division in the spatial
administration of forests is another topic of discussion. The forest districts of
Grajduri, Răducăneni and Dobrovăț have surfaces in the administration that
belongs to the county of Vaslui. The district of Podu Iloaiei used to manage 25
hectares of forest in the Neamț county, between 1990 and 2004. However, the data
we integrated in the research is spatially referred to districts covering only the
NUTS3 of Iași.
1.2 Data quality check
The analysis of data for quality check involved an error tracking by
summarized indicators - total surfaces of forests, coniferous forests, broad -leaved

Analysis of the dynamics of forest surfaces in the county of Iaşi between 1990 and 2012
79
forests and other terrains. Generally, the error checking analysis revealed only
minor mistakes, acceptable in our research. This type of errors (statistical outliers)
is derived from misspecifications in the other terrains category. Less frequently,
mistakes concerning the forest's total surface can be encountered. For example, in
the case of the Răducăneni district a total amount of 160 hectares is missing from
the reported surfaces (years of 1994-1996). These surfaces did not vanish, they
were simply not taken into account as they were declared private property. This
confused period of forests' restitution explains a large amount of the discrepancies
within the data. The template of the statistical reporting of data was not constantly
respected by the RNP, some of the data being excluded for incomprehensible
reasons. When focusing on some particular years (e.g. the district of Podu Iloaiei in
1997) we observe significant differences between the total surface of other terrains
and the sum of the indicators that compose this category (production,
administration, constructions, afforestation etc.). What is inquisitive in this case is
the fact that in the time series these mistakes are constantly revised and the errors
are simply erased by adjusting other indicators. As a consequence of this data
smoothing implemented by the NFA on the time-series, the total surfaces are
always correct. As a first conclusion, taking into account the template of the
reported information (variable in time), the issues observed for some particular
years, the missing or not reported data, the quality data check was a necessary step
in our research. In this moment, we estimate a rough ratio of 98 % reliable
statistical information in our data collection.
1.3 Linking data to geometry
The base map we use in this paper is provided the RNP. At origin it was a.
dwg file for AutoCAD use and spatial visualization. The layers were converted and
imported in ArcGIS and over-layed. A join field was created in our database, in
order to allow us mapping the indicators. The base map is composed by several
layers: the 8 districts present in the county of Iași, the built-up areas (rural and
urban), the major hydrographic network and the forest surfaces managed by the
NFA in 2010. A .kmz file was created using Google Earth (c)tm and it contains the
most recent image of the forest cover for the Iași county. It serves for spatial data
quality check; our intention was to observe the differences or concordance between
the NFA geometry (2010) and the satellite images.
1.4 Methods: statistical exploration and cartographic analysis
The methodology we mobilized in this research is based on a quantitative
approach that follows prudent steps: data quality check, spatial analysis and time
series analysis. The major problem we faced in our analysis is the reduced number
of districts (only 8); this issue is compensated by the quantity of indicators
obtained by data collection. As we intend to observe the trends in the forest surface
evolution between 1990 and 2012, we will use two different methods -the

Alina Daniela Cojinovschi, Eugen Rusu
80
cartographic representation and analysis and the phase diagram instrument, the last
one being extremely robust for trends identification. If the mapping process will
emphasize the main dynamics of forest surfaces, at district level, the phase diagram
will identify how these dynamics shift when changing the geographical scale.
Basically, this phase diagram is a derived scatter-plot where the time is
consubstantial to the data and the X and Y axis refer to the dynamics of two
different spatial units.
2. Results and discussions
At the begining of the transition period (1990), the communist regime left a
forestry fund of 6371 thousand hectares, most of it being located in the mountain
and low-mountain area, more precisely in the North-West, Centre and North-East
parts of Romania. That surface was the equivalent of 26.72 % of the country’s
surface. The North-East Region (six NUTS3 - Bacău, Botoşani, Iaşi, Neamţ,
Suceava and Vaslui) was cumulating in that moment about 1186.6 thousands
hectares int the forestry fund, from which 1168 thousand hectares of forests. The
three mountain counties of Suceava, Neamţ and Bacău were leaders in the regional
top, with nearly 82 % of the forest’ surface. At regional scale the ratio between the
species was almost equal - coniferous (581,5 thousand hectares) and broad-leaved
species (586.5 thousand hectares).
At the same moment, the Forestry Authority of Iași was managing 8 forest
districts (Paşcani, Dobrovăţ, Ciurea, Grajduri, Hârlău, Iaşi, Podu Iloaiei and
Răducăneni); however, the spatial delineation of the forest surfaces was ignoring
the county limits. Consequently, this authority was also managing forest surfaces in
the neighbor counties of Vaslui (2927 ha, in 1990 with the districts of Dobrovăţ,
Grajduri and Răducăneni) and Neamţ (25 ha managed by the district of Podu
Iloaiei). The statistical reports are related to this territorial frame of forest
management, our intention was to explore the early 90’ database and to order the
information independently to the counties limits.
In 1990 the National Forest Administration of Iași managed a total fund of
96310 hectares (94083 hectares of forests). Excepting 124 ha (from which 91 ha of
forests) managed by the Minstry of Defense and some industrial compartiments in
the districts of Pașcani, these surfaces were exclusively in the property of the state.
At county level, analyzing the density of forests, the opposition between the
northern districts and the central-southern ones is easy to observe. Moreover, this
opposition remains stable in time (1990-1998) the dynamics of this indicator being
extremely low. Comparing the districts, one can identify some interesting
disparities in the forest repartition. Thus, almost half of the forestry fund is located
in three districts: Paşcani (14057 ha), Ciurea (15427 ha) and Podu Iloaiei (17044
ha), while two other districts present similar values but significantly lower –
Analysis of the dynamics of forest surfaces in the county of Iaşi between 1990 and 2012
81
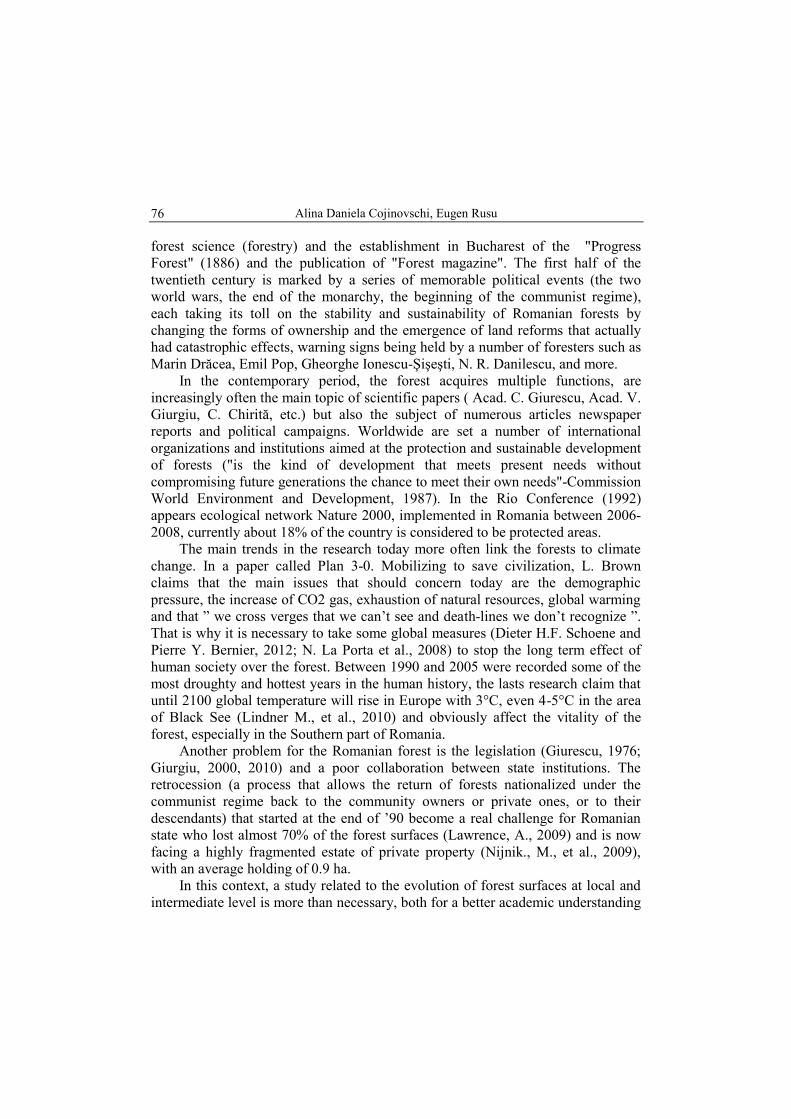
Dobrovăţ (9173 ha), Răducăneni (8813 ha). The last in this class is the district of
Grajduri with a high-intermediate value of 11476 ha. All these 6 districts are in the
category of spatial units with high densities of forest, on their territory.
Fig. 2 Evolution of forest relative share at district level in 1990
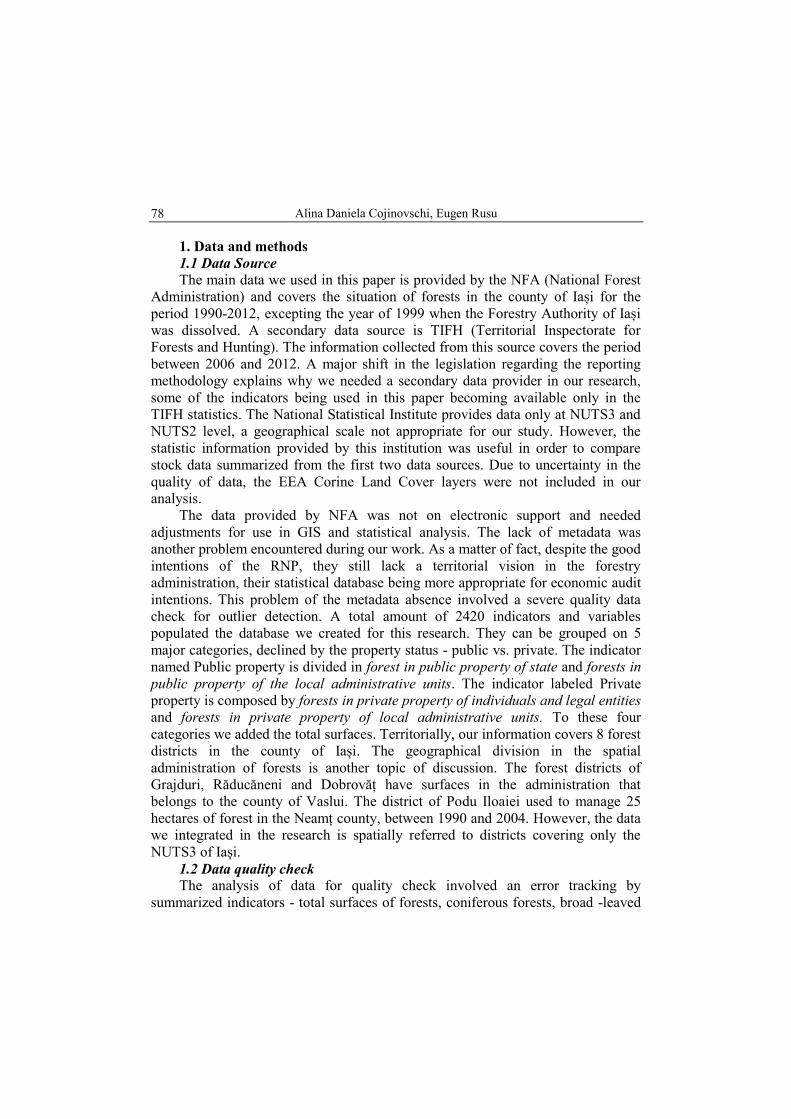
Fig. 3 Evolution of forest relative share at district level in 1994
Alina Daniela Cojinovschi, Eugen Rusu
82
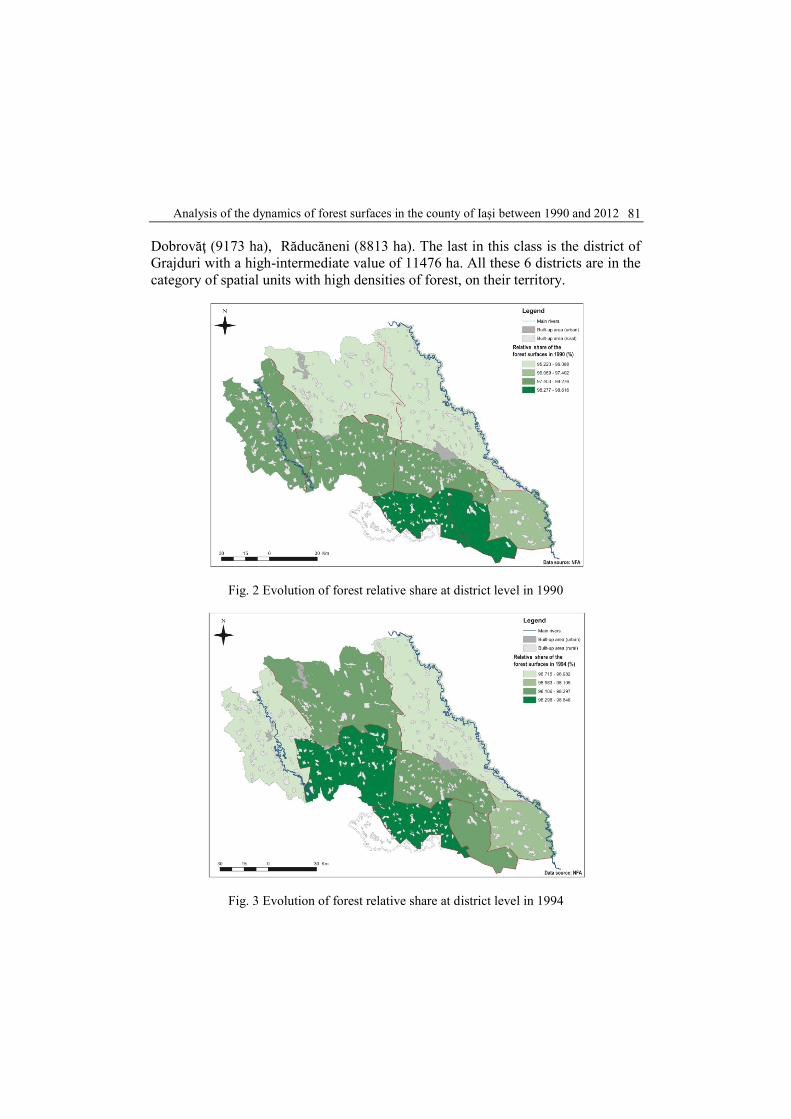
Fig. 4 Evolution of forest relative share at district level in 1998
The dynamics of the forest surfaces in the period of 1990-1998 is apparently
stable, as the three maps (evolution of forest relative share in 1990, 1994 and 1998)
illustrate. A point density map was used as tool to identify this overall general
stability. The reduction of the surfaces covered by forest is almost unnoticeable in
the northern part of the county (districts of Iași, Hîrlău and Pașcani), while in the
southern area is more visible, especially in the districts of Dobrovăț and
Răducăneni. This situation is not explained by the quality of data, active processes
of deforestation being perceptible for this period of time.
In relative terms, some of the districts loosed almost 2 % of the forest
managed by the RNP; it is the case of the district of Podu Iloaiei. Only one district
registered an increase of forest surfaces, it is the case for Grajduri. The dynamics
become more accelerated after the year 2000. For the next 12 years, the map shows
a reduction of the forest surfaces that reaches almost 30% in the district of Podu
Iloaiei. This negative trend is also visible for other spatial units, but less intensive.
In the same time, the districts situated in the Valley of Prut river shows the most
reduced deforestation trends (Iași and Răducăneni).

Analysis of the dynamics of forest surfaces in the county of Iaşi between 1990 and 2012
83
Fig. 5 Evolution of forest surfaces between 1990 and 1998
The trends we observe behave differently when analyzed in a spatial and
territorial context. The method we propose will identify these trends using tools
derived from the spatial analysis. Two particular instruments will be used in this
approach: a chrono-variogram of spatial and territorial auto-correlation and the
phase diagram using data for neighbor districts. In order to explore how the spatial
and territorial context interfere with the dynamics of the forest surfaces, the relative
evolutions of the indicators will be weighted with two binary matrices, one
describing the neighborhood relations and one the territorial belonging.
Our main hypothesis states that there is a spatial and territorial effect in the
evolution of forest surfaces, at district level. This effect can be measured by an
indicator of spatial auto-correlation that was calculated for the period between
1990 and 2012. The first step in the implementation of this method is the
construction of spatial weighted matrix of relations between the districts. We have
made an option for a binary contiguity based matrix. With only eight districts to
analyze, other methods proposed in the literature (inverse distance weight, k-
nearest neighbors and fixed distance band) are not appropriated taking into account
the small number of spatial units. The second step consisted in the preparation of a

Alina Daniela Cojinovschi, Eugen Rusu
84
dissimilarity matrix for two indicators - surfaces of forest at district level (absolute
values) and their relative evolution between 1991 and 2012. The analysis was
iterated for all the available years, excepting 1999, 2003, 2004 and 2005 (due to the
missing of data) and the results synthesized in a correlogram that presents two
Fig. 6 Evolution of forest surfaces between 2000 and 2012
Tab. 1 Dissimilarity matrix for the relative evolution of forest (2012)
distinct trends. The evolution of forest surfaces as absolute values has a constant
trend of negative spatial auto-correlation (maximum: -0.31 and minimum: -0.14).
This trend suggests that the evolutions observed are independent to the spatial

Analysis of the dynamics of forest surfaces in the county of Iaşi between 1990 and 2012
85
context, indicating the presence of a significant heterogeneity on the map. Locally,
each district presents a trend of absolute evolution that differs from the neighbors.
Fig. 7 Evolution of SAC effect between 1991 and 2012
Contrasting to the absolute evolution of the forest surfaces, the relative trends
are marked by positive spatial auto-correlation. The graphic shows that the relative
reduction or extension of forest surfaces was highly dependent on the spatial
context for years like 1993, 1994, 1995, 2006 and 2007. The local trends become
heterogeneous after 1996, if we analyze the values of the indicator, culminating
with a strong negative coefficient in 2001(-0.57). The construction of the
autocorrelation coefficient is based on the aggregated variance of the dissimilarities
between districts, in a double context - neighborhood and non-contiguity.
I.S.A.C. =indicator of spatial autocorrelation
Dij = absolute dissimilarity between any two (i,j) districts, for the indicators we
analyzed - value of the forest surfaces and relative evolution of forest surfaces.
n = number of spatial units
r = the value of the spatial relation between any two districts (1 if neighbors, else 0)

Alina Daniela Cojinovschi, Eugen Rusu
86
Fig.8 Evolution of TAC effect between 1991 and 2012
The value of the I.S.A.C could be interpreted similarly to the Pearson'
coefficient of statistical correlation. If the value is closed to 1, we assist to positive
spatial autocorrelation. When the value is closed to -1, one will deal with negative
spatial correlation. When I.S.A.C. is closed to 0, we cannot detect the role played
by space in the distribution of an indicator.
The same method of analysis was applied choosing a different context for the
weighted values of the dissimilarities between forest districts, the territorial
belonging. The eight districts were divided in two regions - the South Region
(Răducăneni, Dobrovăț, Ciurea and Grajduri) and the North Region (Pașcani,
Hârlău, Podu Iloaiei and Iași) and a new matrix was built (a binary table containing
values of 0 and 1). Analyzing the maps, we suspected that this effect of territorial
belonging could also explain the trends of evolution of the forest surfaces, either in
absolute or relative terms.
After the iteration of the method we have obtained a graph that depicts the
evolution of the coefficient of territorial autocorrelation between 1991 and 2012.
The coefficient presents a strong and stable effect of negative territorial
autocorrelation for the evolution of forest surfaces (absolute values). This should
be interpreted as regional heterogeneity - any pair of districts belonging to the
South or North region shows divergent trends of evolution. Contrary, in the case of
the relative indicator, we observe a cyclical trend with two picks of positive
Analysis of the dynamics of forest surfaces in the county of Iaşi between 1990 and 2012
87
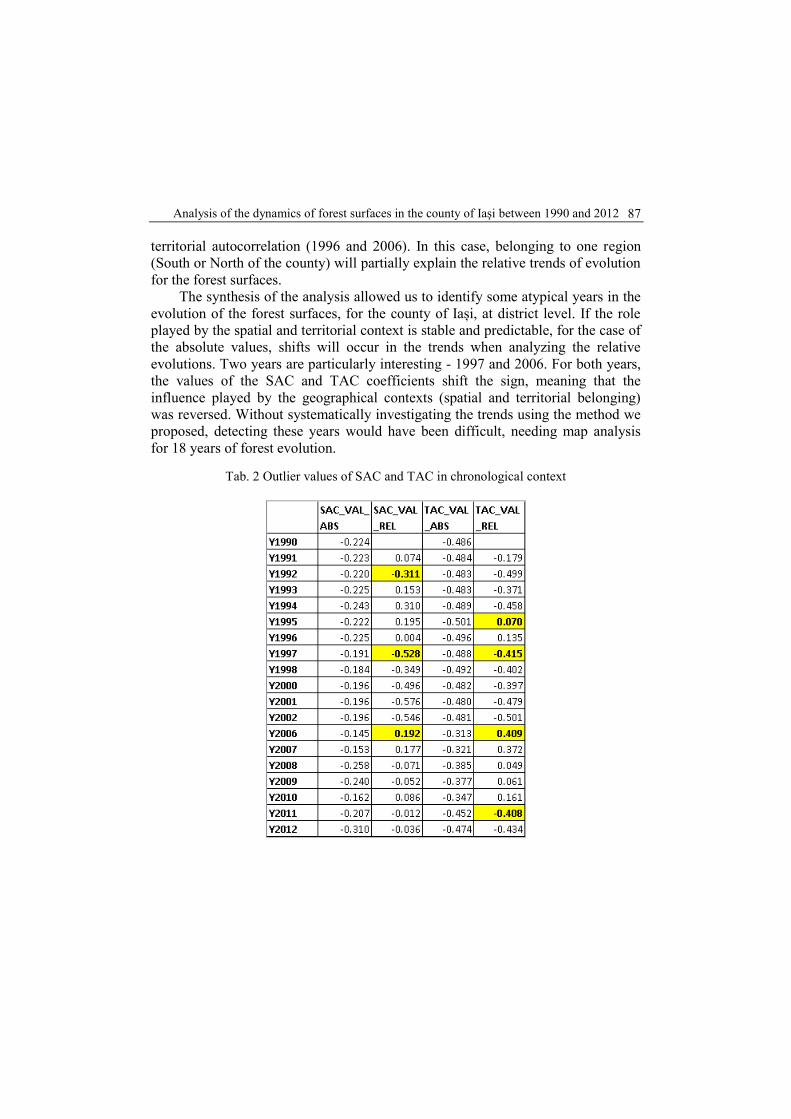
territorial autocorrelation (1996 and 2006). In this case, belonging to one region
(South or North of the county) will partially explain the relative trends of evolution
for the forest surfaces.
The synthesis of the analysis allowed us to identify some atypical years in the
evolution of the forest surfaces, for the county of Iași, at district level. If the role
played by the spatial and territorial context is stable and predictable, for the case of
the absolute values, shifts will occur in the trends when analyzing the relative
evolutions. Two years are particularly interesting - 1997 and 2006. For both years,
the values of the SAC and TAC coefficients shift the sign, meaning that the
influence played by the geographical contexts (spatial and territorial belonging)
was reversed. Without systematically investigating the trends using the method we
proposed, detecting these years would have been difficult, needing map analysis
for 18 years of forest evolution.
Tab. 2 Outlier values of SAC and TAC in chronological context

Alina Daniela Cojinovschi, Eugen Rusu
88
Conclusions
In the almost chaotic context of the forest dynamics that affects the county of
Iaşi, between 1990 and 2012, one can observe that these surfaces are decaying
according to a geographical pattern that can be measured using the spatial and
territorial autocorrelation coefficients. This decline is marked by heterogeneity,
both at local and zonal scale (North vs. South of the county). The explanation of
this heterogeneity should be linked to the legislative retrocession of forest surfaces,
a legislative mechanism with different rhythms at district and LAU2 (local
administrative unit - UAT) level. In this logic, the most affected districts are
Paşcani, Grajduri and Podu Iloaiei. The chronological evolutions of the coefficients
we propose indicate that there are some key years (1992, 1997 and 2006) that
deserve a special focus in the analysis of the forest trends. If in 1992 the
retrocession process just began to show its effects, in 1997 the legislative frame is
changed by a new forestry code. In 2006 we assist to a massive change in the
providing of official data related to the forest surfaces. The data from TIFH allows
us to perform a more detailed analysis of the 2006-2012 period, introducing new
actors involved in the management of the private surfaces. In the context of our
study, the main conclusion states that despite the negative trends of evolution are
not dramatic and that the geographical research should focus more on the
administrative and legislative frame that explains how these trends function.
Refrences Behrens, H.: Eastern Europe struggles with forest management challenges, Journal of soil
and water Conservation number 5, volume 61, 2006
Bernier, P., Schoene, D.: Adapting forest and their management to climate change – an
overview, Unasylva, volume 60, 2009
Brown, L.: Plan 3-0. Mobilizing to save civilization, Technical Press, Bucharest, 2008
Burley, J., Evans, J., Youngquist, J. A.: Encyclopedia of forest sciences, Elsevier
Academic Press, 2004
Chiriță, C., Doniță, N., Ivănescu, D., Lupe, I., Milescu, I., Stănescu, V., and Vlad, I.: Romanian Forests, Academy Press, Bucharest, 1981
Dutcă, I., Abrudan, I. V.: Estimation of forest land-cover in Romania, between 1990-
2006, Bulletin of the Transylvania University of Brașov , volume 3, 2010
Giurescu, C. C.: The history of Romanian forest from oldest time until today, Cereș Press,
Bucharest, 1976
Giurgiu, V.: Evolution of Romanian forest structure depending on the nature of propriety,
Forest Magazine number 1, 2000
Giurgiu, V.: Forests and environment changes, Academy Press, Bucharest, 2005
Giurgiu, V.: Considerations on Romanian forest found, Forest Magazine number 2, 2010
Giurgiu, V.: Forests and climate change, Forest Magazine number 3, 2010

Analysis of the dynamics of forest surfaces in the county of Iaşi between 1990 and 2012
89
Helms, J. A.: The dictionary of Forestry, CAB International and the Society of American
Foresters, 1998
Ioras, F.: Trends in Romanian biodiversity conservation policy, Biodiversity and
Conservation , Kluwer Academic Publishers, pp 9-23, 2003
La Porta, N. et al.: Forest pathogens with higher damage potential due to climate change
in Europe, Canadian Journal of Plant Pathology, 2008
Lawrence, A.: Forestry in transition: Imperial legacy and negotiated expertise in Romania
and Poland, Forest Policy and Economics 11, pp 429-436, 2009
Lindner, M et al.: Climate change impacts, adaptive capacity and vulnerability of
European forest ecosystems, Forest Ecology and Management 259, Elsevier Press, pp
698-709, 2010
Maracchi, G., Sirotenko, O., Bindi, M.: Impacts of present and future climate variability
on agriculture and forestry in the temperate regions: Europe, Climatic Change 70,
Springer Press, pp 117-135, 2005
Nijnik, M., Nijnik, A., Bizikova, L.: Analyzing the development of small scale Forestry
in Central and Eastern Europe, Small Scale Forestry, pp 159-174, 2009
Rusu, E.: Current trends of development of forests areas to protect soil and water at global
and regional level, Dimitrie Cantemir Geographic seminar, Iași, 2011
Rusu, E.: Forest geography, Univ. Al. I. Cuza Press, Iași, 2012
Schoene, D. H. F., Bernier, P. Y.: Adapting forestry and forest to climate change: A
challenge to change the paradigm , Forest Policy and Economics 24, pp 12-19, 2012
Ursu, A., Stoleriu, C., Sfica, C., Roșca, L.: Corine Land Cover Nomenclature adaptation
to land use change specific of Romania, Technical Geography, pp163-198, 2006
Veen, P. et al.: Virgin forests in Romania and Bulgaria: results of two national inventory
projects and their implications for protection, Biodiversity Conservation, Springer
Press, pp 1805-1819, 2010
Vilen, T. et al.: Reconstructed forest age structure in Europe 1950-2010, Forest Ecology
and Management 286, Elsevier Press, pp 203-218, 2012