analysis of tunnels in shaly rock considering three ... swelling behaviour under three-dimensional...
TRANSCRIPT

Analysis of tunnels in shaly rock consideringthree-dimensional stress effects on swelling
B.C. Hawlader, K.Y. Lo, and I.D. Moore
Abstract: Underground structures in shales or shaly rocks endure time-dependent swelling effects. Laboratory testresults show that the swelling of these shales is dependent on three-dimensional stresses; an external stress on a speci-men in one principal direction reduces the swelling not only in that direction but also perpendicularly. The effective-ness of a time-dependent swelling model that considers the three-dimensional stress effect is presented in this paper. Afinite element algorithm incorporating the new constitutive model is used for a numerical analysis. The finite elementprogram is used to analyze two tunnels in southern Ontario: the Heart Lake storm sewer tunnel, and the Darlingtoncold-water intake tunnel. The predicted results agree well with the records of field performance of these tunnels. Thecomparison between present analyses and the existing closed-form solution shows that the existing solution overesti-mates the time-dependent swelling effects. The three-dimensional stress effects on swelling are not considered in theclosed-form solutions and are the cause of this discrepancy. The pseudo-Poisson’s effect is a key parameter for model-ling the observed time-dependent swelling. The use of these solutions in design is discussed.
Key words: time-dependent swelling, shale, modelling, three-dimensional stress effect, finite element method, tunnel.
Résumé : Les structures souterraines dans les shales et les roches schisteuses subissent des effets de gonflement enfonction du temps. Les résultat d’essais en laboratoire montrent que le gonflement de ces shales dépend des contraintestridimensionnelles ; une contrainte extérieure sur un spécimen dans une direction principale réduit le gonflement nonseulement dans cette direction mais aussi perpendiculairement. Dans cet article, on présente l’efficacité d’un modèle degonflement en fonction du temps qui tient compte de l’effet des contraintes tridimensionnelles. On utilise un algo-rithme en éléments finis incorporant le nouveau modèle constitutif pour une analyse numérique. Le programme en élé-ments finis est utilisé pour analyser deux tunnels dans le sud de l’Ontario : le Heart Lake storm sewer tunnel et leDarlington cold-water intake tunnel. Les résultats prédits concordent bien avec les données de la performance sur leterrain. La comparaison entre ces présentes analyses et la solution exacte existante montre que la solution existantesurestime les effets de gonflement en fonction du temps. Les effets de la contrainte tridimensionnelle sur le gonflementne sont pas prises en compte dans les solutions exactes et sont la cause de cette divergence. Le pseudo-effet de Poissonest un paramètre clé pour modéliser le gonflement observé en fonction du temps. On discute de l’utilisation de ces so-lutions dans la conception.
Mots clés : gonflement en fonction du temps, shale, modélisation, effet des contraintes en trois dimensions, méthodedes éléments finis, tunnel.
[Traduit par la Rédaction] Hawlader et al. 12
Introduction
Numerous tunnels have been built and new tunnels areplanned for construction in the shales and shaly rocks insouthern Ontario. Case studies (e.g., Lo et al. 1978; Lo andYuen 1981; Lo 1986) show that underground structures built
in these formations have undergone stress-dependent long-term swelling deformation (Lo et al. 1978). Lo and Lee(1990) show in laboratory tests that the application of stresson a rock specimen reduces the swelling strain not only inthe direction of applied stress but also in its orthogonal di-rections. As an example, a relatively small amount of verti-cal stress (0.02 MPa) reduces the free swell potential by30% in the horizontal direction where no external stressesare applied. The swelling deformation is anisotropic due tothe inherent rock structure (e.g., the free swell potential ofGeorgian Bay shale in the vertical direction is three to fivetimes that in the horizontal direction within the 2%–6%range of calcite content; Lo et al. 1979). Moreover, theseshales are typically in a highly anisotropic in situ stressstate, with the horizontal stress much higher than the verticalstress (e.g., initial stress ratio K0 = 10 for the rock formationaround the Darlington cold-water intake tunnel; Lo andLukajic 1984). Therefore, it is necessary to analyze the time-
Can. Geotech. J. 42: 1–12 (2005) doi: 10.1139/T04-083 © 2005 NRC Canada
1
Received 28 July 2003. Accepted 10 August 2004. Publishedon the NRC Research Press Web site at http://cgj.nrc.ca on4 February 2005.
B.C. Hawlader. C-CORE, Morrissey Road, St. John’s, NLA1B 3X5, Canada.K.Y. Lo.1 Geotechnical Research Centre, Faculty ofEngineering, University of Western Ontario, London, ONN6A 5B9, Canada.I.D. Moore. Infrastructure Engineering, Queen’s University,Kingston, ON K7L 3N6, Canada.
1Corresponding author (e-mail: [email protected]).

dependent swelling behaviour under three-dimensional stressconditions for the design of tunnels.
Based on the so-called “swelling law,” several time-independent constitutive models are developed for the swell-ing of rocks (e.g., Grob 1972; Einstein et al. 1972; Wittkeand Pierau 1979). These models are not appropriate for theshales in southern Ontario, as the swelling of these shales isdue to moisture migration rather than chemical changes (Leeand Lo 1993). The International Society of Rock Mechanics(ISRM Commission on Swelling Rock 1994) examined theswelling models available in the literature and concludedthat, although the swelling deformation due to chemicalchange may be adequately predicted using available models,time-dependent swelling models need to be developed froma fundamental knowledge of the swelling mechanism. Loand Yuen (1981) and Lo and Hefny (1996) have developedrheological models for the time-dependent swelling of rocks.Closed-form solutions developed in both studies predict theswelling effects on a circular tunnel. Field performance ofthe existing tunnels shows that these models simulate thetrend of swelling behaviour very well, and the models areused in the design of several underground structures insouthern Ontario (e.g., Lo et al. 1986; Trow and Lo 1989).Lo and Yuen (1981) did not consider any stress effect onswelling in their model, and Lo and Hefny (1996) assumedthat only the radial pressure on the lining affects the swell-ing deformation. As shown in the paper, the omission of any
stress effect makes the prediction conservative. It is alsonecessary to predict the long-term swelling deformation thatis observed in the field. As an example, the swelling defor-mation of a wheelpit at Niagara Falls (Lee and Lo 1976) isshown in Fig. 1 where the time-dependent deformation for75 years has been recorded. Hawlader et al. (2003) have de-veloped a constitutive model for the swelling of rock thatconsiders the three-dimensional stress effects and aniso-tropic swelling. The anisotropic and three-dimensionalstress-dependent swelling model cannot be accommodatedin a closed-from solution, and a numerical solution must beemployed.
The main objective of this paper is to develop a numericalapproach to study swelling effects on underground struc-tures. The paper consists of three parts. The first part brieflydescribes the swelling model that has been developed fromthe laboratory test results on the shales in southern Ontario.The second part deals with the model implementation in a fi-nite element code. Lastly, the numerical code is used to ana-lyze the case histories of the Heart Lake storm sewer tunnel(Lo et al. 1979; Lo and Yuen 1981) and the Darlington cold-water intake tunnel (Lo and Lukajic 1984).
Swelling model
Laboratory tests on shales in southern Ontario (e.g., Loand Lee 1990) show that the swelling strains in the principal
© 2005 NRC Canada
2 Can. Geotech. J. Vol. 42, 2005
Fig. 1. Inward movement of the wheelpit at Niagara Falls (after Lee and Lo 1976).
directions of a rock specimen increase linearly with the log-arithm of time. The slope of this line is denoted as the“swelling potential” (Lo et al. 1978). Maximum swellingoccurs when there is zero external pressure acting on thespecimen. The swelling potential under zero external pres-sure is known as the “free swelling potential.” The swellingpotential decreases with increases in applied stress on thespecimen. The stress in one principal direction reduces theswelling strain not only in that direction but also perpendic-ularly (Lo and Lee 1990). Hawlader et al. (2003) modelledthe swelling of rock under three-dimensional stress using thefollowing set of equations:
[1] ε i it m t ts( ) log( / )= 0
[2] m R mi i i= −( ) ( )1 0TS
[3] RiiTSTS
th
c th
= log( / )log( / )
σ σσ σ
[4] σ σ δ σ σ σi i ij
RijTSth
c th= + −( ) [ log( / )]1 10
[5] R Rij ij jj= µ
[6] Rjjj=
log( / )
log( / )
σ σσ σ
th
c th
where ε i ts( ) is the swelling strain in the ith principal directionat time t; mi is the swelling potential under the three-dimensional stress condition; δij is the Kronecker delta; t0 isthe reference time; Rij are the reduction ratios; and the su-perscripts i and j represent the principal directions.
The input parameters required for this model are (i) freeswelling potential (mi(0)); (ii) threshold stress (σth), where thestress below which applied stress has no effect on swelling;(iii) critical stress (σc), where stress equal to or greater thanthis magnitude completely suppresses swelling; (iv) pseudo-Poisson’s ratio (µ); and (v) reference time (t0), which is thetime from which swelling begins. The first four input param-eters can be obtained from free swell and modified semi-confined swell tests (Lee 1988; Hawlader et al. 2003), and t0can be obtained from the expected advance rate of the tunnelduring construction. Further details are discussed in the fol-lowing sections.
The main objective of this paper is the implementation ofthe aforementioned model in the numerical analysis. Thephysical aspects of the model can be found in Hawlader etal. (2003).
Swelling effects on tunnels
The model described in the previous section is used topredict the swelling effects on underground structures. Con-sider a tunnel in a swelling rock mass as shown in Fig. 2a.The horizontal and vertical axes are represented by x and y,respectively, and r and θ represent the radial and angular po-sitions of a rock element, respectively. The in situ stresscomponents of a rock element are σx0 and σy0 and are shownin Fig. 2b after excavation at a point A. The stress effect onswelling modelled in the section titled Swelling model is inthe principal axis system. Figure 2c shows the transformedstresses in the principal directions. The direction of the ma-jor principal stress relative to the horizontal axis (x) is repre-
sented by an angle αp1 (Fig. 2c). The free swelling potentialsare shown in Fig. 2d, which shows that the free swelling po-tential is different in the horizontal and vertical directions inthe anisotropic swelling model and is constant for the isotro-pic swelling model.
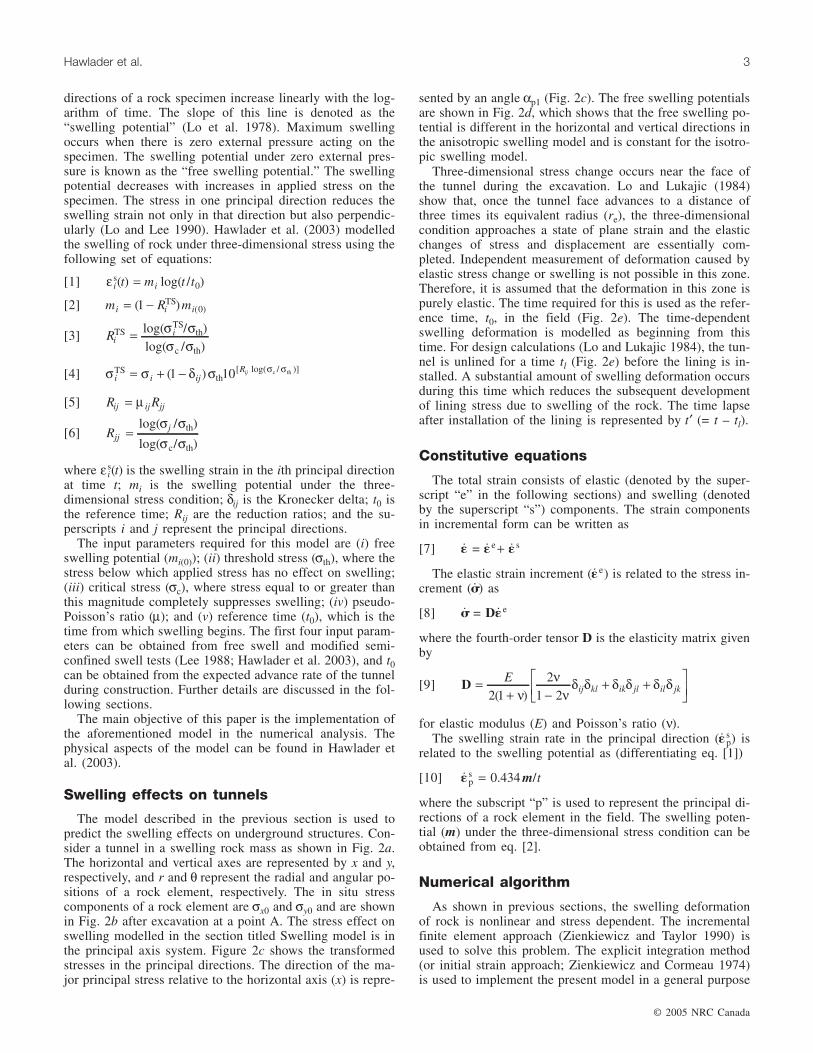
Three-dimensional stress change occurs near the face ofthe tunnel during the excavation. Lo and Lukajic (1984)show that, once the tunnel face advances to a distance ofthree times its equivalent radius (re), the three-dimensionalcondition approaches a state of plane strain and the elasticchanges of stress and displacement are essentially com-pleted. Independent measurement of deformation caused byelastic stress change or swelling is not possible in this zone.Therefore, it is assumed that the deformation in this zone ispurely elastic. The time required for this is used as the refer-ence time, t0, in the field (Fig. 2e). The time-dependentswelling deformation is modelled as beginning from thistime. For design calculations (Lo and Lukajic 1984), the tun-nel is unlined for a time tl (Fig. 2e) before the lining is in-stalled. A substantial amount of swelling deformation occursduring this time which reduces the subsequent developmentof lining stress due to swelling of the rock. The time lapseafter installation of the lining is represented by t′ (= t – tl).
Constitutive equations
The total strain consists of elastic (denoted by the super-script “e” in the following sections) and swelling (denotedby the superscript “s”) components. The strain componentsin incremental form can be written as
[7] = e s+
The elastic strain increment (e) is related to the stress in-crement () as
[8] = D e
where the fourth-order tensor D is the elasticity matrix givenby
[9] D =+ −
+ +⎡⎣⎢
⎤⎦⎥
Eij kl ik jl il jk
2 12
1 2( )νν
νδ δ δ δ δ δ
for elastic modulus (E) and Poisson’s ratio (ν).The swelling strain rate in the principal direction (p
s ) isrelated to the swelling potential as (differentiating eq. [1])
[10] ps 0.434 /= m t
where the subscript “p” is used to represent the principal di-rections of a rock element in the field. The swelling poten-tial (m) under the three-dimensional stress condition can beobtained from eq. [2].
Numerical algorithm
As shown in previous sections, the swelling deformationof rock is nonlinear and stress dependent. The incrementalfinite element approach (Zienkiewicz and Taylor 1990) isused to solve this problem. The explicit integration method(or initial strain approach; Zienkiewicz and Cormeau 1974)is used to implement the present model in a general purpose
© 2005 NRC Canada
Hawlader et al. 3

finite element program called AFENA (Carter and Balaam1990).
As is common in the finite element analysis, the formula-tion uses the principle of virtual work. According to the ini-tial strain approach, the equilibrium equations, compatibilityconditions, and stress–strain relations for the nth time stepare represented as
[11] K∆ ∆ ∆a F F F Fn n n n n= + + −− −*intext ext
1 1
[12] ∆ ∆n= B an
[13] ∆ ∆ ∆ n n= −D[ ( ) ]s n
with
[14] K B DB= ∫ T dΩ
Ω
[15] ∆ ∆ ΩΩ
F* ( )n n= ∫ B DT s d
[16] Fintn− −= ∫1 BT 1dn Ω
Ω
where K is the stiffness matrix of the element assemblage;∆F*n is the pseudo-load vector increment; ∆Fext
n is the exter-nal load vector increment; Fext
n−1 and Fintn−1 are the external
and internal force vectors, respectively; the superscripts nand n – 1 are used to represent time step n and its predeces-
sor; a is the nodal displacement vector; matrix B relatesstrain and displacement using shape functions; σ and ε arethe stress and strain vectors, respectively; and Ω is the vol-ume of the body. The difference between external and inter-nal force vectors ( )F Fext int
n n− −−1 1 is the unbalanced or residualforce vector due to truncation and round-off error. Ideally, itshould vanish at the end of each step, but for a nonlinearanalysis 100% equilibrium seldom occurs. The use of thisforce in eq. [11] avoids the accumulation of errors and en-sures the total equilibrium of the solution.
Step-by-step procedure
The formulation described in the previous section requiresstep-by-step computation. The excavation of the tunnel isconsidered an instant unloading that corresponds to the elas-tic calculation step. There is no change in external loadin the following time steps (∆t t tn n n= − −1). The time-dependent swelling deformation occurs at this stage andcauses the redistribution of internal stresses. The plane straincondition is used in the analysis, and the algorithm used tomove from the (n – 1)th to nth time step is as follows:(1) The calculation begins with the values of n−1, n−1,
an−1, and Fn−1 at the (n – 1)th time step. Determine theincremental external load vector (∆Fext
n ), and calculatethe internal force vectors (Fint
n−1) and pseudo-load vector(∆F*n) using eqs. [16] and [15], respectively.
© 2005 NRC Canada
4 Can. Geotech. J. Vol. 42, 2005
Fig. 2. (a) Sign convention and geometry. (b) Stress components at point A after excavation. (c) Principal stress components at pointA. (d) Free swell potentials. (e) Definition of time.
(2) Calculate the incremental displacement vector (∆an) us-ing eq. [11], and find the strain increment vector (∆n)using the strain–displacement relationship given ineq. [12].
(3) Calculate the magnitudes (pn−1) and rotations (p
n−1) ofthe principal stresses (Fig. 2c) from n−1, and then cal-culate the free swelling potentials in the principal stressdirections as (Fig. 2d)
[17] m m mi x i y i( ) ( ) ( )cos sin0 0 0= +α αp p
where i = 1 and 2 for the major and minor principalstresses, respectively.
(4) Calculate the reduction ratios in the principal stress di-rections (Rjj) and in the orthogonal directions (Rij) usingeqs. [6] and [5], respectively.
(5) Calculate the total suppression stress (σ iTS) using eq. [4].
(6) Calculate RiTS using eq. [3], and then from eq. [2] calcu-
late the swelling potentials (mi) under the three-dimensional stress state.
(7) Compute the swelling strain rates (ps ) in the principal
directions using eq. [10] and transfer them to s in the(x, y, z) coordinate system.
(8) Determine the incremental swelling strain (∆s) withinthe nth time step:
[18] ( ) ( )∆ ∆ s sn n t≈ −1
(9) Calculate the stress increment (∆n) using eq. [13].(10)Update the stress, strain, and displacement at the end of
the nth time step; these are the starting values of thenext time step:
[19]
n n n
n n n
n n n
= +
= +
= +
−
−
−
1
1
1
∆
∆
∆a a a
The computation is then shifted to the next time step andthe process is repeated until the assigned time is completed.Note that the deformation behaviour of the rock is modelledwith nonlinear swelling over time and provides an instanta-neous response based on linear elasticity. The main advan-tage in using the initial strain approach is that the stiffnessmatrix is only assembled and disassembled at the very be-ginning of the computation and is used in all iterations. Theswelling effects are incorporated using the pseudo-load vec-tor (eq. [15]).
All analyses presented here employ a finite element meshusing six-noded triangular plane strain elements for the rockand straight beam–column elements for the concrete lining.A no-slip (perfectly rough) condition is assumed for therock–lining interface. The lining is considered to be elastic.The swelling strain rate is higher for the rock elements nearthe excavation because of the higher stress reductions.Therefore, smaller elements are used near the face of the ex-cavation and the element size is increased with an increasein the radial distance. The swelling deformation is nonlinear,with a greater magnitude at the beginning of the calculation(see eq. [1]). An initial time step of 0.1 days is used in theanalyses and is gradually increased to 2 days after 10 yearsof swelling. These time steps maintain the numerical stabil-ity that is an important issue in time-dependent analysis.
Application of the model to case records
The numerical procedure in the previous section is used toanalyze two tunnels in swelling rocks in southern Ontario.The performance of these tunnels is monitored over a longperiod of time (Lo and Yuen 1981; Lo and Lukajic 1984).
Heart Lake tunnelHeart Lake tunnel is a trunk storm sewer tunnel con-
structed in 1975 near the Pearson International Airport, To-ronto. The tunnel is 3 m in finished diameter and 1.5 kmlong. Three construction methods were used: (i) cut andcover (232 m), (ii) drill and blast (183 m), and (iii) machineboring (1050 m). Lo and his coworkers (Lo et al. 1979; Loand Yuen 1981) reported the geological conditions of thesite and the properties of the rock. The in situ stress condi-tion and the properties of the rock and lining used in thisanalysis are obtained from those works and are listed in Ta-ble 1. The numerical analyses are mainly performed for amachine-bored section at CH 136+20 (Fig. 12 of Lo andYuen 1981). This section is considered for two reasons:(i) the in situ horizontal stresses around the section weremeasured (Lo et al. 1979), and (ii) the rock around themachine-bored section is relatively intact compared to thedrill and blast section where the rock is fractured due toblasting. It is shown later that higher values of K0 lead togreater lining stress as a result of swelling. A parametricstudy is also performed for K0 because the lateral earth pres-sure coefficient decreases towards the upstream direction.
The change in initial stress caused by the excavation initi-ates the time-dependent swelling deformation of the rock(Lo 1978). Analysis and field measurement (Lo et al. 1979)show that the in situ stress change due to excavation is verysmall beyond a radial distance of 5r2, where r2 is the radiusof excavation. As the depth of the tunnel at CH 136+20 isconsiderably greater than this, the tunnel is considered to be“deep,” so only one quarter of the tunnel section needs to beanalyzed.
As mentioned earlier, the swelling deformation of rock ismodelled to begin when the tunnel face advances to a dis-tance of three times the equivalent radius (re). Numericalanalyses show that the difference between the predicted lin-ing stresses using t0 values equal to 5 and 20 days is only5% after 3 years of swelling. Moreover, the difference re-duces with time. As long-term effects are the main concernin the design for swelling, any selection of t0 within thisrange of time is suitable for design. The values of t0 for thefollowing calculations have been selected from the excava-tion records of the tunnel during construction.
Results of analysisOnce the lining is in contact with rock, the time-
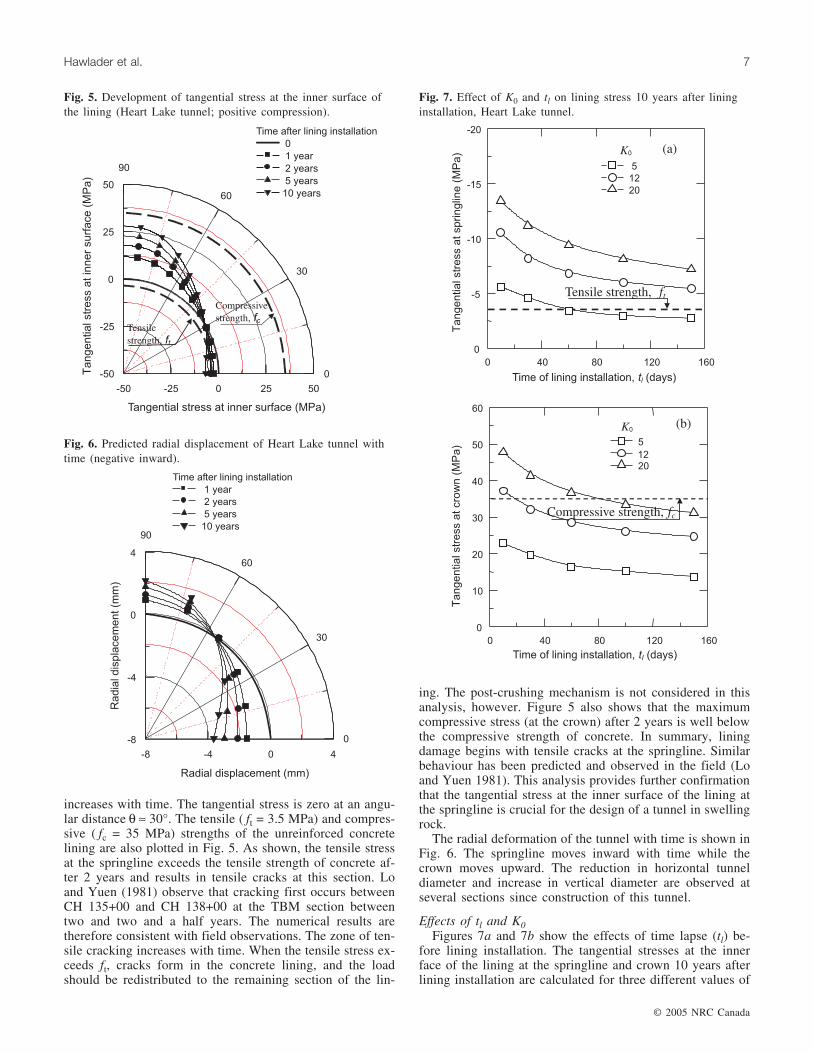
dependent swelling of the surrounding rock generates axialthrust and bending moment within it. The non-uniformswelling of rock under anisotropic stress distribution causesthe bending moment. A value of 12 for the initial stress ratio(K0 = σx0 /σy0) is used in this analysis (Lo and Yuen 1981).The development of the axial thrust in the concrete lining isshown in Fig. 3. The axial thrust is mainly compressive andis maximum at the crown. The distribution of the bendingmoment in the concrete lining is shown in Fig. 4. The bend-
© 2005 NRC Canada
Hawlader et al. 5
ing moment is positive at the springline, gradually decreas-ing to zero at θ ≈ 50° and becoming negative at the crown.The sign convention used here is a positive bending momentthat causes tensile stress at the inner fibre of the concretelining. The axial thrust and bending moment distributionsshow that the maximum stresses in tension and compression
occur at the inner face of the lining at the springline andcrown, respectively. Therefore, discussion in the followingsections focuses mainly on the stresses at the inner face ofthe lining.
Figure 5 shows the tangential stress at the inner face ofthe lining, which is tensile (negative) at the springline andcompressive (positive) at the crown. The magnitude of stress
© 2005 NRC Canada
6 Can. Geotech. J. Vol. 42, 2005
Heart Lake Darlington
GeometryOuter radius of tunnel, r2 (m) 1.675 4.5Thickness of concrete lining, dc (m) 0.3 0.5Shape of the tunnel Circular D-shaped
Initial stressVertical stress, σy0 (MPa) 0.435 Overburden
Horizontal stress, σx0 K0σy0 Field (Fig. 11)
Rock propertiesElastic
Elastic modulus, Er (MPa) 12 400 25 000Poisson’s ratio, νr 0.15 0.33
Time-dependent swellingThreshold stress, σth (MPa) 0.001 0.001Ratio of critical stress to horizontal stress, σc/σx0 0.6 0.6Reference time, t0 (days) 10 10Pseudo-Poisson’s ratio, µ 0.6 0.6Free swelling potentials (%)
mx(0) 0.10 0.025my(0) 0.42 0.060
mz(0) 0.10 0.025
Concrete liningElastic modulus, El (MPa) 28 000 28 000Poisson’s ratio, νl 0.2 0.2Time of lining installation, tl (days) 100 100
Table 1. Geometry and parameters used in the analyses.
Fig. 3. Development of axial thrust in the concrete lining withtime (Heart Lake tunnel) (positive compression).
Fig. 4. Development of bending moment in the concrete lining(Heart Lake tunnel). Positive moment causes tensile stress at theinner face.
increases with time. The tangential stress is zero at an angu-lar distance θ ≈ 30°. The tensile ( ft = 3.5 MPa) and compres-sive ( fc = 35 MPa) strengths of the unreinforced concretelining are also plotted in Fig. 5. As shown, the tensile stressat the springline exceeds the tensile strength of concrete af-ter 2 years and results in tensile cracks at this section. Loand Yuen (1981) observe that cracking first occurs betweenCH 135+00 and CH 138+00 at the TBM section betweentwo and two and a half years. The numerical results aretherefore consistent with field observations. The zone of ten-sile cracking increases with time. When the tensile stress ex-ceeds ft, cracks form in the concrete lining, and the loadshould be redistributed to the remaining section of the lin-
ing. The post-crushing mechanism is not considered in thisanalysis, however. Figure 5 also shows that the maximumcompressive stress (at the crown) after 2 years is well belowthe compressive strength of concrete. In summary, liningdamage begins with tensile cracks at the springline. Similarbehaviour has been predicted and observed in the field (Loand Yuen 1981). This analysis provides further confirmationthat the tangential stress at the inner surface of the lining atthe springline is crucial for the design of a tunnel in swellingrock.
The radial deformation of the tunnel with time is shown inFig. 6. The springline moves inward with time while thecrown moves upward. The reduction in horizontal tunneldiameter and increase in vertical diameter are observed atseveral sections since construction of this tunnel.
Effects of tl and K0Figures 7a and 7b show the effects of time lapse (tl) be-
fore lining installation. The tangential stresses at the innerface of the lining at the springline and crown 10 years afterlining installation are calculated for three different values of
© 2005 NRC Canada
Hawlader et al. 7
Fig. 5. Development of tangential stress at the inner surface ofthe lining (Heart Lake tunnel; positive compression).
Fig. 6. Predicted radial displacement of Heart Lake tunnel withtime (negative inward).
Fig. 7. Effect of K0 and tl on lining stress 10 years after lininginstallation, Heart Lake tunnel.

K0 (5, 12, and 20). The elapsed time between the excavationand the installation of the lining varies from 10 to 150 days(Lo et al. 1979). These figures show that the tangentialstress decreases with an increase in tl for a given value ofK0. On the other hand, the tangential stress increases with anincrease in K0 for the same value of tl. This trend is similarto that of the previous closed-form solutions (Lo and Yuen1981; Lo and Hefny 1996). If tl is less for a large value ofK0 (e.g., tl = 10 days and K0 = 20), the lining stresses at thecrown and springline exceed the compressive and tensilestrengths of concrete, respectively, after 10 years. Figure 7ashows that the formation of cracks at the springline after10 years is possible in this tunnel if K0 is relatively large(K0 > 6), even if the lining is installed 150 days after the ex-cavation. A similar response is observed in the field. As it isnot possible to leave the tunnel unlined for a long period oftime after the excavation, the use of crushable material be-tween the excavated rock surface and the lining, as sug-gested by Lo and Yuen (1981), could prevent lining damage.
Darlington cold-water intake tunnelThe Darlington Generating Station is a nuclear power
generating station located 60 km east of Toronto on theshore of Lake Ontario. A D-shaped cold-water intake tunnelof 8 m span and 925 m length has been constructed in hori-zontally bedded Lindsay limestone with thin shaly interbeds.The longitudinal profile of the tunnel is shown in Fig. 8. Loand Lukajic (1984) report the deformation of the tunnelmeasured at different sections using extensometers.
Typical extensometer readings are shown in Fig. 9 and areobtained from the extensometers at CH 0+36 (Fig. 8) alongthe springline. The relative displacement is less for exten-someter B–C than for extensometer A–C (see inset toFig. 9). The convergence along the springline is also shownin Fig. 9. The rapid initial inward movement is the elasticdeformation that results from the excavation. The movement
© 2005 NRC Canada
8 Can. Geotech. J. Vol. 42, 2005
Fig. 8. Longitudinal profile of Darlington cold-water intake tunnel (after Lo and Lukajic 1984).
Fig. 9. Convergence and movement of anchored points atspringline, Darlington cold-water intake tunnel.
Fig. 10. Finite element mesh used in simulation of Darlingtoncold-water intake tunnel.
continues with time at a slower rate because of the swellingof the rock.
Results of numerical analysisFigure 10 shows the dimensions of the tunnel section at
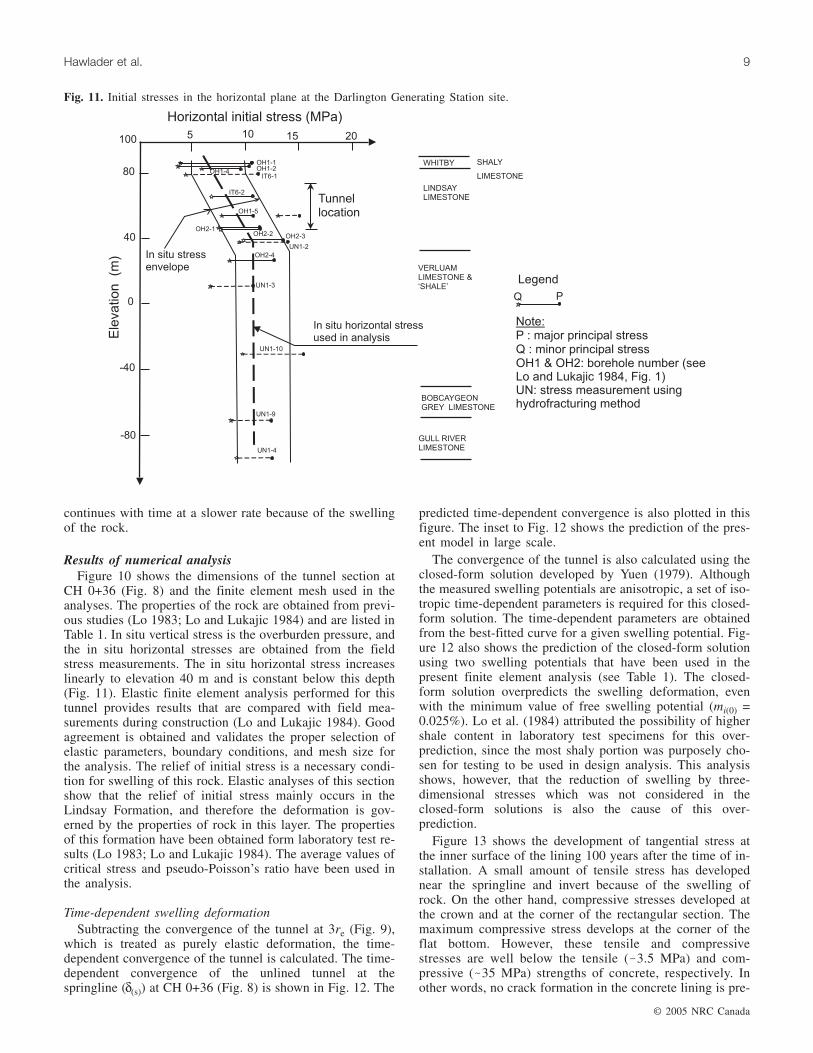
CH 0+36 (Fig. 8) and the finite element mesh used in theanalyses. The properties of the rock are obtained from previ-ous studies (Lo 1983; Lo and Lukajic 1984) and are listed inTable 1. In situ vertical stress is the overburden pressure, andthe in situ horizontal stresses are obtained from the fieldstress measurements. The in situ horizontal stress increaseslinearly to elevation 40 m and is constant below this depth(Fig. 11). Elastic finite element analysis performed for thistunnel provides results that are compared with field mea-surements during construction (Lo and Lukajic 1984). Goodagreement is obtained and validates the proper selection ofelastic parameters, boundary conditions, and mesh size forthe analysis. The relief of initial stress is a necessary condi-tion for swelling of this rock. Elastic analyses of this sectionshow that the relief of initial stress mainly occurs in theLindsay Formation, and therefore the deformation is gov-erned by the properties of rock in this layer. The propertiesof this formation have been obtained form laboratory test re-sults (Lo 1983; Lo and Lukajic 1984). The average values ofcritical stress and pseudo-Poisson’s ratio have been used inthe analysis.
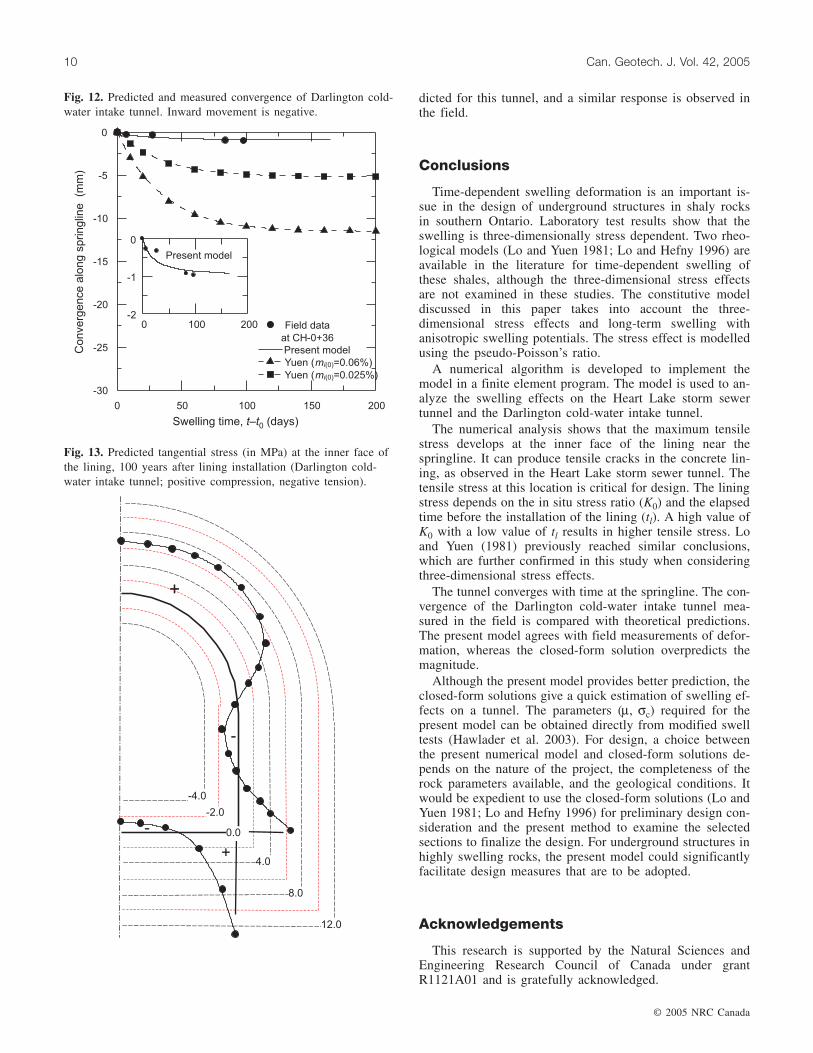
Time-dependent swelling deformationSubtracting the convergence of the tunnel at 3re (Fig. 9),
which is treated as purely elastic deformation, the time-dependent convergence of the tunnel is calculated. The time-dependent convergence of the unlined tunnel at thespringline (δ(s)) at CH 0+36 (Fig. 8) is shown in Fig. 12. The
predicted time-dependent convergence is also plotted in thisfigure. The inset to Fig. 12 shows the prediction of the pres-ent model in large scale.
The convergence of the tunnel is also calculated using theclosed-form solution developed by Yuen (1979). Althoughthe measured swelling potentials are anisotropic, a set of iso-tropic time-dependent parameters is required for this closed-form solution. The time-dependent parameters are obtainedfrom the best-fitted curve for a given swelling potential. Fig-ure 12 also shows the prediction of the closed-form solutionusing two swelling potentials that have been used in thepresent finite element analysis (see Table 1). The closed-form solution overpredicts the swelling deformation, evenwith the minimum value of free swelling potential (mi(0) =0.025%). Lo et al. (1984) attributed the possibility of highershale content in laboratory test specimens for this over-prediction, since the most shaly portion was purposely cho-sen for testing to be used in design analysis. This analysisshows, however, that the reduction of swelling by three-dimensional stresses which was not considered in theclosed-form solutions is also the cause of this over-prediction.
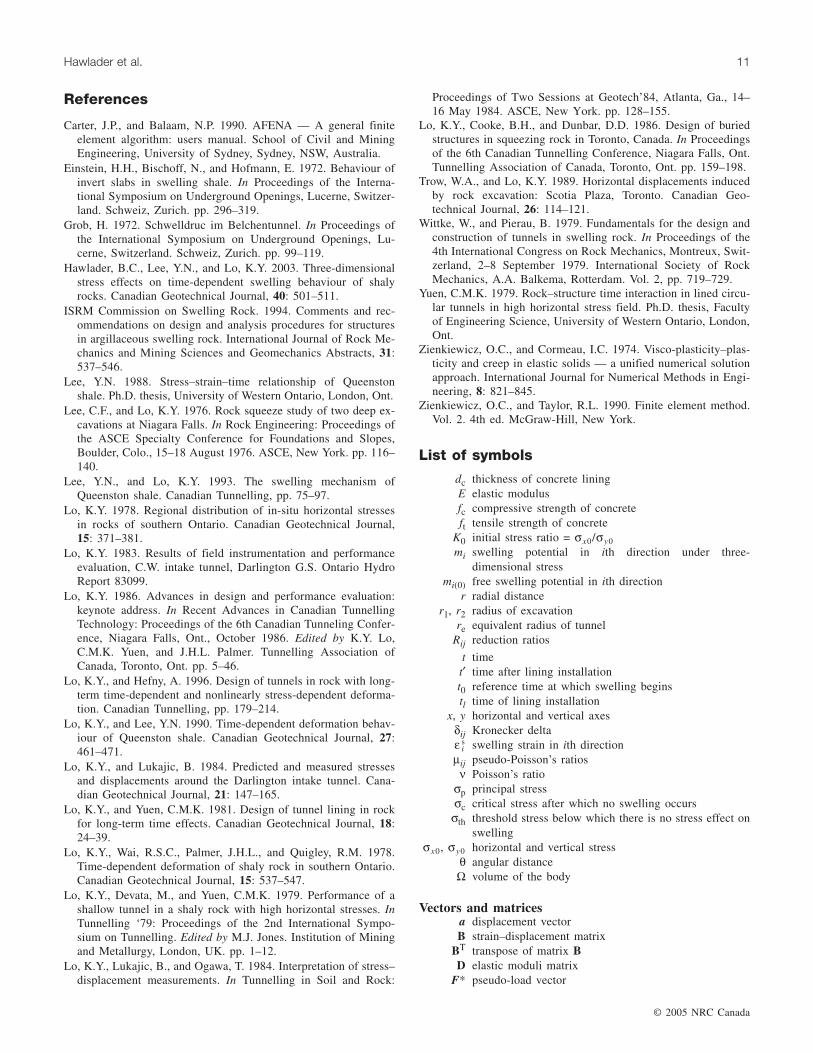
Figure 13 shows the development of tangential stress atthe inner surface of the lining 100 years after the time of in-stallation. A small amount of tensile stress has developednear the springline and invert because of the swelling ofrock. On the other hand, compressive stresses developed atthe crown and at the corner of the rectangular section. Themaximum compressive stress develops at the corner of theflat bottom. However, these tensile and compressivestresses are well below the tensile (3.5 MPa) and com-pressive (35 MPa) strengths of concrete, respectively. Inother words, no crack formation in the concrete lining is pre-
© 2005 NRC Canada
Hawlader et al. 9
Fig. 11. Initial stresses in the horizontal plane at the Darlington Generating Station site.
dicted for this tunnel, and a similar response is observed inthe field.
Conclusions
Time-dependent swelling deformation is an important is-sue in the design of underground structures in shaly rocksin southern Ontario. Laboratory test results show that theswelling is three-dimensionally stress dependent. Two rheo-logical models (Lo and Yuen 1981; Lo and Hefny 1996) areavailable in the literature for time-dependent swelling ofthese shales, although the three-dimensional stress effectsare not examined in these studies. The constitutive modeldiscussed in this paper takes into account the three-dimensional stress effects and long-term swelling withanisotropic swelling potentials. The stress effect is modelledusing the pseudo-Poisson’s ratio.
A numerical algorithm is developed to implement themodel in a finite element program. The model is used to an-alyze the swelling effects on the Heart Lake storm sewertunnel and the Darlington cold-water intake tunnel.
The numerical analysis shows that the maximum tensilestress develops at the inner face of the lining near thespringline. It can produce tensile cracks in the concrete lin-ing, as observed in the Heart Lake storm sewer tunnel. Thetensile stress at this location is critical for design. The liningstress depends on the in situ stress ratio (K0) and the elapsedtime before the installation of the lining (tl). A high value ofK0 with a low value of tl results in higher tensile stress. Loand Yuen (1981) previously reached similar conclusions,which are further confirmed in this study when consideringthree-dimensional stress effects.
The tunnel converges with time at the springline. The con-vergence of the Darlington cold-water intake tunnel mea-sured in the field is compared with theoretical predictions.The present model agrees with field measurements of defor-mation, whereas the closed-form solution overpredicts themagnitude.
Although the present model provides better prediction, theclosed-form solutions give a quick estimation of swelling ef-fects on a tunnel. The parameters (µ, σc) required for thepresent model can be obtained directly from modified swelltests (Hawlader et al. 2003). For design, a choice betweenthe present numerical model and closed-form solutions de-pends on the nature of the project, the completeness of therock parameters available, and the geological conditions. Itwould be expedient to use the closed-form solutions (Lo andYuen 1981; Lo and Hefny 1996) for preliminary design con-sideration and the present method to examine the selectedsections to finalize the design. For underground structures inhighly swelling rocks, the present model could significantlyfacilitate design measures that are to be adopted.
Acknowledgements
This research is supported by the Natural Sciences andEngineering Research Council of Canada under grantR1121A01 and is gratefully acknowledged.
© 2005 NRC Canada
10 Can. Geotech. J. Vol. 42, 2005
Fig. 12. Predicted and measured convergence of Darlington cold-water intake tunnel. Inward movement is negative.
Fig. 13. Predicted tangential stress (in MPa) at the inner face ofthe lining, 100 years after lining installation (Darlington cold-water intake tunnel; positive compression, negative tension).
References
Carter, J.P., and Balaam, N.P. 1990. AFENA — A general finiteelement algorithm: users manual. School of Civil and MiningEngineering, University of Sydney, Sydney, NSW, Australia.
Einstein, H.H., Bischoff, N., and Hofmann, E. 1972. Behaviour ofinvert slabs in swelling shale. In Proceedings of the Interna-tional Symposium on Underground Openings, Lucerne, Switzer-land. Schweiz, Zurich. pp. 296–319.
Grob, H. 1972. Schwelldruc im Belchentunnel. In Proceedings ofthe International Symposium on Underground Openings, Lu-cerne, Switzerland. Schweiz, Zurich. pp. 99–119.
Hawlader, B.C., Lee, Y.N., and Lo, K.Y. 2003. Three-dimensionalstress effects on time-dependent swelling behaviour of shalyrocks. Canadian Geotechnical Journal, 40: 501–511.
ISRM Commission on Swelling Rock. 1994. Comments and rec-ommendations on design and analysis procedures for structuresin argillaceous swelling rock. International Journal of Rock Me-chanics and Mining Sciences and Geomechanics Abstracts, 31:537–546.
Lee, Y.N. 1988. Stress–strain–time relationship of Queenstonshale. Ph.D. thesis, University of Western Ontario, London, Ont.
Lee, C.F., and Lo, K.Y. 1976. Rock squeeze study of two deep ex-cavations at Niagara Falls. In Rock Engineering: Proceedings ofthe ASCE Specialty Conference for Foundations and Slopes,Boulder, Colo., 15–18 August 1976. ASCE, New York. pp. 116–140.
Lee, Y.N., and Lo, K.Y. 1993. The swelling mechanism ofQueenston shale. Canadian Tunnelling, pp. 75–97.
Lo, K.Y. 1978. Regional distribution of in-situ horizontal stressesin rocks of southern Ontario. Canadian Geotechnical Journal,15: 371–381.
Lo, K.Y. 1983. Results of field instrumentation and performanceevaluation, C.W. intake tunnel, Darlington G.S. Ontario HydroReport 83099.
Lo, K.Y. 1986. Advances in design and performance evaluation:keynote address. In Recent Advances in Canadian TunnellingTechnology: Proceedings of the 6th Canadian Tunneling Confer-ence, Niagara Falls, Ont., October 1986. Edited by K.Y. Lo,C.M.K. Yuen, and J.H.L. Palmer. Tunnelling Association ofCanada, Toronto, Ont. pp. 5–46.
Lo, K.Y., and Hefny, A. 1996. Design of tunnels in rock with long-term time-dependent and nonlinearly stress-dependent deforma-tion. Canadian Tunnelling, pp. 179–214.
Lo, K.Y., and Lee, Y.N. 1990. Time-dependent deformation behav-iour of Queenston shale. Canadian Geotechnical Journal, 27:461–471.
Lo, K.Y., and Lukajic, B. 1984. Predicted and measured stressesand displacements around the Darlington intake tunnel. Cana-dian Geotechnical Journal, 21: 147–165.
Lo, K.Y., and Yuen, C.M.K. 1981. Design of tunnel lining in rockfor long-term time effects. Canadian Geotechnical Journal, 18:24–39.
Lo, K.Y., Wai, R.S.C., Palmer, J.H.L., and Quigley, R.M. 1978.Time-dependent deformation of shaly rock in southern Ontario.Canadian Geotechnical Journal, 15: 537–547.
Lo, K.Y., Devata, M., and Yuen, C.M.K. 1979. Performance of ashallow tunnel in a shaly rock with high horizontal stresses. InTunnelling ‘79: Proceedings of the 2nd International Sympo-sium on Tunnelling. Edited by M.J. Jones. Institution of Miningand Metallurgy, London, UK. pp. 1–12.
Lo, K.Y., Lukajic, B., and Ogawa, T. 1984. Interpretation of stress–displacement measurements. In Tunnelling in Soil and Rock:
Proceedings of Two Sessions at Geotech’84, Atlanta, Ga., 14–16 May 1984. ASCE, New York. pp. 128–155.
Lo, K.Y., Cooke, B.H., and Dunbar, D.D. 1986. Design of buriedstructures in squeezing rock in Toronto, Canada. In Proceedingsof the 6th Canadian Tunnelling Conference, Niagara Falls, Ont.Tunnelling Association of Canada, Toronto, Ont. pp. 159–198.
Trow, W.A., and Lo, K.Y. 1989. Horizontal displacements inducedby rock excavation: Scotia Plaza, Toronto. Canadian Geo-technical Journal, 26: 114–121.
Wittke, W., and Pierau, B. 1979. Fundamentals for the design andconstruction of tunnels in swelling rock. In Proceedings of the4th International Congress on Rock Mechanics, Montreux, Swit-zerland, 2–8 September 1979. International Society of RockMechanics, A.A. Balkema, Rotterdam. Vol. 2, pp. 719–729.
Yuen, C.M.K. 1979. Rock–structure time interaction in lined circu-lar tunnels in high horizontal stress field. Ph.D. thesis, Facultyof Engineering Science, University of Western Ontario, London,Ont.
Zienkiewicz, O.C., and Cormeau, I.C. 1974. Visco-plasticity–plas-ticity and creep in elastic solids — a unified numerical solutionapproach. International Journal for Numerical Methods in Engi-neering, 8: 821–845.
Zienkiewicz, O.C., and Taylor, R.L. 1990. Finite element method.Vol. 2. 4th ed. McGraw-Hill, New York.
List of symbols
dc thickness of concrete liningE elastic modulusfc compressive strength of concreteft tensile strength of concrete
K0 initial stress ratio = σ σx y0 0/mi swelling potential in ith direction under three-
dimensional stressmi(0) free swelling potential in ith direction
r radial distancer1, r2 radius of excavation
re equivalent radius of tunnelRij reduction ratios
t timet′ time after lining installationt0 reference time at which swelling beginstl time of lining installation
x, y horizontal and vertical axesδij Kronecker deltaε i
s swelling strain in ith directionµij pseudo-Poisson’s ratios
ν Poisson’s ratioσp principal stressσc critical stress after which no swelling occurs
σth threshold stress below which there is no stress effect onswelling
σx0, σy0 horizontal and vertical stressθ angular distanceΩ volume of the body
Vectors and matricesa displacement vectorB strain–displacement matrix
BT transpose of matrix BD elastic moduli matrix
F* pseudo-load vector
© 2005 NRC Canada
Hawlader et al. 11

Fextn external force vector at nth time step
Fintn internal force vector at nth time stepK stiffness matrixm swelling potential vector
mpswelling potential in the principal stress direction
pi rotation of the principal stress vector strain vector
s swelling strain vector total strain rate vector
e elastic strain rate vector s swelling strain rate vector stress vector stress rate vector
p principal stress vector
© 2005 NRC Canada
12 Can. Geotech. J. Vol. 42, 2005