analytical note no. 10 - irish fiscal advisory council · •this note examines the forecasting...
TRANSCRIPT
Analytical Note No. 10: September 2016
Challenges Forecasting Irish Corporation Tax
Eddie Casey and Andrew Hannon

© Irish Fiscal Advisory Council 2016
This report can be downloaded at www.fiscalcouncil.ie

Challenges Forecasting Irish Corporation Tax
3
K E Y M E S S A G E S
• This note examines the forecasting approach used by the Department of Finance and the Revenue
Commissioners for Irish corporation tax revenues. It is motivated in part by the large size of forecast
errors in recent years. The note also assesses the wider implications for medium-term expenditure
planning of the difficulties in forecasting these receipts.
• As well as being highly unpredictable, corporation tax receipts are the most volatile of Ireland’s main
tax heads, with this volatility having become more pronounced in recent years. This is evident even
when controlling for differences in growth rates typically observed.
• Part of the reason for the volatility and unpredictability of corporation tax receipts is the degree to
which receipts are concentrated among a small number of firms. This mirrors Ireland’s export sector,
which is concentrated and dissimilar to international norms. As a result, there is greater exposure to
idiosyncratic shocks such as the ‘patent cliff’ and company restructurings and inversions.
• The standard approach used by the Department of Finance to forecast corporation tax has produced
large forecast errors in recent years. This note tests a number of alternatives. While the sample
period of the available data is short, nominal GDP appears to be a slightly better predictor of receipts
than gross operating surplus. However, even the better performing models fail to explain a large
portion of the within-sample variation in the annual growth of receipts. The fact that this variation
appears to be unexplained to a large extent by the economic fundamentals that we have tested
suggests the importance of idiosyncratic developments.
• In light of the unpredictable and volatile nature of corporation tax receipts, it is advisable that this
revenue source is treated with greater care when compared to other tax sources. In particular, it
would be unwise to use sharp, unpredictable increases in corporation tax receipts as a basis to fund
increases in permanent expenditure. A number of options exist, including using windfall receipts to
reduce public debt to safer levels or as a basis for funding a rainy day fund – something that is
currently being considered.

1 . I N T R O D U C T I O N
This note examines the forecasting approach used for corporation tax revenues by the Department of
Finance, which are formed with input and assistance from the Revenue Commissioners. It also assesses
the wider implications of the difficulties involved in forecasting these receipts. As Figure 1 shows,
corporation tax receipts have become a much more important source of government revenues in the past
two decades representing on average one in every eight euro of taxes collected each year.
Forecasting corporation tax revenues in Ireland has traditionally been difficult. In addition to the usual
uncertainties related to macroeconomic growth, the highly concentrated nature of Ireland’s business
sector means that various company- and sector-specific developments can have large impacts on annual
outturns. This has significant implications for the accuracy of budgetary forecasts, but also for the
appropriateness of the fiscal stance given that the stability and sustainability of revenue sources are
central aspects of prudent budgetary planning.
0 2 4 6 8
10 12 14 16 18
% o
f Tot
al T
ax R
ecei
pts
FIGURE 1: CORPORATION TAX RECEIPTS (% OF TOTAL TAX RECEIPTS)
Sources: Department of Finance; internal IFAC calculations.
-40 -30 -20 -10
0 10 20 30 40 50 60
1981 1983 1985 1987 1989 1991 1993 1995 1997 1999 2001 2003 2005 2007 2009 2011 2013 2015
% o
f for
ecas
t
F IGURE 2: CORPORATION TAX FORECAST ERRORS (1981-2015)
Source: Department of Finance (forecasts from various Budget documents). Notes: Errors relate to Budget-day forecasts for the following year.
Challenges Forecasting Irish Corporation Tax
5
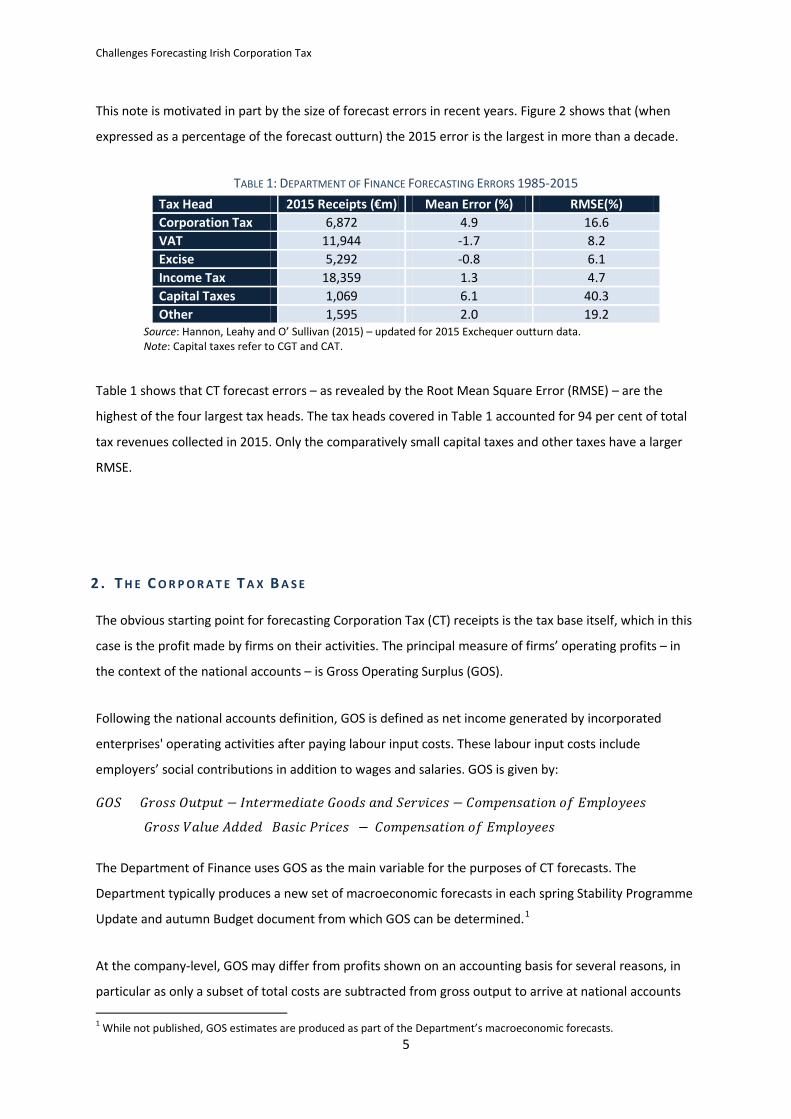
This note is motivated in part by the size of forecast errors in recent years. Figure 2 shows that (when
expressed as a percentage of the forecast outturn) the 2015 error is the largest in more than a decade.
TABLE 1: DEPARTMENT OF FINANCE FORECASTING ERRORS 1985-2015 Tax Head 2015 Receipts (€m) Mean Error (%) RMSE(%) Corporation Tax 6,872 4.9 16.6 VAT 11,944 -1.7 8.2 Excise 5,292 -0.8 6.1 Income Tax 18,359 1.3 4.7 Capital Taxes 1,069 6.1 40.3 Other 1,595 2.0 19.2
Source: Hannon, Leahy and O’ Sullivan (2015) – updated for 2015 Exchequer outturn data. Note: Capital taxes refer to CGT and CAT.
Table 1 shows that CT forecast errors – as revealed by the Root Mean Square Error (RMSE) – are the
highest of the four largest tax heads. The tax heads covered in Table 1 accounted for 94 per cent of total
tax revenues collected in 2015. Only the comparatively small capital taxes and other taxes have a larger
RMSE.
2 . T H E C O R P O R A T E T A X B A S E
The obvious starting point for forecasting Corporation Tax (CT) receipts is the tax base itself, which in this
case is the profit made by firms on their activities. The principal measure of firms’ operating profits – in
the context of the national accounts – is Gross Operating Surplus (GOS).
Following the national accounts definition, GOS is defined as net income generated by incorporated
enterprises' operating activities after paying labour input costs. These labour input costs include
employers’ social contributions in addition to wages and salaries. GOS is given by:
𝐺𝑂𝑆 = 𝐺𝑟𝑜𝑠𝑠 𝑂𝑢𝑡𝑝𝑢𝑡 − 𝐼𝑛𝑡𝑒𝑟𝑚𝑒𝑑𝑖𝑎𝑡𝑒 𝐺𝑜𝑜𝑑𝑠 𝑎𝑛𝑑 𝑆𝑒𝑟𝑣𝑖𝑐𝑒𝑠 − 𝐶𝑜𝑚𝑝𝑒𝑛𝑠𝑎𝑡𝑖𝑜𝑛 𝑜𝑓 𝐸𝑚𝑝𝑙𝑜𝑦𝑒𝑒𝑠
= 𝐺𝑟𝑜𝑠𝑠 𝑉𝑎𝑙𝑢𝑒 𝐴𝑑𝑑𝑒𝑑 (𝐵𝑎𝑠𝑖𝑐 𝑃𝑟𝑖𝑐𝑒𝑠)− 𝐶𝑜𝑚𝑝𝑒𝑛𝑠𝑎𝑡𝑖𝑜𝑛 𝑜𝑓 𝐸𝑚𝑝𝑙𝑜𝑦𝑒𝑒𝑠
The Department of Finance uses GOS as the main variable for the purposes of CT forecasts. The
Department typically produces a new set of macroeconomic forecasts in each spring Stability Programme
Update and autumn Budget document from which GOS can be determined.1
At the company-level, GOS may differ from profits shown on an accounting basis for several reasons, in
particular as only a subset of total costs are subtracted from gross output to arrive at national accounts 1 While not published, GOS estimates are produced as part of the Department’s macroeconomic forecasts.

estimates of GOS. It is also important to note that the national accounts measure of profits will refer only
to profits corresponding to activities carried out within an economic territory.2
The cost of intermediate goods and services and compensation of employees are deducted from gross
output to arrive at GOS, but pre-tax profits in company accounts make a number of additional
adjustments. The following is a reconciliation of the company accounts measure of pre-tax profits with its
national accounts equivalent (Lequiller and Blades, 2014):
Company Accounts Pre-Tax Profits = Gross Operating Surplus - Conceptual/Practical Differences 3 - Property Income Paid (national accounts) 4 + Property Income Received + Exceptional Profits and Losses 5 + Inventory Appreciation (national accounts measure) - Depreciation (company accounts measure)
It is likely that the adjustments to the national accounts (GOS) measure of profits outlined above will not
remain stable over time. For example, capital gains/losses related to sales or purchases of assets may lead
to sharp divergences between the two measures. Consequently, one would expect that the relationship
between GOS and taxable income will also be subject to change from year-to-year.
Even if it were a perfect proxy for taxable profits, forecasting GOS – as with any macroeconomic
aggregate – is subject to a high degree of uncertainty. In particular, this reflects the uncertainty of
international trading conditions and currency markets, among other factors. International trading
conditions are assumed by the Department to evolve in line with official forecasts from agencies such as
the European Commission (EC), OECD and IMF, while currency markets are assumed to remain constant
(i.e., fixed at their recent ten-day average as of the time of forecasting).
It is widely understood that forecasts of external developments can be subject to sharp unexpected
changes. Currency markets are notoriously volatile and difficult to predict, while expectations for demand
conditions in major trading partners can also be prone to frequent and marked changes.6 Figure 3 shows
2 The basis for Irish CT is, broadly speaking, the profits of companies resident in Ireland and of certain non-residents that trade in the State via branches. Revenue has full sight of relevant profits through tax returns, though profits reported publicly by large multinationals with global supply chains may often differ from these. This is due to the fact that these may often include profits made by their overseas subsidiaries, and breakdowns of geographical activities may not be provided. 3 Note that conceptual/practical differences can relate to differences in the treatment of intellectual property, fraud, leasing arrangements, etc. The national accounts, for example, treat spending on intellectual property primarily as investment rather than intermediate consumption so that this form of expenditure has little impact on GOS other than through depreciation. 4 Property income paid in this case does not include distributed income and reinvested earnings on foreign direct investment as measured in the national accounts. 5 In particular, these exceptional profits/losses cover capital gains/losses, such as on the sale of subsidiaries or related to gains/losses on currency transactions. 6 For a discussion, see Wang (2008). One influential study examining the so-called “disconnect puzzle” is Meese and Rogoff (1983), which finds that “random walk” models are just as good at predicting exchange rates as models based on economic

Challenges Forecasting Irish Corporation Tax
7
various vintages of EC forecasts of real GDP for the Euro Area – Ireland’s largest trading partner – in
recent years. Cumulatively, Euro Area growth was expected to be two percentage points higher in 2013
relative to 2010 than subsequently turned out to be the case. Empirical research using Irish data has
shown that such disappointments can have significant impacts on Irish exports, real GDP and government
revenues (see, for example, Bermingham and Conefrey (2011); and Nkusu (2013)).
The implication is that, as difficult as it can be to firmly link CT receipts to GOS, forecasting CT is even
more difficult because of the many challenges posed by forecasting GOS itself.
FIGURE 3: EURO AREA REAL GDP (EUROPEAN COMMISSION FORECAST VINTAGES)
3 . C O N C E N T R A T I O N O F T H E C O R P O R A T E T A X B A S E
One feature of the corporate tax base in Ireland that plays a significant role in annual developments is its
concentration. In particular, the highly concentrated business sector in Ireland can mean that various
company- and sector-specific developments have large impacts on profitability, with consequent impacts
on corporation tax receipts. This feature is evident from various measures of sectoral concentration and
can be seen to have also become more pronounced in recent years.
fundamentals like trade balances, money supply, national income and other variables. Evidence since then suggests that alternative modelling techniques have failed to outperform random-walk forecasts in the short-term.
99
100
101
102
103
104
105
106
2010 2011 2012 2013 2014 2015 2016
Inde
x (B
ase:
201
0 =
100)
Spring 2016
Autumn 2015
Spring 2015
Autumn 2014
Spring 2014
Autumn 2013
Spring 2013
Autumn 2012 Spring 2012
Source: European Commission Forecasts, Different Vintages.

FIGURE 4: CONCENTRATION AND DIVERSIFICATION OF MERCHANDISE EXPORTS, DEVELOPED ECONOMIES (2014)
Sources: UNCTADSTAT; internal IFAC calculations. Note: The diversification index is a measure of similarity in trade, which signals whether the structure of exports by product of a given country differs from the structure of world production. Higher scores indicate greater dissimilarity. The concentration index is a normalised Herfindahl-Hirschmann index. Ireland is shown for both 1995 and 2014; all 37 other developed economies shown for 2014.
Figure 4 shows summary measures of the concentration and specialisation of Irish merchandise exports
relative to other developed economies developed by the World Bank.7 The first measure shown, the
product concentration index, measures the extent to which exports can be said to be concentrated in
relatively few products. It takes the form of a normalised Herfindahl- Hirschmann index. The second
measure, the diversification index, indicates whether the structure of exports by product differs from
global norms. If a greater share of total manufactured goods in a given country is made up of a specific
product – say pharmaceuticals for example – compared to the share of that product in world exports,
then a higher score is obtained on the diversification index. It can also be understood as a measure of
dissimilarity in manufacturing, with higher scores indicating higher dissimilarity. Calculating the
diversification index involves summing the demeaned shares of all manufactured products in a given
country with respect to the world mean.
Two key points can be discerned from the concentration and diversification indicators: (1) Irish
merchandise exports are quite concentrated, with a product mix that is highly dissimilar to the typical
7 More information and data are available at: unctadstat.unctad.org/
0.0 0.1 0.2 0.3 0.4 0.5
Italy
Au
stria
Po
land
Cr
oatia
Po
rtug
al
Denm
ark
Swed
en
Spai
n Fr
ance
U
nite
d St
ates
La
tvia
N
ethe
rland
s Ge
rman
y Ro
man
ia
Belg
ium
Bu
lgar
ia
Luxe
mbo
urg
Uni
ted
King
dom
Hu
ngar
y Cz
ech
Repu
blic
Es
toni
a Fi
nlan
d Li
thua
nia
Slov
enia
Ire
land
(199
5)
Slov
akia
Ca
nada
An
dorr
a N
ew Z
eala
nd
Cypr
us
Irela
nd (2
014)
Sw
itzer
land
Au
stra
lia
Isra
el
Berm
uda
Gree
ce
Nor
way
M
alta
Ic
elan
d
CONCENTRATION INDEX
0.0 0.2 0.4 0.6 0.8 1.0
Uni
ted
Stat
es
Uni
ted
King
dom
N
ethe
rland
s Au
stria
Ge
rman
y Fr
ance
Sp
ain
Swed
en
Italy
Ca
nada
Be
lgiu
m
Pola
nd
Rom
ania
Hu
ngar
y Po
rtug
al
Esto
nia
Czec
h Re
publ
ic
Denm
ark
Latv
ia
Bulg
aria
Li
thua
nia
Slov
akia
Cr
oatia
Sl
oven
ia
Finl
and
Ando
rra
Luxe
mbo
urg
Irela
nd (1
995)
Gr
eece
Is
rael
Cy
prus
N
orw
ay
Switz
erla
nd
Mal
ta
Irela
nd (2
014)
Au
stra
lia
New
Zea
land
Be
rmud
a Ic
elan
d
DIVERSIFICATION INDEX

Challenges Forecasting Irish Corporation Tax
9
global product mix; (2) the concentration and dissimilarity of Irish merchandise exports has become more
pronounced in the past two decades.
While dissimilarity can be an advantage, in the sense that a manufacturing sector’s product mix may not
be tied to wider cyclical developments in global demand, it also means greater exposure to idiosyncratic,
sector-specific shocks.8 An example of this type of idiosyncratic risk has been visible in Ireland recently in
what is known as the ‘patent cliff’ whereby a number of high value drugs became off-patent in quick
succession beginning in 2011. Enright and Dalton (2014) assess the phenomenon though it is not clear
what the ex-post impact was for CT receipts. The authors also note that the Irish corporation tax take has
“always been both concentrated and more prone to changes in composition over the years, compared to
more stable forms of revenue such as labour taxation or VAT”.
Exposure to idiosyncratic shocks of the form of the ‘patent cliff’ can mean that there is a greater onus on
Irish authorities to maintain an awareness of highly sector-specific risks and developments. It also
highlights the degree of unpredictability and uncertainty that may exist in relation to corporation tax
receipts linked to activities such as these.
FIGURE 5: EXPORTS OF CHEMICALS AND RELATED PRODUCTS
The high concentration in overall Irish merchandise exports can be largely accounted for by the pharma-
chem sector, where exports in 2015 accounted for 57 per cent of all goods exports and one-quarter of
total exports (both goods and services). The rising value of services exports in the last decade has meant
that the broad pharma-chem sector’s share of total exports has not risen as much in proportion to total
exports as it has within goods alone (Figure 5).
8 An example of this is apparent in 2008-09, when Irish exports performed relatively better than expected compared to other economies during the global trade downturn. This partly reflected the relatively acyclical composition of Ireland’s tradable sector, with pharmaceutical production and information and communications technology featuring heavily.
24.6
57.2
0
10
20
30
40
50
60
70
1973
19
75
1977
19
79
1981
19
83
1985
19
87
1989
19
91
1993
19
95
1997
19
99
2001
20
03
2005
20
07
2009
20
11
2013
20
15
%
% of Total Exports % of Goods Exports
Sources: CSO; internal IFAC calculations.

High concentration and specialisation is not unique to Ireland’s merchandise trade sectors, with services
exports also exhibiting evidence of this. Disaggregated data on Irish services exports is more limited than
that available for goods exports, but data available for the period 2003-2014 suggest that three sectors
account for over 70 per cent of services exports (Table 2). In particular, computer services exports
represent 47 per cent of all services exports as of 2014.
TABLE 2: CONCENTRATION OF SERVICES EXPORTS (SELECTED PERIOD AVERAGES DURING 2003-2014)
2003-07 2008-09 2010-13 2014 € billions Computer Services 16.7 24.1 34.8 47.9 Financial Services & Insurance 13.2 13.9 15.7 17.6 Operational Leasing 3.8 5.7 7.2 7.8 Other 16.8 24.0 25.8 28.4 Total Services 50.6 67.8 83.5 101.8 Total Exports 136.9 158.3 181.6 215.0 % Services Exports Computer Services 33.0 35.6 41.7 47.1 Financial Services & Insurance 26.1 20.5 18.8 17.3 Operational Leasing 7.6 8.5 8.6 7.7 Other 33.3 35.4 30.9 27.9 % Total Exports Computer Services 12.2 15.2 19.2 22.3 Financial Services & Insurance 9.7 8.8 8.6 8.2 Operational Leasing 2.8 3.6 4.0 3.6 Other 12.3 15.2 14.2 13.2
Sources: CSO, International Trade in Services - various releases.
Taking the data on services and goods exports together, the pharma-chem and computer services sectors
account for almost a half of total Irish exports in recent years. These sectors are largely dominated by
multinational enterprises (MNEs). CSO estimates for 2014 indicate that sectors dominated by foreign-
owned multinationals account for close to one-quarter of total Gross Value Added (GVA) in the Irish
economy (Table 3).
The concentration of the corporate tax base can be further illustrated by observing the concentration of
CT receipts themselves. Figure 6 shows the share of total net (i.e., after repayments or similar
amendments) CT derived from the top 10 payers of CT over the period 2008-2014, while Figure 7 shows
the share of total taxes accounted for by CT obtained from the top 10 payers of CT. Both graphs illustrate
that the rising share of profits being made by a handful of sectors is being reflected in an increasing
reliance of CT receipts from a very small number of large corporations. Revenue also notes that around 80
per cent of Corporation Tax comes from the multinational sector, with the majority from ICT and
pharmaceutical sectors. Approximately 60 per cent of receipts are reported to come from US companies.

Challenges Forecasting Irish Corporation Tax
11
TABLE 3: SHARE OF MULTINATIONAL-DOMINATED SECTORS IN TOTAL GVA (2014)
Description NACE codes % 2014 GVA (constant
basic prices) Chemicals and chemical products, basic pharmaceutical products and pharmaceutical preparations 20-21 8.7
Software and communications sectors 58-63 11.6 Other NACE sectors dominated by Foreign-owned MNEs 18.2, 26, 27 and 32.5 4.6 Foreign-owned MNE dominated Total 24.9 All other sectors 75.1
Source: CSO, Gross Value Added for Foreign-owned Multinational Enterprises and Other Sectors Annual Results 2014. Notes: Foreign owned Multinational Enterprise (MNE) dominated sectors are defined where MNE turnover on average exceeds 85% of the sector total. The “other NACE sectors dominated by foreign-owned MNEs” category includes reproduction of recorded media, computer, electronic and optical products, electrical equipment, and medical and dental instruments and supplies.
Sources: Tancred (2016); Pigott and Walsh (2014); authors’ analysis of Revenue data; Minister, Department of Finance parliamentary question response (17 July 2014); and own workings. Note: Corporation tax is shown on an Exchequer basis.
Corporation taxes can also be seen to have become more volatile over time. Figure 8 shows the standard
deviation and coefficient of variation for each of the main four Irish tax heads’ annual growth rates. The
coefficient of variation is a useful measure of volatility, computed as the ratio of the sample standard
deviation to the mean.9 In the last 15 years (excluding the financial crisis period), corporation tax receipts
have been the most volatile of the main tax heads covered. This heightened volatility may itself partly
reflect the more concentrated nature of corporation tax payments.
One means of responding to the volatility and concentration of corporation tax receipts for the purposes
of forecasting accuracy is to develop direct engagements with some of the principal payers of corporation
tax. This approach can help with anticipating likely developments in trading conditions and expected
payments over the course of the year. The Revenue Commissioners do this through engagements with a
number of companies via their Large Cases Division (including through an annual survey of the largest
9 The coefficient of variation is the ratio of the sample standard deviation to the sample mean expressed as a percentage. By scaling the spread against average outturns, it measures the dispersion of a variable while controlling for large differences in typically observed growth rates.
0% 5%
10% 15% 20% 25% 30% 35% 40% 45%
% o
f CT
Rece
ipts
F IGURE 6: CORPORATION TAX PAID BY TOP TEN COMPANIES
0%
1%
2%
3%
4%
5%
6%
7%
% o
f Tot
al T
ax R
ecei
pts
F IGURE 7: CT FROM TOP 10 COMPANIES % OF TOTAL TAX REVENUE

companies by Revenue case managers).10 Any information provided to Revenue from companies is
summarised and provided to the Department of Finance for inclusion in their forecasts. While helpful in
dealing with the large uncertainties involved, the approach may still be unable to yield substantial
improvements in forecast accuracy. In addition to the uncertainties in forecasting their own profits, key
developments related to activities in Ireland may be made at the level of parent companies rather than by
affiliates based in Ireland. Companies are also under no obligation to share information with Revenue
regarding specific factors that may influence future CT payments and only do so on a voluntary basis.
FIGURE 8: VOLATILITY OF ANNUAL TAX RECEIPTS GROWTH RATES (%)
Source: Department of Finance tax revenue data. Internal IFAC calculations. Notes: Standard deviation of growth rates = SD; Coefficient of Variation = CoV.
It is worth noting that, for sustainability purposes, volatility from year-to-year may not be as significant an
issue if receipts follow a more predictable trend over the medium-term. However, the magnitude of
uncertainty around CT revenues over the medium-term is of an order much greater than that for nominal
GDP, which is already very high. As Table 4 shows, the typical error for nominal GDP forecasts three years-
ahead (based on Budget-day forecasts) is roughly 4 percentage points. However, for CT receipts the
forecast error is 32 percentage points. Big shocks in CT receipts in the past have clearly been linked to
drivers other than fundamentals. Looking beyond the uncertainty regarding fundamental drivers like GDP,
there are additional uncertainties for corporation tax receipts specifically arising from possible regime
changes at an international level both in terms of tax policies and in relation to corporate structures.
TABLE 4: TYPICAL ERRORS FOR MEDIUM-TERM CT AND NOMINAL GDP GROWTH FORECASTS (1999-07; 2010-14) RMSE Year “t+1” Year “t+2” Year “t+3” Nominal GDP 3.1 4.5 4.1 Corporation Tax 9.3 14.4 31.7
Sources: Department of Finance forecasts from various Budgets; internal IFAC calculations. Notes: RMSE values are reported based on forecasts for nominal GDP and corporation tax receipts for the year ahead.
10 The Large Cases Division is responsible for the management and development of service, compliance and audit functions relating to the largest businesses and wealthiest individuals in the State.
0 20 40 60 80 100 120 140 160
0 2 4 6 8
10 12 14 16 18 20
CoV
(%)
SD (%
)
1985-1999
SD CoV (RHS)
0 20 40 60 80 100 120 140 160
0 2 4 6 8
10 12 14 16 18 20
CoV
(%)
SD (%
)
2000-2015 (exc l . 2008-09)
SD CoV (RHS)

Challenges Forecasting Irish Corporation Tax
13
4 . C O M P A N Y - L E V E L I S S U E S F O R P R E D I C T I N G R E C E I P T S
The predictability of company profits may vary over time due to a number of developments at sectoral
and company-level. This is particularly true for multinational enterprises where large and sudden changes
may arise due to changes in global supply chain structures, international taxation policies, tax planning at
the company-level or accumulated tax assets/liabilities for example.
Multinational Activities: The attractiveness of a given location for investment by MNEs can change over
time due to a number of factors. Company- and firm-level decisions that respond to these changes may
result in shifts in the location of taxable activities, with corresponding increases or decreases in taxable
profits.
These decisions can be hard to predict, but can often relate to cost competitiveness such as for tax, price,
wages and other costs. The regulatory environment can also play a role, including considerations such as
legislation governing cross-border trade, requirements for construction or registering properties, access
to efficient utilities, and legal protections governing investors, contracts, insolvencies, etc. Demographic
considerations may also be key, such as the age-demographic of a population and the availability of skilled
labour. As well as being subject to change at local level, relative attractiveness can change in response to
developments in other jurisdictions.
Deferred tax assets/liabilities: The presence of large deferred tax assets/liabilities on companies’ balance
sheets can also weaken the relationship between the measured gross operating surplus and taxes that are
ultimately owed by firms. For instance, deferred tax assets arise when a firm carries forward or has paid
taxes related to current and previous periods not yet recognised in their income statements. These may
subsequently be used to help reduce a firm’s future taxable income. Developments may be company-
specific, but can also be visible across sectors such as in the case of large deferred tax assets that arose in
the banking sector following the financial crisis.
Other tax deductions/credits: A company may be able to set various other deductions against their
corporate tax liability for a given year. For instance, a 25 per cent tax credit for qualifying research and
development expenditure exists for companies engaged in certain research and development activities.
Companies may also be entitled to capital allowances in respect of specified capital expenditure such as
wear and tear allowances for plant and machinery, and the purchase of intangible assets for the purposes
of a trade (e.g. patents, copyright, and trademarks). Furthermore, companies are normally entitled to
deduct interest payments and patent royalty costs when computing liabilities. Depending on the extent to
which any of these deductions are set against companies’ CT liabilities, the standard forecasting
relationship with GOS may be altered.

5 . A L T E R N A T I V E F O R E C A S T I N G A P P R O A C H E S
The current approach to forecasting corporation tax receipts in Ireland relies on expectations of economy-
wide profits, with judgement applied to account for knowledge of any one-offs or other temporary issues.
The standard assumption is that a one per cent change in GOS would imply a one per cent change in CT at
the margin. However, this may not be the case due to various issues such as deferred tax assets, R&D
credits, etc., as discussed in Section 4. Using historical data to define the expected relationship is one way
to predict receipts for a given forecast of GOS. Aside from difficulties involved in producing the latter,
further problems are posed by relatively limited historical data on CT and GOS for Ireland as well as by the
numerous structural changes to the nature of the tax.
The standard approach used by the Department of Finance and the Revenue Commissioners implies an
equation of the following form, which can be estimated:
∆𝑙𝑛𝐶𝑇𝑡 = 𝛼 + 𝛽∆𝑙𝑛𝐺𝑂𝑆𝑡 + 𝜀𝑡
where 𝐶𝑇𝑡 is Corporation Tax; 𝐺𝑂𝑆𝑡 is Gross Operating Surplus and 𝜀𝑡 is the error for year “t”. In the
estimation process, all variables are taken as first-differences of the natural logarithm. These
transformations are chosen as the level series are mainly non-stationary variables
One way to account for structural changes in corporation tax is to use a measure of corporation tax
receipts that is adjusted for various policy changes introduced over time. We use the ‘proportional
adjustment method’ to create a corporation tax series that is net of discretionary policy-induced tax
changes (see Mourre and Princen, 2015). These changes include rate adjustments and the introduction of
various tax credits (Figure 9).
0
1
2
3
4
5
6
7
8
1989 1991 1993 1995 1997 1999 2001 2003 2005 2007 2009 2011 2013 2015
€ bi
llion
s
F IGURE 9: CORPORATION TAX RECEIPTS, 1989-2015
Corporation Tax
Corporation Tax (policy-adjusted)
Sources: Department of Finance; internal IFAC calculations.
Challenges Forecasting Irish Corporation Tax
15
A variety of alternatives to the standard model employed by both the Department of Finance and
Revenue are explored in Table 5. In addition to GOS, the inclusion of a lagged term (CT(-1)), a proxy for
major trading partner demand (MTP), the Real Effective Exchange Rate (REER), nominal exchange rates
with the U.K. (GBP/EUR) and the U.S. (USD/EUR), a measure of the business cycle (Output Gap as
estimated by the IMF) and equity indices relevant for major sectors are also considered.11 These are
intended to capture, respectively, momentum effects, current trading conditions, relative currency and
price fluctuations, cyclical developments and various sector-specific developments.12 Lastly, we include
standard measures of aggregate economic activity: nominal GDP and nominal GNP.
All models are estimated using annual data over 1998-2015. While limiting the number of available
observations, the choice of annual frequency enables us to use the policy-adjusted CT series produced
under the proportional adjustment method. It is also preferable given the seasonality of CT data and the
fact that timing of payments intra-year may often reflect corporate decisions rather than short-run
developments in activity levels. As a robustness check, Appendix 1 examines a longer sample period for
selected models.
In addition to GOS, the results suggest that trading conditions – as captured by weighting trading partner
demand – are also a key driver of changes in corporate tax receipts. This appears to offer explanatory
power not especially lower than the GOS variable itself. The coefficient suggests that receipts are highly
sensitive to external demand conditions, with a one percentage point increase in external demand leading
to an approximate 2½ to 3 percentage point increase in corporation tax receipts received. When GOS is
also included, MTP is no longer significant, likely reflecting the fact that GOS incorporates these effects.
In relation to last year’s receipts, Revenue (2015) noted that a smaller relevant factor (in addition to
trading conditions) was the impact of currency fluctuations. While this may be the case for certain
companies, there does not appear to be a clear link between currency developments and corporation tax
receipts in any specific direction. The coefficients on REER, dollar and sterling movements do not appear
significant. This finding may reflect the short sample period involved, or it may be a reflection of hedging
activities engaged in by companies’ treasury divisions, which serve to mitigate short-run exchange rate
developments.
11 MTP is based on internal IFAC calculations and is constructed as the weighted import volume growth of Ireland’s major trading partners based on various national statistics offices’ outturn data for import volumes, and CSO data for Irish exports by destination. 12 Note that high frequency data on industrial production and services exports have also been used to good effect elsewhere as indicators that may capture sector-specific information (e.g., Purdue, 2016; and Central Bank of Ireland, 2016 - Box D “Corporation Tax Receipts in 2015”). We tested a number of variants of these series also, but, as with the equity indicators, we fail to find significance when included alongside MTP or aggregates such as GOS, GDP or GNP. This finding is likely to be due to the fact that the latter variables will often incorporate sectoral developments also.
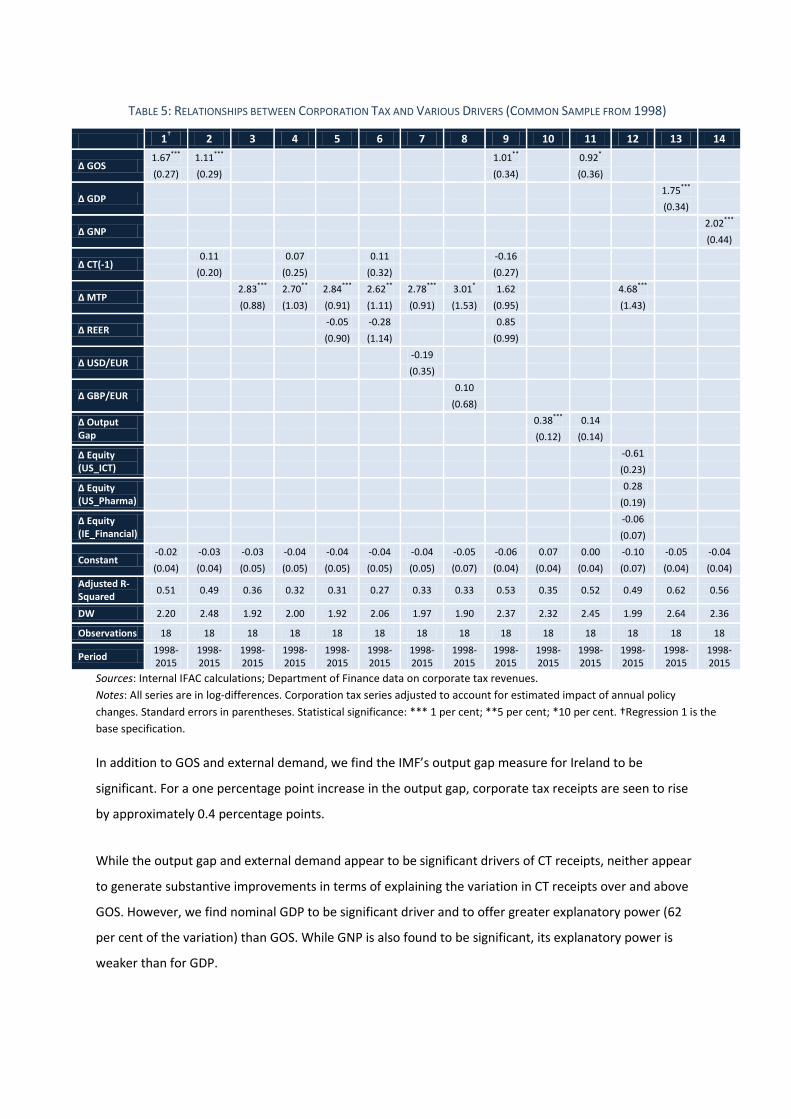
TABLE 5: RELATIONSHIPS BETWEEN CORPORATION TAX AND VARIOUS DRIVERS (COMMON SAMPLE FROM 1998)
1† 2 3 4 5 6 7 8 9 10 11 12 13 14
∆ GOS 1.67*** 1.11***
1.01**
0.92*
(0.27) (0.29) (0.34) (0.36)
∆ GDP 1.75***
(0.34)
∆ GNP 2.02***
(0.44)
∆ CT(-1) 0.11
0.07
0.11
-0.16
(0.20) (0.25) (0.32) (0.27)
∆ MTP 2.83*** 2.70** 2.84*** 2.62** 2.78*** 3.01* 1.62
4.68***
(0.88) (1.03) (0.91) (1.11) (0.91) (1.53) (0.95) (1.43)
∆ REER -0.05 -0.28
0.85
(0.90) (1.14) (0.99)
∆ USD/EUR -0.19
(0.35)
∆ GBP/EUR 0.10
(0.68)
∆ Output Gap
0.38*** 0.14
(0.12) (0.14) ∆ Equity (US_ICT)
-0.61 (0.23)
∆ Equity (US_Pharma)
0.28 (0.19)
∆ Equity (IE_Financial)
-0.06 (0.07)
Constant -0.02 -0.03 -0.03 -0.04 -0.04 -0.04 -0.04 -0.05 -0.06 0.07 0.00 -0.10 -0.05 -0.04 (0.04) (0.04) (0.05) (0.05) (0.05) (0.05) (0.05) (0.07) (0.04) (0.04) (0.04) (0.07) (0.04) (0.04)
Adjusted R-Squared 0.51 0.49 0.36 0.32 0.31 0.27 0.33 0.33 0.53 0.35 0.52 0.49 0.62 0.56
DW 2.20 2.48 1.92 2.00 1.92 2.06 1.97 1.90 2.37 2.32 2.45 1.99 2.64 2.36
Observations 18 18 18 18 18 18 18 18 18 18 18 18 18 18
Period 1998-2015
1998-2015
1998-2015
1998-2015
1998-2015
1998-2015
1998-2015
1998-2015
1998-2015
1998-2015
1998-2015
1998-2015
1998-2015
1998-2015
Sources: Internal IFAC calculations; Department of Finance data on corporate tax revenues. Notes: All series are in log-differences. Corporation tax series adjusted to account for estimated impact of annual policy changes. Standard errors in parentheses. Statistical significance: *** 1 per cent; **5 per cent; *10 per cent. †Regression 1 is the base specification.
In addition to GOS and external demand, we find the IMF’s output gap measure for Ireland to be
significant. For a one percentage point increase in the output gap, corporate tax receipts are seen to rise
by approximately 0.4 percentage points.
While the output gap and external demand appear to be significant drivers of CT receipts, neither appear
to generate substantive improvements in terms of explaining the variation in CT receipts over and above
GOS. However, we find nominal GDP to be significant driver and to offer greater explanatory power (62
per cent of the variation) than GOS. While GNP is also found to be significant, its explanatory power is
weaker than for GDP.
Challenges Forecasting Irish Corporation Tax
17
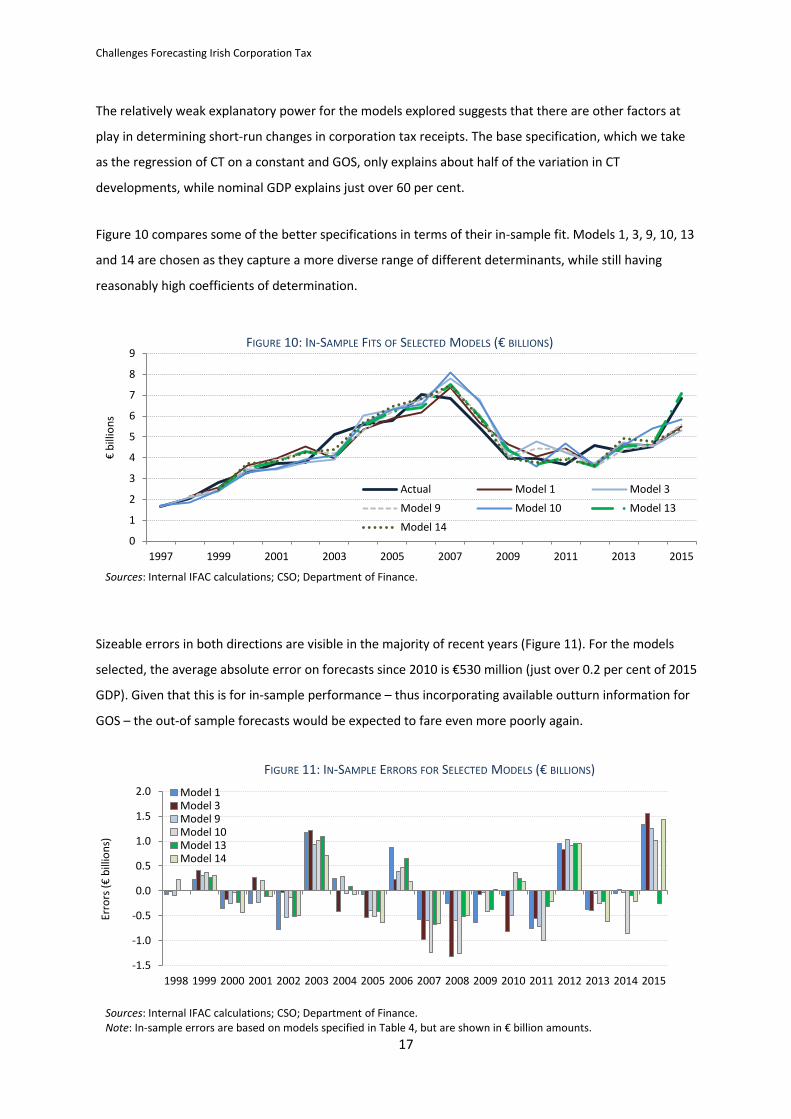
The relatively weak explanatory power for the models explored suggests that there are other factors at
play in determining short-run changes in corporation tax receipts. The base specification, which we take
as the regression of CT on a constant and GOS, only explains about half of the variation in CT
developments, while nominal GDP explains just over 60 per cent.
Figure 10 compares some of the better specifications in terms of their in-sample fit. Models 1, 3, 9, 10, 13
and 14 are chosen as they capture a more diverse range of different determinants, while still having
reasonably high coefficients of determination.
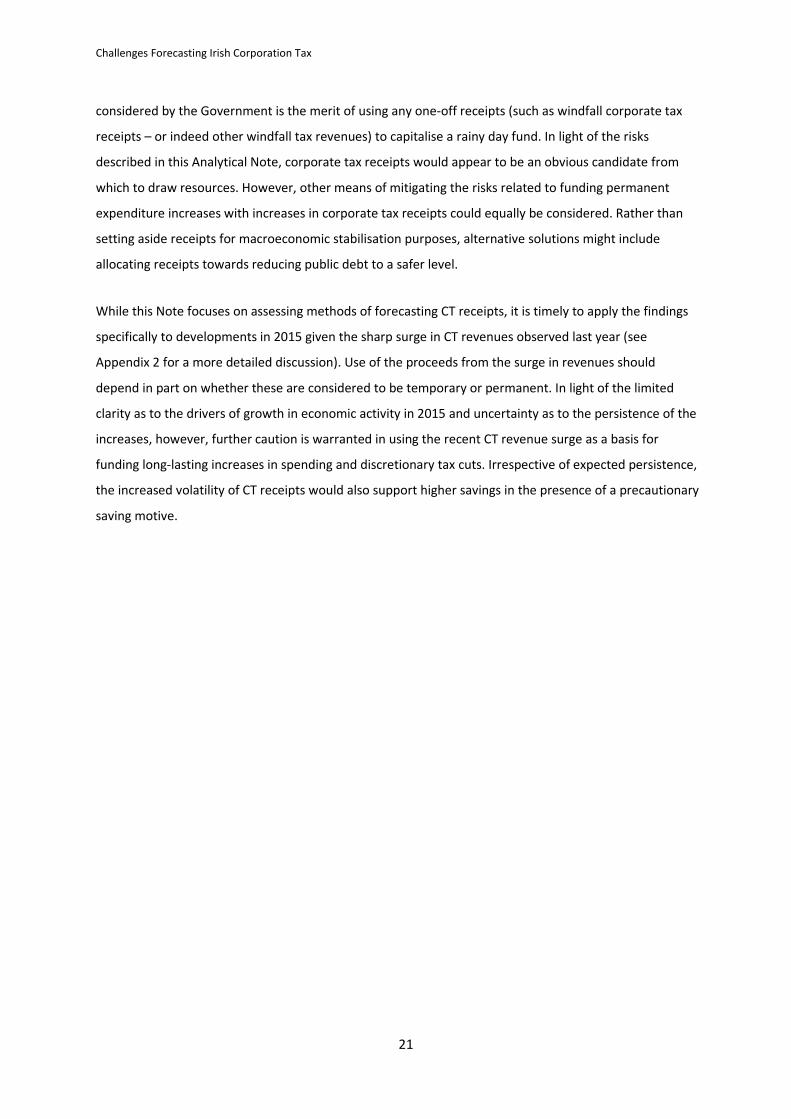
Sizeable errors in both directions are visible in the majority of recent years (Figure 11). For the models
selected, the average absolute error on forecasts since 2010 is €530 million (just over 0.2 per cent of 2015
GDP). Given that this is for in-sample performance – thus incorporating available outturn information for
GOS – the out-of sample forecasts would be expected to fare even more poorly again.
0
1
2
3
4
5
6
7
8
9
1997 1999 2001 2003 2005 2007 2009 2011 2013 2015
€ bi
llion
s
FIGURE 10: IN-SAMPLE FITS OF SELECTED MODELS (€ BILLIONS)
Actual Model 1 Model 3
Model 9 Model 10 Model 13
Model 14
Sources: Internal IFAC calculations; CSO; Department of Finance.
-1.5
-1.0
-0.5
0.0
0.5
1.0
1.5
2.0
1998 1999 2000 2001 2002 2003 2004 2005 2006 2007 2008 2009 2010 2011 2012 2013 2014 2015
Erro
rs (€
bill
ions
)
FIGURE 11: IN-SAMPLE ERRORS FOR SELECTED MODELS (€ BILLIONS)
Model 1 Model 3 Model 9 Model 10 Model 13 Model 14
Sources: Internal IFAC calculations; CSO; Department of Finance. Note: In-sample errors are based on models specified in Table 4, but are shown in € billion amounts.

It is also notable that the better-performing models offer relatively modest improvements over crude
benchmark alternatives (Table 6). A naïve forecast - one where the level of CT is assumed unchanged from
the previous year – has a RMSE of 21.7 per cent compared to the selected models’ average of 12.3 per
cent. A model (AR1) where a single autoregressive term and a constant are used to forecast the log-
difference of CT revenues also performs only moderately worse than the selected models, with a full-
sample RMSE of 17.8 per cent. Most of the models (all except Model 13, which uses July’s revised
National Accounts estimates of nominal GDP) fail to capture at least €1 billion of the surge in revenues
observed in 2015. Similarly, in 2011, all of the models (other than models 13 and 14, which use GDP and
GNP) had overestimated revenues by upwards of €0.55 billion.
TABLE 6: ERRORS FOR OFFICIAL FORECASTS AND SELECTED MODEL FITS (1998-2015)
Measure Official Model 1
Model 3
Model 9
Model 10
Model 13
Model 14
Model Average Naïve AR1
ME (€m) -41 32 -41 10 -64 -23 -10 -17 287 51
MAE (€m) 574 525 575 479 596 415 459 466 705 720
ME (%) 1.0 1.2 1.1 1.0 0.4 0.6 0.7 0.5 9.1 1.0
MAE (%) 11.7 11.5 12.0 10.4 12.1 9.2 9.9 10.0 16.5 14.5
RMSE (%) 17.6 14.3 15.1 13.0 14.3 11.6 12.3 12.3 21.7 17.8
Sources: Internal IFAC calculations; Department of Finance data on corporate tax revenues. Notes: Corporation tax series adjusted to account for estimated impact of annual policy changes. ME = Mean Error, and MAE = Mean Absolute Error.
The results suggest that there are large challenges to explaining and forecasting corporation tax
receipts.13 While GOS, GDP and GNP appear to be the best indicators for predicting receipts, the
explanatory power of even the final outturn data is still weak. A further challenge for forecasting on this
basis is posed by the fact that there are regularly significant lags to the publication of accurate historical
data for each of these aggregates. For instance, companies will often not submit final tax returns until
nine months after their accounting year end.
A large number of fundamental drivers do not appear to offer any substantive improvement in
determining year-to-year developments. In particular, given that close to half of the variation in annual
growth in corporation tax receipts remains driven by unknown factors, it seems that idiosyncratic
developments often dominate economic fundamentals in explaining year-to-year movements in
corporation tax receipts.
13 A panel estimation approach was also used to try to model CT receipts on the basis of GOS by sector. The results were not sensible, however, and were thus left out of this analysis. We suspect that this may relate to an inconsistency between how Revenue treat sectoral classifications of CT receipts and how the CSO classify GOS by sector, with the former not revising sectoral classifications once set for an individual entity initially.

Challenges Forecasting Irish Corporation Tax
19
One aspect of the Council’s regular analysis in its Fiscal Assessment Reports involves a decomposition of
tax forecasts into revisions/errors arising from (i) expectations for the macro driver (“macro”) such as
GOS, (ii) confirmation of the final tax take for the previous base year (“starting point”), and (iii) an “other”
source, which captures miscellaneous factors and subjective judgements made by the Department of
Finance. Although errors linked to forecasts of GOS (the macro driver) are also apparent, this analysis of
historical forecasts highlights that “other” sources (i.e., the miscellaneous factors or elements of
judgement) are frequently the largest source of error for CT predictions (Figure 12). This would appear to
further emphasise the importance of idiosyncratic developments to forecasting CT receipts.
6 . P O T E N T I A L P O L I C Y I M P L I C A T I O N S O F T H E U N P R E D I C T A B I L I T Y A N D V O L A T I L I T Y O F
C O R P O R A T I O N T A X
Although we find some evidence that alternative indicators could offer better explanations of within-
sample variation of corporation tax receipts, the challenges faced in predicting highly volatile corporation
tax receipts still appear difficult to surmount. These challenges are magnified by the difficulties associated
with forecasting relevant indicators such as GOS and GDP as well as the extent to which they are subject
to subsequent revision (Casey and Smyth, 2016).14
There are a number of implications of these findings. In particular, there are concerns that CT revenues
coming from relatively few sources could be subject to the risk of large reversals, while sustainable levels
14 Out-of-sample forecasts would still have fared poorly for 2015, for example, given the extent of revisions to aggregates such as GDP and GOS between preliminary and subsequent estimates.
-3.0
-2.5
-2.0
-1.5
-1.0
-0.5
0.0
0.5
1.0
2004 2005 2006 2007 2008 2009* 2010 2011 2012 2013 2014
€ bi
llion
s
F IGURE 12: DECOMPOSITION OF CORPORATION TAX FORECAST ERRORS
Macro Error Starting Point Error Other Error Total Error
Source: Hannon, Leahy, O'Sullivan (2015). Note: Pre-2009, CT forecasts were based on GDP growth. From 2009 onwards GOS was used. The bars show how much of the total forecast error is due to error in forecasting the macro driver, due to the starting point error, or other unexplained errors.

of CT receipts are likely to be more difficult to identify. Questions then arise as to how to ensure that the
public finances are soundly managed against this backdrop. While circumstances can exist where it may
be optimal to fully adjust government expenditure (or discretionary tax measures) to sudden changes to
revenues15, a number of factors might entail that this would be an unwise policy stance for the
Government in relation to corporation taxes:
First, the presence of adjustment costs – particularly costs of adjusting expenditure downwards -- would
suggest that permanent increases in government expenditure might be considered suboptimal when
receipts could prove to be transitory in nature.16
Second, the possibility that liquidity or borrowing constraints could become binding in the future,
especially when debt levels are high, would also motivate against funding permanent spending increases
(or discretionary tax measures) on the back of volatile and unpredictable receipts. These constraints can
arise in the context of sustainability concerns. A basic condition for fiscal sustainability is that the debt-to-
GDP ratio is stable at an appropriate level or can reasonably be expected to become so in future. The risk
that a large portion of revenues may suddenly and unexpectedly disappear, however, can mean that, for a
given level of expenditure, government deficits will increase. This may lead to an expanding debt level in
cases where other factors such as economic growth are insufficient to offset the impact. Predicating
forward-looking debt sustainability assumptions on the basis that a large share of tax revenues will
continue to come from a highly unpredictable and volatile revenue sources may therefore prove unwise.
Third, a desire to maintain some level of precautionary savings would also argue against using such
receipts for permanent expenditure increases. A basic intuition underpinning savings behaviour is that an
increase in volatility will typically warrant higher savings or lower expenditure in order to offset the
increased scale of lost income that might be realised at a later stage.17
The third factor described above partly motivates the rainy day/contingency reserve fund that has been
recently proposed to operate from 2019 (Department of Finance, 2016), though other solutions to the
treatment of volatile and unpredictable corporation tax receipts are also available.18 One aspect being
15 Depending on the social welfare function and the weighting of inter-temporal utility, for example. 16 Engaging in difficult retrenchments at a later stage may also run the risk of discouraging other investment and reducing future growth when pursued. 17 Leland (1968) provides a formal exposition of this idea in the consumption literature, while Engel and Valdés (2000) apply it in the context of an optimal fiscal strategy for countries with rich oil resources. In addition, the precautionary savings model presented by Caballero (1990) shows how an increase in volatility can lead to higher precautionary saving in the case where income follows a random walk under the assumption of an agent with constant-absolute-risk-averse utility. 18 The proposed rainy day fund is intended to have a countercyclical role, thereby addressing a notable failing of Irish fiscal policy in the recent past. The Council sees value in such a fund – provided it is designed and managed appropriately – in terms of ensuring an appropriate fiscal stance over the medium term that would provide more room for manoeuvre during a future downturn (IFAC, 2016). In particular, safeguards would have to be put in place to prevent inappropriate uses of the fund and laying out clearly the criteria under which the fund’s resources could be accessed.
Challenges Forecasting Irish Corporation Tax
21
considered by the Government is the merit of using any one-off receipts (such as windfall corporate tax
receipts – or indeed other windfall tax revenues) to capitalise a rainy day fund. In light of the risks
described in this Analytical Note, corporate tax receipts would appear to be an obvious candidate from
which to draw resources. However, other means of mitigating the risks related to funding permanent
expenditure increases with increases in corporate tax receipts could equally be considered. Rather than
setting aside receipts for macroeconomic stabilisation purposes, alternative solutions might include
allocating receipts towards reducing public debt to a safer level.
While this Note focuses on assessing methods of forecasting CT receipts, it is timely to apply the findings
specifically to developments in 2015 given the sharp surge in CT revenues observed last year (see
Appendix 2 for a more detailed discussion). Use of the proceeds from the surge in revenues should
depend in part on whether these are considered to be temporary or permanent. In light of the limited
clarity as to the drivers of growth in economic activity in 2015 and uncertainty as to the persistence of the
increases, however, further caution is warranted in using the recent CT revenue surge as a basis for
funding long-lasting increases in spending and discretionary tax cuts. Irrespective of expected persistence,
the increased volatility of CT receipts would also support higher savings in the presence of a precautionary
saving motive.

R E F E R E N C E S
Bermingham, C. and T. Conefrey (2011). “The Irish Macroeconomic Response to an External Shock with an Application to Stress Testing,”‖Research Technical Paper 10/RT/11, Dublin: Central Bank of Ireland.
Casey, E. and Smyth, D. (2016). “Revisions to macroeconomic data: Ireland and the OECD”, Economic and Social Review, Vol. 47, No. 1, 2016, pp. 33-68.
Caballero, R., (1990). “Consumption Puzzles and Precautionary Savings,” Journal of Monetary Economics, Volume 25, pp. 113-136.
Central Bank of Ireland (2016). “Quarterly Bulletin Q1 2016,”Dublin: Central Bank of Ireland, January 2016.
Department of Finance (2016). Summer Economic Statement. Available at: http://www.budget.gov.ie/Budgets/2017/Documents/SES/Summer-Economic-Statement-2016.pdf
Engel, E. and Valdés, R. (2000). “Optimal Fiscal Strategy for Oil Exporting Countries,” IMF Working Paper 00/118, Washington: International Monetary Fund.
Enright, S. and M. Dalton, (2014). “The impact of the patent cliff on Pharma-Chem output in Ireland,” Dublin: Statistical and Social Inquiry Society of Ireland, Vol.43, 2013-14, pp. 91-113.
Hannon, A., E. Leahy and R. O’ Sullivan (2015). “An Analysis of Tax Forecasting Errors in Ireland,” Irish Fiscal Advisory Council, Working Paper, No.3, September 2015.
Heckemeyer, J. H. and M. Overesch, (2013). “Multinationals’ profit response to tax differentials: Effect size and shifting channels,” ZEW Discussion Papers, 13-045, ZEW / Center for European Economic Research.
Irish Fiscal Advisory Council (2016). Fiscal Assessment Report, June 2016. Dublin: Irish Fiscal Advisory Council. Available at: http://www.fiscalcouncil.ie/publications/
Meese, R.A., and K. Rogoff, (1983). “Empirical Exchange Rate Models of the Seventies: Do They Fit Out of Sample?” Journal of International Economics 14, February 1983, pp. 3–24.
Mourre, G. and S. Princen (2015), “Tax Revenue Elasticities Corrected for Policy Changes in the EU,” European Commission Discussion Paper, 018, November 2015.
Nkusu, M., (2013). “Boosting Competitiveness to Grow Out of Debt : Can Ireland Find a Way Back to Its Future?” IMF, Working Paper, No. 13/35, February 2013.
Leland, H.E., (1968). “Saving and Uncertainty: The Precautionary Demand for Saving,” Quarterly Journal of Economics, 82 No.2, 465-473, 1968.
Lequiller, F. and D. Blades, (2014). “Understanding National Accounts”: Second Edition, OECD Publishing, Paris.
Pigott, V. and K. Walsh, (2014). “Corporation Tax – A Note on the Context and Concentration of Payments,” Dublin: Office of the Revenue Commissioners, October 2014.
Purdue, D., (2016). “Understanding Ireland’s Corporate Tax Revenue,” Dublin: National Treasury Management Agency, Research Technical Note, August 2016.

Challenges Forecasting Irish Corporation Tax
23
Revenue (2015). Letter to Minister Michael Noonan, 20th November 2015. Dublin: Office of the Revenue Commissioners. Available at: http://www.finance.gov.ie/sites/default/files/Letter%20from%20Revenue%20Chairman%20to%20Minister%20for%20Finance.pdf
Tancred (2016). “An Analysis of Corporation Tax Receipts in 2014-2015,” Dublin: Office of the Revenue Commissioners, April 2016.
Wang, J., (2008). “Why Are Exchange Rates So Difficult to Predict?” Federal Reserve Bank of Dallas, Economic Letter, Vol. 3, No.6, June, 2008.

A P P E N D I X 1 : E S T I M A T I O N W I T H L O N G E R S A M P L E P E R I O D
Using a longer sample period, we find similar results for use of nominal GDP as a predictor of CT receipts
as in the analysis summarised in Section 5. The estimation results (Table A1), which are based on the
same policy-adjusted CT series as before albeit over a longer sample period, show a similar coefficient for
nominal GDP as in the shorter sample period. Also, the model using nominal GDP again proves better at
explaining the in-sample variation in CT receipts relative to GOS. Nominal GNP also provides a good fit,
with a similar coefficient as identified before. However, it has the obvious drawback of not incorporating
information regarding factor income flows, which are subject to Irish corporate taxation.
TABLE A1: RELATIONSHIPS BETWEEN CORPORATION TAX AND SELECTED DRIVERS (SAMPLE: 1990-2015)
1 2 3
∆ GOS 1.08*** (0.28)
∆ GDP 1.64***
(0.37)
∆ GNP 1.92***
(0.42)
Constant 0.02 -0.01 -0.01
(0.04) (0.04) (0.04) Adjusted R-Squared 0.35 0.43 0.44
DW 1.58 1.70 1.74
Observations 26 26 26
Period 1990-2015
1990-2015
1990-2015
Sources: Internal IFAC calculations; Department of Finance data on corporate tax revenues. Notes: All series are in log-differences. Corporation tax series adjusted to account for estimated impact of annual policy changes. Standard errors in parentheses. Statistical significance: *** 1 per cent; **5 per cent; *10 per cent. †Regression 1 is the base specification.

Challenges Forecasting Irish Corporation Tax
25
A P P E N D I X 2 : T H E 2 0 1 5 C T R E V E N U E S U R G E
In 2015, there was an unexpected surge in CT receipts. The level of these rose by 49 per cent to €6.9
billion from €4.6 billion in the previous year. The increase also amounted to an excess of €2.3 billion (50
per cent) relative to the forecast made in Budget 2015 (i.e., in October of the previous year) and another
€0.3 billion ahead of expectations indicated a little more than one month before the end of 2015 itself
(Revenue, 2015).
While the main focus of this Analytical Note is to assess methods of forecasting CT receipts, it is worth
examining to what extent the surge in 2015 could be explained using the various approaches we identify.
The models that most closely explain the CT surge last year are those that incorporate the latest revised
National Accounts estimates of GDP/GOS for 2015. The Initial estimates of GDP for 2015 published by the
CSO in March 2016 led to a substantial underestimation of actual CT outturns based on models used to
forecast CT discussed in Section 5. Given that the revised data were not available until seven months after
the year ended (July, 2016), early model estimates could be expected to encapsulate large forecast errors
also observed through 2015.19
The revised CSO data published in July 2016 show much larger increases in GDP compared to the initial
estimates and the new data are now more consistent with the increase in corporation tax last year. It is
worth stating, however, that the increases in both CT and GDP/GOS may be driven by unrelated factors so
that the correlation could be a spurious one. To understand whether this is the case or not, it is helpful to
explore the reasons underlying the sharp rise in revised GDP levels. The CSO (2016) note that the revisions
to the 2015 National Accounts are explained in part by corporate restructuring.20 Purdue (2016) notes
that these restructurings may have arisen following re-domiciling of corporate entities, corporate
inversions or the “onshoring” of intellectual property.21 The authors also note that, while each factor can
lead to changes in the level of GDP recorded, the third (onshoring) is more likely to lead to a significant
increase in Irish CT receipts.22
The reason why onshoring of intellectual property might cause both higher GDP and higher CT receipts
relates to traded activities recorded in Irish GDP. For example, an increase in net exports from 19 Indeed, even consensus forecasts for Irish real GDP growth in 2015 ranged between 4.8 per cent to 7 per cent as of December 2015, lower than both preliminary (7.8 per cent) and final estimates (26.3 per cent). 20 Also cited by the CSO are increased aircraft imports related to international leasing activities. Aside from the fact that the cost of these imports may offset any additional profits generated in the short-run, more than 80 per cent of the annual increase in GVA for 2015 arose in the Industry sector as opposed to the services sector where leasing activities are recorded. In addition, the leasing sector itself forms a small part of the services sector. Therefore, it is more likely that the bulk of the revision to GDP arises due to restructuring activities. 21 An inversion in this case can occur, for example, when a company not domiciled in Ireland merges with one already domiciled in Ireland, whereas a re-domiciling typically occurs when a firm independently changes its domicile to Ireland. 22 As noted by the authors, this reflects the double taxation relief feature of the Irish tax system. As with most international tax systems, a company can claim relief on its tax bill if a subsidiary was already taxed in another country. Given Ireland’s relatively lower corporate tax rate, this relief often offsets the Irish tax liability in the context of world-wide income.
manufacturing sectors may occur if a rise in exports is not matched by rises in imports. The value of Irish
goods exports rose by €81.1 billion in 2015. However, the value of all imports (both goods and services)
rose by just €50.8 billion, of which €19.5 billion relates to royalties/licenses imports linked to the use of
intellectual property. The disproportionate rise in goods exports relative to imports likely reflects in part
the relocation of intellectual property assets to Ireland.23 Of note in particular, is the effect that this has
on contract manufacturing activities.24 These activities previously had a negligible effect on GDP over time
(albeit, impacting on specific quarters due to delays between associated exports and offsetting import
costs). However, these activities now appear to be producing positive impacts on exports that are not
offset by royalty/license and other imports, leading to a material positive effect on overall GDP.
If higher profits arise from export activities recorded in Ireland following the onshoring of assets, this
could plausibly explain why CT receipts rose sharply in 2015. However, also evident in 2015 was a sharp
rise in the provision for depreciation in the National Accounts (€30.6 billion). As companies may claim
capital allowances on account of the amortisation of the acquisition cost of the intangible asset to
offset CT payments, this increase may have offset increased CT amounts payable that are associated with
the same activities. This factor may undermine the explanation that onshoring of intellectual property
assets directly resulted in higher CT receipts in 2015. As a result, more information is needed in order to
confirm the nature of the association between the rise in GDP and the rise in CT receipts in 2015.
In terms of policy implications, the use of the proceeds from the surge in revenues should depend in part
on whether these are considered to be temporary or permanent. Although the reasons for the surge are
becoming somewhat clearer, there is still a great deal of uncertainty about the persistence of the sudden
upward shift in the level of receipts. This suggests caution is warranted in using the additional revenues to
fund permanent changes in spending and tax changes. Irrespective of the anticipated persistence, the
increased volatility of this revenue source more generally would tend to support higher savings in the
presence of a precautionary saving motive.
23 As noted by the CSO (2016), corporate restructuring arose in part through reclassifications of entire balance sheets in 2015 meaning that the level of capital assets in Ireland increased dramatically compared to 2014. 24 Contract manufacturing activities occur when an Irish-resident firm (not necessarily Irish owned) contracts a manufacturer overseas to produce a good for supply to an end-client abroad. The activity has been documented in various IFAC Fiscal Assessment Reports since 2014, but is covered in detail in Box A of IFAC (2015).