analytics & big data - society of actuaries in ireland · analytics & big data what, why...
TRANSCRIPT

Analytics & Big DataWhat, Why and How
Colin Murphy FSAI
Dr. Richard Southern
Sinead Kiernan FSAI
07.04.2014
Agenda
• Introduction
• What is Analytics and Big Data?
• Growth of Analytics and Big Data
• What does analytics mean for the insurance sector? What is the role of actuaries?
• Analytics applied to the insurance sector
• Tools used in data analytics
• Questions


What is Analytics and Big Data?

Understanding Analytics

Why Business Analytics?
Powerful trends are driving the adoption of a new approach to business analytics. An unforgiving
demand for performance, a wake-up call for better risk management in the face of tougher regulatory
enforcement, and exponentially increasing amounts of data to process, comprehend, and react to.

Advanced
Analytics
Performance
management
Business intelligence
Data management
Foresight
Insight
High
Low
People
Process
Technology
Strategy and governance
Hindsight
Business analytics is the practice of using data to drive business strategy and performance. It includes a
range of capabilities – from looking backward to evaluate what happened in the past, to forward-looking
approaches like scenario planning and predictive modeling. It spans the capabilities stack from data
management and business intelligence up through performance management and advanced analytics.
Analytics defined

Evolution of Business Analytics
Growth of Analytics and Big Data

Our Lives Through Data …

Analytics Survey

Analytics Survey
“
”

Analytics Survey

Analytics Survey
“
”

Analytic Trends
• Data Science is an emerging and growing area
• Growing demand for talent across all industries
• Significant growth in availability of courses: 3rd level, MOOC etc
• There are shortages of skilled people but…
• Good data scientists take time to develop and rely on past experience
• The effective embedding of analytics across Industries is evolving all the time

Analytic Trends
• Data visualisation is real, and valuable
• Helps to give a better understanding to the data
• Well used hypothesis generation method to understand patterns, trends and behaviours
• However, there is a right way and a wrong way
• The overuse of visualisation can get in the way of clarity -
• Making a complex story too simple or
• Making simple facts seem too complex

Analytic Trends
• Not new – In theoretical existence since 1960’s and academic use since 1970/80’s
• Assists in task automation & separating “signal from the noise”
• Several success stories of application to real world business problems
• Don’t exclude expert intervention - Bring back the Humans!!
• “Garbage in – garbage out” holds for any modelling scenario
• Overly complex estimators are badly understood and accepted in business - transparency

Analytic Trends
• Emerging as a new C-level position - sitting at the Exec table
• Chief Analytics Officer (CAO), Big Data Officer (BDO), Chief Data Officer (CDO). . .
• Helps support, sponsor and drive the analytics initiative
• Other CXO level execs have vested interests – CIO, CFO, CMO…
• Is there a measurable benefit to the organisation in creating this function – time will tell!

Data Scientists
Perception, Skills and shortage

Case Study – Business Intelligence
Creating valuable insight from multiple data sources
Business
ProblemData Analytics Insight
Dynamic Dashboarding
To allow quick and easy
visualisation of
unemployment data:
• Nationwide
• By areas with and
without a welfare office
• By town or city
And plotting of
unemployment rates:
• Against the level of
education in a town
• Against the occupation
held
Data Sources
• Welfare office locations
(www.welfare.ie)
• Irish Census 2011 data
(www.cso.ie):
– Economic status of
citizens
– Occupation of
citizens
– Social class of
citizens
– Level of education of
citizens
Analysis
• Unemployment rates
around the welfare
office
• Unemployment rates
for each town and
city
• Unemployment
versus average
education level for
each town and city
• Unemployment
versus occupation
Insight
• Areas of high
unemployment with no
welfare office
• Areas of low
unemployment with a
welfare office
• Distribution of principal
economic status,
occupation, social class
and highest level of
education completed for
each town and city

What does analytics mean for the insurance sector?
What are the opportunities for actuaries in analytics?

Insurers are
leveraging
data to
compete
Increased
Marketing
Spending
Commoditised
Product
Offerings
Pricing
Pressure
Distribution /
Customer
Interaction
Regulatory
Pressures
Slow Industry
Growth
Challenges Facing the Insurance Industry- External Business Pressures

Multiple versions of metrics regarding
customers, policies, claims
Multiple owners of data across the
enterprise
Legacy or siloed systems that are not
integrated
A partial view of the “real” profitability
or state of the organization
Incomplete information available for
decision making
Lack of consistent fact based decision
making, due to incomplete information
Observed Trends
Organisations are looking for ways to harness internal and external information
to gain a competitive edge to facilitate timely and fact based tactical and
strategic decisions – seeing data as a strategic asset
Companies are shifting their operations from product-centric to customer-
focused business models requiring more sophisticated information
management and analytical capabilities
Challenges Facing the Insurance Industry- Internal Business Challenges

Source: Deloitte Survey
Barriers to Realising Data Benefits- Many insurers fail to leverage the business value of data
Implementation Challenges
Insurers maintain data in separate functional or
product silos with multiple owners and no
overriding Master Data Management or
Enterprise Data Strategy.
Multiple versions of customer information and
disparate data sources need to converge to
create a coherent single view of the customer.
Implementing information management or
analytics capabilities without fully
understanding industry leading capabilities
often leads to failure.
Implementing data and analytical investment
programmes without understanding what
business challenge you are attempting to be
solve.
At what stage is your
organisation’s data strategy?

Shareholder Value
Premium Growth
Price optimisation
Loss Prediction models
Customer retention
Customer lifetime value
Claims Cost Management
Propensity score Analysis
Litigation management
Claim severity segmentation
models
Fraud Detection Models
Operational Efficiencies
Employee analytics in recruitment
Text mining social media
Complaints handling
Call centre analytics
Other
Risk analytics
Marketing / Sales
Analytics impacts the entire insurance value chain

Strategic
questions
Assess current
capabilities
Build data and analytical
competencies
Implement pilots
and prototypes
Adopt in operational
processes
1
2
3
4
5
Implementing Analytics

Data
Modelling / Analysis
Strategic / Business
Insight
Professionalism
Actuary
Opportunities for Actuaries

Examples of analytics applied to the insurance sector

Retention Analytics- Approach
Identify required data to generate
insights
Combine data into a single view of the
customer
Create customer segments
Build propensity model
Calculate customer value metric
Prioritise customers for inclusion in the initiative based on
probability and value
Design benefit based on customer
segment requirements
Integrate customer contact list into
campaign management tools
1
2
3
4
5
6
7
8

Fraud Detection
• Companies are increasingly turning to data analysis and predictive
analytics for fraud mitigation
• Data analytical techniques can be utilised to help detect fraud at
both point of sale and point of claim (including suppliers)
• Techniques can aid identification of known fraudsters at point of
application
• Identification of applications whose features in combination are
indicative of higher fraud likelihood i.e. a relative probabilistic finding
• Given a claim has happened, what is the probability that it is
fraudulent?

• Data preparation - building a suitable database for modelling
• Applying data analytical and modelling techniques to establish
statistically verifiable fraud signals and fraud scoring engines -
requires access to skilled modelling competencies
• Apply developed models in operational processes – for example
establishing referral rules in underwriting and claims processes
• Establish measures to monitor effectiveness
Fraud Detection- Establishing analytics capability

Telematics
CustomerEngagement
Leveragingthe Data
1
Analytics and Predictive Modeling
2
34
How do I capture data? How much data do I
need?
How do I use this data to
drive credible risk selection and pricing?
Do I want to use telematics data
for more than pricing?
What can I offer my policyholders to
increase engagement and loyalty?
Data and Data Collection
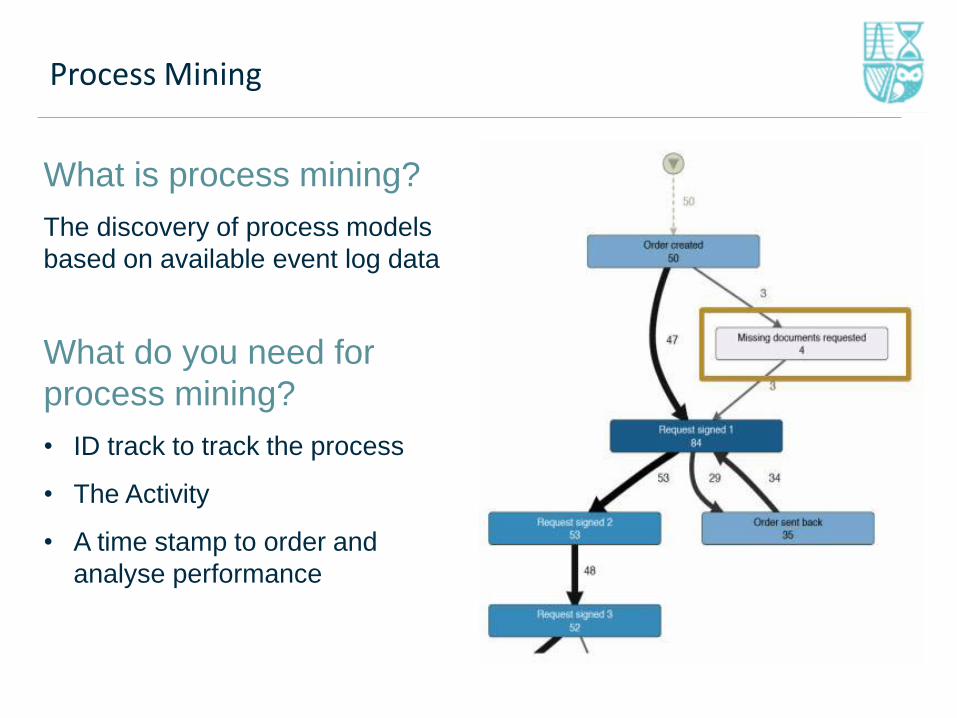
Process Mining
What is process mining?
The discovery of process models
based on available event log data
What do you need for
process mining?
• ID track to track the process
• The Activity
• A time stamp to order and
analyse performance

Process mining – A demonstration

Sentiment Analysis
What is sentiment analysis?
Measuring a persons attitude
towards a brand or product.
How does it work?
Through a set of methods, sentiment
analysis classifies the polarity
(positive or negative) of comments
or statements which determine
whether sentiment around a topic is
positive negative or neutral.

Sentiment Analysis – An Example

Visualisation
Dashboards Geospatial analysis

Tools used in Data Analytics

Example of Tools used
Open Source
Commercial

Questions