analyzing airline service improvement strategy
TRANSCRIPT

ANALYZING AIRLINE SERVICE IMPROVEMENT STRATEGY THROUGH
IMPORTANCE AND PERFORMANCE ANALYSIS
Cheng-Min FENG Professor Institute of Traffic and Transportation National Chaio Tung University (ITT, NCTU) 4th Fl., No. 114, Sec. 1, Chung Hsiao W. Road Taipei, TAIWAN TEL: 886-2-2349-4956 FAX: 886-2-2349-4965 E-mail:[email protected]
Kung-Yeun JENG Ph.D. Candidate of ITT, NCTU. and Chairman of UNI AIRWAYS CORPORATION, 7F, No.100, Chang-An E. Rd., Sec.2, Taipei, TAIWAN TEL: 886-2-2513-5505 FAX: 886-2-2513-3211 E-mail:[email protected]
Abstract: The main purpose of this study is to present an evaluation method that employs the well-established Importance-Performance Analysis (IPA) for understanding airline passengers' degree of care, degree of satisfaction and priority list on some critical service items. The analysis results will serve as the basis for airlines to improve their service strategies in response to customer needs. The proposed method has been applied in the Taiwan UNI AIR market analysis through a comprehensive passenger survey. The application results clearly indicate that the proposed IPA method can effectively identify critical airline service items to be improved, and serve as a valuable tool to assist airline managers in developing airline service improvement strategies. Keywords: airline service improvement strategy, importance and performance analysis, degree of care, degree of satisfaction 1. INTRODUCTION Due to the deregulation policy of allowing more domestic airlines to fly in Taiwan in 1987, the capacity and traffic volume of the domestic flight market in Taiwan have grown up dramatically. In fact, such a policy has resulted in not only substantial improvement of domestic air travel quality, but also an initial surge of the overall demand. The total number of air travels in 1987 has reached up to 18.6 million passengers, that is, the highest record in Taiwan’s domestic flight market. However, despite the initial significant rise, the annual passenger volume after 1987 began to decline, and nearly all domestic airlines suffer tremendous loss every year since then. To increase the market share and minimize the loss, most airlines constantly implement a variety of strategies, including fare promotion, airlines joint venture, introducing FFP (Frequent Flyer Program), etc. Evaluating the effectiveness of those implemented strategies has thus emerged as one of the pressing issues in the airline industry. Due to the unique characteristics of transparency, in-separateness (or all-at-once), heterogeneity, and fugitiveness, it is quite difficult for analysts to precisely evaluate the poorly defined “service quality” for airline operations. For example, Parasnraman、Zeithaml & Berry(1985) believed that it is more difficult for customers to define the service quality than
Journal of the Eastern Asia Society for Transportation Studies, Vol. 6, pp. 782 - 797, 2005
782

to define the product quality. They also stated that the recognition of service qualities is generated from the comparison between a customer’s expectation and the performance he/she has actually perceived, and the evaluation of service quality should consider not only the results but also its process. Note that the contents of service quality may be different in different industries. According to the IATA (International Air Transportation Association), service items for airlines include seat reservation, selling ticket, airport check-in, cabin service, baggage delivery and the subsequent services after arriving at destinations, etc. In general, from a passenger’s perspective, the service items of airline should include flight frequency, flight safety, cabin food and beverage, seating, flight on schedule, etc. On the other hand, from an operator’s perspective, the airline industry generally pays more attention on safety, comfort, convenience, accuracy, and hospitality, etc. (Chen & Liu, 2002). Jin(1998)collected the data associated with both the observed and revealed preferences of domestic flight passengers to study how the factors affect a passenger’s choice of airlines. He found that the set of critical factor that may influence passengers’ choice are airlines’ facilities, safety record, ticket price, cabin food/beverage and possible delay time. Proussaloglous & Koppelman(1995)in their study of passengers’ choice of airlines showed that factors influencing a passenger’s choice can be divided into three categories, including trip characteristics, travelers attributes, and airline reputation (i.e., service qualities, market performance). Chu(1995)found that different groups of passengers in Taiwan consider different service quality factors, each having different levels of influence on their decisions. Webster(1989)also indicated that the expectation of service quality may vary significantly among different groups of passengers, and thus it is necessary to implement the market segment strategy in the provision of services. In summary, it is recognized that most existing studies intend to understand the degree of satisfaction toward different service factors. However, the discrepancy among passengers with respect to the degree of satisfaction and the degree of care of each factor in their choice behavior has not been sufficiently addressed. Hence, this research intends to address such a critical issue, based on a comprehensive passenger survey that focuses on how passengers choose different airlines to the same destination. The Importance Performance Analysis (IPA) approach is then applied to analyze the degrees of satisfaction and care toward different service items from the perspective of both overall passengers and different classified groups of passengers. Research findings from this study can provide valuable information for airline managers to identify appropriate plans for improving their service quality and responding to the expectation of their customers. 2. METHODOLOGY Understanding a customer’s attitude towards a product is essential for market analysis. By doing so, analysis can understand which factors contribute to a customer’s higher degree of satisfaction, and these by design effective marketing strategies.(Engel, et al., 1993). For example, Martilla and James(1977) suggested a simple structure of IPA(Importance-Performance Analysis) from the product attributes study in the motorcycle industry. They proposed a simple two-dimensional framework to describe the relationship between the degree of satisfaction and the degree of care. Sethna(1982) found that IPA is an
Journal of the Eastern Asia Society for Transportation Studies, Vol. 6, pp. 782 - 797, 2005
783

effective tool for use in identifying critical parts of services that remain be improved. O’Sullivan(1991) suggested a four-step process to conduct the IPA approach, which are:
Listing every service items and then developing a questionnaire based on these listed items.
Giving a score to these items associated with of “Importance” and “Performance” for every service items. The first indicator of Importance is to reflect a customer’s degree of care to a product or a service. The second indicator of Performance is specified to capture a customer’s degree of satisfaction to a product or a service.
Assigning the scores for each of those service items in a two-dimensional diagram using Performance as the X axle and Importance as the Y axle.
Dividing the entire diagram into four cells, using the mean scores on each axle as the dividing point (see Figure 2.1).
Performance (Degree of Satisfaction) Figure 2.1 The Diagram of Importance-Performance Analysis
Where:
Cell I: Keep Up the Good Work: It means that customers care more about the service items in this cell and express a high level of satisfaction. Usually, items in this area are the main sources that constitute the product’s main strength.
Cell II: Concentrate Here: It means that customers care more about the service items in this cell, but they are not satisfied with the service performance. In other words, these service items are the apparent weak points of the product. Companies need to pay more their attentions on items in this region and identify the solutions as soon as possible.
Cell III: Low Priority: It means that customers care less about the service items in this cell, and they are not satisfied with these service performance either. It appears that items in this cell are not important issues, but there exists some potential to change customer’s attitude if a brand new solution can be identified.
Cell IV: Possible Overkill: It means that customers care less about the service items in this cell, but they satisfy these service performance. It means that companies may over emphasize the role of those items.
3. RESEARCH STRUCTURE The study based on the overall research structure in Figure 3.1, intends to explain how the gap between Importance and Performance can be appropriately handled with the composition of
II Concentrate Here
I Keep Up the Good Work
III Low Priority
IV Possible Overkill
High
Importance
(Degree of C
are)
High Low
Low
Journal of the Eastern Asia Society for Transportation Studies, Vol. 6, pp. 782 - 797, 2005
784

different service items. A step-by-step description of this research structure is presented hereafter in this section.
Figure 3.1 A Graphical Illustration of the overall research structure
3.1 Customer Categories Data collected from the results of a questionnaire survey can be classified into several distinct groups, based on present criteria, such as respondents’ gender (male or female), travel frequency (frequent flyers or less frequent flyers), and trip purpose (business, vacation or visiting/home). 3.2 Selecting Service Items Bowen & Schneider (1982) pointed out that costumers usually assess the service quality according to their observed staff’s behavior. The study uses seven service items to measure a customer’s perception of the airline service quality, which are: Seat Reservation, Ground Service, Cabin Facility, Cabin Service, Cabin Food, Baggage Delivery, and Complaint Response, and two general items reflecting company’s reputation, such as Flight Safety and Flight On-Time. The quality of service is measured with the five degrees of Likert Scales. 3.3 Description of the Case Study Data This research uses the domestic market of UNI AIR as the study case. Surveys were conducted at airports in Taiwan where UNI AIR offers services. The sample rate is based on the actual passenger volume on each flight. Questionnaires were sent out to passengers randomly by service counters while they are checking-in. Passengers were asked to return the completed questionnaires to the airport representatives of UNI AIR.
Customer
Categories
Service Items
Seat Reservation Ground Service Cabin Facility Cabin Food
Cabin Service Baggage Delivery
Complaint ResponseFlight Safety
Flight On-Time
Importance
Performance
Service Improvement
Strategies Gap
Journal of the Eastern Asia Society for Transportation Studies, Vol. 6, pp. 782 - 797, 2005
785

Due to constraints of time and cost, the sample size of this study is determined as follows (seen Table 3.1):
10631
96.103.02309092
309092
1222
2/
≈
+⎟⎠⎞
⎜⎝⎛ ×
×
=
+⎟⎟⎠
⎞⎜⎜⎝
⎛=
αZdN
Nn
(N= population size, n=sample size)
Table 3.1 Sample Sizes in Different Levels of Sample Error in 95% Confidence Interval Error(d) 0.01 0.02 0.03 0.04 0.05 Sample size(n) 9314 2382 1063 599 384 The passenger volume on UNI AIR in September 2003 is 309,902. Based on the company’s data, it is about the highest passenger volume for that year. Therefore, the study uses this specific volume as the assumed population size (N). Given the acceptable sample error d=0.04 , the confidence level 95%, and assuming the population size is 309,902, the expected sample size is 599 passengers. 4. DATA ANALYSIS The study sent out 2000 questionnaires from Nov. 26 to Dec. 2, 2003, and 1300 of them were returned. Among those returned questionnaires, a total of 343 were not completed. The remaining 957 sample data have been classified into several groups according to the selected criteria (see Table 4.1).
Table 4.1 Data Classification
Classifications Customer Attributes Numbers of Samples Percentage
Male 678 70.8% Gender
Female 279 29.2%
Frequent 438 45.8% Frequency
Less Frequent 519 54.2%
Business 535 55.9%
Vacation 47 4.9% Trip Purpose
Visiting/Home 375 39.2%
The Importance-Performance Analysis (IPA) will be conducted under the three types of data classification.
Journal of the Eastern Asia Society for Transportation Studies, Vol. 6, pp. 782 - 797, 2005
786
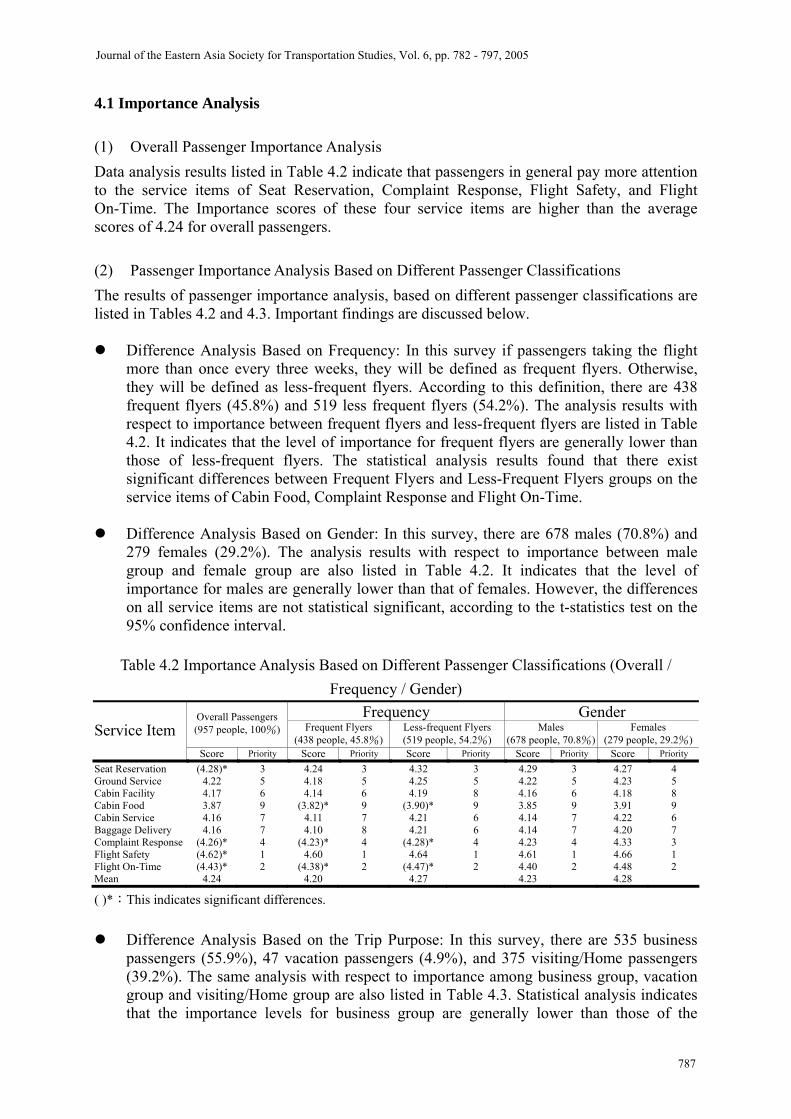
4.1 Importance Analysis (1) Overall Passenger Importance Analysis Data analysis results listed in Table 4.2 indicate that passengers in general pay more attention to the service items of Seat Reservation, Complaint Response, Flight Safety, and Flight On-Time. The Importance scores of these four service items are higher than the average scores of 4.24 for overall passengers. (2) Passenger Importance Analysis Based on Different Passenger Classifications The results of passenger importance analysis, based on different passenger classifications are listed in Tables 4.2 and 4.3. Important findings are discussed below.
Difference Analysis Based on Frequency: In this survey if passengers taking the flight more than once every three weeks, they will be defined as frequent flyers. Otherwise, they will be defined as less-frequent flyers. According to this definition, there are 438 frequent flyers (45.8%) and 519 less frequent flyers (54.2%). The analysis results with respect to importance between frequent flyers and less-frequent flyers are listed in Table 4.2. It indicates that the level of importance for frequent flyers are generally lower than those of less-frequent flyers. The statistical analysis results found that there exist significant differences between Frequent Flyers and Less-Frequent Flyers groups on the service items of Cabin Food, Complaint Response and Flight On-Time.
Difference Analysis Based on Gender: In this survey, there are 678 males (70.8%) and
279 females (29.2%). The analysis results with respect to importance between male group and female group are also listed in Table 4.2. It indicates that the level of importance for males are generally lower than that of females. However, the differences on all service items are not statistical significant, according to the t-statistics test on the 95% confidence interval.
Table 4.2 Importance Analysis Based on Different Passenger Classifications (Overall /
Frequency / Gender) Frequency Gender Overall Passengers
(957 people, 100%) Frequent Flyers (438 people, 45.8%)
Less-frequent Flyers (519 people, 54.2%)
Males (678 people, 70.8%)
Females (279 people, 29.2%)
Service Item Score Priority Score Priority Score Priority Score Priority Score Priority
Seat Reservation (4.28)* 3 4.24 3 4.32 3 4.29 3 4.27 4 Ground Service 4.22 5 4.18 5 4.25 5 4.22 5 4.23 5 Cabin Facility 4.17 6 4.14 6 4.19 8 4.16 6 4.18 8 Cabin Food 3.87 9 (3.82)* 9 (3.90)* 9 3.85 9 3.91 9 Cabin Service 4.16 7 4.11 7 4.21 6 4.14 7 4.22 6 Baggage Delivery 4.16 7 4.10 8 4.21 6 4.14 7 4.20 7 Complaint Response (4.26)* 4 (4.23)* 4 (4.28)* 4 4.23 4 4.33 3 Flight Safety (4.62)* 1 4.60 1 4.64 1 4.61 1 4.66 1 Flight On-Time (4.43)* 2 (4.38)* 2 (4.47)* 2 4.40 2 4.48 2 Mean 4.24 4.20 4.27 4.23 4.28
( )*:This indicates significant differences.
Difference Analysis Based on the Trip Purpose: In this survey, there are 535 business
passengers (55.9%), 47 vacation passengers (4.9%), and 375 visiting/Home passengers (39.2%). The same analysis with respect to importance among business group, vacation group and visiting/Home group are also listed in Table 4.3. Statistical analysis indicates that the importance levels for business group are generally lower than those of the
Journal of the Eastern Asia Society for Transportation Studies, Vol. 6, pp. 782 - 797, 2005
787

vacation group. Such differences are also statistical significant on the service items of Cabin Food and Baggage Delivery. On the other hand, the importance levels for visiting/home group are generally lower than those of vacation group. Again, differences are statistically significant on those service items of Cabin Food and Baggage Delivery. Finally, the importance levels for business group are generally lower than those for the visiting/home group. However, there exists no significant differences among all service items according to the statistics test.
Table 4.3 Importance Analysis Based on Different Passenger Classifications (Trip Purpose)
Trip Purpose Business
(535 people, 55.9%)
Vacation (47people,
4.9%) Business
(535 people, 55.9%)
Visiting/Home (375 people,
39.2%) Vacation
(47people, 4.9%)
Visiting/Home (375 people,
39.2%) Service Item
Score Priority Score Priority Score Priority Score Priority Score Priority Score Priority
Seat Reservation 4.26 3 4.49 3 4.26 3 4.29 3 4.49 3 4.29 3 Ground Service 4.21 5 4.40 5 4.21 5 4.21 5 4.40 5 4.21 5 Cabin Facility 4.18 6 4.34 6 4.18 6 4.13 8 4.34 6 4.13 8 Cabin Food (3.87)* 9 (4.17)* 9 3.87 9 3.83 9 (4.17)* 9 (3.83)* 9 Cabin Service 4.13 7 4.30 8 4.13 7 4.19 6 4.30 8 4.19 6 Baggage Delivery (4.11)* 8 (4.45)* 4 4.11 8 4.18 7 (4.45)* 4 (4.18)* 7 Complaint Response 4.25 4 4.34 6 4.25 4 4.26 4 4.34 6 4.26 4 Flight Safety 4.63 1 4.74 1 4.63 1 4.60 1 4.74 1 4.60 1 Flight On-Time 4.42 2 4.57 2 4.42 2 4.42 2 4.57 2 4.42 2 Mean 4.23 4.42 4.23 4.23 4.42 4.23
( )*:This indicates significant differences.
4.2 Performance Analysis (1) Overall Passenger Performance Analysis Data analysis results listed in Table 4.4 indicate that passengers feel more satisfied on the service items of Seat Reservation, Ground Service, Cabin Service, Baggage Delivery, Complaint Response and Flight Safety. The scores of Performance of these six service items are higher than the average score of 3.89. (2) Passenger Performance Analysis Based on Different Passenger Classifications The results of passenger performance analysis based on different passenger classifications are listed in Tables 4.4 and 4.5.
Performance Analysis Based on Frequency: From Table 4.4, it can be seen that the performance levels of frequent flyers are generally higher than those of less-frequent flyers. According to the statistics analysis, the differences are significant between frequent flyers group and less frequent flyers group on the service items of Seat Reservation, Cabin Facility, Baggage Delivery, Complaint Response and Flight On-Time.
Performance Analysis Based on Gender: The performance analysis results between male
and female groups are also listed in Table 4.4. It indicates that the performance levels for females are generally lower than that for males. However, the differences on all service items are not statistical significant.
Difference Analysis Based on Trip Purpose: The performance analysis results among
business group, vacation group and visiting/Home group are also listed in Table 4.5.
Journal of the Eastern Asia Society for Transportation Studies, Vol. 6, pp. 782 - 797, 2005
788

Statistical analysis indicates that the performance levels for business group are generally lower than that for the vacation group; visiting/home group are generally lower than vacation group; and business group are generally lower than visiting/home group. According to the statistics test, there are significant differences on all service items in all pairs of groups for comparison. However, the only significant difference on the service item between the business group and the visiting/home group is the Ground Service.
Table 4.4 Performance Analysis Based on Different Passenger Classifications (Overall /
Frequency / Gender) Frequency Gender Overall Passengers
(957 people, 100%) Frequent Flyers (438 people, 45.8%)
Less-frequent Flyers(519 people, 54.2%)
Males (678 people, 70.8%)
Females (279 people, 29.2%)
Service Item Score Priority Score Priority Score Priority Score Priority Score Priority
Seat Reservation (3.89)* 6 (3.82)* 5 (3.94)* 6 3.88 6 3.91 4 Ground Service (4.08)* 1 4.04 1 4.11 2 4.10 2 4.02 1 Cabin Facility 3.84 7 (3.77)* 7 (3.9)* 8 3.85 7 3.81 7 Cabin Food 3.52 9 3.39 9 3.63 9 3.57 9 3.40 9 Cabin Service (4.00)* 3 3.92 3 4.07 3 4.03 3 3.95 3 Baggage Delivery (3.90)* 5 (3.80)* 6 (3.99)* 4 3.92 5 3.86 5 Complaint Response (3.92)* 4 (3.83)* 4 (3.99)* 4 3.95 4 3.85 6 Flight Safety (4.08)* 1 4.02 2 4.13 1 4.11 1 4.00 2 Flight On-Time 3.82 8 (3.70)* 8 (3.92)* 7 3.84 8 3.76 8 Mean 3.89 3.81 3.96 3.92 3.84
( )*:This indicates significant differences. Table 4.5 Performance Analysis Based on Different Passenger Classifications (Trip Purpose)
Trip Purpose Business
(535 people, 55.9%)
Vacation (47people,
4.9%) Business
(535 people, 55.9%)
Visiting/Home(375 people,
39.2%) Vacation
(47people, 4.9%)
Visiting/Home(375 people,
39.2%) Service Item
Score Priority Score Priority Score Priority Score Priority Score Priority Score Priority
Seat Reservation (3.86)* 5 (4.26)* 7 3.86 5 3.88 6 (4.26)* 7 (3.88)* 6 Ground Service (4.01)* 2 (4.40)* 2 (4.01)* 2 (4.13)* 1 (4.40)* 2 (4.13)* 1 Cabin Facility (3.81)* 7 (4.15)* 8 3.81 7 3.84 7 (4.15)* 8 (3.84)* 7 Cabin Food (3.48)* 9 (4.04)* 9 3.48 9 3.51 9 (4.04)* 9 (3.51)* 9 Cabin Service (3.98)* 3 (4.36)* 3 3.98 3 3.99 3 (4.36)* 3 (3.99)* 3 Baggage Delivery (3.84)* 6 (4.32)* 6 3.84 6 3.94 4 (4.32)* 6 (3.94)* 4 Complaint Response (3.87)* 4 (4.36)* 3 3.87 4 3.92 5 (4.36)* 3 (3.92)* 5 Flight Safety (4.02)* 1 (4.43)* 1 4.02 1 4.11 2 (4.43)* 1 (4.11)* 2 Flight On-Time (3.78)* 8 (4.34)* 5 3.78 8 3.80 8 (4.34)* 5 (3.80)* 8 Mean 3.85 4.30 3.85 3.90 4.30 3.90
( )*:This indicates significant differences. 4.3 Importance Performance Analysis(IPA) This research applies the IPA diagram, proposed by Martilla and James(1977), to study the Importance and Performance perceptions for the general passengers and these are classified into different groups on the UNI AIR. (1) The IPA Diagram for General Passengers For general passengers on the UNI AIR, Figure 4.1 shows the level of Importance and Performance on those nine service items for overall passengers. Based on the results of IPA, it seems that only the item of Flight On-Time is located in the cell of Concentrate Here, which means that UNI AIR should pay more attention to improve the flight on-time rate. Besides, the items of Cabin Food and Cabin Facility are in the cell of Low Priority, the items of Flight Safety and Seat Reservation are in the cell of Keep Up the Good Work, and the items of
Journal of the Eastern Asia Society for Transportation Studies, Vol. 6, pp. 782 - 797, 2005
789
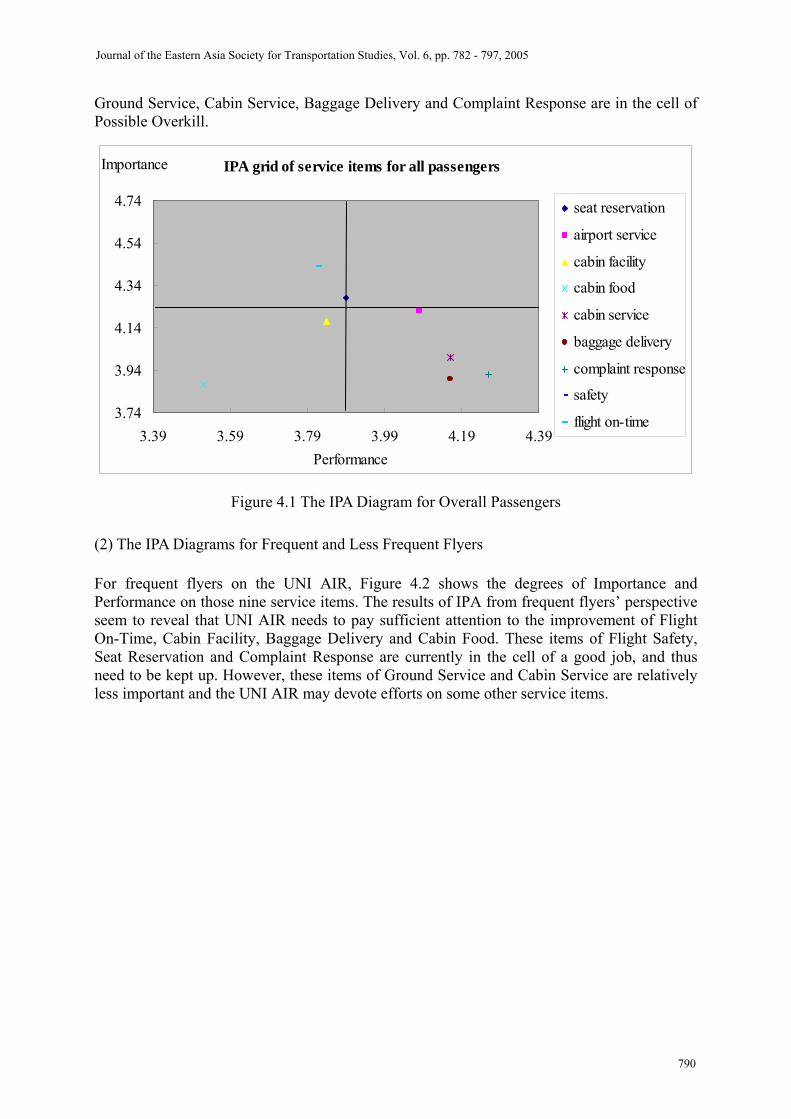
Ground Service, Cabin Service, Baggage Delivery and Complaint Response are in the cell of Possible Overkill.
IPA grid of service items for all passengers
3.74
3.94
4.14
4.34
4.54
4.74
3.39 3.59 3.79 3.99 4.19 4.39Performance
Importance
seat reservation
airport service
cabin facility
cabin food
cabin service
baggage delivery
complaint response
safety
flight on-time
Figure 4.1 The IPA Diagram for Overall Passengers (2) The IPA Diagrams for Frequent and Less Frequent Flyers For frequent flyers on the UNI AIR, Figure 4.2 shows the degrees of Importance and Performance on those nine service items. The results of IPA from frequent flyers’ perspective seem to reveal that UNI AIR needs to pay sufficient attention to the improvement of Flight On-Time, Cabin Facility, Baggage Delivery and Cabin Food. These items of Flight Safety, Seat Reservation and Complaint Response are currently in the cell of a good job, and thus need to be kept up. However, these items of Ground Service and Cabin Service are relatively less important and the UNI AIR may devote efforts on some other service items.
Journal of the Eastern Asia Society for Transportation Studies, Vol. 6, pp. 782 - 797, 2005
790

IPA grid of service items for frequent flyers
3.72
3.92
4.12
4.32
4.52
4.72
3.31 3.51 3.71 3.91 4.11 4.31Performance
Importance
seat reservationairport servicecabin facilitycabin foodcabin servicebaggage deliverycomplaint responsesafetyflight on-time
Figure 4.2 The IPA Diagram for Frequent Flyers
With respect to less frequent flyers on UNI AIR, Figure 4.3 shows the degrees of Importance and Performance on these nine service items. From the perspective of less-frequent flyers, the result of IPA indicate that UNI AIR needs to pay more attention to the improvement of Flight On-Time, Seat Reservation, Cabin Facility, and Cabin Food in order to attract more such passengers. Currently, these items of Flight Safety and Complaint Response are in the cell of a good job and need to be kept up. However, these items of Ground Service, Baggage Delivery and Cabin Service are in the Cell of Possible Overkill. It means that UNI AIR may consider reallocating the efforts on these items to others.
IPA grid of service items for less frequent flyers
3.76
3.96
4.16
4.36
4.56
4.76
3.46 3.66 3.86 4.06 4.26 4.46Performance
Importance
seat reservationairport servicecabin facilitycabin foodcabin servicebaggage deliverycomplaint responsesafetyflight on-time
Figure 4.3 The IPA Diagram for Less Frequent Flyers
Journal of the Eastern Asia Society for Transportation Studies, Vol. 6, pp. 782 - 797, 2005
791

(3) The IPA Diagrams for Male and Female Passengers For male passengers on UNI AIR, Figure 4.4 illustrates their levels of Importance and Performance on these nine service items. From the perspective of male passengers, the results of IPA suggest that UNI AIR shall pay more attention to upgrade the quality on Flight On-Time, Seat Reservation, Cabin Food, and Cabin Facility. These items of Flight Safety, and Complaint Response are currently in the cell of a good job and need to be kept up. However, those items of Baggage Delivery, Ground Service, and Cabin Service are relatively less important and UNI AIR may consider to divert the current level of efforts on these items to other essential tasks.
IPA grid of service items for male passengers
3.72
3.92
4.12
4.32
4.52
4.72
3.42 3.62 3.82 4.02 4.22 4.42Performance
Importance
seat reservationairport servicecabin facilitycabin foodcabin servicebaggage deliverycomplaint responsesafetyflight on-time
Figure 4.4 The IPA Diagram for Male Passengers
Figure 4.5 shows the degrees of Importance and Performance on these nine service items from female passengers’ perspective. Similarly, the results of IPA reflect that UNI AIR’s efforts on the enhancing Flight On-Time, Cabin Facility, and Cabin Food have been well appreciated. These items of Flight Safety and Complaint Response are currently in the level of a good job, and need to be kept up. However, these items of Seat Reservation, Baggage Delivery, Ground Service, and Cabin Service are relatively less important, and UNI AIR may consider reallocating her efforts to other items.
Journal of the Eastern Asia Society for Transportation Studies, Vol. 6, pp. 782 - 797, 2005
792

IPA grid of service items for female passengers
3.78
3.98
4.18
4.38
4.58
4.78
3.34 3.54 3.74 3.94 4.14 4.34
Performance
Importance
seat reservationairport servicecabin facilitycabin foodcabin servicebaggage deliverycomplaint responsesafetyflight on-time
Figure 4.5 The IPA Diagram for Female Passengers (4) The IPA Diagrams for Different Trip Purposes Passengers For the group of Business passengers on UNI AIR, Figure 4.6 shows the degrees of Importance and Performance on these nine service items. The analysis results reflect that UNI AIR deserves to pay more attention to the enhancement of Flight On-Time, Cabin Food, Baggage Delivery and Cabin Facility. These items of Flight Safety, Seat Reservation, and Complaint Response are currently in the level of a good job, and need to be kept up. However, these items of Ground Service and Cabin Service are relatively less important, and UNI AIR may consider reallocating her efforts to other items.
IPA grid of service items for business purpose passengers
3.73
3.93
4.13
4.33
4.53
4.73
3.35 3.55 3.75 3.95 4.15 4.35Performance
Importance
seat reservationairport servicecabin facilitycabin foodcabin servicebaggage deliverycomplaint responsesafetyflight on-time
Figure 4.6 The IPA Diagram for Business Trip Purpose Passengers
Journal of the Eastern Asia Society for Transportation Studies, Vol. 6, pp. 782 - 797, 2005
793

For the group of vacation passengers on UNI AIR, Figure 4.7 shows the degrees of Importance and Performance on these nine service items. The analysis results reflect that UNI AIR deserves to pay more attention to the enhancement of Seat Reservation, Cabin Food, and Cabin Facility. These items of Flight On-Time, Baggage Delivery, and Safety are currently in the level of a good job, and need to be kept up. However, these items of Cabin Service and Ground Service are relatively less important, and UNI AIR may consider reallocating her efforts to other items.
IPA grid of service items for travel purpose passengers
3.92
4.12
4.32
4.52
4.72
4.92
3.8 4 4.2 4.4 4.6 4.8
Performance
Importance
seat reservationairport servicecabin facilitycabin foodcabin servicebaggage deliverycomplaint responsesafetyflight on-time
Figure 4.7 The IPA Diagram for Vacation Trip Purpose Passengers For the group of visiting/home passengers on UNI AIR, Figure 4.8 shows the degrees of Importance and Performance on these nine service items. The analysis results reflect that UNI AIR deserves to pay more attention to the enhancement of Flight On-Time, Seat Reservation, Cabin Food, and Cabin Facility. These service items of Flight Safety and Complaint Response are currently in the level of a good job, and need to be kept up. However, these items of Baggage Delivery, Ground Service and Cabin Service are relatively less important, and UNI AIR may consider reallocating her efforts to other service items.
Journal of the Eastern Asia Society for Transportation Studies, Vol. 6, pp. 782 - 797, 2005
794

IPA grid of service items for visiting/home purpose passengers
3.82
4.02
4.22
4.42
4.62
4.82
3.4 3.6 3.8 4 4.2 4.4Performance
Importance
seat reservationairport servicecabin facilitycabin foodcabin servicebaggage deliverycomplaint responsesafetyflight on-time
Figure 4.8 The IPA Diagram for Visiting/Home Trip Purpose Passengers 5.CONCLUSIONS AND RECOMMENDATIONS This paper has presented an evaluation method for understanding air passengers’ care and satisfaction with respect to some critical service items. The proposed method has also been applied in analysis of the UNI AIR passengers with a comprehensive survey. Recommendations based on the survey results are summarized below in the Table 5.1.
Table 5.1 The Service Improvement Strategy Matrix for UNI AIR Item Passengers in
total Frequent
passengersInfrequent passengers
Male passengers
Female passengers
Business passengers
Vacation passengers
Visiting/HomePassengers
Seat Reservation ○ ○ V V ※ ○ V V Ground Service ※ ※ ※ ※ ※ ※ ※ ※ Cabin Facility △ △ △ △ △ △ △ △ Cabin Food △ △ △ △ △ △ △ △ Cabin Service ※ ※ ※ ※ ※ ※ ※ ※ Baggage Delivery ※ △ ※ ※ ※ △ ○ ※ Complaint Response ※ ○ ○ ○ ○ ○ ※ ○ Flight Safety ○ ○ ○ ○ ○ ○ ○ ○ Flight On-Time V V V V V V ○ V V:Located in the Cell II of “Concentrate Here”. △:Located in the Cell III of “Low Priority”. ※:Located in the Cell IV of “Possible Overkill”. ○: Located in the Cell I of “Keep Up the Good Work”.
It is well recognized that Flight On-Time is the most important service item deserves the priority improvement. However, comparing with other groups, vacation purpose passengers do not seem to care so much about the Flight On-Time performance, and
Journal of the Eastern Asia Society for Transportation Studies, Vol. 6, pp. 782 - 797, 2005
795

have a high relative tolerance of the possible flight delay.
Passengers in the category of Less Frequent Flyers, Male, Visiting/Home Trip purposes are generally more concerned about the service of Seat Reservation. It implies that this type of passengers may have strong tendency to use the Seat Reservation System now available on the internet and phone services. However, it should be noted that this type of passengers is in general not familiar with the whole thing. Therefore, the system design of seat reservation must be as easy and user-friendly as possible.
Service items such as Cabin Facility and Cabin Food may not be as critical as the Flight
On-Time, but are still important items cared by most of the passengers in their selections of airlines. It is interesting to know that among all types of passengers those for business care more about the service of Baggage Delivery even on domestic flights. Compared to other trip purposes, the values of baggage carried by those business passengers are relatively high; so are the resulting costs of their potential delay.
The survey result indicates that most passengers have less complaints on Ground and
Cabin Services. It does not mean the service items are not important, as most of such services may have reached an acceptable target level. In other words, airlines cannot make much more improvements on these regards, even they are willing to put more efforts. Similar conclusion can also be made with respect to Baggage Delivery and Complaint Response based on the survey results.
Most passengers agree that currently airlines have done a good job on Flight Safety and
such a quality performance should be maintained. It is the foremost item that can not be traded off with others for any reason.
In summary, through the Importance-Performance Analysis, the survey and analysis results conclude that UNI AIR should try to keep her services on schedule and maintain good record on Flight Safety. Besides, developing a convenient seat reservation system and listening carefully to passenger’s opinion are also important directions for UNI AIR to work on. The study has conducted detailed analyses on the perceptions of passengers on the nine selected service items. Some insightful recommendations have been proposed, based on the comparisons between different groups of passengers. In other words, IPA method has been successfully applied in the UNI AIR market analysis to assist UNI AIR’s managers in developing airline service improvement strategies in response to passenger needs. Future extensions of this study may include: How to extend current study findings to the construction of new strategies for market segmentation; and to explore the potentials of transferring the study findings to other airlines in target market.
REFERENCE Chu, Y.C. (1995) The Study of Departure Passengers Whose Conceptual Gaps on the Quality of Airlines Traffic Service. Master Thesis, Chinese Culture University. Chen, K.R. and Liu, Y.C. (2002) The study of domestic airline service quality promotion, Journal of quality, 44-54.
Journal of the Eastern Asia Society for Transportation Studies, Vol. 6, pp. 782 - 797, 2005
796

Engel, James F., Kollat, David and Blackwell, Roger D. (1982) Consumer Behavior, 4th ed.. Hwa-Tai Co.. Enger, F. J., Blackwell, R.D., and Miniard, P.W. (1995) Consumer behavior. New York: Dryden Press. Garvin, D. A. (1983), Quality on the Line. Harvard Business Review, 61(September-October), 65-73. Jin, L.L. (1998), The Empirical Study on Domestic Passengers' Choice Behavior of The Airlines. PH. D. Dissertation, National Cheng Kung University. Keating, P. (1997) The Best Airlines to Fly Today, Money, Vol.26, 118-128. Levitt, Theodore, (1972), Production-Line Approach to Service. Harvard Business Review, 50(September-October), 41-52. Lin, S.C. (1996), The Research of Service Quality of Domestic Airlines. Master Thesis, National Taiwan University. Lee, C.C. (2002), The Research of Air Transportation Service Quality of Remote Islands In Taiwan, Master Thesis, National Taipei University. Martilla J.A. and J.C. James (1977) Importance-Performance Analysis, Journal of Marketing, Vol. 41, 77-79. Mitra, A. (1993), Fundamentals of Quality Control and Improvement. Macmillan, NY. Parasuraman, A., V.A. Zeithaml, and L.L.Berry (1985) A Conceptual Model of Service Quality and Its Implications for Future Research, Journal of Marketing, Vol 49 Fall, 41-50. Proussaloglou, K. and Koppelman, F. (1995) Air carrier demand-An analysis of market share determinants, Transportation, Vol. 22, 371-388 Sasser, W. E., Olsen, R. P. and Wyckoff, D. D. (1978) Management of Service Operation: Test and Casea, Ally and Bacon Inc. Boston. Sethna, B. N. (1982) Extensions and testing of Importance-Performance Analysis, Business Economic, September, 28-31. Su, Tom (1996) The Comparison Study of The Service Quality Measurement Methods, PH. D. Dissertation, National Sun Yat-Sen University. Woodside, A G., Frey, L. and Daly, R.T. (1989) Linking Service Quality, Customer Satisfaction, and Behavioral Intention, Journal of Care Marketing, 5-17.
Journal of the Eastern Asia Society for Transportation Studies, Vol. 6, pp. 782 - 797, 2005
797