analyzing probabilistic graphs michalis potamias
TRANSCRIPT

Analyzing Probabilistic Graphs
Michalis Potamias
2
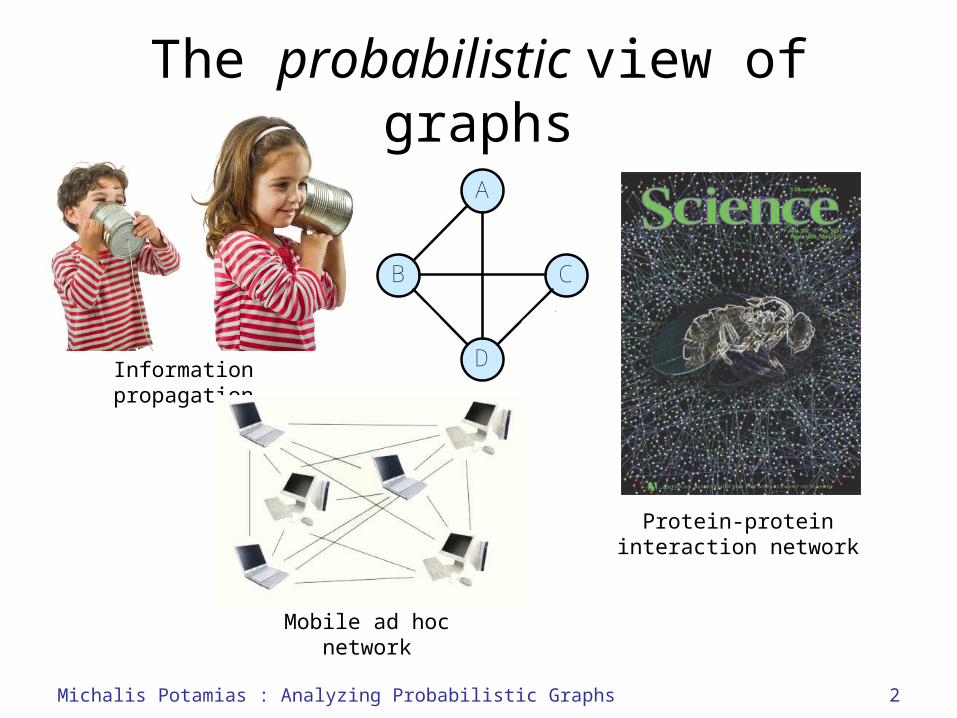
Information propagation
The probabilistic view of graphs
Protein-protein interaction network
Mobile ad hoc network
A
B C
D
0.2
0.4
0.6
0.3 0.7
Michalis Potamias : Analyzing Probabilistic Graphs
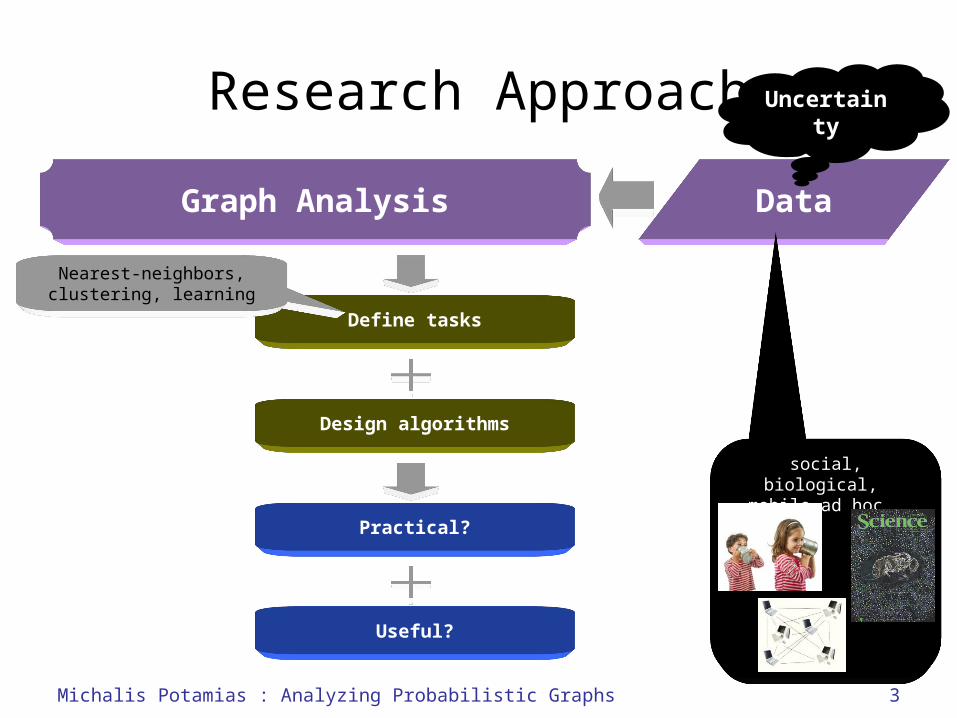
Research Approach
Graph Analysis
Define tasks
Useful?
Practical?
Design algorithms
Nearest-neighbors, clustering, learning
Data
social, biological, mobile ad hoc …
Uncertainty
3Michalis Potamias : Analyzing Probabilistic Graphs
4
Outline
• Distance and k-nearest neighbors– Distance definition– Sampling– kNN Pruning– Predicting known relationships from PPI networks
• Clustering– Edit distance and cluster graphs– Clustering probabilistic graphs
• Learning in information propagation– The problem– Anecdotes
• Ongoing and Future work– Information propagation– Random walks– Daily deals
Michalis Potamias : Analyzing Probabilistic Graphs
5
Outline
• Distance and k-nearest neighbors– Distance definition– Sampling– kNN Pruning– Predicting known relationships from PPI networks
• Clustering– Edit distance and cluster graphs– Clustering probabilistic graphs
• Learning in information propagation– The problem– Anecdotes
• Ongoing and Future work– Information propagation– Random walks– Daily deals
Michalis Potamias : Analyzing Probabilistic Graphs
6
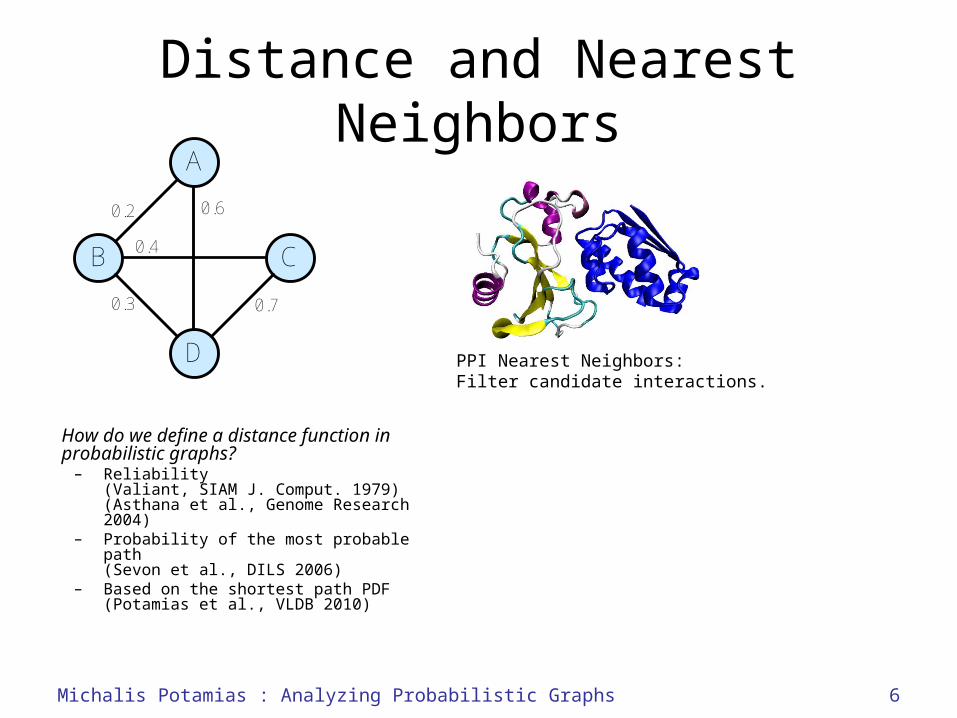
Distance and Nearest Neighbors
How do we define a distance function in probabilistic graphs?
– Reliability(Valiant, SIAM J. Comput. 1979) (Asthana et al., Genome Research 2004)
– Probability of the most probable path (Sevon et al., DILS 2006)
– Based on the shortest path PDF(Potamias et al., VLDB 2010)
A
B C
D
0.2
0.4
0.6
0.3 0.7
PPI Nearest Neighbors: Filter candidate interactions.
Michalis Potamias : Analyzing Probabilistic Graphs
7
A
B C
D
0.2
0.4
0.6
0.3 0.7
A
B C
D
A
B C
D
A
B C
D
A
B C
D
A
B C
D
A
B C
D
A
B C
D
A
B C
D
A
B C
D
A
B C
D
A
B C
D
A
B C
D
A
B C
D
A
B C
D
A
B C
D
A
B C
D
A
B C
D
A
B C
D
A
B C
D
A
B C
D
A
B C
D
A
B C
D
A
B C
D
A
B C
D
A
B C
D
A
B C
D
A
B C
D
A
B C
D
A
B C
D
A
B C
D
A
B C
D
A
B C
D
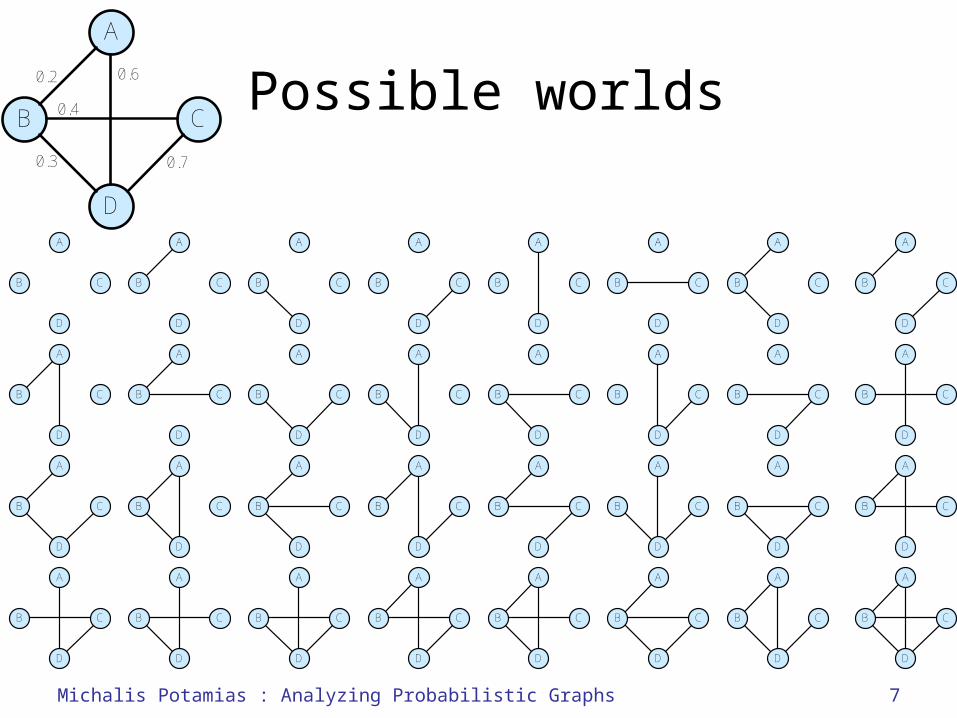
Possible worlds
Michalis Potamias : Analyzing Probabilistic Graphs

1 2 infshortest path distance (B,D)
8
Distance Functions based on the PDF
a world wA
B C
D
0.2
0.4
0.6
0.3 0.7
A
B C
D
.3.26
.44
(Frank, OR 1969)
Compute the PDF of the shortest path distance between B and D
•Find the shortest path distance between B and D in each world
)),(1))(,(1))(,(1(),(),(
)Pr(
DApDCpCBpDBpBAp
w
the graph
Michalis Potamias : Analyzing Probabilistic Graphs
1 2 infshortest path distance (B,D)
9
Distance Functions based on the PDF
A
B C
D
0.2
0.4
0.6
0.3 0.7
.3.26
.44
the graph• A distance function is a scalar.• Use the Shortest Path PDF:
– Expected Infinity problem
– Median– Mode (majority)– ExpectedReliable
• Hard (Valiant, SIAM J. Comput. 1979)
46.1
inf
2
exp
maj
med
d
d
d
Michalis Potamias : Analyzing Probabilistic Graphs
10
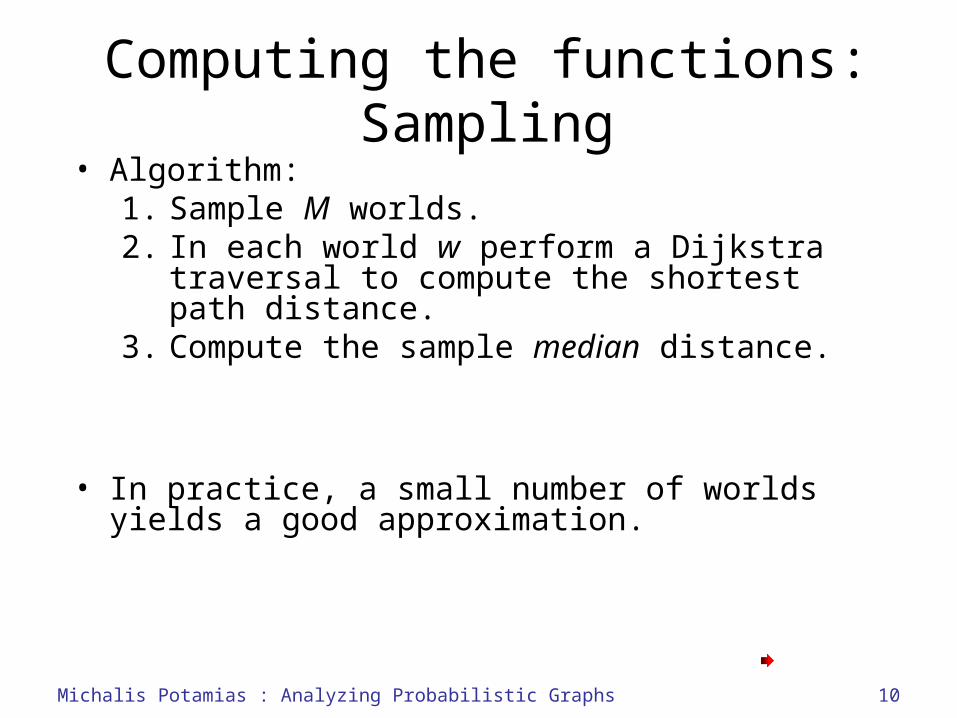
Computing the functions: Sampling
• Algorithm:1. Sample M worlds.2. In each world w perform a Dijkstra
traversal to compute the shortest path distance.
3. Compute the sample median distance.
• In practice, a small number of worlds yields a good approximation.
Michalis Potamias : Analyzing Probabilistic Graphs

12
K-Nearest Neighbor Query
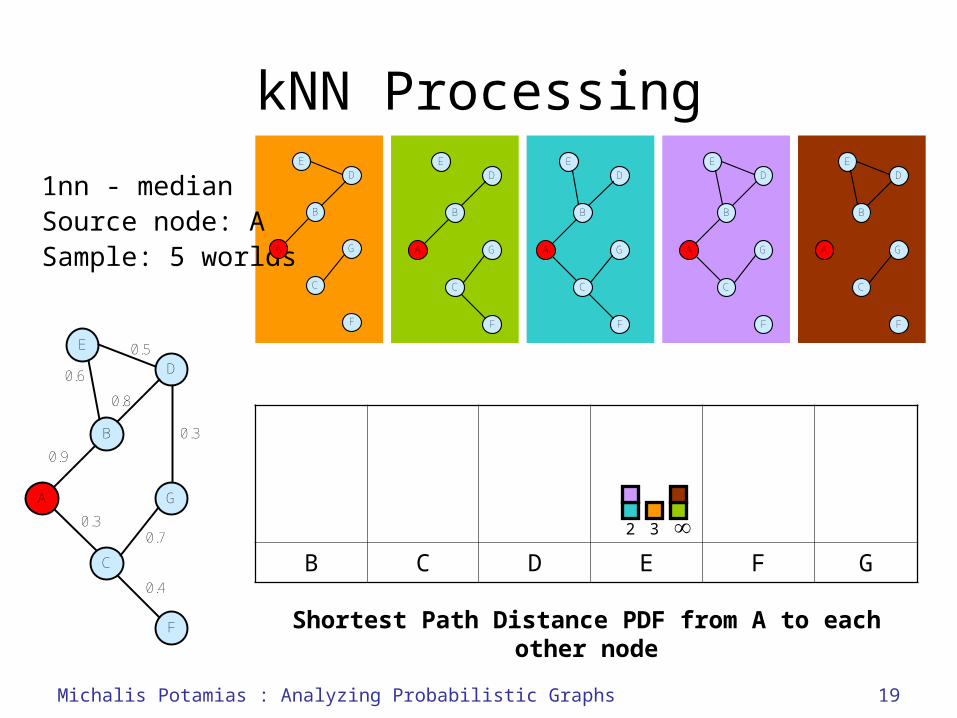
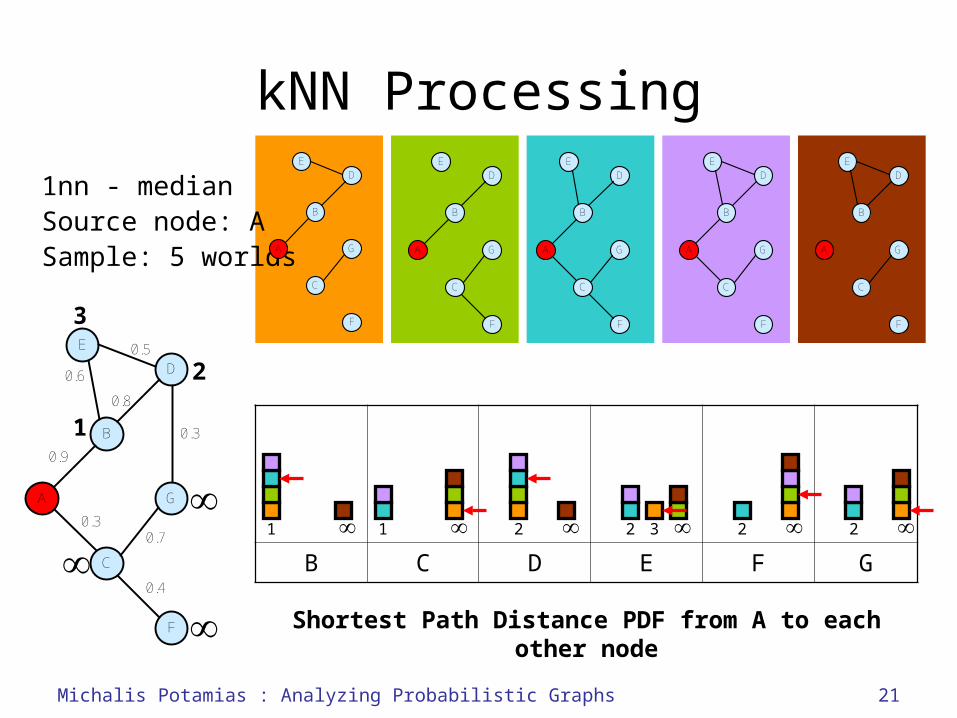
• kNN query example:Given a probabilistic PPI, and a source protein find the set of k proteins closest to the source.
• Algorithm:– Sample M worlds.– In each world perform a Dijkstra traversal.– Approximate the median shortest path
distance of the source to all nodes in the graph.
– Process the kNN query.
Michalis Potamias : Analyzing Probabilistic Graphs

13
kNN Processing
1nn - medianSource node: ASample: 5 worlds
E
B
G
D
0.9
A
C
F
0.3
0.4
0.6
0.8
0.5
0.3
0.7
Michalis Potamias : Analyzing Probabilistic Graphs
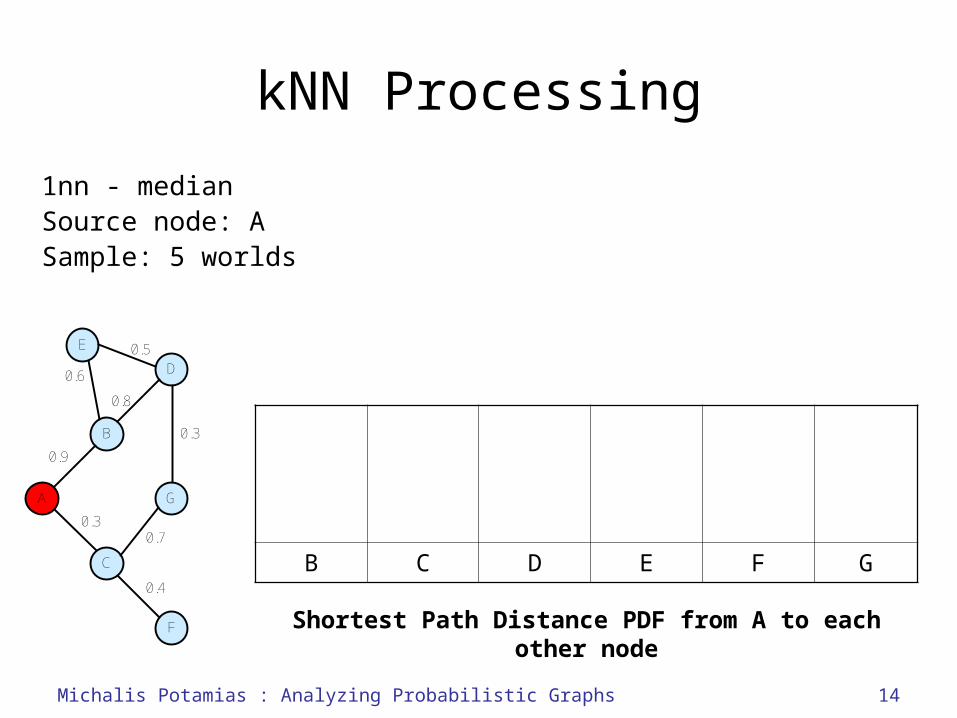
14
kNN Processing
1nn - medianSource node: ASample: 5 worlds
E
B
G
D
0.9
A
C
F
0.3
0.4
0.6
0.8
0.5
0.3
0.7
B C D E F G
Shortest Path Distance PDF from A to each other node
Michalis Potamias : Analyzing Probabilistic Graphs
15
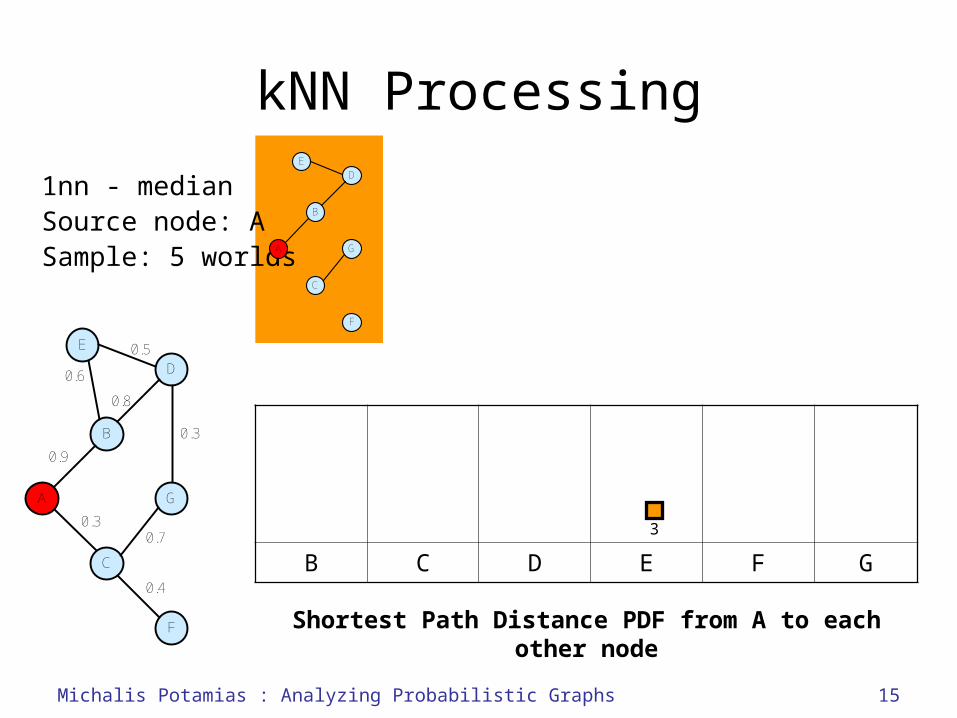
kNN Processing
1nn - medianSource node: ASample: 5 worlds
E
B
G
D
0.9
A
C
F
0.3
0.4
0.6
0.8
0.5
0.3
0.7
E
B
G
D
A
C
F
B C D E F G
3
Shortest Path Distance PDF from A to each other node
Michalis Potamias : Analyzing Probabilistic Graphs
16
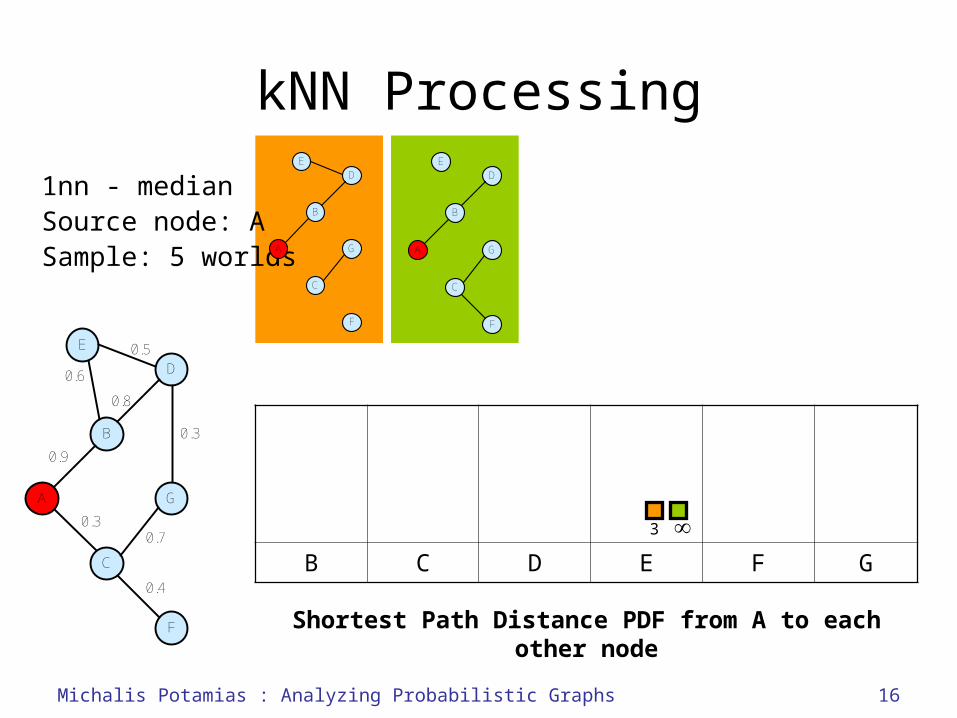
kNN Processing
1nn - medianSource node: ASample: 5 worlds
E
B
G
D
0.9
A
C
F
0.3
0.4
0.6
0.8
0.5
0.3
0.7
E
B
G
D
A
C
F
E
B
G
D
A
C
F
B C D E F G
3
Shortest Path Distance PDF from A to each other node
Michalis Potamias : Analyzing Probabilistic Graphs

17
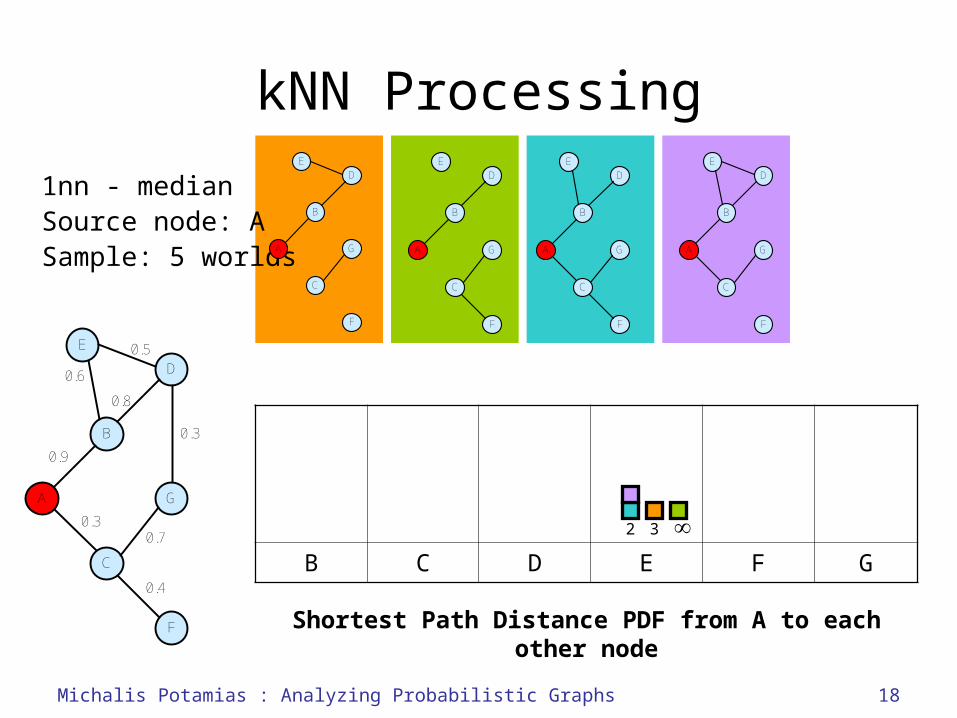
kNN Processing
1nn - medianSource node: ASample: 5 worlds
E
B
G
D
A
C
F
E
B
G
D
0.9
A
C
F
0.3
0.4
0.6
0.8
0.5
0.3
0.7
E
B
G
D
A
C
F
E
B
G
D
A
C
F
B C D E F G
32
Shortest Path Distance PDF from A to each other node
Michalis Potamias : Analyzing Probabilistic Graphs
18
kNN Processing
1nn - medianSource node: ASample: 5 worlds
E
B
G
D
A
C
F
E
B
G
D
0.9
A
C
F
0.3
0.4
0.6
0.8
0.5
0.3
0.7
E
B
G
D
A
C
F
E
B
G
D
A
C
F
E
B
G
D
A
C
F
B C D E F G
32
Shortest Path Distance PDF from A to each other node
Michalis Potamias : Analyzing Probabilistic Graphs
19
kNN Processing
1nn - medianSource node: ASample: 5 worlds
E
B
G
D
A
C
F
E
B
G
D
0.9
A
C
F
0.3
0.4
0.6
0.8
0.5
0.3
0.7
E
B
G
D
A
C
F
E
B
G
D
A
C
F
E
B
G
D
A
C
F
E
B
G
D
A
C
F
B C D E F G
32
Shortest Path Distance PDF from A to each other node
Michalis Potamias : Analyzing Probabilistic Graphs

20
kNN Processing
1nn - medianSource node: ASample: 5 worlds
E
B
G
D
A
C
F
E
B
G
D
0.9
A
C
F
0.3
0.4
0.6
0.8
0.5
0.3
0.7
E
B
G
D
A
C
F
E
B
G
D
A
C
F
E
B
G
D
A
C
F
E
B
G
D
A
C
F
B C D E F G
32
3
Shortest Path Distance PDF from A to each other node
Michalis Potamias : Analyzing Probabilistic Graphs
21
kNN Processing
1nn - medianSource node: ASample: 5 worlds
E
B
G
D
A
C
F
E
B
G
D
0.9
A
C
F
0.3
0.4
0.6
0.8
0.5
0.3
0.7
E
B
G
D
A
C
F
E
B
G
D
A
C
F
E
B
G
D
A
C
F
E
B
G
D
A
C
F
1
B C D E F G
2 3 21 2 2
1
2
3
Shortest Path Distance PDF from A to each other node
Michalis Potamias : Analyzing Probabilistic Graphs

22
kNN Processing
1nn - medianSource node: ASample: 5 worlds
E
B
G
D
A
C
F
E
B
G
D
0.9
A
C
F
0.3
0.4
0.6
0.8
0.5
0.3
0.7
E
B
G
D
A
C
F
E
B
G
D
A
C
F
E
B
G
D
A
C
F
E
B
G
D
A
C
F
1
B C D E F G
2 3 21 2 2
1
2
3
Shortest Path Distance PDF from A to each other node
Michalis Potamias : Analyzing Probabilistic Graphs

23
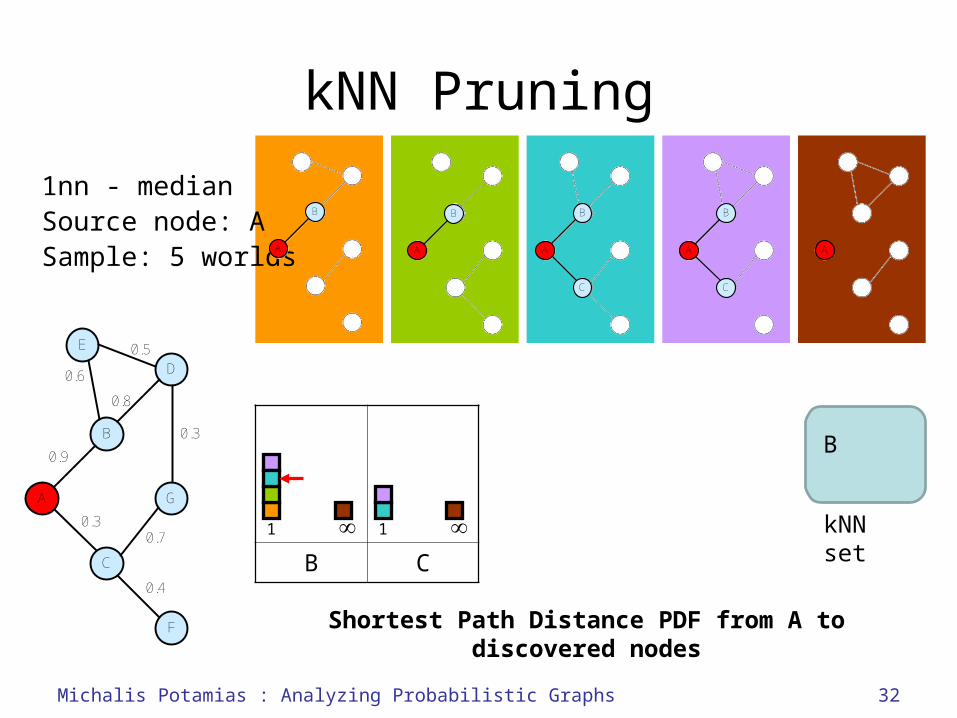
kNN Pruning
1nn - medianSource node: ASample: 5 worlds
E
B
G
D
0.9
A
C
F
0.3
0.4
0.6
0.8
0.5
0.3
0.7
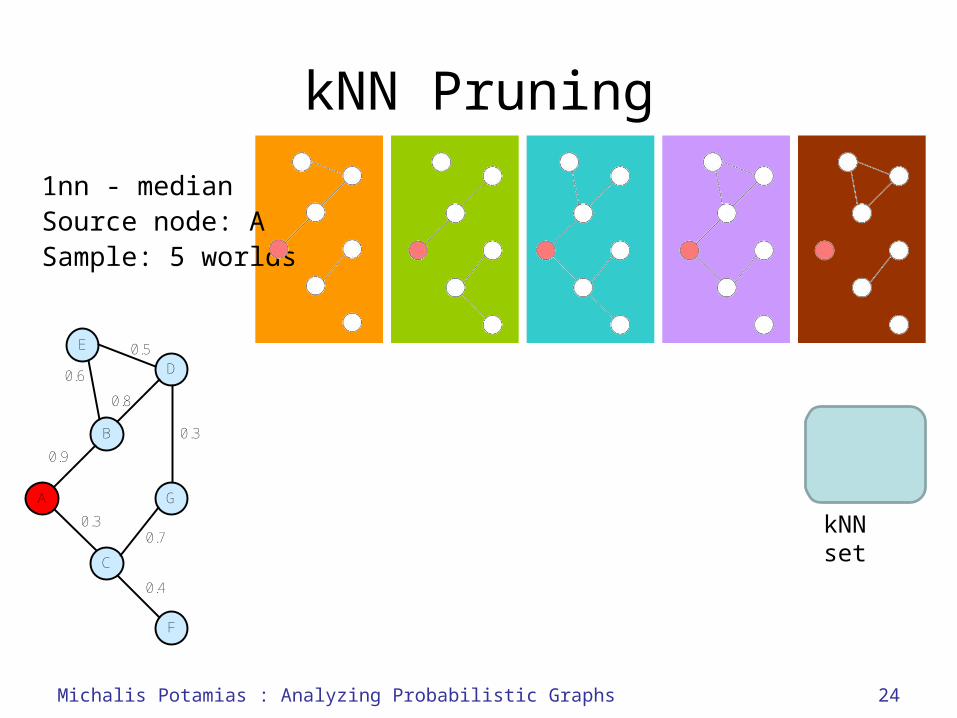
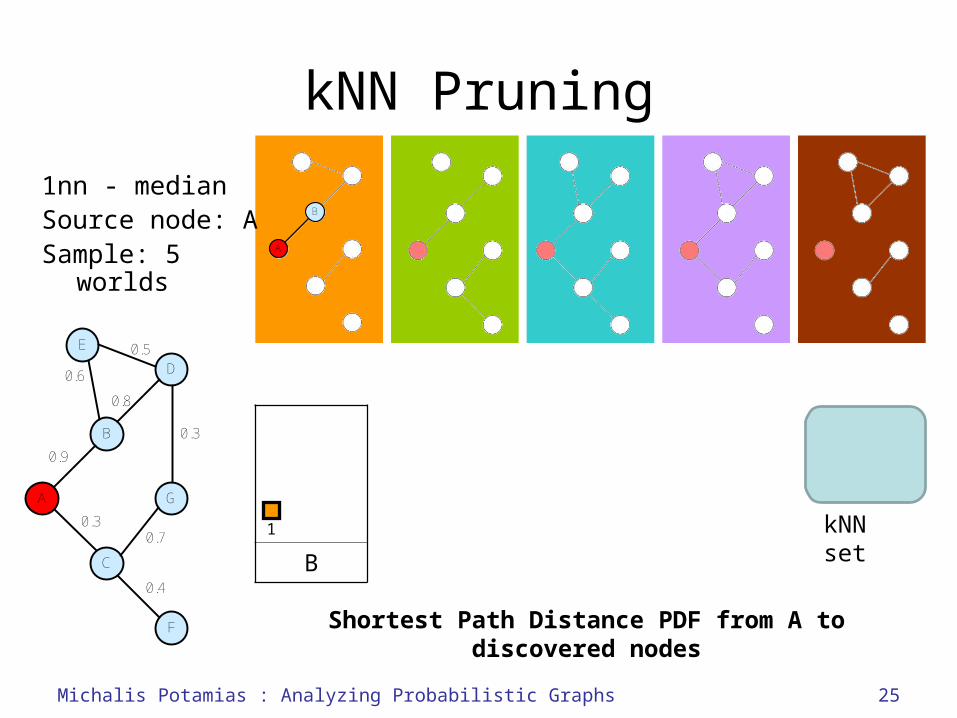
• The pruning algorithm:– Idea: Increase the horizon of each dijkstra one hop at
a time and maintain truncated PDFs.
– Node insertion to kNN set: Once its median distance is found.
– Termination condition: kNN set has size equal to k.
Michalis Potamias : Analyzing Probabilistic Graphs
24
kNN Pruning
1nn - medianSource node: ASample: 5 worlds
E
B
G
D
0.9
A
C
F
0.3
0.4
0.6
0.8
0.5
0.3
0.7kNN set
Michalis Potamias : Analyzing Probabilistic Graphs
25
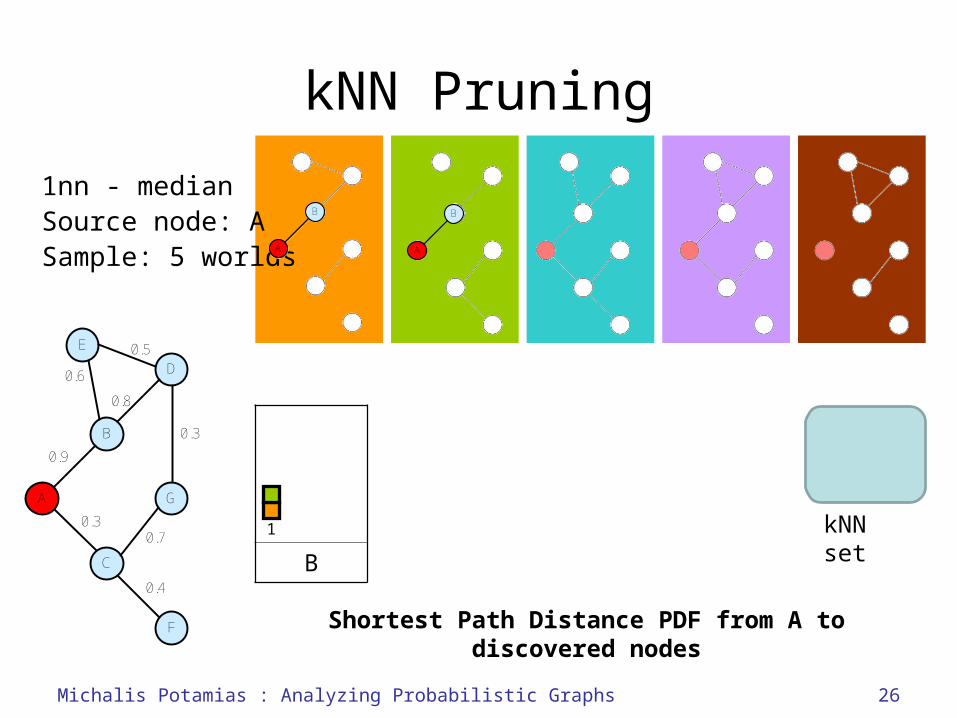
kNN Pruning
1nn - medianSource node: ASample: 5
worlds
E
B
G
D
0.9
A
C
F
0.3
0.4
0.6
0.8
0.5
0.3
0.71
B
B
A
Shortest Path Distance PDF from A to discovered nodes
kNN set
Michalis Potamias : Analyzing Probabilistic Graphs
26
kNN Pruning
1nn - medianSource node: ASample: 5 worlds
E
B
G
D
0.9
A
C
F
0.3
0.4
0.6
0.8
0.5
0.3
0.71
B
B
A
B
A
Shortest Path Distance PDF from A to discovered nodes
kNN set
Michalis Potamias : Analyzing Probabilistic Graphs

27
kNN Pruning
1nn - medianSource node: ASample: 5 worlds
E
B
G
D
0.9
A
C
F
0.3
0.4
0.6
0.8
0.5
0.3
0.7
B
A
B
A
B
A
C
Shortest Path Distance PDF from A to discovered nodes
kNN set
1
B
Michalis Potamias : Analyzing Probabilistic Graphs
28
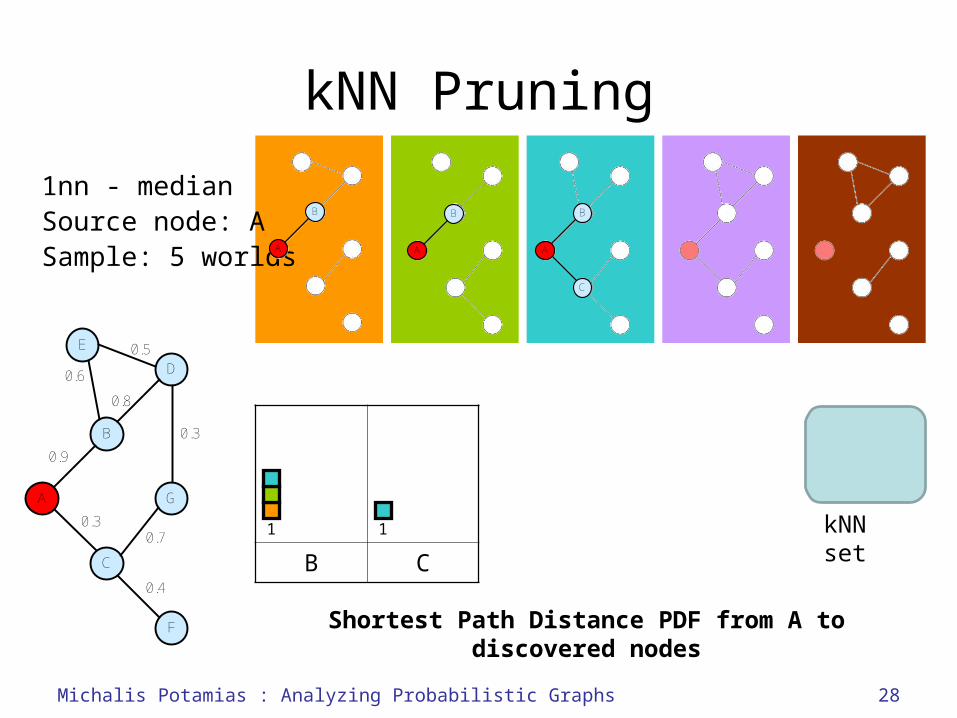
kNN Pruning
1nn - medianSource node: ASample: 5 worlds
E
B
G
D
0.9
A
C
F
0.3
0.4
0.6
0.8
0.5
0.3
0.71
B C
B
A
B
A
B
A
C
1
Shortest Path Distance PDF from A to discovered nodes
kNN set
Michalis Potamias : Analyzing Probabilistic Graphs
29
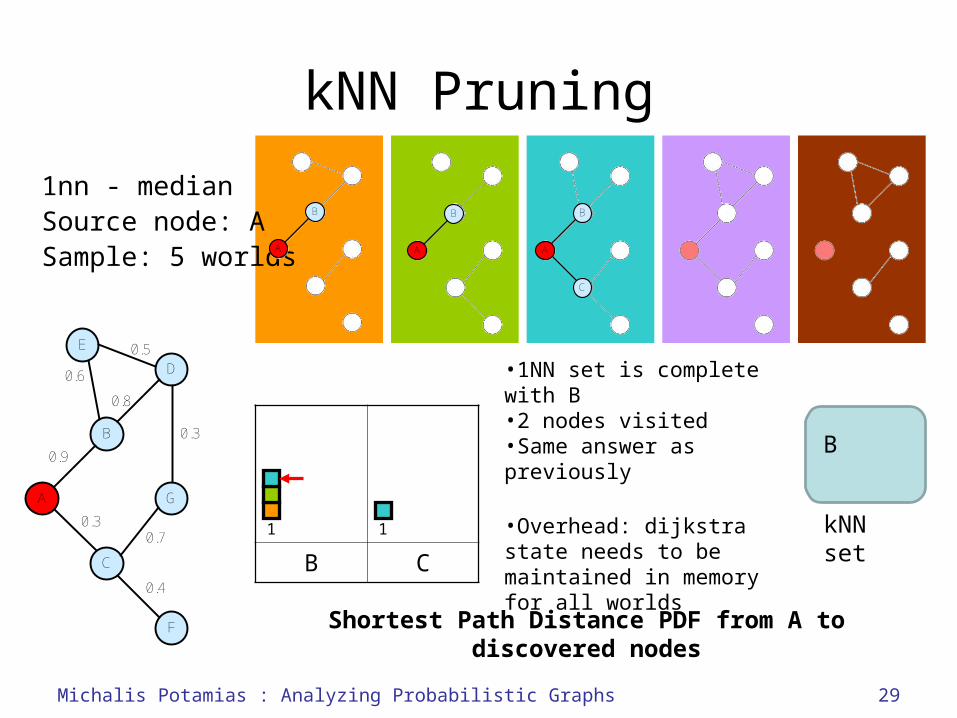
kNN Pruning
1nn - medianSource node: ASample: 5 worlds
E
B
G
D
0.9
A
C
F
0.3
0.4
0.6
0.8
0.5
0.3
0.71
B C
B
A
B
A
B
A
C
1
Shortest Path Distance PDF from A to discovered nodes
kNN set
B
•1NN set is complete with B•2 nodes visited•Same answer as previously
•Overhead: dijkstra state needs to be maintained in memory for all worlds
Michalis Potamias : Analyzing Probabilistic Graphs

30
kNN Pruning
1nn - medianSource node: ASample: 5 worlds
E
B
G
D
0.9
A
C
F
0.3
0.4
0.6
0.8
0.5
0.3
0.71
B C
B
A
B
A
B
A
C
1
1
Shortest Path Distance PDF from A to discovered nodes
kNN set
B
Michalis Potamias : Analyzing Probabilistic Graphs
31
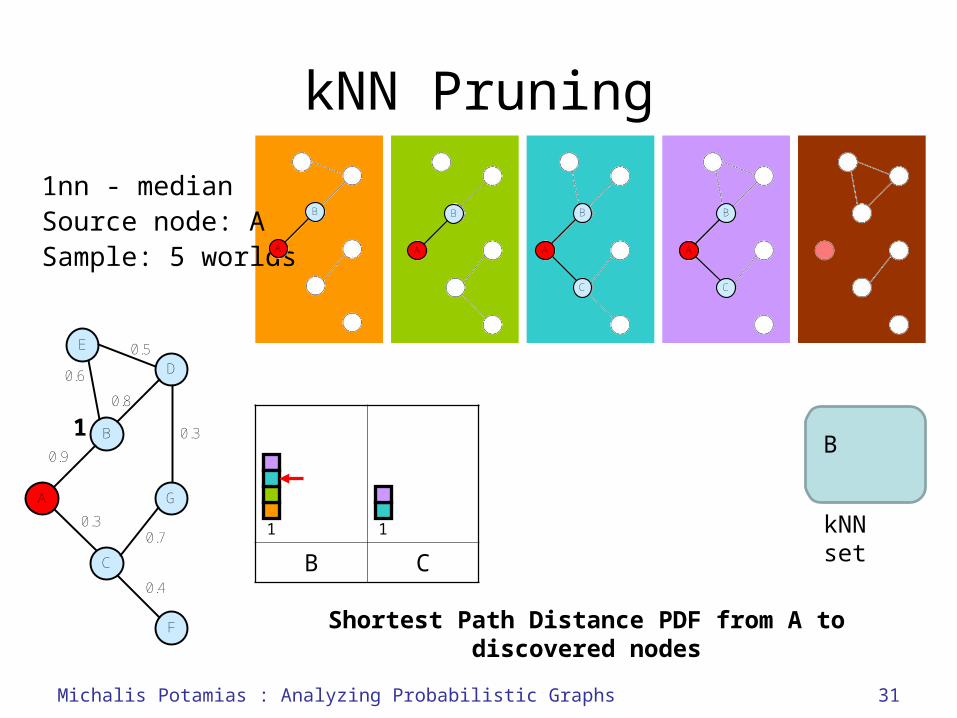
kNN Pruning
1nn - medianSource node: ASample: 5 worlds
E
B
G
D
0.9
A
C
F
0.3
0.4
0.6
0.8
0.5
0.3
0.7
B
A
B
A
B
A
C
B
A
C
1
B C
1
1
Shortest Path Distance PDF from A to discovered nodes
kNN set
B
Michalis Potamias : Analyzing Probabilistic Graphs
32
kNN Pruning
1nn - medianSource node: ASample: 5 worlds
E
B
G
D
0.9
A
C
F
0.3
0.4
0.6
0.8
0.5
0.3
0.7
B
A
B
A
B
A
C
B
A
C
A
1
B C
1
Shortest Path Distance PDF from A to discovered nodes
kNN set
B
Michalis Potamias : Analyzing Probabilistic Graphs

33
kNN Pruning
BIOMINEDatabase of biological entities and uncertain interactions fromUHelsinki1M nodes, 10M edges
FLICKRUsers from flickr.com. Edges have been created assuming homophily based on jaccard of flickr groups77K nodes, 20M edges
DBLPAuthors from dblp. Probabilities have been assigned based on number of coauthored papers226K nodes, 1.4M edges
5NN query with a sample of 200 worlds.Speedups: 247x (BIOMINE), 111x (FLICKR), 269x (DBLP)
Michalis Potamias : Analyzing Probabilistic Graphs
v v
Practical?
40
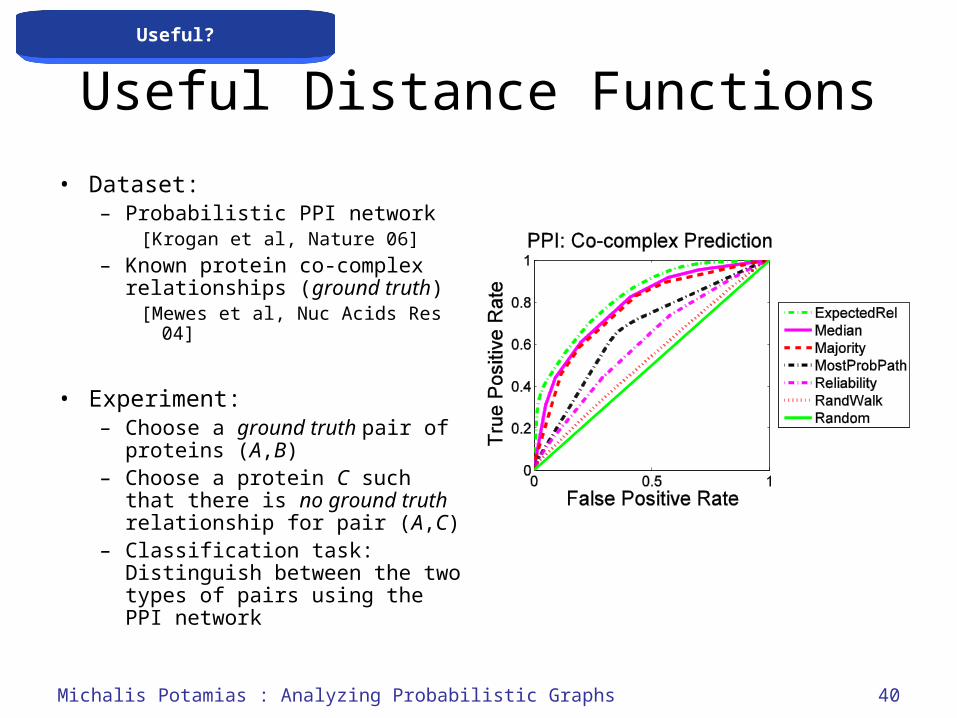
Useful Distance Functions
• Dataset:– Probabilistic PPI network
[Krogan et al, Nature 06]– Known protein co-complex
relationships (ground truth)[Mewes et al, Nuc Acids Res 04]
• Experiment:– Choose a ground truth pair of
proteins (A,B)– Choose a protein C such that
there is no ground truth relationship for pair (A,C)
– Classification task: Distinguish between the two types of pairs using the PPI network
Michalis Potamias : Analyzing Probabilistic Graphs
Useful?

45
Outline
• Distance and k-nearest neighbors– Distance definition– Sampling– kNN Pruning– Predicting known relationships from PPI networks
• Clustering– Edit distance and cluster graphs– Clustering probabilistic graphs
• Learning in information propagation– The problem– Anecdotes
• Ongoing and Future work– Information propagation– Random walks– Daily deals
Michalis Potamias : Analyzing Probabilistic Graphs
46
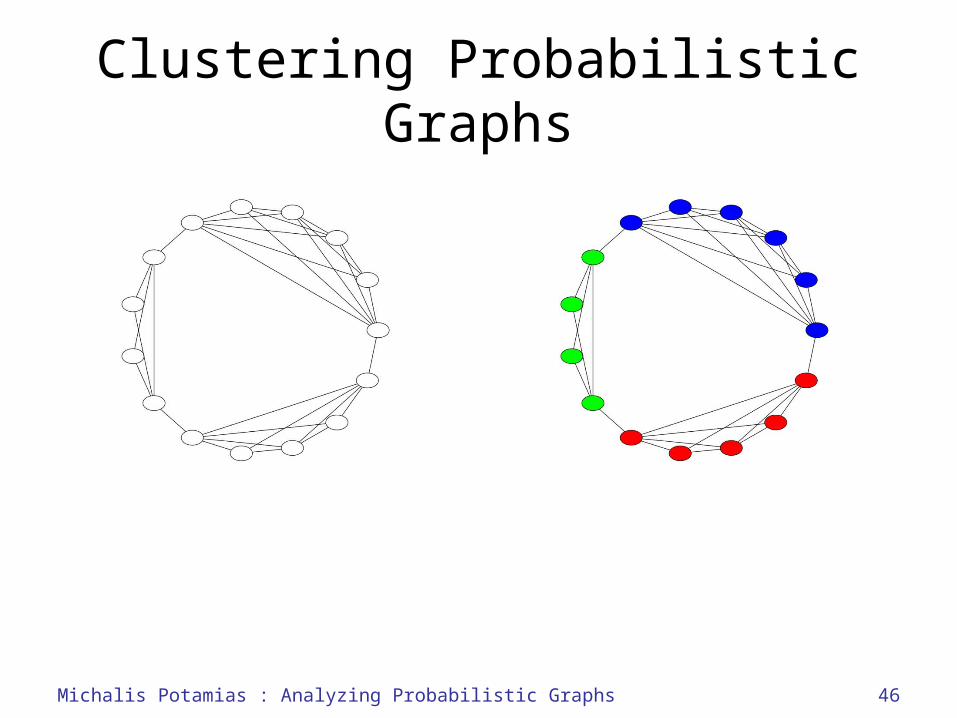
Clustering Probabilistic Graphs
Michalis Potamias : Analyzing Probabilistic Graphs
47
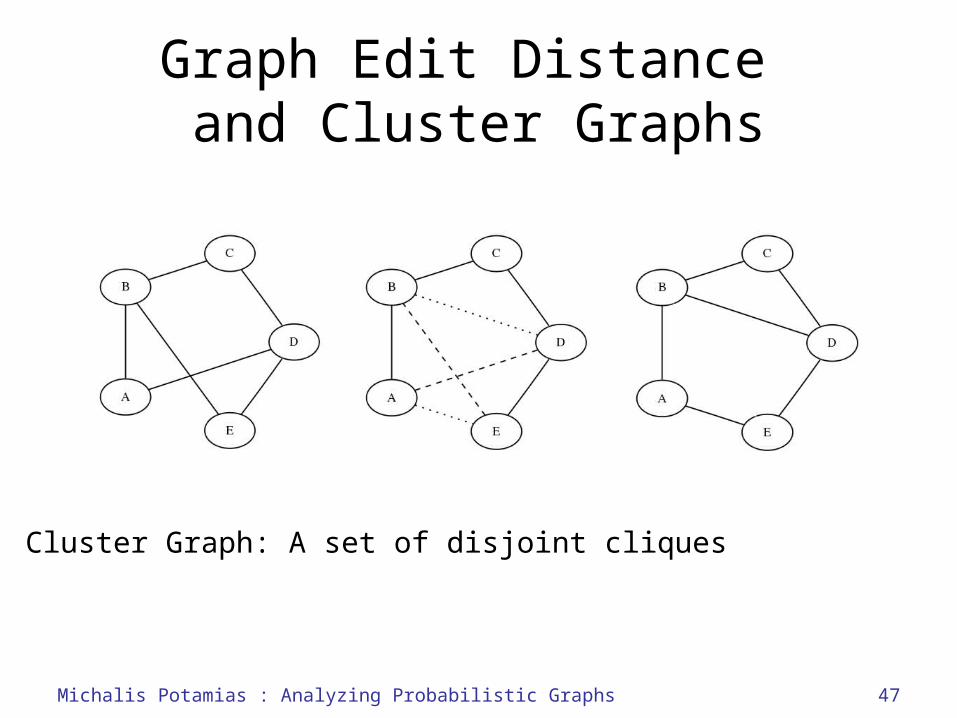
Graph Edit Distance and Cluster Graphs
Cluster Graph: A set of disjoint cliques
Michalis Potamias : Analyzing Probabilistic Graphs
48
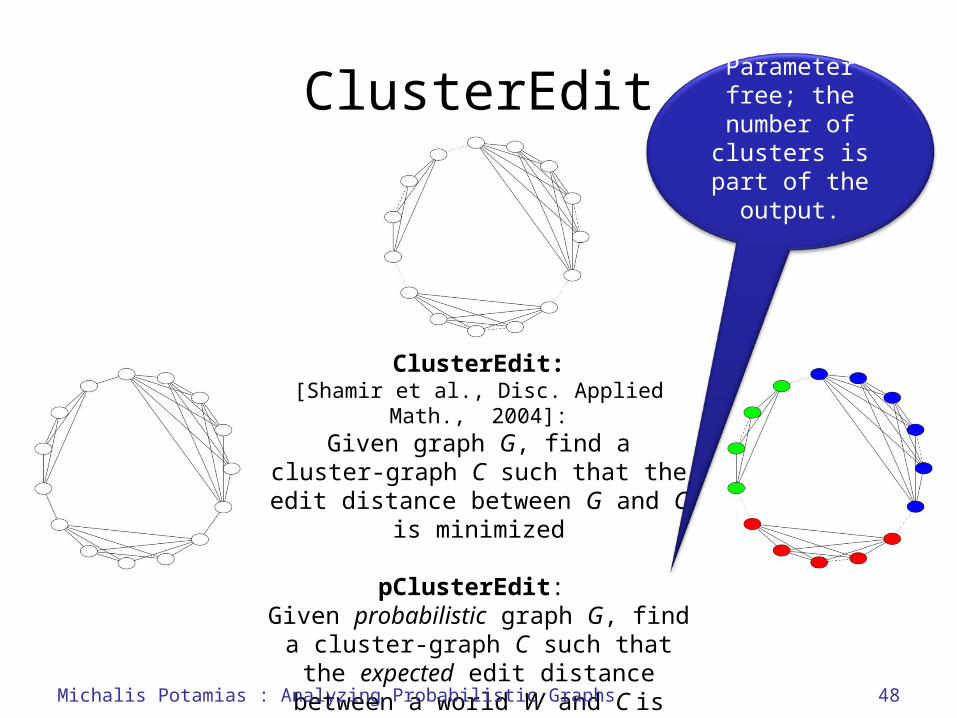
ClusterEdit
ClusterEdit:[Shamir et al., Disc. Applied Math.,
2004]:Given graph G, find a cluster-graph
C such that the edit distance between G and C is minimized
pClusterEdit: Given probabilistic graph G, find a
cluster-graph C such that the expected edit distance between a
world W and C is minimizedMichalis Potamias : Analyzing Probabilistic Graphs
Parameter free; the
number of clusters is part of the output.
49
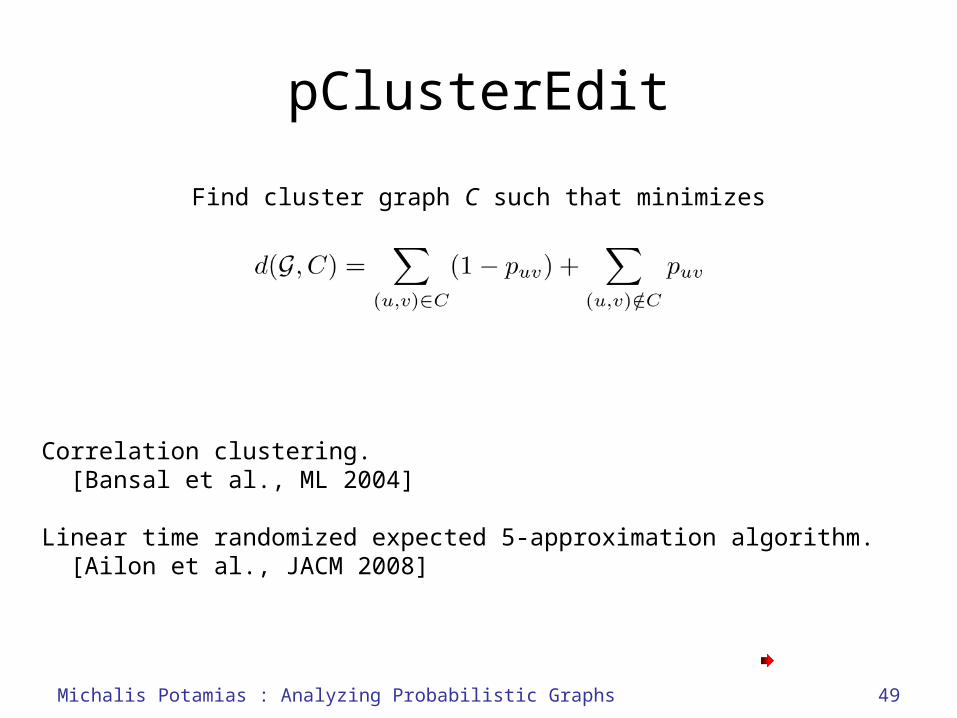
pClusterEdit
Correlation clustering. [Bansal et al., ML 2004]
Linear time randomized expected 5-approximation algorithm. [Ailon et al., JACM 2008]
Michalis Potamias : Analyzing Probabilistic Graphs
Find cluster graph C such that minimizes

63
Work on Probabilistic Graphs
•Most Probable Path [Sevon et al., DILS 2006]•Reliable Subgraphs
[Hintsanen and Toivonen, ECML/PKDD 2008]•Nearest Neighbors
[Potamias et al., VLDB 2010]•Frequent Subgraphs
[Zou et al., KDD 2010]•Top-k Maximal Cliques
[Zou et al., ICDE 2010]•Clustering
[Potamias et al., ongoing work]
Michalis Potamias : Analyzing Probabilistic Graphs
64
Probabilistic Graphs Roadmap
• Distance and k-nearest neighbors– Distance definition– Sampling– kNN Pruning– Predicting known relationships from PPI networks
• Clustering– Edit distance and cluster graphs– Clustering probabilistic graphs
• Learning in information propagation– The problem– Anecdotes
• Ongoing and Future work– Information propagation– Random walks– Daily deals
Michalis Potamias : Analyzing Probabilistic Graphs
65
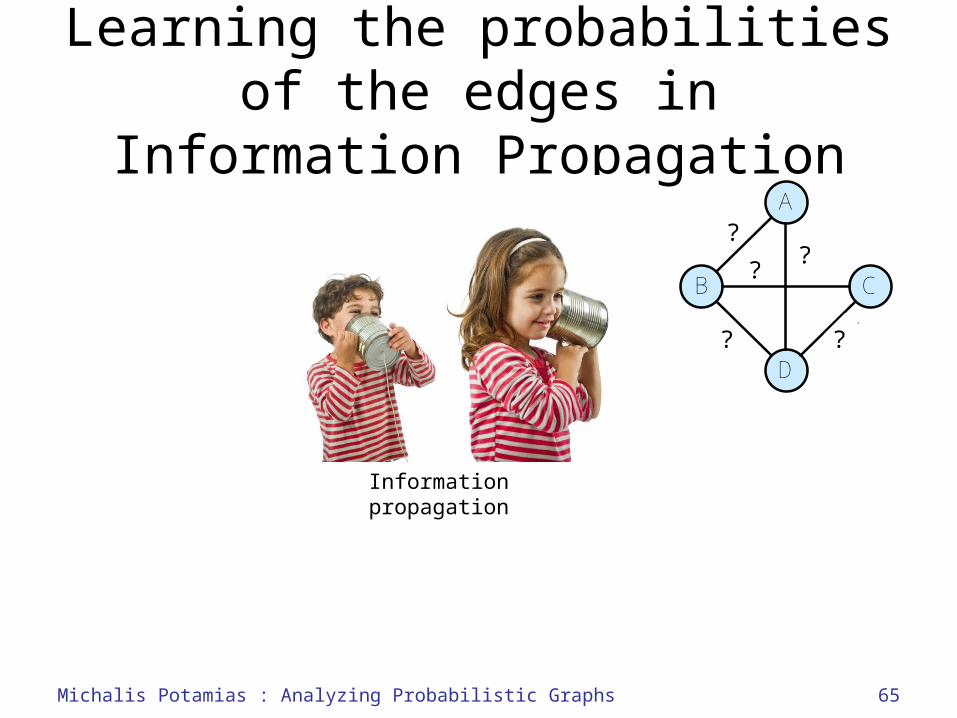
Learning the probabilities of the edges in Information
Propagation
Information propagation
A
B C
D
0.2
0.4
0.6
0.3 0.7
?
? ?
??
Michalis Potamias : Analyzing Probabilistic Graphs

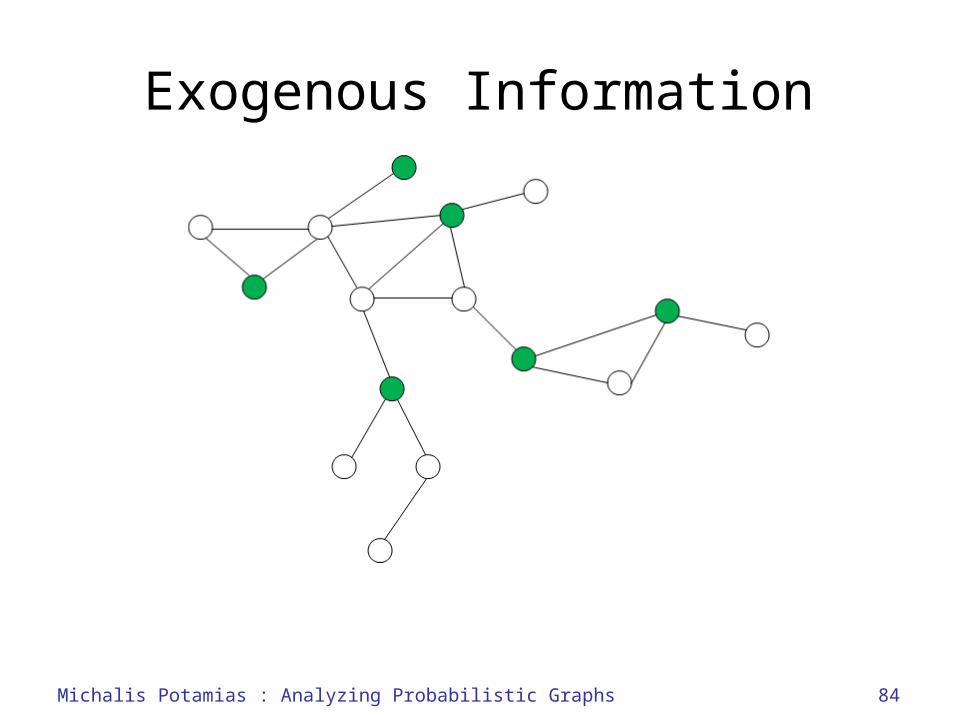
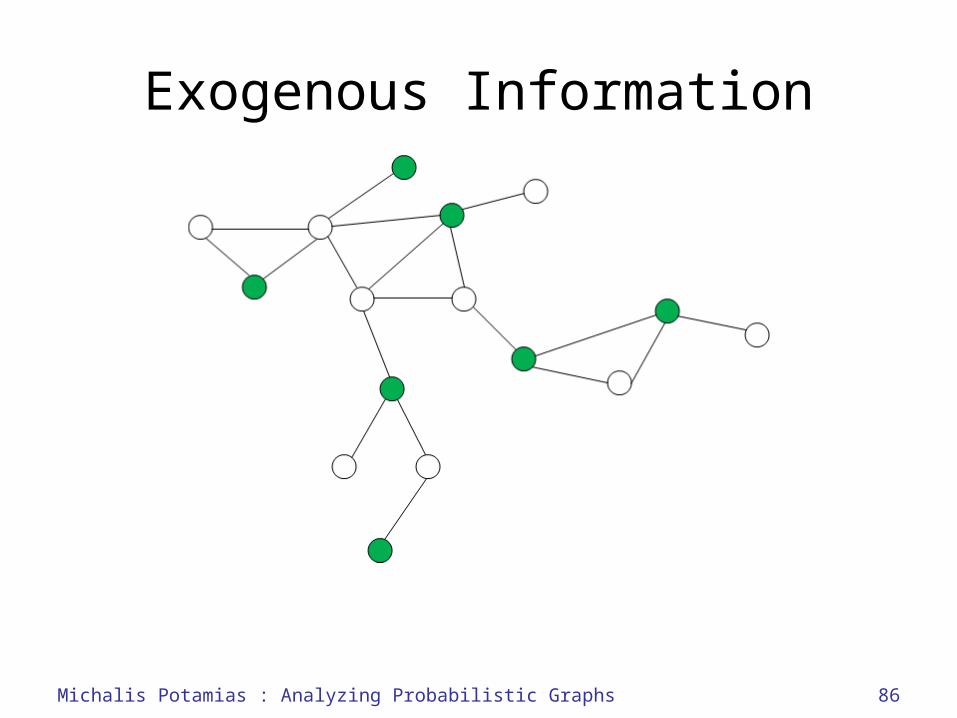
The Problem
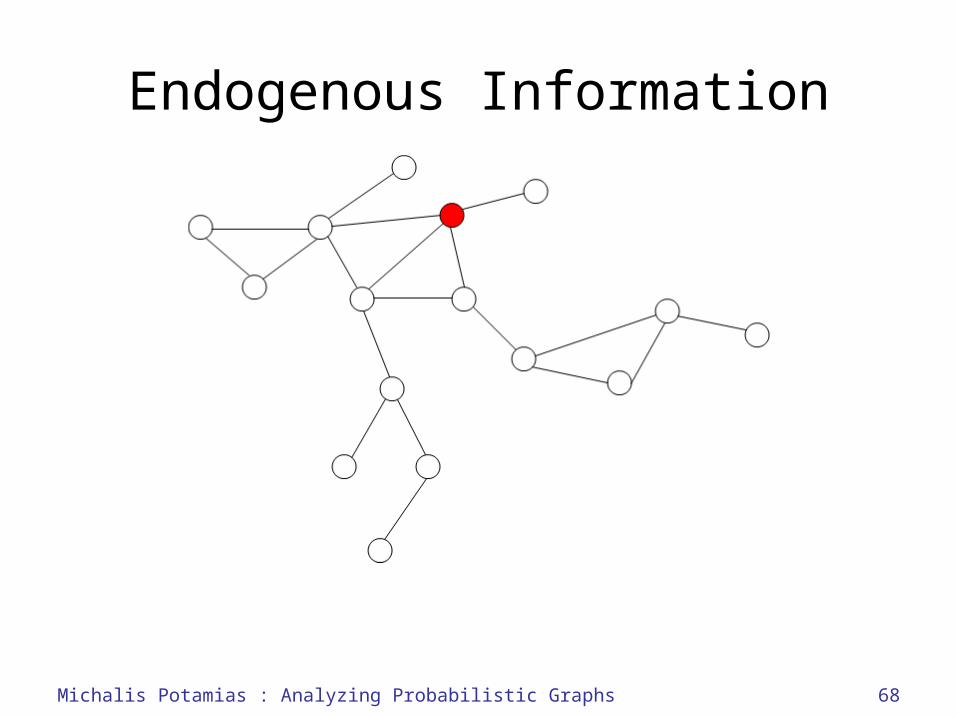
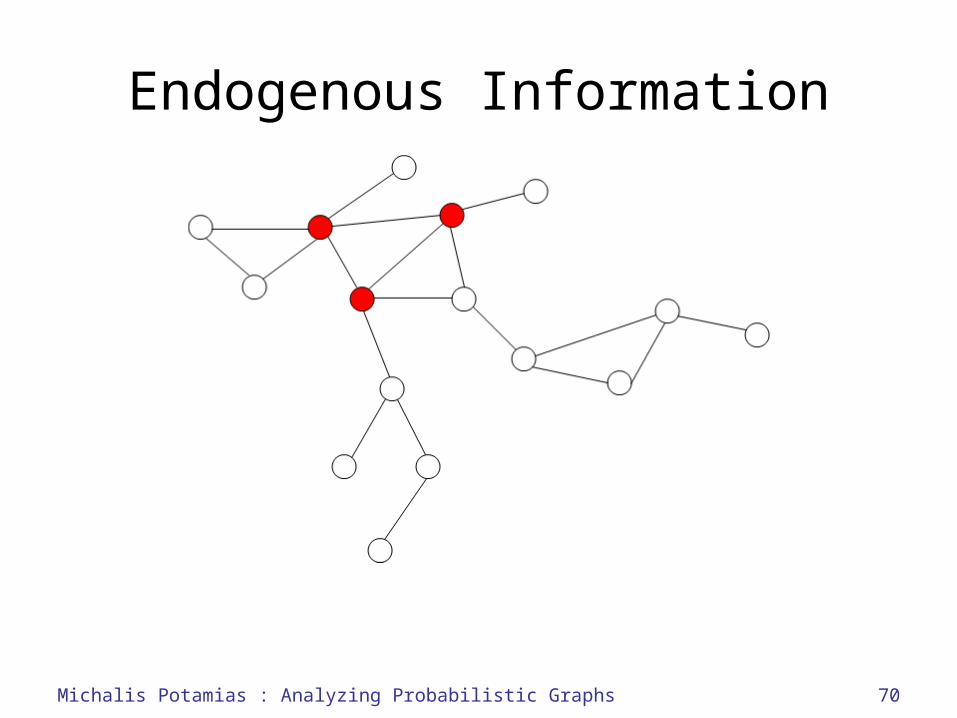
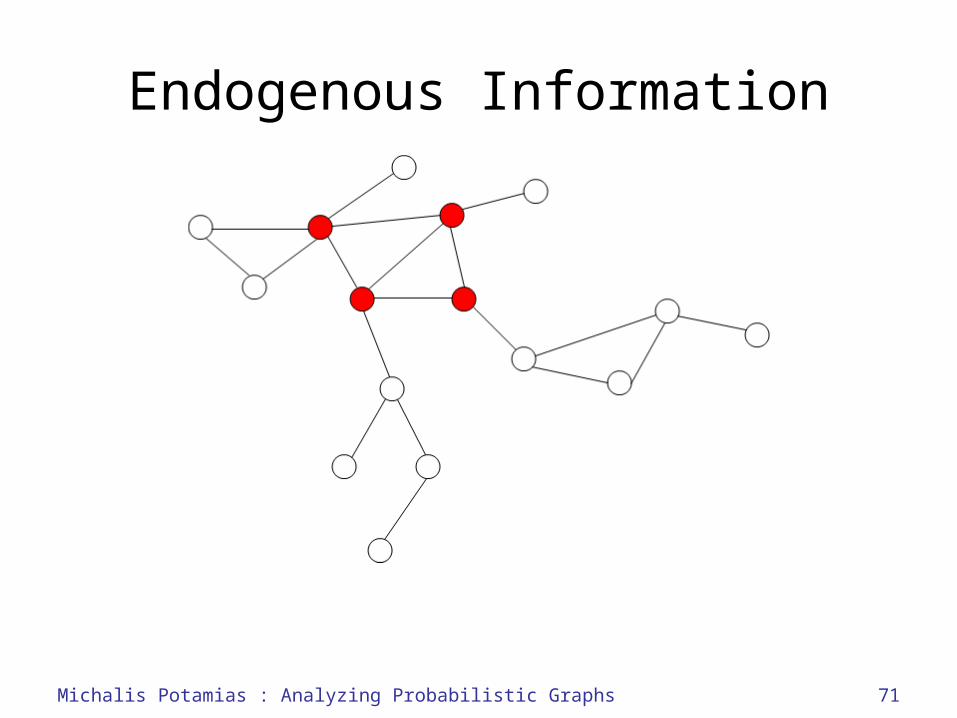
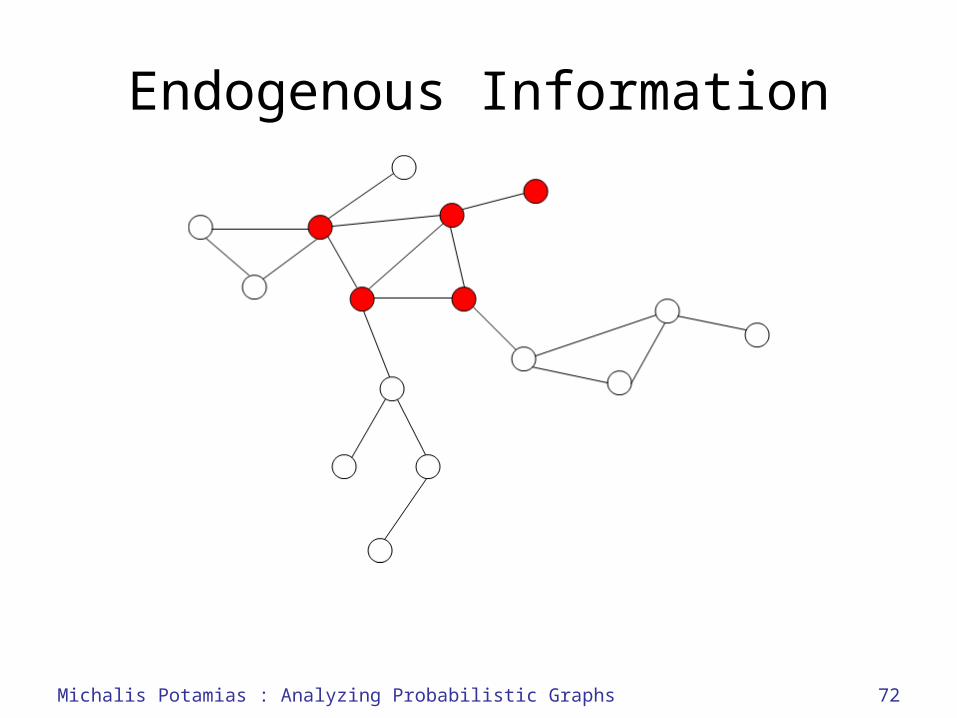
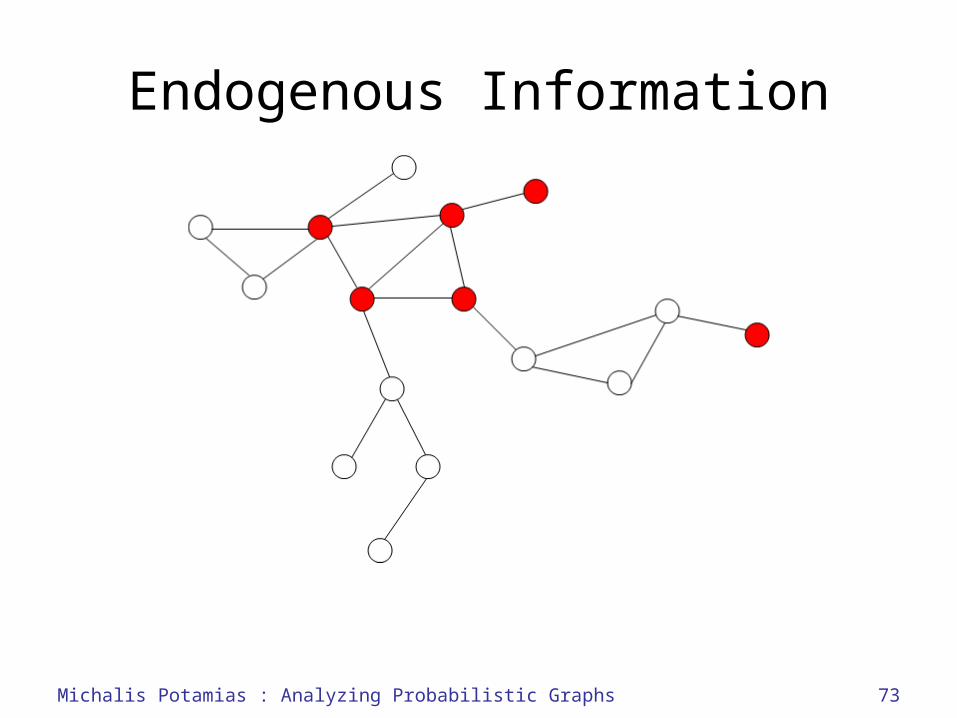
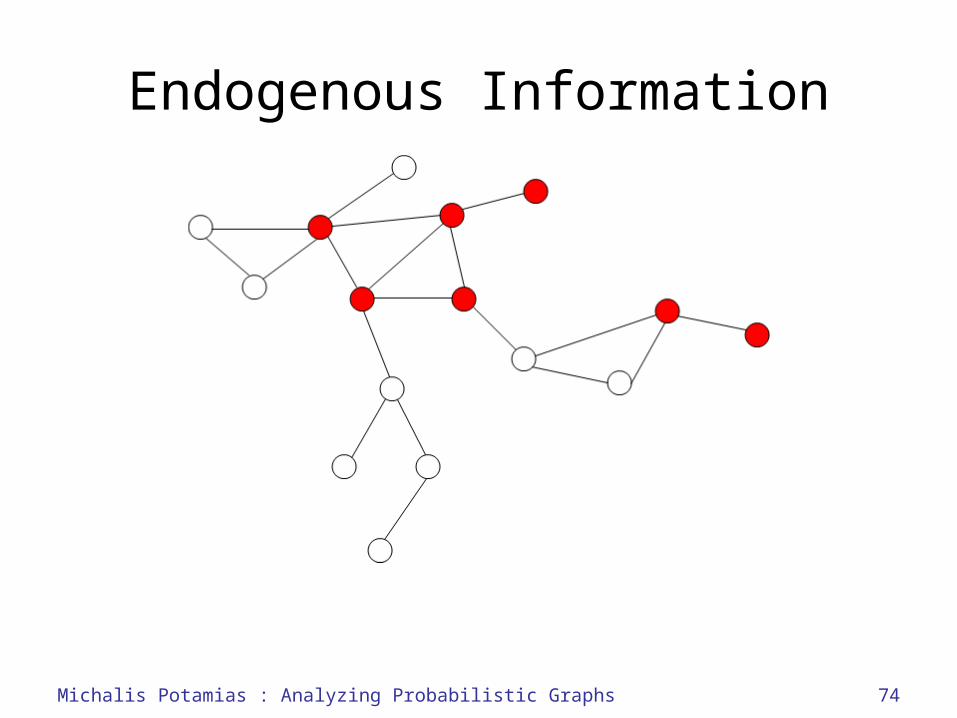
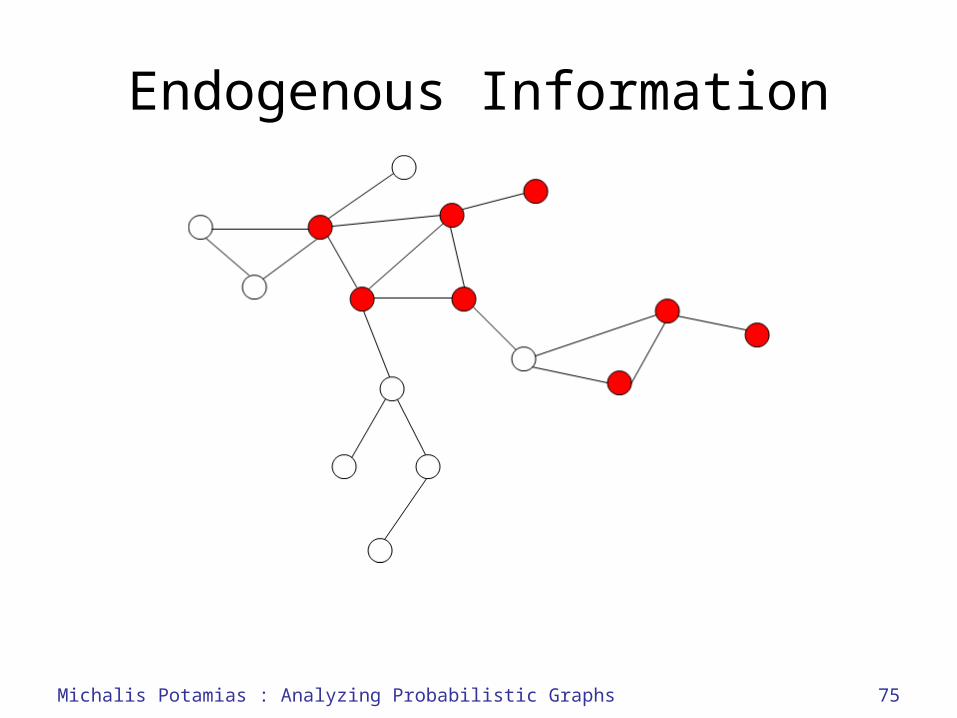
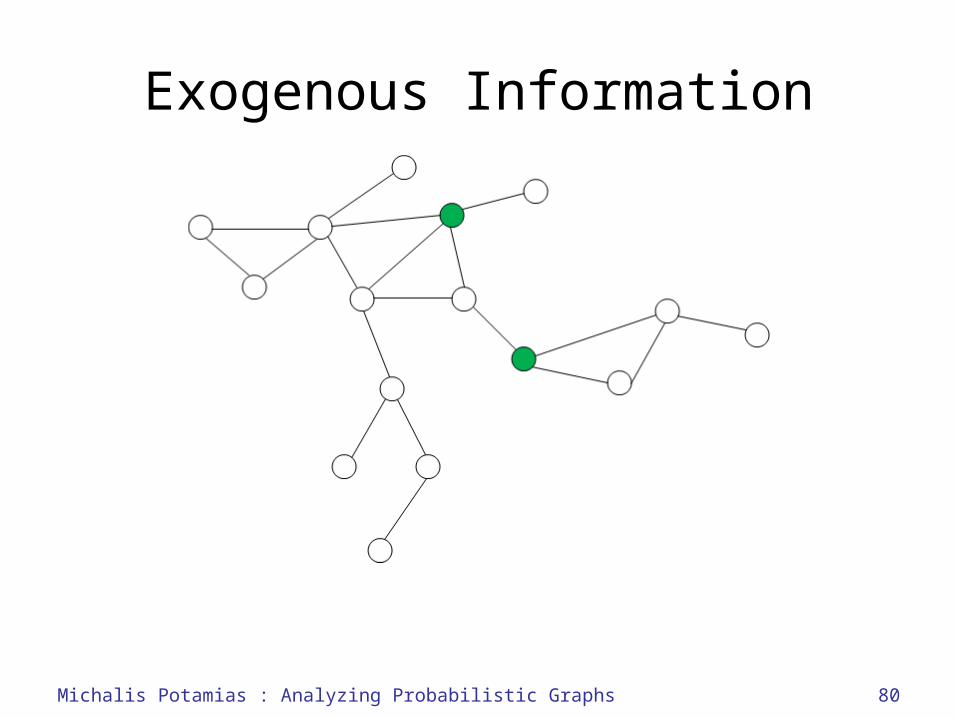
• Observe the time series of an information item’s spread in a given network. How endogenous and exogenous is the information item?
• Previous studies on inference of propagation probabilities:– Treat all information items as if they were
identical.– Assume that the network explains the
observed spread.[Rodriguez et al., KDD 2010][Goyal et al., WSDM 2010]
Michalis Potamias : Analyzing Probabilistic Graphs 66

67
Endogenous Information
Michalis Potamias : Analyzing Probabilistic Graphs
68
Endogenous Information
Michalis Potamias : Analyzing Probabilistic Graphs

69
Endogenous Information
Michalis Potamias : Analyzing Probabilistic Graphs
70
Endogenous Information
Michalis Potamias : Analyzing Probabilistic Graphs
71
Endogenous Information
Michalis Potamias : Analyzing Probabilistic Graphs
72
Endogenous Information
Michalis Potamias : Analyzing Probabilistic Graphs
73
Endogenous Information
Michalis Potamias : Analyzing Probabilistic Graphs
74
Endogenous Information
Michalis Potamias : Analyzing Probabilistic Graphs
75
Endogenous Information
Michalis Potamias : Analyzing Probabilistic Graphs

76
Endogenous Information
Michalis Potamias : Analyzing Probabilistic Graphs

77
Exogenous Information
Michalis Potamias : Analyzing Probabilistic Graphs

78
Exogenous Information
Michalis Potamias : Analyzing Probabilistic Graphs

79
Exogenous Information
Michalis Potamias : Analyzing Probabilistic Graphs
80
Exogenous Information
Michalis Potamias : Analyzing Probabilistic Graphs

81
Exogenous Information
Michalis Potamias : Analyzing Probabilistic Graphs

82
Exogenous Information
Michalis Potamias : Analyzing Probabilistic Graphs

83
Exogenous Information
Michalis Potamias : Analyzing Probabilistic Graphs
84
Exogenous Information
Michalis Potamias : Analyzing Probabilistic Graphs

Exogenous Information
Michalis Potamias : Analyzing Probabilistic Graphs 85
86
Exogenous Information
Michalis Potamias : Analyzing Probabilistic Graphs
87
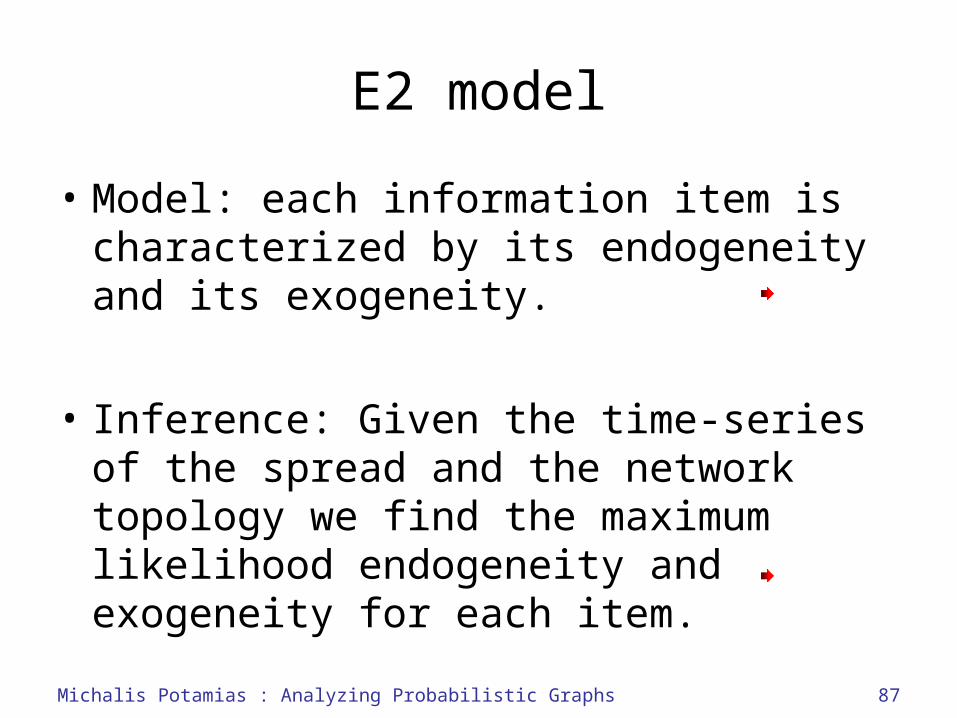
E2 model
• Model: each information item is characterized by its endogeneity and its exogeneity.
• Inference: Given the time-series of the spread and the network topology we find the maximum likelihood endogeneity and exogeneity for each item.
Michalis Potamias : Analyzing Probabilistic Graphs
112
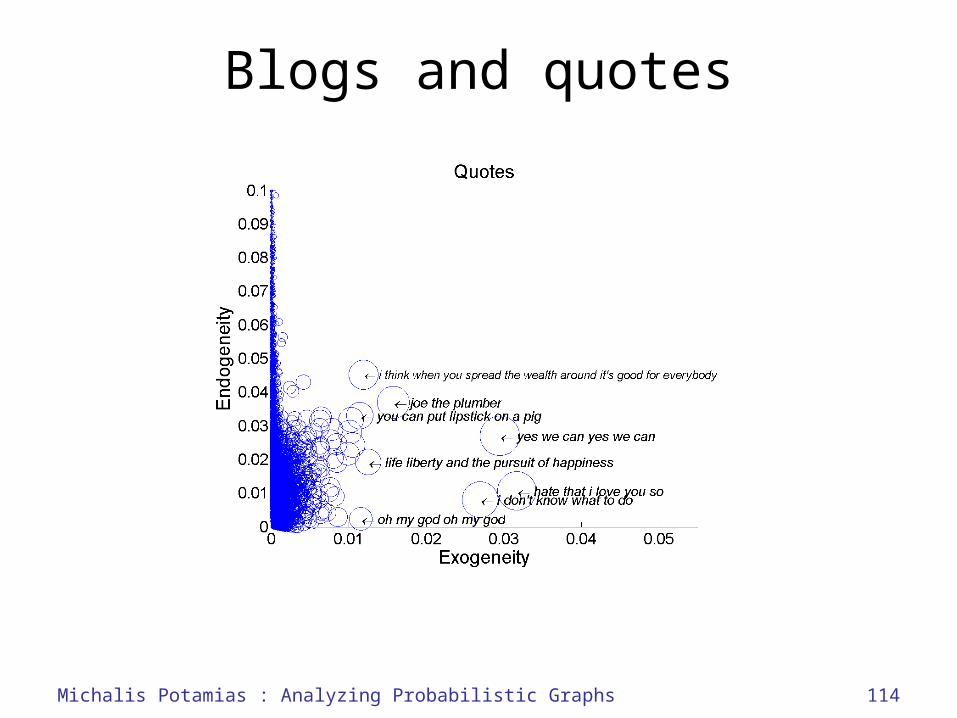
Blogs and quotesMemetracker dataset
[Leskovec et al., KDD 2009]– Blogger.com and wordpress.com– US Presidential elections era, 8/2008 – 4/2009– Nodes: Bloggers (50K)– Information Items: Quotes (60K) – Activations: Bloggers use quotes in their posts
(600K)– Network: Bloggers link to other bloggers (300K)
Michalis Potamias : Analyzing Probabilistic Graphs
Useful?
114
Blogs and quotes
Michalis Potamias : Analyzing Probabilistic Graphs
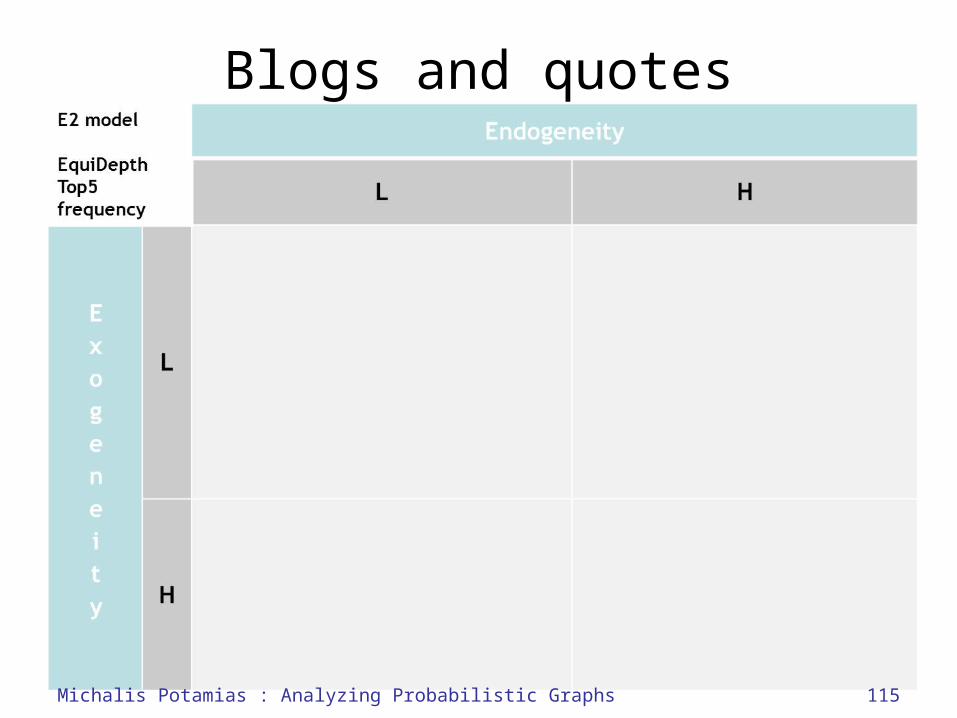
Blogs and quotes
Michalis Potamias : Analyzing Probabilistic Graphs 115
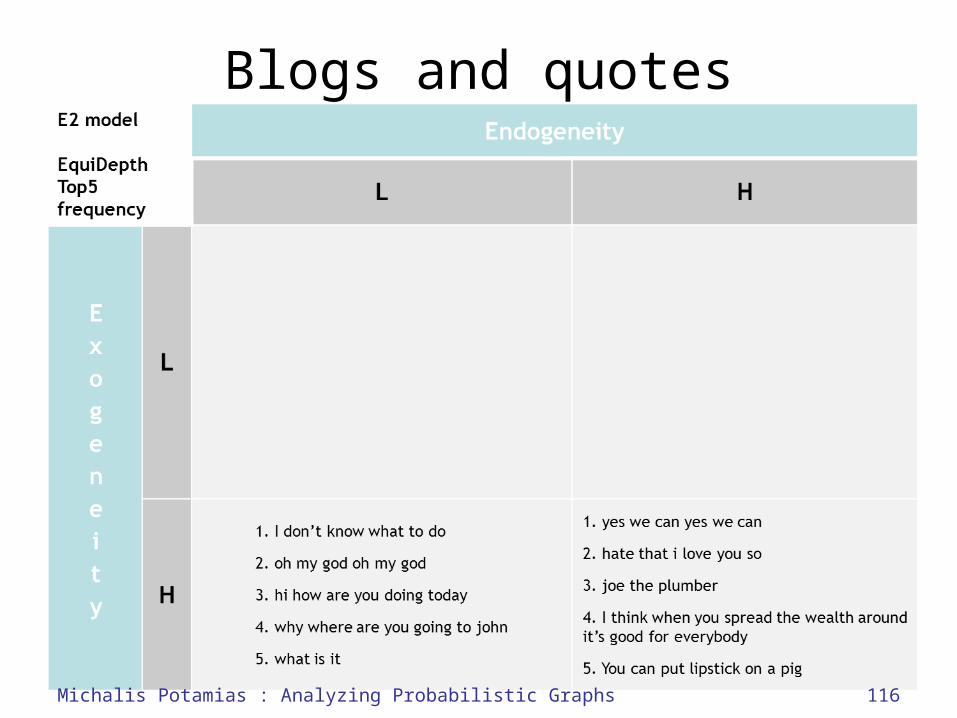
Blogs and quotes
Michalis Potamias : Analyzing Probabilistic Graphs 116
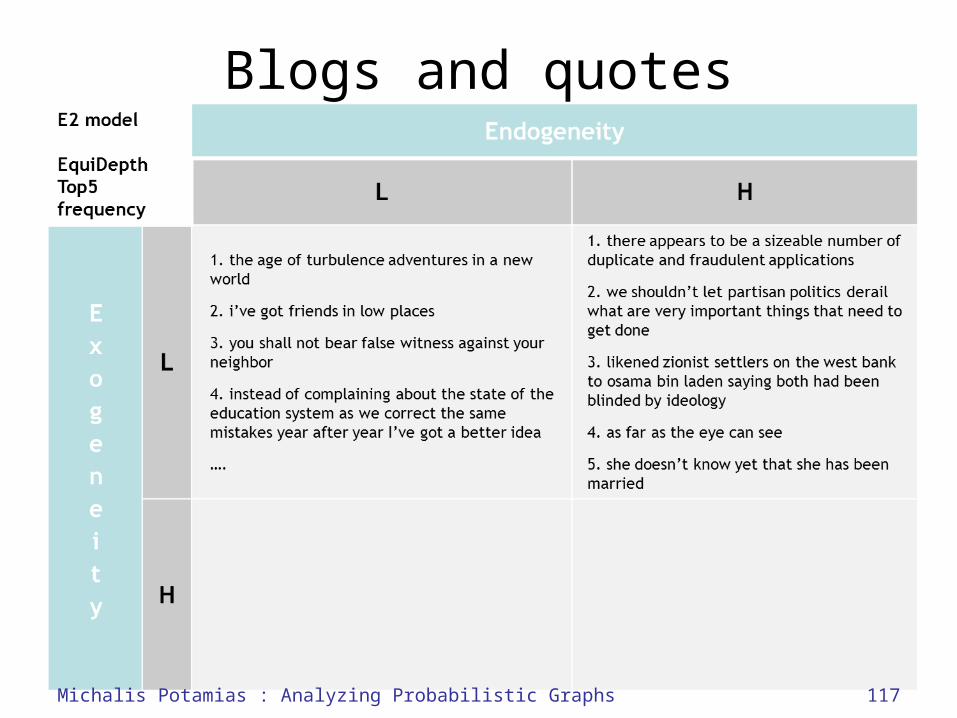
Blogs and quotes
Michalis Potamias : Analyzing Probabilistic Graphs 117
Blogs and quotes
Michalis Potamias : Analyzing Probabilistic Graphs 118

121
Probabilistic Graphs Roadmap
• Distance and k-nearest neighbors– Distance definition– Sampling– kNN Pruning– Predicting known relationships from PPI networks
• Clustering– Edit distance and cluster graphs– Clustering probabilistic graphs
• Learning in information propagation– The problem– Anecdotes
• Ongoing and Future work– Information propagation– Random walks– Daily deals
Michalis Potamias : Analyzing Probabilistic Graphs
122
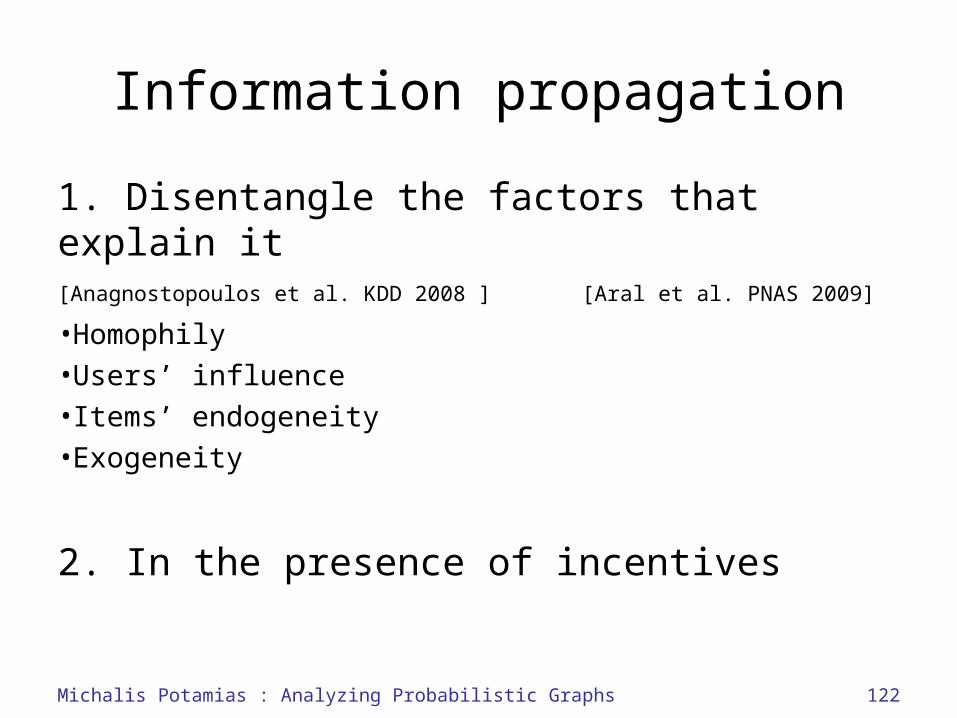
Information propagation
1. Disentangle the factors that explain it[Anagnostopoulos et al. KDD 2008 ] [Aral et al. PNAS 2009]
•Homophily•Users’ influence•Items’ endogeneity•Exogeneity
2. In the presence of incentives
Michalis Potamias : Analyzing Probabilistic Graphs
123
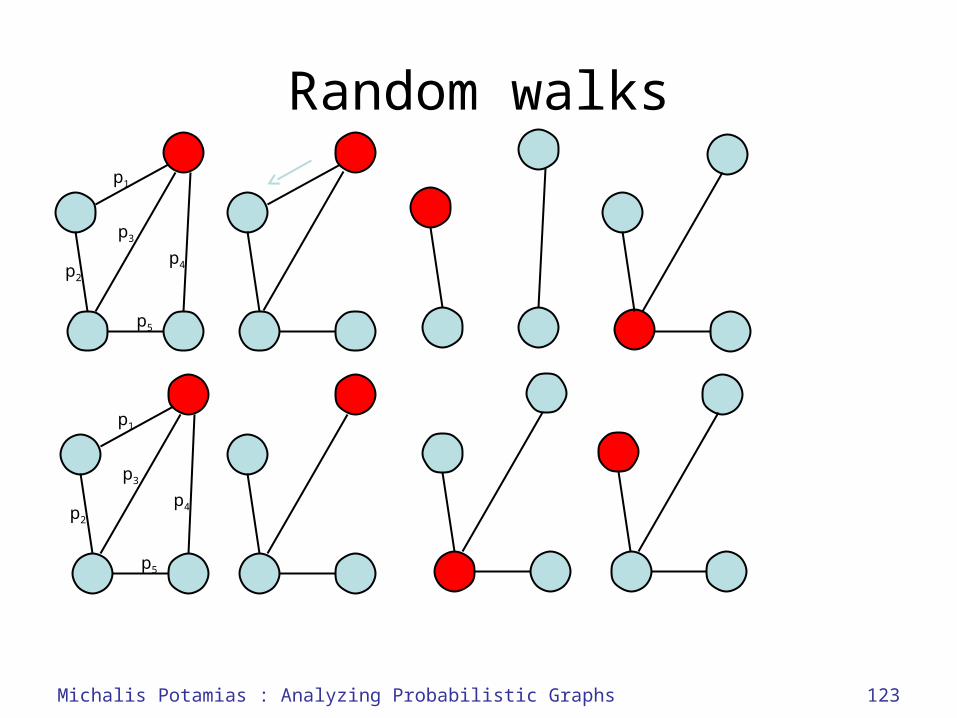
Random walksp1
p2
p3
p4
p5
p1
p2
p3
p4
p5
Michalis Potamias : Analyzing Probabilistic Graphs
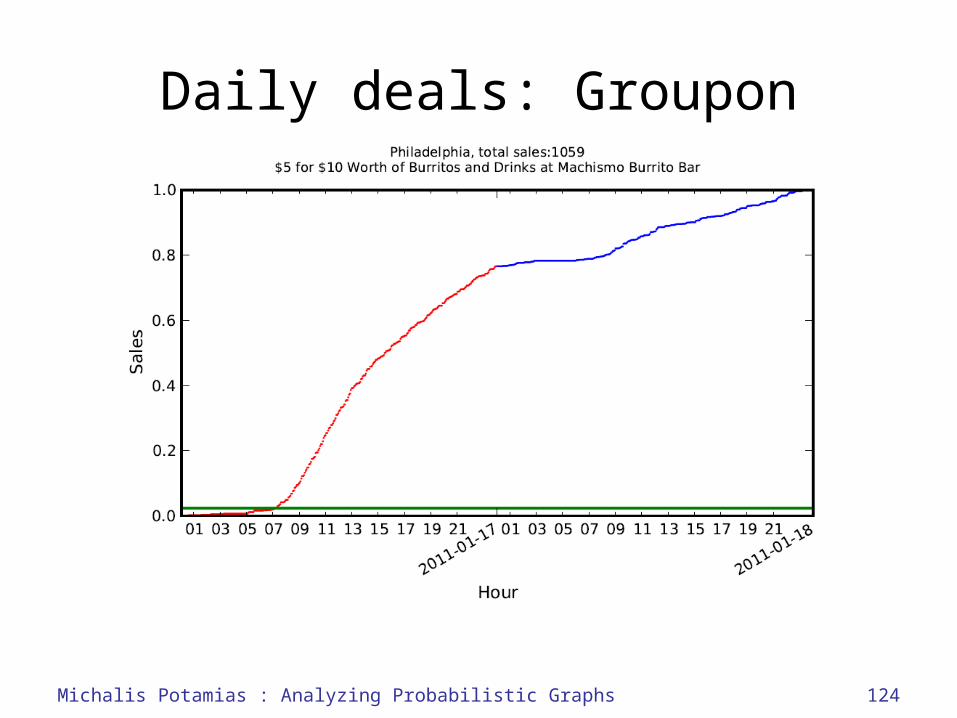
Daily deals: Groupon
124Michalis Potamias : Analyzing Probabilistic Graphs
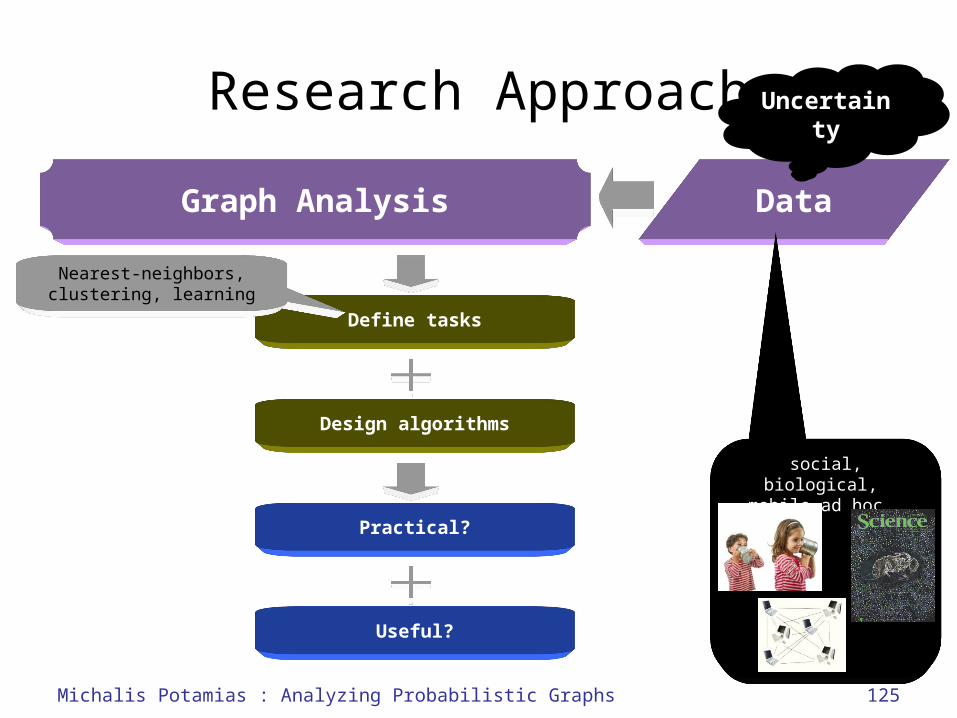
Research Approach
Graph Analysis
Define tasks
Useful?
Practical?
Design algorithms
Nearest-neighbors, clustering, learning
Data
social, biological, mobile ad hoc …
Uncertainty
125Michalis Potamias : Analyzing Probabilistic Graphs

Thank you
This talk consists of completed and ongoing work with the following collaborators:
Rakesh Agrawal (MSR)Aris Anagnostopoulos (U Rome)
Francesco Bonchi (YR)John Byers (BU)
Carlos Castillo (YR)Aristides Gionis (YR)George Kollios (BU)Evimaria Terzi (BU)
Konstantin Voevodski (BU)Georgios Zervas (BU)
126Michalis Potamias : Analyzing Probabilistic Graphs