and economic impact analysis - newton, ma
TRANSCRIPT

Fiscal Impact Analysis
Prepared By Fougere Planning & Development, Inc.
and
Economic Impact Analysis
Prepared By Landwise Advisors
Northland Newton Development
Newton, MA
August 31, 2018
FOUGERE PLANNING & DEVELOPMENT, Inc. Mark J. Fougere, AICP
phone: 603-315-1288 email: [email protected]
phone: 857-228-0210 101 Walnut St. Watertown, MA 02472
Prepared For
Northland Development, LLC

1
TABLE OF CONTENTS
FISCAL IMPACT ANALYSIS I. Introduction…………………………………………………………...………...page 3 II. Methodology…………………………………………………………………...page 6 III. Local Revenues from Development……………………………...page 7 IV. Municipal Services Cost………………………………………………..page 10 V. One-time Revenue Benefits……………………………………...…..page 21 VI. Summary of Findings………………………………………………...…. page 22
ECONOMIC IMPACT ANALYSIS
I. Introduction……………………………………………………………..……page 24 II. Methodology & The Inputs…………………………………………..page 24 III. The Impacts………………………………………………………….…….. page 26 IV. Conclusion………………………………………………………………..… page 27

2
Fiscal Impact Analysis Prepared By
Fougere Planning & Development, Inc.
August 31, 2018
FOUGERE PLANNING & DEVELOPMENT, Inc.
Mark J. Fougere, AICP phone: 603-315-1288
email: [email protected]
Prepared For Northland Development, LLC

3
FOUGERE PLANNING & DEVELOPMENT, Inc. Mark J. Fougere, AICP
phone: 603-315-1288 email: [email protected]
Northland Newton Development
Newton, MA
FISCAL IMPACT ANALYSIS Comparative Analysis
August 31, 2018
I. Introduction Northland Newton Development
Northland Development, LLC is proposing a new mixed-use development (the “Development”) on
Needham Street, Oak Street and Tower Road in Newton Upper Falls. The 22.6 acre-site, which lies
at the northwestern corner of Needham and Oak Streets, will be converted to a mixed-use
development including housing, retail, and office space. A majority of the mid-rise residential
buildings will contain first-floor retail uses and a total of 822 housing units are proposed ranging from
studio to three-bedroom units. Fifteen percent of all housing units (123) will be set aside as
affordable as required by Newton’s inclusionary housing ordinance. Buildings within the
Development will range from three to seven stories with residential parking under buildings and a
central commercial parking structure. Existing retail/industrial space on the Development site will be
demolished, and the existing historic Saco Pettee Mill office building at 156 Oak Street will be
restored with upgrades planned to interior and exterior elements. This fiscal impact report analyzes
potential revenue streams from the proposed residential and commercial development together with
fiscal impacts to individual City departments. Given the size and complexity of the Development
program, the buildout will occur over a five to seven-year period starting in FY 2020. For the
purposes of this report, all figures are shown at full buildout. Table One outlines the Development
program.

4
Table One Development Program
Program Square Feet
Small Retail 155,200
Medium Retail 30,000
Total Retail Sq. Ft. 185,200
Office
Renovated – 156 Oak Street 180,000
Housing
Studio - Three Bedroom 822 Units
Fifteen percent (15%) of the 822 housing units (123) will be affordable, which will make the
Development the largest development of inclusionary units in the City of Newton. All proposed new
access drives and interior roadways will be privately owned and maintained by the owner, and trash
disposal, snow removal and utility connections will be privately contracted. Public water and sewer
will be provided to the site through municipal services.
Local Trends Census figures report that from 2000 to 2010 Newton’s population increased from 83,829 to 85,146,
a population growth rate of 1.57% over 10 years. The most recent population estimates from the US
Census Bureau1 report a population of 89,045. This increase in population can be found
predominately in two ages groups, 5 – 19 (+2,507) and those over the age of 65 (+1,681). The City
of Newton’s Demographic Report2 notes that the average Household size has decreased from 2.77
in 1980 to 2.5 in 2010. In addition, the 25-44 age cohort has declined by 19.5% during this same
period.
As shown in Figure One, a majority of Newton’s housing stock consists of one-unit structures (69%),
which includes single-family homes (62%) and one-unit attached homes (7%). The 2015 US
Census data reporting 20,273 one-unit structures out of a total housing stock of 32,665 units. Of the
31,077 occupied housing units, 69.4% are owner occupied and 30.5% are renter occupied.
1 2016 American Factfinder 2 Demographic Trends and Housing in the City of Newton, Ma, Bluestone 2014.

5
Figure One
Housing Types
City Budget
The City of Newton’s total operating budget for Fiscal Year 2019 is $412,513,389. Newton Public
Schools account for 56% of the budget. Other key departments include Police, Fire, Public Works,
Health/Human Services and Parks & Recreation. Figure Two outlines the budget percentage for
each department, as well as other budget categories.
Public Schools, Police, Fire and to some degree, Health & Human Services, will experience the most
direct measurable impact from the Development. In addition, these departments have large
budgetary impacts on the community and therefore they are the primary focus of this Report.
One Unit Structures
69%
Duplex19%
3 - 9 Units8%
10 - 19 Units4%

6
Figure Two
Department Budget Allocation
II. Methodology
Several methodologies are commonly used to estimate the fiscal impacts of proposed
developments. The Per Capita Multiplier Method is sometimes used to determine municipal cost
allocation. This method is the classic “average” costing method for projecting the impact of
population growth on local spending patterns and is used to establish the costs of providing services
for new development. This method assumes that current revenue/cost ratios per person and per
unit are a measure of future revenue/cost impacts occasioned by growth. The advantage of this
approach is its simplicity of implementation; however, its disadvantage is that it calculates the
“average” cost as being the expected cost. This is often not the case, and costs may be overstated,
in some cases significantly. A more accurate method is the Marginal Cost Approach methodology
which is the primary methodology utilized in this report. The Marginal Cost Approach allocates
fiscal impact on a case by case analysis of additional costs generated specifically by the
Development. In reviewing exclusively those City departments which may realize a measurable
impact from the proposed development, a truer picture of anticipated costs impacts can be
determined. For most new land uses, many department budgets are not measurably impacted.
Fougere Planning met with a number of City department heads and officials during the preparation of
this Report. The purpose of these meetings was to review and establish the fiscal impact approach,
as well as to discuss with local officials their concerns about present service capacity and how the
Development may impact department and municipal infrastructure. In particular, a series of meetings
were held with Ms. Julie Kirrane of the Newton Public Schools to discuss estimated “no build”
General Administration
7%
Plng & Insp. Srvs.1%
Police5%
Fire6%
Park & Recreation
2%
Public Schools55%
Public Works6%
Debt Maturities & Interest
6%
Retirement9%
Other3%

7
enrollment projections, potential school assignments/enrollment impacts of the Development, the
status of School Department capital projects, and potential school costs of the Development.
• A number of key assumptions underlie the findings outlined in this Report: Although the
Development will take five to seven years to build out, we make the assumption this report
assumes that the Development is completed and occupancy is stabilized for all uses.
• All revenues and costs are reported in current dollars.
• The 2018 City Tax Rate is being utilized as the 2019 rate has not been set.
• City costs are based on the 2019 Budget. Property values and rents are based upon
current market conditions.
III. Local Revenues From Development
A) Property Taxes Local property taxation provides the majority of revenues for the City of Newton, totaling 82.9% of all
revenues to the General Fund3. Newton’s 2018 Tax Rate consists of a Residential Rate of $10.82
per $1,000 valuation and a Commercial Rate of $20.62. In order to estimate future property tax
revenue from the proposed Development, thirteen comparable commercial properties were
reviewed4. In addition, a meeting was held with the Board of Assessors to gain an understanding of
local market conditions. Three housing complexes5 within Newton were used as comparable
properties to arrive at an estimated residential value.
Locational considerations within the Development site were taken into account with increased
valuations for the commercial buildings located in high visibility locations compared to space located
in less visible areas of the site.
The current assessments of the property and the 2018 tax rate yields +/- $995,000) in yearly
property tax assessments. Based on the redevelopment proposal, annual property tax payments will
increase substantially to +/- $4,513,797, as shown in Table Two
3 Fiscal Year 2017. 4 A full list of comparable properties is shown in the Appendix. 5 Avalon Highlands, Avalon Chestnut Hill, Woodland Station.

8
Table Two Estimated Yearly Property Taxes
Program Square Feet Est. Sq. Ft.
Value Est. Assess.
Value
Retail - small 155,200 $265 $41,128,000
Retail - medium 30,000 $245 $7,350,000
Total Retail Sq. Ft. 185,200
Office
Renovated - Oak Street 180,000 $180 $32,400,000
Total Value Non-Residential $80,878,000 Taxes @ $20.62 $1,667,704
Housing
Studio - Three Bedroom 822 Units $320,000 / Unit $263,040,000 Taxes @ $10.82 $2,846,093
Total Est. Taxes $4,513,797
B) Community Preservation Surcharge The City of Newton has adopted the Community Preservation Act allowing the community to impose
a 1% surcharge on property taxes. Based upon the projected taxes previously outlined in Table
Two, Table Three shows an estimated CPA surcharge of $45,138.
Table Three
Community Preservation Surcharge
Property Taxes % CPA Surcharge Surcharge
$4,513,797 1% $45,138
C) Miscellaneous Yearly Revenues
i. Motor Vehicle Excise Tax - Another revenue source for the community is motor vehicle
excise taxes. In FY 2019 the City of Newton is expected to receive a total of
$13,500,0006 from this revenue source. To estimate excise taxes generated by the
Development , an estimated average vehicle value of $18,000 was used. Given the
proposed housing use and the affordable housing component, the estimated vehicle
value was then reduced7 by 50%. Table Four outlines the projected vehicle excise
taxes for the proposed Development for registered motor vehicles based on a current
excise tax rate of $25 per $1,000 of vehicle value.
6FY 2019 Budget estimate. 7 This analysis was developed through discussions with a number of town clerks to arrive at a conservative
estimate of vehicle excise taxes. Cars are discounted by 50% to account for value variations of those who own
cars.

9
Table Four Motor Vehicle Excise Tax
# Cars8 Value Total Value
797 $18,000 $14,346,000
$7,173,000/1,000 (50% reduction) $7,173
$25 x $7,123 $178,075
ii. Local Meals Tax – In addition to the State imposed 6.25% meals tax, the City of Newton
collects a .75% as a local revenue source. Based upon area sale comparables for small
and large restaurants, it is estimated that the Development will generate $195,000 per
year from this revenue source; Table Five outlines estimated meals taxes from the
programmed restaurants.
Table Five Estimated Restaurant Tax Revenue
Restaurant Tax Estimate
Large Restaurant (10k Avg.) 30,000/SF
Small Restaurant (3k Avg.) 20,000/SF
Total 50,000
Large Restaurant Gross Revenue $600/SF
Small Restaurant Gross Revenue $400/SF
Total Gross Revenue $26,000,000
Tax Revenue To Newton $195,000
D) Personal Property Taxes Personal property taxes will be collected from a number of businesses that will reside within the
Development area, specifically the proposed restaurants and office tenants. Based upon information
supplied by the Board of Assessors, an average assessed value of restaurant personal property was
calculated at $20.94 per square foot. The Development program includes 50,000 square feet of
restaurant space, which will generate an estimated $21,589 in personal property tax revenue. It is,
estimated that the renovated office building will generate $9,000 a year, for a total estimated annual
personnel property tax revenue of $30,589.
E) Total Estimated Yearly Development Revenues Per Table Six, the Development is estimated to generate $4,962,599 in yearly revenues from
property taxes, CPA surcharge, vehicle excise taxes, local Meal taxes and Personal Property taxes;
8 Estimated 1 vehicles per unit, with 3% vacancy.

10
Table Six Estimated Yearly Revenue
Commercial/Residential Property Tax $4,513,797
CPA Surcharge $45,138
Excise Taxes $178,075
Local Meal Taxes $195,000
Personnel Property Taxes $30,589
Total Revenue $4,962,599
Additional one-time payment revenues will also be realized as part of the development, these will be
detailed further below.
IV. Municipal Service Costs
Fougere Planning and Development has analyzed the likely foreseeable cost to key City
departments.
School Department
The City of Newton public schools presently have an enrollment9 of 12,750 students housed in
twenty-one schools (fifteen elementary, four middle, and two high schools). The 2019 School budget
is $227,560,263. Overall enrollment expected to increase very minimally in the coming five years,
growing at roughly one-half of a percentage point over the next five years with elementary school
enrollment actually projected to decline and with short term increases expected for the Middle and
High School levels only. Major capital investments have been made to numerous school buildings,
including the construction of three new elementary schools, and the School Department has
developed a detailed long-range plan to address building needs (renovations and/or expansions)
throughout the system.
The most recent Newton School Department enrollment projections indicate a slower pace of
enrollment growth will occur district wide over the next five years (0.6% total growth) along with a
continuing decline in elementary enrollment of 3.4%,Table Seven contains the School Department
Enrollment projections.
Table Seven
Enrollment Projections Grade Level
Actual 2017-18 2018-19 2019-20 2020-21 2021-22 2022-23 % Change
Elementary 5,824 5,816 5,740 5,673 5,657 5,627 -3.4%
Middle 2,868 2,852 2,910 3,009 3,011 2,992 +4.3%
High School 4,058 4,112 4,150 4,143 4,181 4,204 +3.5%
Total 12,750 12,780 12,800 12,825 12,849 12,823 +0.6%
9 Enrollment Analysis Report, 2017-18, Newton Public Schools.

11
Projected School Enrollment
In reviewing the potential number of school children who may reside within a housing development, a
number of factors are considered. These include the number of bedrooms per unit, as studio and one-
bedroom units typically do not house school age children and two/three-bedroom units generally
produce a higher rate of children per unit. Affordability also plays a role as can be seen with Newton
School District enrollment reporting data. Table Eight provides a breakdown of unit types for the
proposed 822 housing units, including 123 affordable units.
Table Eight Unit Mix Breakdown
Type Total Affordable 15% Market Overall %
Studios 82 12 70 10%
One Beds 371 56 315 45%
Two Beds 329 49 279 40%
Three Beds 40 6 35 5%
Totals 822 123 699 100%
The Newton Public Schools staff track enrollment trends very carefully. Each year the School
Department produces an Enrollment Analysis Report which details enrollment by individual schools,
reviews development trends and estimates future enrollment. In addition, the Report tracks the
number of school age children (SAC) residing in a number of key housing complexes that contain
affordable housing units. The findings from the annual Enrollment Analysis Report will be the basis
for the School Department’s evaluation of the number of school children that may reside in the
Development. The three principal housing complexes that are tracked include: Avalon at Newton
Highlands, Avalon at Chestnut Hill and Arborpoint at Woodland Station . We noted that these housing
complexes have a higher percentage of two/three-bedroom units10 (68.8%), compared to the proposed
Development (44.9%). This higher percentage will increase the number of students per unit when
compared to the proposed development. In addition, both Avalon complexes have more three-
bedroom units (Newton Highlands - 60 units and Chestnut Hill – 46 units) than the proposed
Development (40 units).
In our discussions with Ms. Kirrane we reviewed and discussed enrollment estimates, trends, capital
programs and the neighborhood schools that will service the Development. After discussing the three
specific housing complexes tracked by the Department, it was agreed to rely upon data solely from
the two Avalon projects as their unit mixes are more closely aligned to the Development’s unit mix.
The current enrollment breakdown for Avalon Highlands and Chestnut Hill housing developments is
outlined in Table Nine.
10 Of a total of 678 units, 467 are two and three bedrooms.

12
Table Nine School Enrollment 2017-18
Avalon Highlands & Chestnut Hill11 School Avalon at Newton
Highlands (294 Units)
Avalon at Chestnut Hill (204 Units)
Angier Elementary 5
Bowen Elementary 7
Countryside Elementary 27 1
Memorial-Spaulding Elem. 25
Zervas Elementary 25
Total Elementary 57 33
Brown Middle 17
Day Middle 2
Oak Hill Middle 22
Newton North 1 1
Newton South 31 24
Total Secondary 51 47
Total All Schools 108 80
The School Department develops SAC (school age children) ratios for a given complex by measuring
the number of school children within the complex and dividing it by the number of two- and three-
bedroom units in the complex. For example, if 9 school age children lived within a complex containing
46 two- and three-bedroom units, the SAC ratio calculation would be 0.195. Based on these ratios,
the number of school aged children in the Development is projected to be 12012. Table Ten shows
the calculation of school age children at the Development based on the combined Avalon SAC ratios.
Table Ten Estimated School Age Children – Local Data
Type Units SAC
Ratios Total SAC
Studio Market 70 0.000 0.000
Studio Affordable 12 0.000 0.000
1 Bed Market 315 0.000 0.000
1 Bed Affordable 56 0.000 0.000
2 Bed Market 279 0.192 53.568
2 Bed Affordable 49 0.918 44.982
3 Bed Market 35 0.735 25.725
3 Bed Affordable 6 2.563 15.378
Total 822 140
Total Includes 14% Private School -20
Total Estimated Public School Children 120
11 School Department Data. 12 Newton Council on Aging & Newton Dept. of Sen. Services document, Nov.2015.

13
Locational Factors
While local developments are used in this analysis, it should be noted that these projects are not
true mixed-use centers like the proposed Development, with housing located above retail spaces
and shared with office buildings. Mixed-use developments with substantial commercial uses are
potentially less attractive to families. The SAC ratios developed by the Newton School Department
do not make an adjustment for mixed use centers. Comparing the proposed Development’s SAC
ratio (based on Newton School District’s data) to other mixed-use projects in the area provides a
clear indication that unit-mix and locational considerations do play a role in the number of school
children that may reside within a housing complex. Table Eleven compares SAC ratios of the
Development to other mixed-use housing complexes.
Table Eleven Area Mixed Use Housing Complexes
Regional Projects Town Total Units
Total SAC
Studio/One Beds
Two Beds
Three Beds
SAC Ratio
Total Affordable Units
Charles River Landing Needham 350 28 245 105
0 0.08 88
University Station Westwood 350 32 210 140 0 0.09 88
Proposed Development Newton 822 120 453 329 40 .145 123
Given the unique qualities and the mixed-use nature of the proposed Development, we believe that a
younger and older demographic are more likely to be attracted to the Development. Younger
professionals and empty nesters, both with active lifestyles, are attracted to day and evening activities
of a mixed-use development. These demographic groups are not in their prime family years which is
reflected in the lower SAC ratios in Table 11.
The Newton Council on Aging13 has reported the growing housing demand for seniors over the age
of 60, with the population in the community expected to reach over 22,000 by the year 2020. The
Council has estimated a future need for senior housing options ranging between 1,000 to 2,000
housing units. With this increasing senior population, the need for alternative housing options to
accommodate those who wish to downsize their living arrangements and remain in the community
will continue to grow. Large, multi-story homes are not conducive to older populations. These
structures have many barriers for those contending with physical limitations, along with the ongoing
maintenance attention required to upkeep these homes.
13 Newton Council on Aging & Newton Dept. of Sen. Services document, Nov.2015.

14
The proposed mixed-use neighborhood will create a non-traditional environment that typically
generates fewer school age children14. Key factors associated in non-traditional housing
environments include:
• Multi-family residential development located above commercial uses.
• Multi-family residences accessed primarily by elevators such as high-rise development.
• Multi-family properties located within mixed-use developments or are visually and operationally a part of general locations developed primarily for commercial / industrial use and major employment centers.
• Multi-family developments that are within or in close proximity to high intensity commercial or mixed-use developments.
• Multi-family developments located on local high traffic ways or where primary access is via a highway interchange or a major collector roadway leading to close by highway access.
As a result, the Development is likely to experience high demand by seniors and young
professionals, which in turn will generate a lower SAC ratio and school children estimate than either
Avalon Newton Highlands or Avalon Chestnut Hill. It is our professional opinion that the proposed
Development’s unique characteristics will influence the demographic groups who will reside within
the Development. Based on the findings outlined above, the estimated 120 SAC could be reduced
by up to 25 – 30%. However, to be conservative and recognizing the attractiveness of the City’s
school system, this analysis will rely upon the local data to estimate school age children and use the
estimated 120 students from Table Ten.
Grade Breakdown
Reviewing the grade profile of the two Avalon housing complexes relied upon to estimate the
number of school age children in the Development, Table Twelve outlines the anticipated grade
breakdown of students in the proposed Development.
Table Twelve Estimated School Age Children – By Grade
Grades K - 5 61 Students
Grades 6 – 8 27 Students
Grades 9 - 12 32 Students
It is not expected that all of the potential students will appear in the school system immediately.
Based on construction and lease-up periods, there will be a lag between construction and full
occupancy of the Development. It is anticipated that the first phase of the Development will not be
completed until 2022 and the entire Development will take five to seven years to fully complete. This
14 As reported by John Connery & Associates, along with findings researched by Fougere Planning.
15
construction timing coincides with the anticipated decrease in enrollments for the elementary grade
levels.
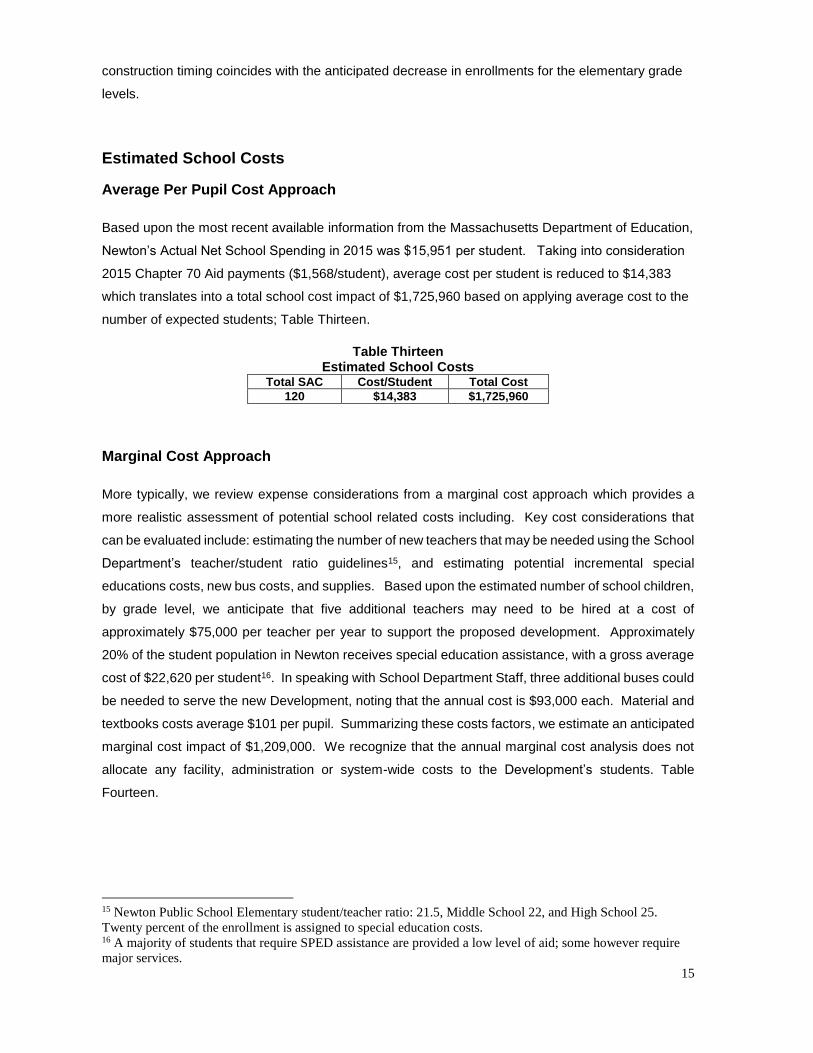
Estimated School Costs
Average Per Pupil Cost Approach
Based upon the most recent available information from the Massachusetts Department of Education,
Newton’s Actual Net School Spending in 2015 was $15,951 per student. Taking into consideration
2015 Chapter 70 Aid payments ($1,568/student), average cost per student is reduced to $14,383
which translates into a total school cost impact of $1,725,960 based on applying average cost to the
number of expected students; Table Thirteen.
Table Thirteen Estimated School Costs
Total SAC Cost/Student Total Cost
120 $14,383 $1,725,960
Marginal Cost Approach
More typically, we review expense considerations from a marginal cost approach which provides a
more realistic assessment of potential school related costs including. Key cost considerations that
can be evaluated include: estimating the number of new teachers that may be needed using the School
Department’s teacher/student ratio guidelines15, and estimating potential incremental special
educations costs, new bus costs, and supplies. Based upon the estimated number of school children,
by grade level, we anticipate that five additional teachers may need to be hired at a cost of
approximately $75,000 per teacher per year to support the proposed development. Approximately
20% of the student population in Newton receives special education assistance, with a gross average
cost of $22,620 per student16. In speaking with School Department Staff, three additional buses could
be needed to serve the new Development, noting that the annual cost is $93,000 each. Material and
textbooks costs average $101 per pupil. Summarizing these costs factors, we estimate an anticipated
marginal cost impact of $1,209,000. We recognize that the annual marginal cost analysis does not
allocate any facility, administration or system-wide costs to the Development’s students. Table
Fourteen.
15 Newton Public School Elementary student/teacher ratio: 21.5, Middle School 22, and High School 25.
Twenty percent of the enrollment is assigned to special education costs. 16 A majority of students that require SPED assistance are provided a low level of aid; some however require
major services.

16
Table Fourteen Alternative School Cost Approach
Cost Element Cost # Total
Teachers17 $75,000 5 $375,000
Special Ed. $22,620 24 Students $542,880
Busing $93,000 3 $279,000
Supplies $101 120 $12,120
$1,209,000
Based upon these two cost approaches, estimated yearly school related expenses could range from
$1,209,000 (marginal cost analysis) to $1,725,960 (average cost analysis), and some estimate
between those approaches would be appropriate.
School Facilities
The neighborhood and site lie within a School Department Buffer District, which provides the School
District with the flexibility to assign students to various elementary schools depending on capacity and
other factors. As outlined in Table Nine, it is possible that students living at the Development could
attend different schools. At the elementary level, three schools will be under consideration for residents
of the Development: Angier, Zervas and Countryside. Countryside is expected to experience
moderately declining enrollment over the next several years, and while it may eventually be the primary
receiving school for the subject site, renovations are scheduled to be completed at the school by FY24,
but we are not aware of any plans to expand classroom space. Eight additional classrooms have been
added in construction of the new Zervas School, and the new Angier School was recently completed
adding three new classrooms. It should be noted that the School Department has indicated that there
is capacity within the system to accommodate the proposed Development, although specific school
assignments will depend on future events and trends. School Department Staff indicated that both
Brown Middle School and Newton South High School will accommodate the expected enrollment
increases. Brown Middle School presently has two modular classrooms, and Newton South High
School, given its more fluid schedule, has a greater ability accommodate increased enrollments. With
students from the Development not expected to begin to enroll in the school system until the 2022
school year school at the earliest, officials will determine at that time the appropriate elementary school
location for the students who reside within the Development. In addition, the proposed development
will take five to seven years to fully build out, slowing the introduction of students to the school system,
with full enrollment impact unlikely until about 2027. Tracking enrollment levels over a five to seven-
year time frame will allow the School Department to address these matters in an orderly fashion.
17 Given that the cost of 24 students is allocated to Special Education, the cost of teachers for 96 students has
been calculated.

17
Municipal Departments Police & Fire
Our analysis assumes that the Police Department and Fire Department will experience increased
demand for services from the Development. For fiscal year 2018, the Police Department budget was
$22,235,462 and the Fire Department budget was $22,362,741. The Police Department responds to
an average 36,000 calls for service annually, while Fire Department records indicate 9,745 calls18
annually. To assess the degree of impact this Development would have on these Departments,
comparable emergency call data from similar uses was analyzed. For the proposed housing units,
local data from three complexes were used, and for the retail space, comparable retail uses were
used. The data was analyzed to derive an average call volume per unit, which were then used to
generate projected emergency responses for each Department. Data was not obtained from the
existing office space and the retail space is calculated as “net new” as impacts from these properties
are already included in existing budgeting. A total of 114,447 square feet of “new” retail space was
analyzed; as 70,753 square feet of commercial space presently exists within the Development area.
A private ambulance company services the City, but the Fire Department responds to most calls, so
this data was included in the analysis.
Extrapolating from the comparable call data, City increases are projected in the City’s Police and Fire
Department call volume. Annual police calls are projected to increase by 518 calls, annual
fire/ambulance calls are projected to increase by 122 calls (63/59 calls respectively), creating marginal
operational impacts as shown in Tables Fifteen A-B-C.
18 Fire Department call data estimates obtained from Connery Associates Fiscal Impact Analysis for
Washington Place, May 25, 2016. Police call data supplied by the Police Captain Geary.

18
Table Fifteen A Projected Police19 Emergency Service Calls
Police Calls Retail Use Sq. Ft.
Avg. Call Per
Year Calls / Sq. Ft.
Total New Calls
Max 260 Needham St. 35,100 36 0.0010
241-281 Needham St. 70,753 135 0.0019
55 - 71 Needham St. 19,097 20 0.0011
230-244 Needham St. 31,925 136 0.0043
300 Needham St. 35,109 50 0.0014
Total Average 191,984 378 0.0020
Proposed New Retail Space 114,447 225 Residential # Units
Avalon Newton Highlands 294 153 0.520
Avalon Chestnut Hill 204 67 0.328
Arborpoint Woodland 180 22 0.120
Total Average 678 242 0.356
Total New Housing Units 822 293 518
Table Fifteen B Projected Fire Emergency Service Calls
Fire Calls Retail Use Sq. Ft.
Avg. Call Per
Year Calls
Sq. Ft.
Total New Calls
260 Needham St. 35,100 4 0.0001
241-281 Needham St. 70,753 1 0.0000
55 - 71 Needham St. 19,097 0 0.0000
Total Average 124,950 5 0.0000
Proposed New Retail Space 114,447 5
Residential Housing # Units
Avalon Newton Highlands 294 26 0.088
Avalon Chestnut Hill 204 11 0.053
Arborpoint Woodland 180 12 0.064
Total Average 678 48 0.071
Proposed New Housing Units 822 58 63
19 Police call data obtained from the Police Department.

19
Table Fifteen C Projected Ambulance Emergency Service Calls
Ambulance Calls Retail Use Sq. Ft. Avg. Call Per
Year Calls Sq. Ft. Total New
Calls
260 Needham St. 35,100 2 0.0001
241-281 Needham St. 70,753 2 0.0000
55 - 71 Needham St. 19,097 6 0.0003
Total Average 124,950 10 0.0001
Proposed New Retail Space 114,447 9
Residential Housing # Units
Avalon Newton Highlands 294 26 0.088
Avalon Chestnut Hill 204 9 0.044
Arborpoint Woodland 180 7 0.036
Total Average 678 41 0.061
Proposed New Housing Units 822 50 59
Police Department
Fougere Planning and Development met with Captain Dennis Geary to discuss the proposed
Development to review the estimated calls from the Development and their potential impact to the
Department. Captain Geary believed the most appropriate way to measure cost impact was to
review per sector shift costs. Each sector of the City has an average 4.5 police officers at a cost of
$434,630. Based on an average of 4,007 calls per Sector20 the proposed Development will increase
calls by 13% (518/4,007). Multiplying this percentage by the total police sector cost of $434,630
arrives at an estimated increased police cost of $56,502., as shown in Table Sixteen.
Table Sixteen
Police Department Impact
4.5 Officers Per Sector
Cost Per Sector Salary Officers per Shift Cost
Day Shift $92,917 1.5 $139,376
Night Shift $98,418 3 $295,254
Total Sector Cost $434,630
Calls Per Sector 4,007
Estimated Calls 518
% Increase in Calls 13%
Estimated Costs 13% x $434,630 = $56,502
20 Average three-year call volume is 36,060, divided by 9 police sectors = 4,007 calls per sector.

20
Fire Department
Although a private ambulance service operates within Newton, the Fire Department responds to
most calls. As noted in Table 15C, these calls have been accounted for in this analysis.
Fougere Planning and Development met with Deputy Fire Chief Michael Smith and Captain Mark
Hernandez. The scope of the Development was discussed, along with the projected emergency
service calls outlined in Table 15B & C. Staff noted that Station 7 at Eliot Street is close to the
Development and they did not believe the increased calls would significantly impact the Department.
The Deputy Chief and Captain did not see a financial impact on the Department.
In order to account for some costs, the Deputy noted an average cost of a full-time fire fighter is
$100,000 per year. To be conservative, we will carry this cost figure in our analysis.
Other Departments/Revenues: Building
Building Department costs were not included in this analysis because they are not permanent annual
impacts and will be offset by building permit fees.
Public Works
All roads within the development will be private and maintained by the complex operator. Solid waste
will be handled by a private contractor with no expense incurred by the City.
Health & Human Services
The proposed development will place a demand for services on the Health and Human Services
Department as a result of the new residential units, along with food related establishments that will
exist within the new village.
Inspections will be required for any restaurant, coffee shop or other uses involving food. A yearly
permit and fee will be required for such uses, with costs ranging from $150 to $300 a year. The
Health & Human Services 2019 budget is $4,159,191 consisting of administration, public health,
clinical health, mental health and other services. Based upon Newton’s population21, the per capita
cost of these departments is $47. With an estimated housing population22 of 1,824, a cost of
$85,728 has been calculated.
21 U.S. Census 2016, 89,045 22 U.S. Census data, 2.22 persons per renter occupied housing unit.

21
Other Departments
It is not anticipated that measurable impacts will occur to any other City departments and therefore
no other costs were analyzed. To be conservative, a $25,000 cost will be carried to account for
potential other impacts.
V. One-time Revenue Benefits
Building Permit Fees: Based upon expected building hard costs of $350,000,000 for the
proposed Development, building fees are estimated to total $7,000,000.
FISCAL SUMMARY Table Eighteen summarizes the fiscal impact from the proposed Development. Gross annual
revenues to the City of Newton are estimated to be $4,962,599 and estimated annual costs are
could range from $1,476,230 to $1,993,190 with the proposed development providing an estimated
yearly net positive impact to the City ranging from $2,969,409 to $3,486,369.
This cost estimate does not infer that the City’s budget will increase as a result of the proposed
Development but assigns a “cost” to account for these new land uses in the community. Appropriate
discussions with key decision makers within the City will determine if budgets need to be adjusted to
address demands estimated in this Report.
Table Eighteen Estimated Annual Fiscal Impact
COSTS REVENUE
$
Gross Rev. Taxes, CPA, Meals, Excise & Personnel Property Taxes
$4,962,599
Estimated Municipal Costs
Police $56,502
Fire $100,000
Health $85,728
Other Departments $25,000
School Costs $1,209,000 to $1,725,960
Total Costs $1,476,230 to $1,993,190
Net Annual Positive Fiscal Impact +$2,969,409 to $3,486,369
Net Increase in New Revenue (LESS existing tax revenue of $990,898 per year)
+$1,978,511 to $2,495,471

22
Summary of Findings
• The proposed Needham Street Development will transform an underutilized area of the
community into new neighborhood within the City of Newton, fusing together work, housing and social activities. The major fiscal findings attributable to this Development include:
• The Development will result in a net annual positive fiscal impact ranging from $2,969,409 to $3,486,369. Anticipated annual costs of the Development are estimated to be range from $1,476,230 - $1,993,190.
• An estimated 120 school age children are anticipated to reside within the Development.
• Yearly property tax revenue will increase 350%, rising from $990,898 to $4,513,797.
• The Development will take 5 – 7 years to build out, slowly adding students to the school system.
• Major renovations to Countryside Elementary School are scheduled to be completed within the next several years.
• School enrollment projections for Countryside Elementary show decreasing enrollment over the next five years.
• City wide elementary school enrollments are projected to begin declining in 2021.
• Limited measurable impacts are foreseen to other city departments.

23
Economic Impact Analysis Prepared By
Landwise Advisors
August 31, 2018
phone: 857-228-0210 101 Walnut St. Watertown, MA 02472
Prepared For Northland Development, LLC

date August 31, 2018
to Northland Investment Corp
from Landwise Advisors
project name Northland Newton Development
subject Summary of Economic Impact Analysis
I. INTRODUCTION
This executive summary highlights the analysis performed by Landwise Advisors to measure the economic impacts of
the Northland Newton Development (“Development”), a new mixed used development proposed by Northland
Development Corporation (“Northland”). For the purposes of the memo, all impacts are measured at the City of
Newton (“City”) level. The 22.6-acre development site, located in Newton Upper Falls, lies at the northwestern corner
of Needham and Oak Streets. The plan proposes a total of over 1.5 million square feet of residential and commercial
uses and is anticipated to be completed by 2024. The Development will generate considerable construction
expenditures and new employment, both of which contribute to the City’s economy.
Landwise estimated the short-term (construction phase) and long-term (recurring) economic benefits using IMPLAN.
IMPLAN is nationally recognized model for determining economic impacts that accrue to subject site jurisdictions as a
result of capital investment and related job creation. The model is able to measure benefits that accrue to specific
geographies. The following report highlights the assumptions and methodology used to develop the IMPLAN model
and provides an overview of the projected impacts in City of the Newton from the Development.
II. METHODOLOGY & THE INPUTS
IMPLAN operates as an input-output model and each input indicates a change in the economy, such as a capital
project or employment expansion/contraction. The outputs, or the economic benefits, represent either one-time or
recurring impacts. The Northland Newton Development will generate both one-time benefits from construction and
ongoing benefits from new employment and these impacts are quantified in the subsequent paragraphs.
Landwise used Northland Investment Corporation development cost estimates as inputs to derive the one-time
impacts from construction. The costs were assigned to the applicable construction sectors in the IMPLAN model
following the development program provided by Northland.
DEVELOPMENT PROGRAM
• 1,510,297 Total gross square feet
o Commercial (office & retail): 430,297 gross square feet. This includes the rehabilitation
and selective demolition of portions of the 157 Oak Street office building.
o Residential: 1,080,000 gross square feet
o 1,800 structured parking spaces
page 24

The construction is expected to occur in three phases, each lasting approximately two years. Costs were allocated by
the phasing schedule to more accurately represent the benefits accruing over the construction period.
PHASING
• 157 Oak St Rehabilitation
o Begins mid-2019
o Complete early-2021
o Represents 10% of total development costs
• Sequence 1
o Begins mid-2020
o Complete mid-2022
o Represents 55% of total development costs
• Sequence 2
o Begins early-2022
o Complete early-2024
o Represents 35% of total development costs
The total development costs included in the IMPLAN model total $504 million (roughly 80% of the development
budget). Landwise differentiated between new construction and rehabilitation costs as well as soft cost and hard
costs. Land acquisition, project reserves, fees and interest were not included in the model, as these expenditures do
not generate direct economic benefits.
To determine the recurring benefits, Landwise estimated the amount and type or employment that would be
generated by each land use (retail, office, and residential). It is assumed that all employment is “net new” to the
City of Newton. Each estimated employment figure represents total employment, including full time, part time, and
temporary positions. The following lists the key assumptions that were used to derive the employment figures.
OFFICE EMPLOYMENT: 977 total employees
• 180,000 square feet
• 95% occupancy
• 175 square feet / employee
• Average Salary: $96,736.
• Assumes jobs will occur in the Information, Finance and Insurance, Professional, Scientific and
Technical Services, and Management of Companies and Enterprises NAICS Sectors.
RETAIL EMPLOYMENT: 494 total employees
• 185,200 square feet
• 90% occupancy
• 400 square feet/full-time equivalent (or 337 square feet/employee)
• The FTE figure was converted using IMPLAN’s FTE to Total Employment conversion ratios.
• Assume jobs will occur in the Retail Trade NAICS sector.
RESIDENTIAL EMPLOYMENT: 24 total employees
• Figure provided by Northland
The total employment from new office, retail and residential projects totals to 1,495 total employees.
page 25

III. THE IMPACTS
IMPLAN measures the economic benefits at three levels: Direct Employment (“1st Level”), Business to Business
Spending (“2nd Level”) and Personal Spending on Local Services (“3rd Level”).
Description of impact levels for the one-time impacts
• 1st Level : includes salaries and benefits of employees involved in the construction and total
economic output of those employees.
• 2nd level: includes construction related business-to business-purchases in the City of Newton and
related economic output and taxes paid.
• 3rd level: includes economic output form household spending on goods and services purchased in
the City of Newton.
SUMMARY OF ONE-TIME IMPACTS
Impacts from the Development are shown in 2018 dollars.
Salaries / Benefits Total One-Time Impact
1st Level
Direct Employment 3,310 jobs / $252M $486M
“Spin-Off” Impacts in the City of Newton
2nd Level
Business to Business Spending 334 jobs / $29M $63M
3rd Level
Personal Spending on Local
Services
723 jobs / $40M $97M
Total 2nd and 3rd Level
Impacts in City of Newton 1,057 jobs / $69M $160M
SUMMARY OF ONGOING (ANNUAL) IMPACTS
Impacts from the Development are all shown in 2018 dollars.
Salaries / Benefits Total Annual Impact
1st Level
Direct Employment 1,495 jobs / $152M $340M
“Spin-Off” Impacts in the City of Newton
2nd Level
Business to Business Spending 432 jobs / $33M $80M
3rd Level
Personal Spending on Local
Services
477 jobs / $26M $63M
Total 2nd and 3rd Level
Impacts in City of Newton 900 jobs / $59M $143M
page 26
IV. CONCLUSION
The economic impact analysis shows that the Development will generate substantial positive impacts in the City of
Newton including one-time construction impacts and related spin-off employment; as well as ongoing annual impacts
once the project is built out. The one-time impacts include $486 million of direct impact and $160 million of spin-
off impacts in the City of Newton. The on-going annual impacts include $340 million of direct impact and $143
million of spin-off benefits in the City. These positive economic impacts could be an important driver for the Newton
economy for the coming decade and beyond.
page 27