and mineral structure
TRANSCRIPT

@
.'"
RELA~IONSHrps BETWEEN MAS NMR
AND MINERAL STRUCTURE
By
BARBARA LUCY SHERRIFF. B.A .• B.Sc .• H.Sc.
A Th~sis. ,
Submitted to the school of Graduate Studies
In Partfal Fulfilment of the Requirements
for the Degree
Doctor of Phi losophy"
McMaster University
September 1988,
,

. I
MASNMR AND MINERAL STRUCTURE
'\
'.
(.... .
.'
~.~
~- .'.'
. '
..~..
. ,
.f
'. \
,..'
. --J'.1
!
DOCTOR OF PHILOSOPHY (1988) MCMASTER UNIVERSITY.
o (Geology) Hamilton. Onta~io.
TITLE: Relationships between MAS NMR and Mineral Structure
AUTHOR: Barbara Lucy Sherriff, B.A. (The Open University)
B.Sc. (Leicester University)
M.Sc. (Brock University)
SUPERVISOR:Professor H. D. Grundy
NUMBER OF PAGES: xv. 214 /
i i

ABSTRACT
29S '. 1 magic angle spinning nuclear magnetic
resonance (MAS nmr) has been used extensively to study the.
structure, properties. and reactions of sflicate minerals,
ceramics and glasses. Despite many attempts to relate
chemical shift with crystal structure the factors governing
29Si chemical shift are not weI I understood.
This study investigates the effect of local
)
structural environment of the silicate tetrahedron on 29Si
chemical shift. A simple relationship is found between the
\
atomic positions of the cations bonded to the terminal
oxygens of the tetrahedron and 29Si chemical shift. which
can be used to calculate chemical shift from atomic
positions. A plot of calculated against experimental
chemical shift has a correlation coefficient of 0.986 for
124 sets of date from all groups of sil icates.
29S ' h . I1 C emlca shifts calculated from diffraction
data, are used to interpret MAS nmr spectra of scapolite, a
partially disordered mineral system. Models are devised for
cation ordering throughout the sol id solution series. in
which the charge on the cavities are balanced locally by
the requisite number of AI04 tetrahedra.
29Si , 27 AI • 23 Na , 7Li and 9Se MAS nmr spectroscopy
is used to inveseigate the difference in atomic sites
iii
\.

between beryls with slightly different compositions. 9 Be
and 2951 MAS nmr results agree wfth the ,presence of. domains
In the Li-Cs beryis with the structure of low-alkal I
beryls. Lack of a tetrahedral peak in the 27Al spectra of
Li-Cs beryls eliminates the coupled sUbstitution of LI for
AT and A1 for Be. Peaks in 'the,23 Na spectra of LI-Cs beryls
from NaCI in solutiori In fluid Inclusions show the'
potential of nmr to study fluid Inclusions.
Models of theoretical structures based on a
symmetrical 5i04 -tetrahedron with AI'· or Si 1 i gands show
that chemical shift is linearly proportional to cation~
oxygen distance (r) a~d ~xponential ly proportional to~_
siT f con-oxygen-cat ion angle (0). The possible ranges of
chemical shift for each type of silicate are more extensive
than those of Lippmaa et ale (1980) •
.;
",.,~ .'.,
I'
fv

. ~
ACKNOWLEDGEMENTS
. . .I would like to thank' my' superyfsor Dr. H. D•
. Grundy For' instructing me fn the art of carrying out·
'scientfFic research and for his help with computing. Thanks
". .,
at so go to Dr. r. D. Brown, Dr. M. J. McG I i nchey, Dr A. D.:
Sain, Dr. F. C. Hawthorne, Or. J. R. Kramer, Dr. J. S.
Hartman and Dr. D. M. Shaw for helpful discussions. Dr D.
M. Shaw is especially thanked for constructive criticism
and readfng of the manuscript and Dr. J. S. Hartman for
....providing the
Fyfe.
MAS nmr probes from the design of~r. C.. A.
I'am grateful to Dr R. E.. Lenkinski. W. Klimstra.
Dr C. A. Fyfe, and Dr. S. Johnson at Guelph University and
B. Sayer of McMaster
instrumentation.
University for he 1p w.fth Iilmr
This project was supported by NsERC Funding and.
also by Hooker and Sherman scholarships From McMaster
University. The time on the nmr spectrometers at the South
Western Ontario Nmr Centre was paid For by Brock University
through Dr. J. S. Hartman.
F i na I Iy would like to thank all my Friends at.
McMaster UnIversity especially Kathy Teeter. ·Jil I Gleed and
'Dr. Marilyn Truscott and my children Barry and Jackie For
their friendship and support.
v

~.
CONTENTS,.,..' ....1
Pag~ 1::>-0'',-,,'
Abstract
Acknowledgements
f i f
v
Chapter 1.•
Introductfon to nuclear magneticresonance qf sflicate minerals
t 1•. 1 Introduction
1.2 Nuclear Magnetfc Resonance...,
Chapter 2
. ·29 '.'1.. 3 " 5 i· MAS nmr. " -- ...' , ~
~... ' ..:. ::~.~':-:~:.:~.': ....-": ~~:' . .".. ...
. .·:: ..~L •.~:.;·""re~·~ous:. work on the ·re.l at f ~nshi p~:~,:::;:. <~.·o.F::. .... 5 f MAS nmr chern fca 1 s h i ft . .' .."" .,:·w~~~· mf nera' st~uc;:ture
. "
Cor.~2~a~Jon b~tween atomic structureand .. , . 5 i MAS nmr chem fca I sh f ft
. 2. 1 Introduct f"on
2.2 Nmr and diffraction data
2.2.1 Disorder of cations in acrystallographic site
2.2.2 Difference In compositionor ordering between mineralsamples 24
2.2.3 Inaccurate structural data
2.2.4 Errors in nmr data
2.3 Calculations
2.3.1 The first term; magneticanisotropy
2.3.2 Second term; bond valence
2.3.3 Third term; Si-O-X angle.
2.3.4 Resultant equation
vi
26
27
32
34
38
44
46
Page
4.4.2 A1Limfnum-27 127
4.4.3 Sodfum-23 129
4~4.4 Beryllfum-9 '136: :
, .4.4.5 Lfthfum-7 140
4.5 Conclusfons " 143
Chapter 5 ModellIng theoretical silicate structuresand thoughts For the future 145
5. 1 Introduction 145
5.2 Sf04 tetrahedral model 146r
5.3 Results and discussion 149
5.4 Present state of chemical shiFtcalculations 153
) 5.5 Ideas For the future 153
.'
ReFerences
Appendix I
157
The theory of nuclear magnetic resonance 172
1.1 General theory of nmr spectroscopy 172
1.2 Pulse Fourier Transrorm 176
1.3 ChemIcal shift 178
1.4 High Reso I ut ion nmr of .§.o lids 180
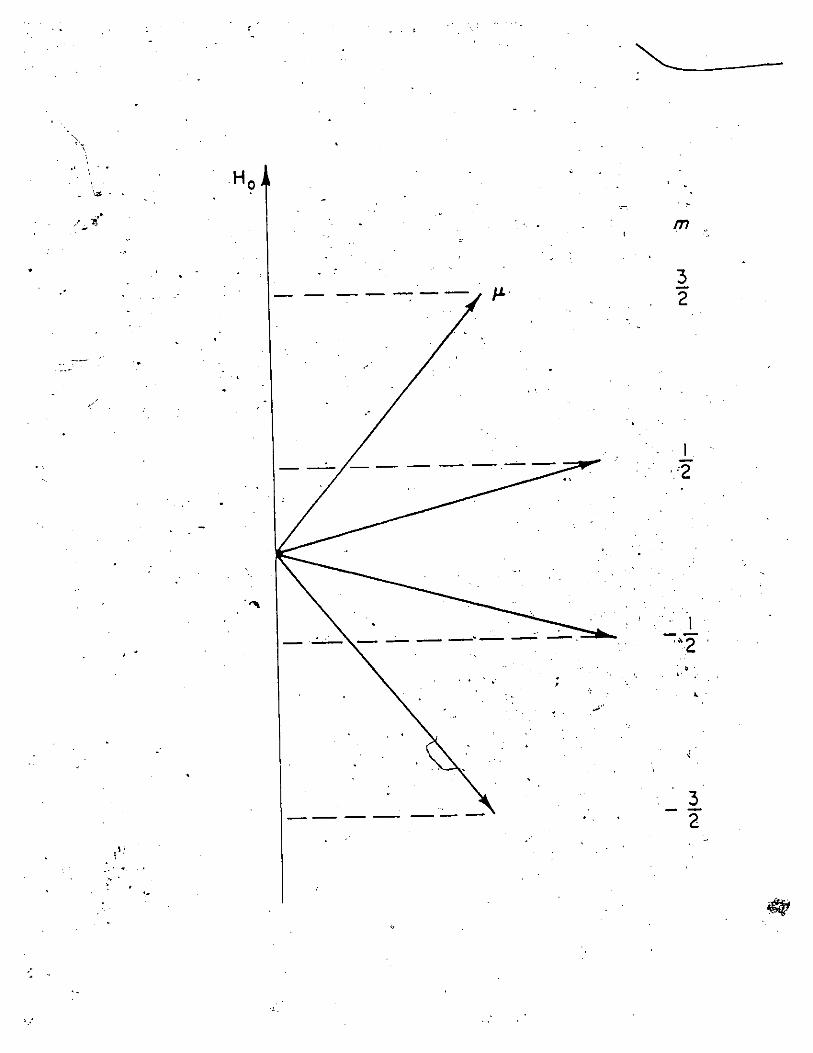
1.5 MAS nmr spectra or quadrupolar nuclei 184
1.6 Relaxatfon times
Appendix. II Mineral samples
Appendix III Dum.For
Appendix IV Len.for
Appendfx V Chfsi.For
vi f f
188
190
191
194
197

..-.
I
Appendix VI
~
Values of n For SiD? polymorphs summedat _1/2 A intervals ~o 10 A
Page
202
:-.' ..,:,':..
209
204
- .
Appendix VII Summations or-geometric terms ror Si02polymorphs averaged rrom 6 - 10 A 203, ',~" . ~
Append i x VI I I 295 f chemf cal -shrft or sf 1i catemJn~rals1 eXperfmental values, and valuescat cu I~t'ed \~rc:>m equatJ ops- .3, a~d 4.
. ,. . ,.Appendix IX Calculated chemical" shiFts From
theoretical models (angle a variedbetween'I25 and '180°)
Appendix X Calculated cnemieal shfFts rromtheoretical models (distaflce r variedbetween l~75 and 1.55 A) 210
of ','
-Appendix XI The relationship between the McConnellequation and equations 3 and 4 212
,...,
-,-(
..ix
~.

'., ..
FIGURESPage
1.1 Ranges of 2951 MAS nmr chemIcal shiFt Fors 111~~t.es" and Framework ,:atum:f nos' 1" cates
1.2-:· ~9S"~~'\'~~6~:~opiC ~hemfcal':;-~'h'f';':'~ plotted" against; 'the: 'mean~~'number oFs f 1fcor{ 'atoms 'for' ', (a ) For', 52 zeolf"tes' wi th"fauJas f.t Jc framework
(b>' for 26 Zeo 1fte-A Framewor,k" mater fa 1s .. '.. ' .~ "' .. ,: ,".j," '
1•3 ,2951 , chernf cal. sh f ft l versus' "':.:0',:, .. '(a)average Sf-O, bond:length, ,','(b rtota 1 cat f On-aXi9~~~:bbnd stre~th for theFo.u r oxygen' at'oms,,~~r~oundfng eac~ 5.1 ,.5 f \e
... -:z:" .. ", _~ . ,-.' " I
I .4 Re 1at ion be'tween' chernf ca 1 sh,f Ft and structura 1parameters
6
7
9
10
1.5
1.6
1.7
1 .8
2. 1
Bond direction related,shieldfng versus 5f-0bond distances For s 111 ca po:l Yfl]0rphs
Relationship between 29~t'c~emfcal shiFt andmean oxygen ~ characterof:s,f I'f ca po Iyrnorphsand zepl ites " ",", '
Experimental 2951 nmr ~hemfcal shfFt ofzeal ites and sit ica polymorphs plottedagainst calculated chemfcal shiFts.
Graph showing correlatfon between 295f MASS ~mrchemical shiFt and chemical, shfFt predicted on'the basis of the group electronegatfvfty sum.
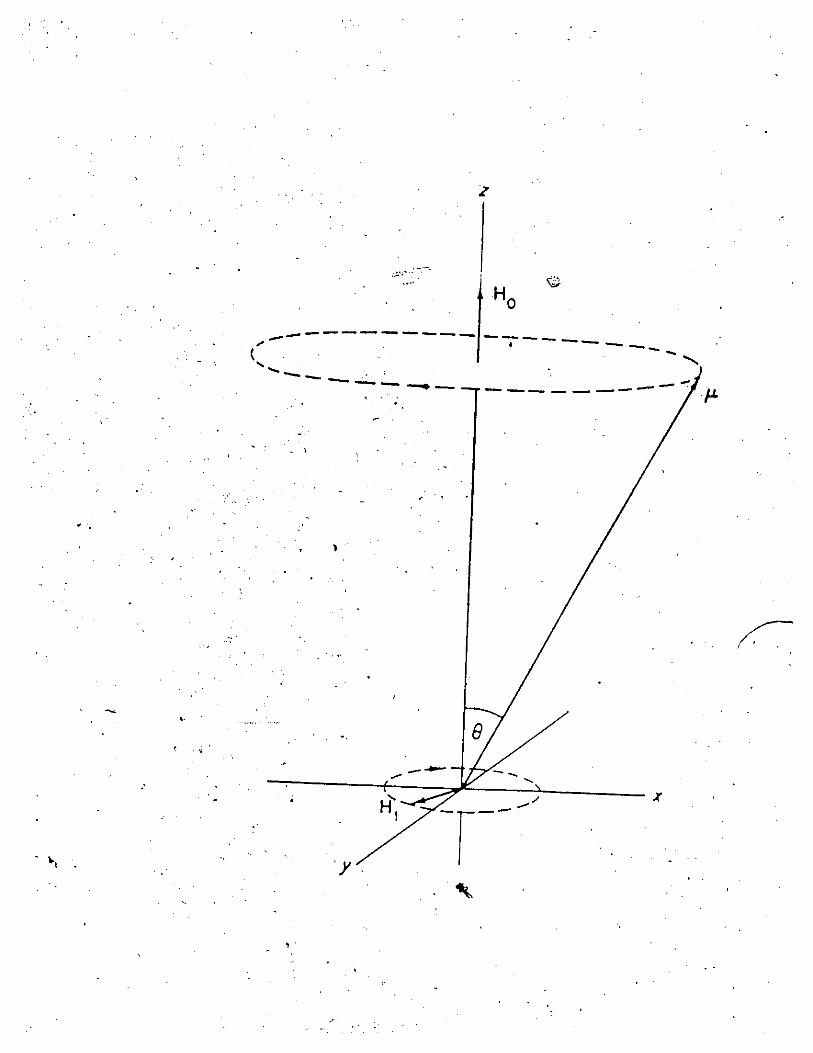
Diagram showing the deFinitions of angles eand a and the leng~hs rand R.
.' ~ '.. "
1 I
13
15
17
33
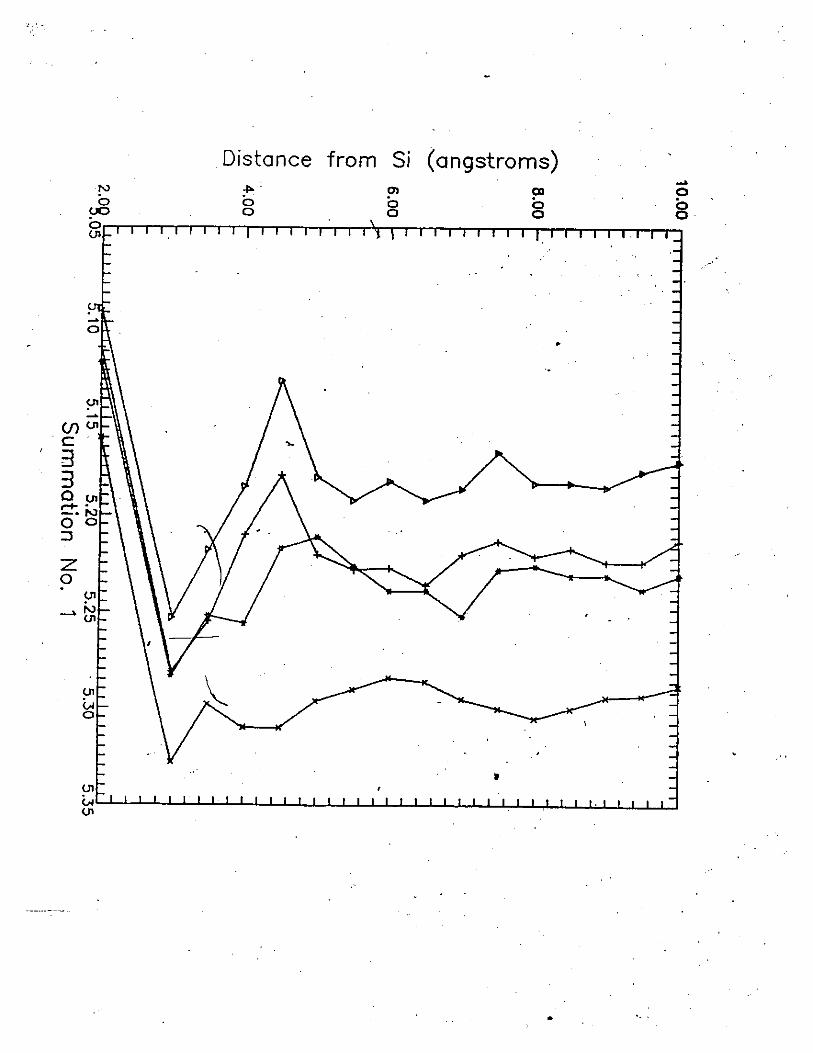
2.2 Summations of n, using equation (1), at 1/2 Aintervals From 51, plotted against distanceFrom 51 For the SfQ2 polymorphs
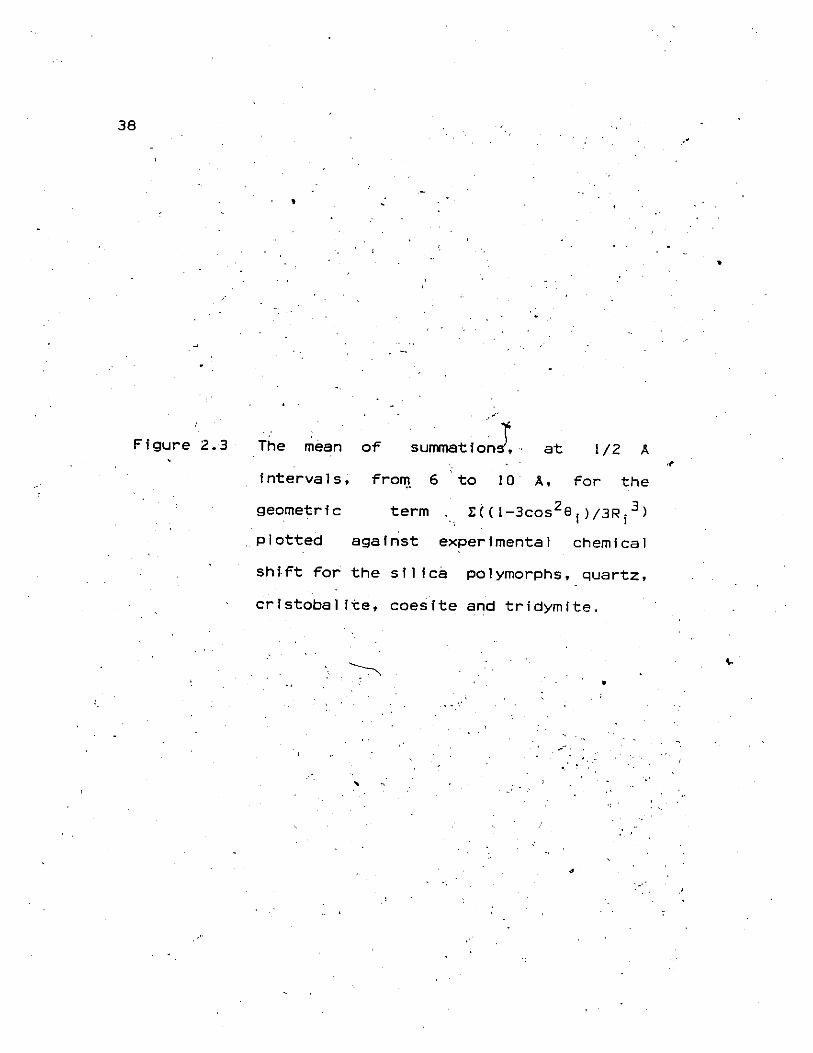
2.3 The ~n of summatlo~s, at 1/2 A Intervals,From 6 to2 10 A, F~r the geometric termt«1-3cos e )/3R ) plotted againstexperimental 0 Fbr the silica polymorphs.
2.4 Experimental 2951 MAS nmr chemical shiFtplotted agafnst chemical shift calculatedFrom equations 3 and 4.
36
38
47
nmr spectrum of white kyanfte
x
51

Page
.;." • .,,-:"" " '" n "
2.6 29Si HAS nmr spectrum of pfemontfte
2.7 29Si HAS nmr spectrum of wollastonfte
2.8 29Sf HAS nmr spectra of albfte/mfcroclfneperthftes
2.9 29Sf HAS nmr spectra of the plagioclase'feldspar series.
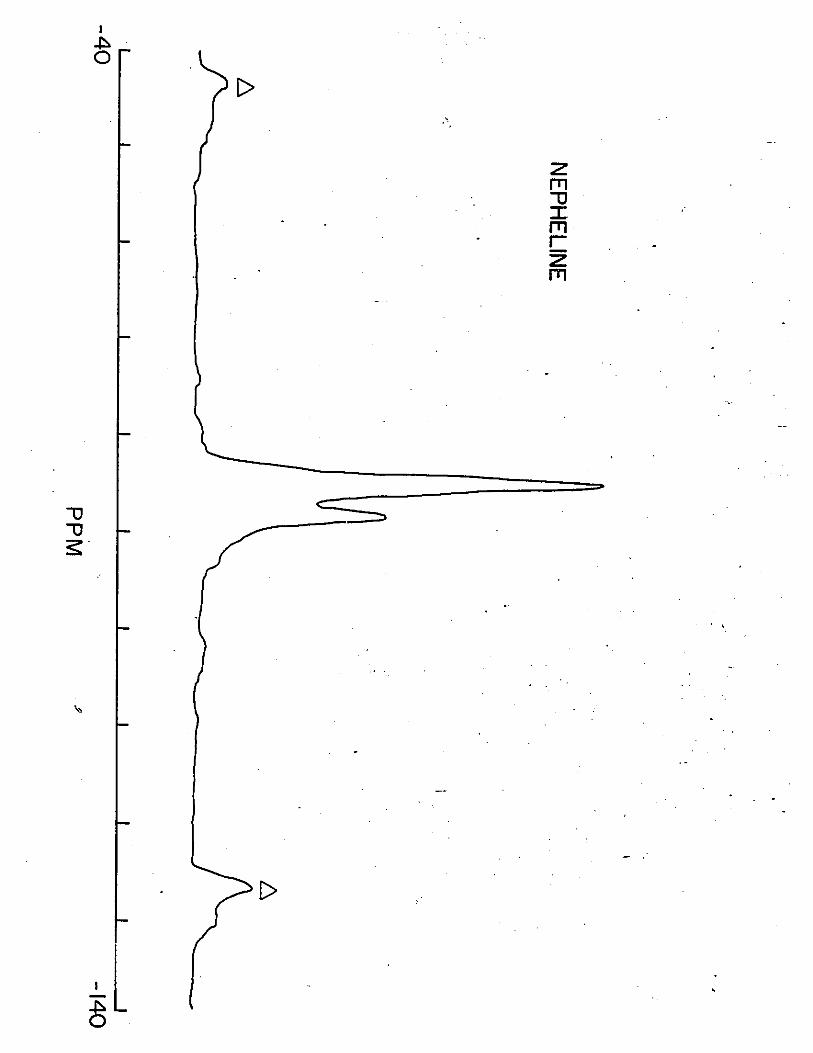
2.10 2951 HAS nmr spectrum of nephe line
3;1 The structure of ~capolfte viewedalong the c-axfs
3.2 The structure of scapolite viewedalong the a-axis
3.3 29Si ~ASnmr spectra of scapol ite samples
3.4 Peak Fitting to the 29Si HAS nmr spectrumof GL (34.1~ He)
3.5 27A1 HAS nmr spec~a of scapollte samples
3.6 A graph of 27A1 peak width plotted againstmelonite content
3. 7 ConF 1gurat fon of the Na-O po 1yhedror.
54
58
61
64
66
76
77
84
86
96
98
100
3.8 A plot of (Na.Ca)-O distances as a runction'of me i on f tecontent 101
"'::.
":3':~9" 23 Na HAS nmr spectra of scapo lite samples
\3. 1q 13C HAS nmr spectrum of scapo lite sample Q13
3. 11 Model of cation ordering In 371- Me scapollte
3.12 Hodel of cation ordering in 201- Me scapo 1 ite
3. 13 Model of Cqtfon orderlll1g in 751- He scapol ite.:.--, .........
103
107
109
I 12
114
4.1. Photographs of computer simulated models of"the structure of Lf-Cs beryl viewed along(a) the c-axis; (b) the a-axis. :)20
4.2 29 51 MAS nmr spectra" of (a) T-24 Li-Cs.beryl(b) S~EE-l~6 low alkal i beryl 124
xl