resources.bgs.ac.ukresources.bgs.ac.uk/sadcreports/kenya1989undpgroundwater.pdf · kenya and the...
TRANSCRIPT


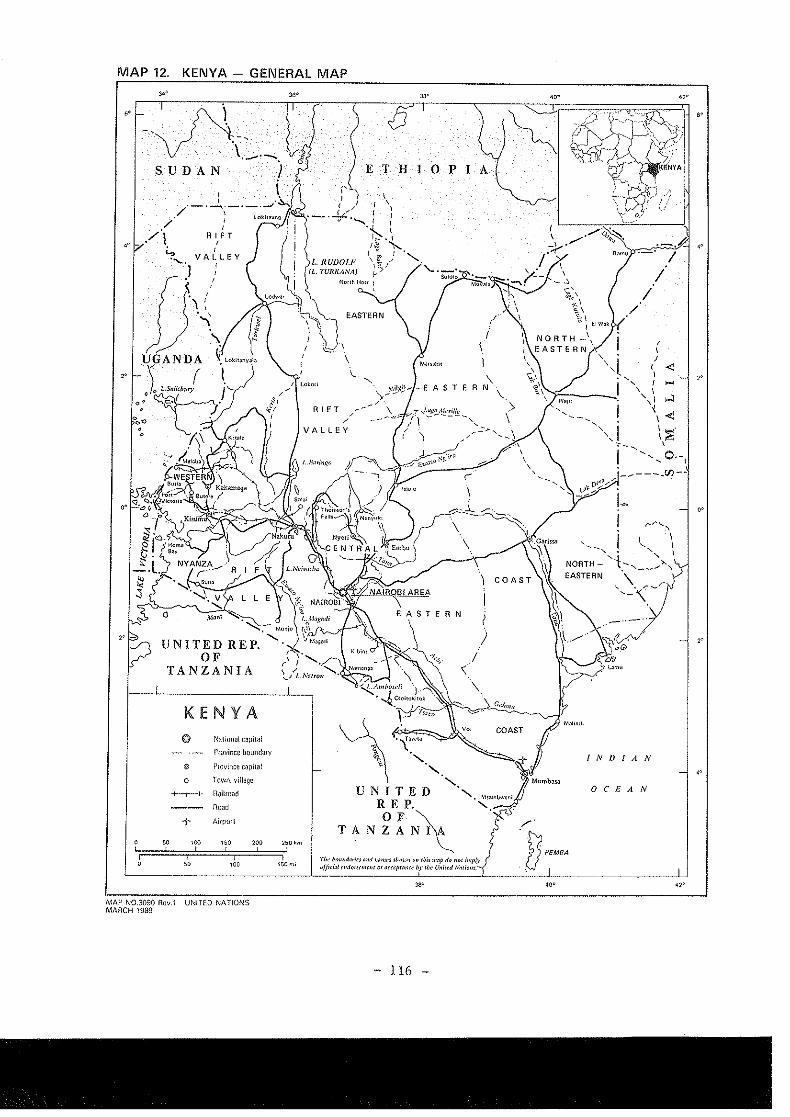
MAP 12. KENYA- GENERAL MAP
36° 38'
,.1_'_0-·. -;:::·:--. ·.'l. \-~.~-.---~. i-J--r--z-?T-----.;;~~=i;:==::;::::;::::::;;::;;:;::::;~
SUDAN j ETHIOPIA
I _,·~
,.
UNITED REP. OF
TANZANIA
"
KENYA ()
®
0
+-t-+
-r
oOO
"
Nation~! capital
Pwvince boundary
Province capital
Town. village
l'laiiroad
Road
Airport
WO
MAP N0.3090 Rev.1 UNITED NATIONS MAIICH 1989
!50 mo
f' ) \ ( / \
·-·..J.L I I " ........ I 1
·-;.__ l I_ , 1 I·~ '~......
1(;, I'-.._ LIWDOLF \§:./
TURKANA) 1-/
I
l.oko<i
A I FT / /
VALLEY
\, RN \_
> \
'
l
' -~ c' ~· . \ ~\ ~~I
0 I El l'lo~
NORTH-\ EASTERN
' ' ""',.,.\ ~\
,J-:::.,:.j,:.----~ '
I /
I /
INDIAN
'-. UNITED '- 0 C EA N
REP.
TAN~XN~ "'
,,. '''""'''" "'' ""'"' ''"'" "" '"''"''PM"";,,,,,,. , ·. ··t'(. PEMBA u{fici~/ <'ndommo1t OYOW'{IfM:C< by the United NMiO'If. u --'---
116
,.
,.
o•
•..
Area: 582,700 km2 Population: 19 million
KENYA
I. BACKGROUND
Kenya has 500 km of coastline on the Indian Ocean between Ethiopia and Tanzania; it also has access to Lake Victoria, Africa's largest lake. The country is crossed at its centre by the equator. The altitude increases from east to west. The western half of the country is over 1,000 m and the region north-west of Nairobi at 2,000 m above sea level. The highest point is Mt. Kenya (5,200 m).
Rainfall averages 250 mm in the arid regions and over 2.5 m in the mountains. The 700 mm isohyet marks the eastern l-imit of the wet region, which has an abundance of watercourses and springs. The eastern half of the country has a climate of the semi-arid or arid type, desert in places. The same is true to some extent of the north-west of the country.
In contrast, the south-west third of the country is well watered and has a pleasant climate and good-quality soils. The majority of the population is concentrated in this region, and the population growth rate is one of the highest in the world (3.5 to 4 %).
Surface water
The country's hydrographic network is dominated by the Rift Valley which bisects the plateaus region from north to south. The floor of the Rift Valley~s occupied by lakes in the centres of endorheic basins. West of the Rift Valley, the surface water flows towards Lake Victoria and into the Nile Basin: to the east it flows south-east to the Indian Ocean.
The country has five large systems of drainage basins, with many small lakes in the intervening areas.
The Athi drains most of the south-east of the country from the slopes of the Aberdare mountains and the eastern side of the Rift Valley and flows into the Indian Ocean. Some other watercourses reach the coast and others peter out before the coast.
The Tana drains the western slopes of the Aberdare, the southern slopes of Mt. Kenya and the Nyambeni mountains, flowing towards the Indian Ocean.
The waters of the Ewaso Ng'iro region come from the northern slopes of the Aberdare and Mt. Kenya and from the high plateaus and lower mountains in the north and north-east. With the exception of the Ewaso Ng'iro itself the flows, which are of the torrential type, occur immediately after rain.
These large basins are in turn subdivided into 52 main basins and sub-basins.
II. GEOLOGY
The whole of the centre and west of the country is part of the Precambrian crystalline basement: ''Archean 11 schists, quartzites and cipolins, conglomerates, schists, feldspathic sandstones, volcanic rocks and quartzites of the Middle and Upper Precambrian.
- 117 -

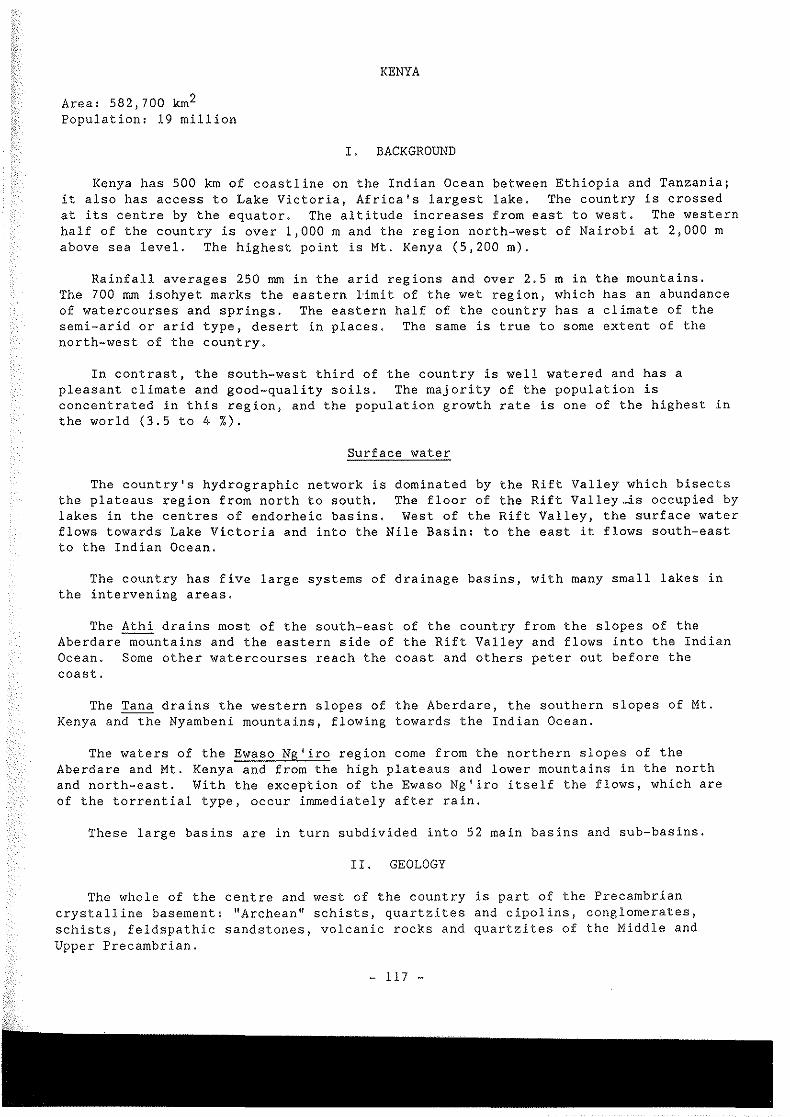
MAP 13. KENYA- AVERAGE YIELD OF TUBEWELLS
,.
,.
,.
3484.9x
SUDAN
UGANDA
UN !TED REP. OF
TANZANIA AVERAGE YIELD OF BOREHOLES
lPRECAMBRIAN) in liHlr per second for each
hydrographic subbasin
> 3! s
2 to 31-'s
1 w 2 l.s
0.8 w 1 lis
less than 0,8 I!S
Unsufficient data
50 100 150 200 750 ""'
ETHIOPIA
UNITED REP. OF
TANZANIA
f!•, 1"-''""!,,,,., ,..,,~ "·""'' ,, o,ffi,-!.>lo"/"'"'""'"'"'''a','''
118
«:
,.., < ~
0 (/)
I.'VIJ/A.r-..1
0 C H A N
Source: M~s\CI Pl~nning Oi,•i&on, Mirlistll' or W"l"' Developmonr, f~or>ub!ic or Kcnva. Gtormd Wawr m I<Mva. N8~rob'~ 1983
,,
,,

Karroo sandstone sediments of carboniferous-triassic age outcrop parallel to the coast in a strip 80 km ~ride.
Jurassic formations outcrop in the coastal zones 1 in north-eastern Mandera and at Wajer, near the frontier ~rith Somalia.
Cretaceous (limestones) and Tertiary (argillaceous limestones) formations of marine origin also cover vast expanses in the east. The Great Rift Valley, which was formed in the Tertiary period, is covered with continental sediments.
Volcanic eruptions in rhyolitic basaltic lavas. country north and east of
the Miocene period produced effusions of phonolitic and These volcanic formations cover more than a quarter of the
Nairobi.
III. GROUND WATER
State of knowledge
The main studies which have been made are listed in the reference section. The reports provide excellent information about some of the areas studied. The report prepared by the World Health Organization in 1973 gives a good summary of the state of knowledge at the time of its drafting. However, there are detailed studies for on a small part of the country. Moreover, in most cases these studies consist only of reconnaissance work; the quantitative aspects of ground-water flows are only rarely taken into account; the recharge zones are not delimited, and the effect of pumping on the artesian aquifers is not specified. The reasons for this are clear: priority had to be given to the extraction of ground water to meet the country's needs. Almost all the available funds were spent on drilling operations, and lJ,.ttle money or time was given to the study of the effects of the operation of the installations.
The importance of ground water in Kenya is evident 'l.>lhen there are no other available water resources. Kenya has some 4 1 500 water boreholes drilled in the past 50 years.
Between 1923 et 1934, about 190 boreholes equipped with casing strings and strainers were drilled, and a further 133 during the Second World War. Since 1970 an average of 100 boreholes have been installed every year.
Water-drilling operations are monitored by the Ministry of Water Development '''''dM:r.>n). The MWD collects data on boreholes drilled by private individuals and
companies by means of the mandatory prior authorization required by law.
The MWD is itself responsible for most of the water-drilling operations in Kenya. stock of equipment included in 1983: 6 rotary rigs, 7 cable rigs, 1 combined
rcussion rig and 3 light rigs. It also subcontracts to companies which of about 15 drilling rigs.
on the oldest boreholes are incomplete and the location of several old is not known. However, substantial and reliable data are available for recent
>Y~ars, especially with respect to the results of multiple test pumping and the cF'<co,rr,e~nonrling recovery curves.
- 119 -

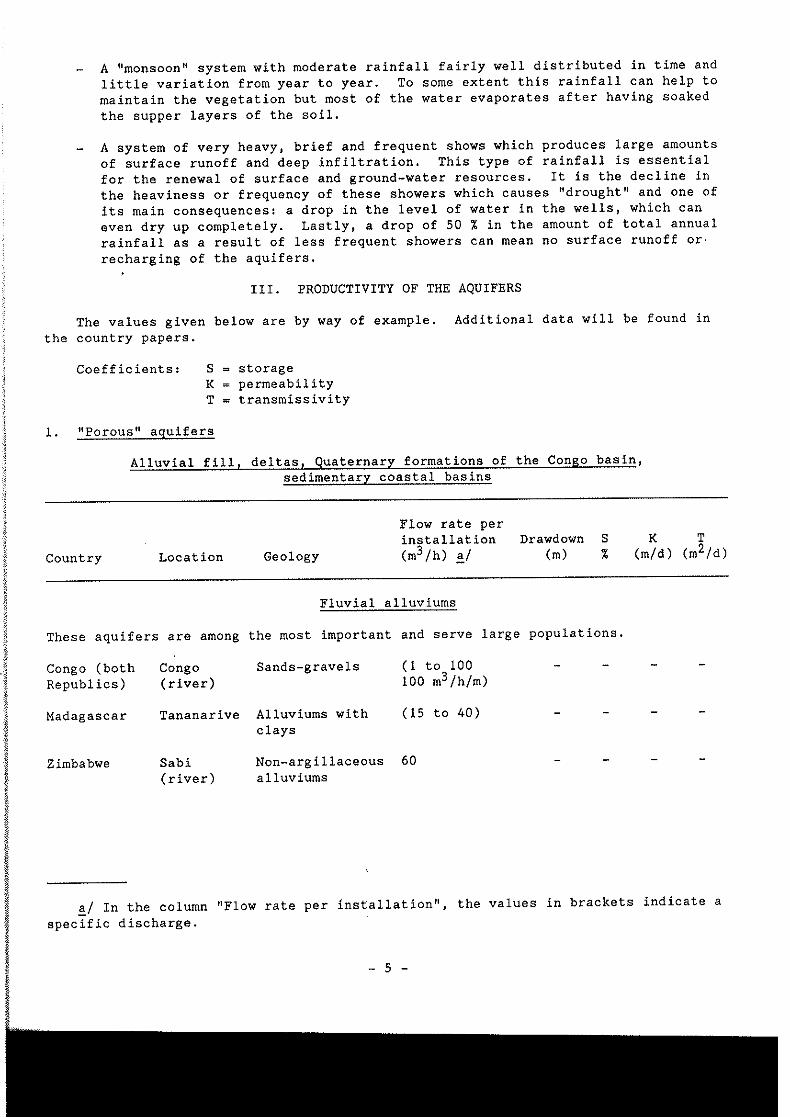
Aquifers
Kenya has unconfined, artesian and semi-artesian aquifers.
The table below presents some data on the aquifers. These data were obtained by computer processing of the inventory of boreholes. The following remarks may be made in this connection:
Depth of the installations, These are boreholes traversing volcanic rocks down to very great depths: 125 m as against 92 m for the crystalline rocks of the Precambrian basement and 78 m for sedimentary rocks;
Water level (after stabilization in the borehole). This is an important datum, for the depth of the water below ground level, at rest and under pumping, has a direct effect on the cost of pumping. A map has been produced which indicates the water depth by basin. It shows that the greatest depths are found in the north of the country and in the Rift Valley where they exceed 55 m. The shallowest holes (under 20 m) are located in the west and south-east and in the Upper Tana basin;
Artesian head. The average value for all the boreholes in the sedimentary rocks is only 6 m; for 25 % of the installations it is only 1 m. In the crystalline basement rocks and volcanic rocks it is 20 and 40 m respectively;
Abandoned boreholes. Some boreholes 1.;ere abandoned on completion either thought insufficient (or nil) or because the water the uses for which it was intended. Other holes were
because the yield proved unsuitable abandoned shortly declined. On the
was for after commissioning, mainly because the yH~.lds steadily basis of the available data the proportion of boreholes
abandoned is estimated at:
9 % for volcanic rocks 24 % for the crystalline basement 22 % for sedimentary rocks
Yield of boreholes (See table below)
The average yield for the whole country is 6 m3 /h, with large differences from basin to basin. The basins with the highest yields are in the regions of Lake Victoria and Lake Naivasha and in the far south-east of the country.
The basins with the lowest yields are in the vicinity of Lake Turkana in the north-east and around the middle and lower courses of the Tana.
The type of water-bearing geological formation has an important influence on the yield, with on average:
4.4 m0 /h for the crystalline basement 7.6 m3/h for volcanic rocks 7.7 m3/h for sedimentary rocks
- 120 -

BASIC DATA ON BOREHOLES - AVERAGE VALUES
Drainage basin Average Water Initial identification Main geological Total number depth level output number formation of boreholes (m) (m) (m3/h)
1 A Crist. basement 12 63 14 7. 1 B " 82 70 18 3.1 c Volcanic rocks 88 71 15 3. 5 D Crist. basement 11 86 8 6.5 E " 9 95 17 7. 1 F Volcanic rocks 16 133 23 3.5 G " 82 123 38 9.5 H " 63 96 18 11. 7 J " 26 160 46 4.4 K " 22 111 23 6.8 L " 24 158 71 5.4
2 A None 5 41 8 0.5 B Basement 31 44 16 3. 7 c None 17 80 28 4.2 D Volcanic rocks 13 130 53 4.6 E " 226 151 67 7.9 F " 163 149 85 7. '+ G " 234 113 62 11.8 H " 62 182 .110 5. 1 K " 20 163 80 5.4
3 A Volcanic rocks 443 127 50 6. 1 B " 932 13 2 47 8. 2 c Basement 40 145 47 9.4 D " 22 109 26 6.2 E " 101 103 24 6.2 F " 239 107 36 5.4 G " 12 119 59 4. 7 H Sedimentary rocks 24 93 41 4.6 J Volcanic rocks 5 55 28 17.0 K Sedimentary rocks 21 81 21 13.0 L " 121 51 19 4. 1 M " 126 99 24 12.8 N Volcanic rocks 22 106 ,,z 9.4
- 121 -

Drainage basin identification number
4
5
A B c D
E F G H J K
A
B c D
E F GH J
Main geological formation
Volcanic rocks
" "
Basement
" Volcanic rocks Basement
" Sedimentary rocks Basement
Volcanic rocks
" "
None Basement Sedimentary rocks Basement
"
Total number of boreholes
30 60 99 13 23
2 22 40 21 18
93 107
41 89
162 54 25 16
Average depth
(m)
122 90
120 109 105
21 115
91 147
71
121 106 149 104
96 128 114
84
Water level
(m)
53 14 42 26 50 11 62 31
118 36
50 40 46 36 58
104 60 17
Initial output (m3/h)
5.8 6.1 6.5 3.3 3.0 2.0 2.0 3.4 3.0 8.4
4. 7 6.2 5.0 4. 7 3.1 5.5 1.4 2.5
The specific yield can be as high as 18 m3/h.m. The highest values are obtained in the central and eastern parts of the country, while the lowest values are very irregularly distributed (no data are in fact available for many of the basins; average values have not therefore been given).
The boreholes in the basement formations have the lo>~est specific discharges and those in the sediments have the highest.
Quality of the ground water
Systematic water analyses are made, including quantitative analysis of the main ions, for most of the boreholes currently being drilled, but this was not always the case in the past. The computerized inventory of boreholes distinguishes three categories: good, poor and unfit for drinking.
In the eastern half of the country, one borehole in seven yields undrinkable water, while in the western half the proportion is only 1 in 170. This difference is due to the rainfall, where there is little rainfall, the recharge and flow of ground water are also low, and this cause increased salinity.
The small scale map opposite sho>TS the facies and mineral content of the water. In the areas with high rainfall, i.e. in the centre of the country and the coastal zone, the water is mainly bicarbonate with a dry residue below 1,500 mg/1; this water can be classified as ''good 11 • In the areas with little rainfall in the north and east, chlorides predominate and the salinity is much higher. This part of the country contains most of the water points classified as 1'unfit''.
- 122 -

The presence of ground water with an exceptionally high fluoride content has long been knows in Kenya. It is clear that this phenomenon is directly related to volcanic activity, but no detailed study has yet been made, although this is a particularly important factor owing to its effects on the health of the people concerned.
IV. EXPLOITATION OF THE GROUND WATER
About a quarter of the boreholes are located in the Nairobi area and account for a third of the total volume of water pumped for the whole country.
The amounts of water drawnoff are not usually measured. The only datum is the test yield established on the completion of the installation, and this is the figure which appears in the inventory. If a borehole utilization coefficient of 15 % is applied, the average drawoff from the boreholes can be estimated as 15 % of the initial test yield. It has been verified that this rate is close to the actual rate in Kenya 1 as in other countries, for various water uses. The table which follm'ls presents, on this basis, an evaluation of the current rate of extraction of ground water.
Drainage basin
.\ 2 3 4 5
Number of boreholes
403 672
2,015 296 5.\2
3,898
Average initial yield (m3/h)
6.4 8.4 7.4 5. 3 4.5
Total initial yield (m3/h)
2,579 5,645
.\4, 911 1,569 2,304
27,008
* Estimated drawoff calculated from the total initial utilization factor of 15 % and converted into millions of
yield cubic
Estimated drawoff (millions of m3/year)*
3.4 7. 4
19.7 2.1 3.0
35.6
multiplied by a metres per year.
The following example will illustrate the exploitable potential. It may reasonably be estimated that 5 to 10 % of the rainfall goes to recharge ground water in all the regions of the world; for greater safety, a rate of 1 % is used for Kenya.
In the table below the potential calculated in this way is compared with the draw off, which could be increased by a factor of 88 over the 36 million cubic metres a year currently drawn off from a total potential stock of 3 billion m3 a year.
- 123 -

Annual Annual drm•off Non-present No. of drainage rainfall (millions m3) potential basin (mill ions m3) Potential Present quotient
1 59,000 590 3.4 174 2 64,800 648 7.4 86 3 41,800 418 19. 7 21 4 71,800 718 2. 1 342 5 74' 100 741 3.0 247
Kenya 311,500 3,115 35.6 88
A potential drawoff of 3 billion m3 a year does not in fact represent a limit but merely expresses an average rate of recharge of the aquifers equal to 1 % of the rainfall. This very general and simplified estimate does no·t take into account the effects of the exhaustion of certain overexploited aquifers, the interaction between closely spaced pumping points, or chemically unacceptable water quality - factors which must be considered even in an outline programme for the development of ground-water aquifers.
V. CONCLUSION
The potential values given above must be treated with great caution. Defective installation, for examplet may lead to overexploitation or harmful Interaction between boreholes, and thus to increased water costs. If the ground water is to be exploited efficiently and economically, with high-yield boreholes, the holes must be drilled with great care, using the necessary techniques such as geophysical prospecting and test pumping and interpretation of the results.
The installation of linings and strainers in the boreholes must receive careful attention in both planning and execution.
The limitations of estimates based on a rainfall infiltration rate of 1 % must also be borne in mind; in many basins some of the ground water drains towards the surface and emerges as springs and resurgences in the beds of watercourses. This water cannot therefore be counted as new ground-water resources to be developed by borehole. In contrast, in the most arid zones the aquifers are recharged in very few places, mainly where the sudden and brief torrential flows converge following rainfall. The best conditions for the exploitation of ground water are found in the vicinity of small towns and villages in areas of medium altitude where the ground water can be exploited for domestic purposes and also to provide additional irrigation for crops which need it.
The most recent studies and prospecting work, particularly in western Kenya, have demonstrated that ground water is accessible close to the surface over vast areas; this must be taken into account for the implementation of large village water-supply progranunes on an economic basis and with the appropriate technology 1 i.e. with ~;ells drilled or dug to a maximum depth of 20 m and equipped with hand-operated pumps. It
mays thus be expected that in the future greater use will be made of shallow-lying ground-water resources to supply rural dwellers.
- 124 -

VI. REFERENCES
Baker, B.H., Geology of the Eastern Rift system of Africa, 1972.
Bhatt, N.V., Tectonic Evolution of Ground-Water Reservoirs of Kenya, 1975.
Bristow and Temperley, Geology and Ground-Water Conditions of Central Laikipia, Kenya,
1964.
Chilton, J., Nairobi Conservation Area) Annual Survey, 1970.
Gevaerts, E.A.L., Hydrogeology of the Nairobi Area, 1964.
Hove and Ongweny, An Outline of Kenya's Ground-Water Quality, GSO, 1974.
McCall, G.T.H., Geology and Ground-Water Conditions in the Nakuru Area, 1957.
McCann, D.L., Hydrogeological Investigation of the Rift Valley catchments, 1974.
Mesny, M., Irrigation from Ground Water, 1977.
Ministry of Water Development, National Master Plan, Stage I, Vol. I, 1974.
Ongweny and Dunne, A Preliminary Account of Fluorides in relation to The Development of Kenya's Ground-Water Resources, 1974.
Pearson and Swarzenski, Evidence for the Origin of Arid Region Ground W&ter, 1974.
Swarzenski and Mundorff, Geohydrology of the North Eastern Province, Kenya, WSP, 1977.
Swarzenski and Wanyeki, Ground-Water Exploration in North Eastern Kenya, USGS, 1976.
WHO, Sectorial Study and National Programming for Community and Rural Water Supply, Report No. 7, Ground-Water Resources, 1973.
- 125 -